Introduction
The excellent night vision of many mammals results from the ability of rods to respond to single photons and to communicate effectively that event to postsynaptic neurons, the rod bipolars (RBPs). However, RBPs receive inputs from a large number of rods. Convergence estimates vary, with 20 rods in mouse and cat (Bloomfield & Dacheux, Reference Bloomfield and Dacheux2001), 20–60 rods in primate (depending on eccentricity) (Grunert et al., Reference Grunert, Martin and Wassle1994), and 100 rods in rabbit (Bloomfield & Dacheux, Reference Bloomfield and Dacheux2001; Li et al., Reference Li, Keung and Massey2004; Pan & Massey, Reference Pan and Massey2007). The RBPs’ detection of a small-amplitude single-photon event (~1 mV) (Baylor et al., Reference Baylor, Nunn and Schnapf1984; Schneeweis & Schnapf, Reference Schneeweis and Schnapf1995) in one rod is dependent on the suppression of noise in the other rods (Baylor et al., Reference Baylor, Nunn and Schnapf1984). A threshold-type nonlinearity at each rod to RBP synapse (van Rossum & Smith, Reference van Rossum and Smith1998; Field & Rieke, Reference Field and Rieke2002; Berntson et al., Reference Berntson, Smith and Taylor2004; Robson et al., Reference Robson, Maeda, Saszik and Frishman2004; Taylor & Smith, Reference Taylor and Smith2004) helps eliminate noise from the rod outer segment transduction cascade (Rieke & Baylor, Reference Rieke and Baylor1996) and vesicular release (Rao et al., Reference Rao, Buchsbaum and Sterling1994; van Rossum & Smith, Reference van Rossum and Smith1998). Often, though, there is a substantial overlap between the rods’ distributions of the noise and single-photon response (SPR) amplitudes (Field & Rieke, Reference Field and Rieke2002; Hornstein et al., Reference Hornstein, Verweij, Li and Schnapf2005). Transmission of false positives or elimination of true photon responses depends on the placement of the midpoint of the nonlinearity (i.e., the threshold) relative to the SPR distribution (Field & Rieke, Reference Field and Rieke2002; Berntson et al., Reference Berntson, Smith and Taylor2004; Clark & van Rossum, Reference Clark and van Rossum2006), and the steepness of the nonlinearity determines the nature of the synaptic response: either all or none (step function) or continuous (sigmoidal) (Wilson, Reference Wilson2002; Clark & van Rossum, Reference Clark and van Rossum2006). A very steep nonlinearity predicts that regardless of the source of the threshold crossing, whether continuous noise events in rods or rhodopsin isomerizations, noise events in RBPs should be of similar size. To better understand the synaptic mechanism, we examined the nature of this nonlinearity using recordings from rabbit RBPs. The tremendous convergence of ~100 rod synapses onto each RBP provides ~5 times as many noise sources as other mammals previously studied. Our results demonstrate that the form of the nonlinearity is continuous rather than all or none. RBPs exhibited noise currents with randomly distributed amplitudes that could be attributed to a sigmoidal input–output relationship and the large convergence of noisy inputs.
Materials and methods
Preparation of retinas
All handling of rabbits and surgical procedures were conducted with the approval of the Institutional Animal Care and Use Committee. Retinas were isolated from New Zealand white rabbits (Charles River Laboratories, Wilmington, MA) (1.2–2.5 kg) of either sex that were anesthetized with Ketamine (60 mg/kg), Xylazine (6 mg/kg), and Acepromazine (1 mg/kg) and sacrificed via intravenous injection of sodium pentobarbital (26%) before removing the eyes. Rabbits were dark-adapted for 2–5 h, and surgery and tissue preparation were performed under dim red light (660 nm). The inferior portion of the eyecup was cut into strips and attached to filter paper, vitreal side down.
Retinas were stored at 10°C for later recording in a solution of (in millimolar) 115 NaCl, 3.1 KCl, 1.24 MgCl2, 2 CaCl2, 6 glucose, 2 succinate, 1 malate, 1 lactate, 10 HEPES, 12 NaHCO3, and 1 pyruvate, with pH adjusted to 7.4 with NaOH. All chemicals and pharmacological agents were obtained from Sigma-Aldrich (St. Louis, MO) unless otherwise noted. The superfusate during recordings was Ames solution equilibrated with 95% O2/5% CO2 and heated to 35–37°C. Cells and retinas were recorded using 775 or 940 nm videomicroscopy. For rod suction recordings, the retinas were chopped into small pieces with a razor blade and transferred to the recording chamber using 860-nm illumination. RBPs were recorded from vertical slices, 150–200 μm thick. The maximum bleaching from exposures during preparation and substage illumination was estimated to be much less than 1000 Rh*, which is approximately the total number of Rh* delivered during a recording. This small bleach would have not appreciably raised the concentration of dark light effectors (Fain et al., Reference Fain, Matthews and Cornwall1996). Lack of bleach is also supported by the degree of the nonlinearity of the RBP responses (Fig. 3B), which decreases when retinas are exposed to background lights (Sampath & Rieke, Reference Sampath and Rieke2004).
Electrophysiology
Electrodes were pulled from thick-walled glass. For suction recordings, they were fire polished to a resistance of 2.5 MΩ and were filled with Ames media buffered with 10 mM HEPES and 10 mM added NaCl (pH 7.4) (Field & Rieke, Reference Field and Rieke2002). Rods were drawn up into the pipette, increasing the resistance to 5–10 MΩ. RBPs were recorded using perforated patch and pipettes filled with solution that consisted of (millimolar) 120 potassium gluconate, 10 NaCl, 10 HEPES, 10 EGTA, 7 MgCl2, 5 K+ATP, 0.5 Na+GTP, and 12–250 μg/ml Amphotericin (solubilized form), pH = 7.2, adjusted with KOH. Lucifer yellow (0.5 mg/ml) or 0.1 mM Alexa-568 (Molecular Probes, Eugene, OR) was included for epifluorescent confirmation of morphology.
Currents were amplified and low-pass filtered at 1 kHz by Multiclamp 700B patch-clamp amplifiers (Axon Instruments, Foster City, CA) and sampled at 10 kHz using a PCI-MIO16XE-10 data acquisition board from National Instruments (Austin, TX). Custom software was used for data acquisition, and analysis was performed with Matlab (The Mathworks, Natick, MA). Records were digitally low-pass filtered for presentation and analysis.
Data analysis
Much of our data analysis relied on the assumed Poisson nature of the stimulus and subsequent Poisson variability of rod and RBP responses. For currents driven by Poisson events, the ratio of the ensemble current variance to the mean yields the event amplitude, a, and the ratio of the square of the mean to the variance yields the average number of events per trial, m:


These relations derive from Campbell’s theorem (Campbell, Reference Campbell1909) and have been widely used in the analysis of Poisson processes (Dodge et al., Reference Dodge, Knight and Toyoda1968; Baylor et al., Reference Baylor, Lamb and Yau1979a; Lane, Reference Lane1984; Schneeweis & Schnapf, Reference Schneeweis and Schnapf2000; Field & Rieke, Reference Field and Rieke2002).
Light stimuli
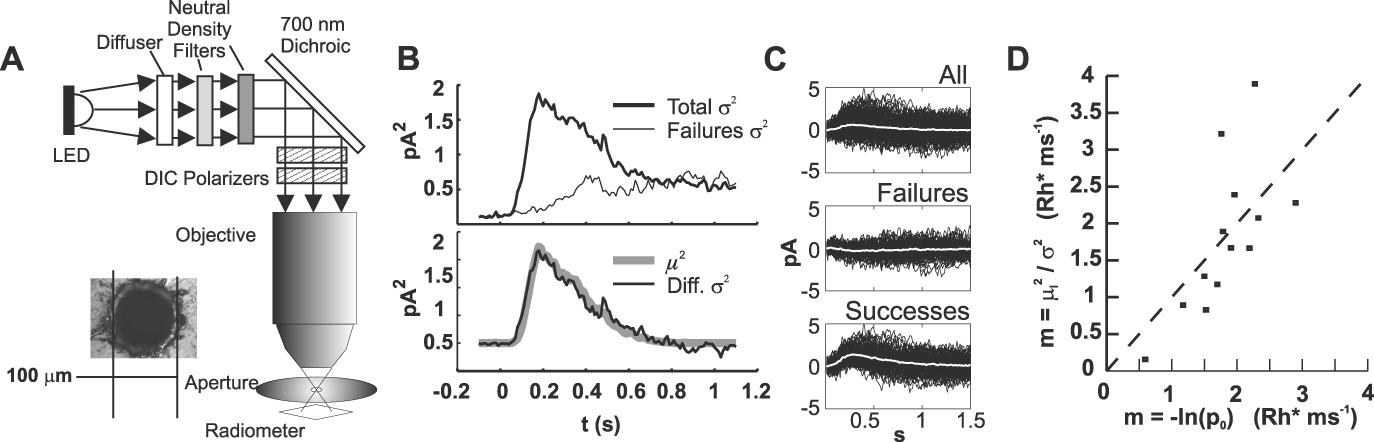
Uniform light stimuli were delivered via the microscope objective from a diffused light emitting diode (505 nm peak, 15 nm at half width). Maximum output was set at 6.5 × 10⁴ photons/μm2/s, measured at the focal plane of the slice using an IL-1700 radiometer (International Light, Newburyport, MA) and an aperture of 100 μm (Lenox Laser, Glen Arm, MD) (see Fig. 1A, inset). The measured flux likely underestimates the true flux by a factor of 3 or more based on the following stimulus calibrations that used rod suction electrode recordings. First, the mean rate (m) of absorptions per flash was computed from eqn. (2), where  was obtained from the difference of the total variance and the variance of failures (Fig. 1B) (Field & Rieke, Reference Field and Rieke2002). Second, from the Poisson distribution, the probability of no quantal absorptions (failures in Fig. 1C) is p 0 = e−m, where m is the mean number of photons absorbed per trial. Thus, m = −ln(p 0) (Baylor et al., Reference Baylor, Lamb and Yau1979a). For both methods, the slope of the best-fit line through the origin for m versus flash intensity estimated the mean number of Rh* per flash. These methods produced the
 and m = −ln(p 0) calibrations, respectively, which are compared in Fig. 1D. Proximity to the dashed line with unit slope indicates agreement between the two methods for individual cells. The mean of both methods was 1.7 Rh*/ms, and the dispersion of measured values probably represents different outer segment lengths due to the tissue chopping procedure (Nakatani et al., Reference Nakatani, Tamura and Yau1991).
Calibration of light stimuli by rod suction recordings. (A) Schematic of the optical path. Between the objective and the aperture is a water droplet. The distance from the aperture to the radiometer is ~5 mm. We believe this causes an error in quantitating photon flux due to improper focusing. Inset: a micrograph of the 100 μ aperture used to limit area for flux calculation. (B) Variance subtraction for determining μ 2/σ 2. The top panel shows the total variance and the variance of failures. Failures were chosen according to correlation of each trace with the mean. The bottom panel shows the overlay of the subtracted variance and the square of the mean. The ratio of the traces is 1, indicating that the flash delivered, on average, 1 Rh*. (C) Successes and failures chosen by correlation with the mean. Top panel shows all traces and the mean (white). Middle: correlation <0.51 chooses failures. Bottom: correlation >0.51 chooses successes. (D) Comparison of calibration methods. Each method gave 1.7 Rh*/ms.

The effective collecting area was calculated by dividing the calibrated intensity by the flux (0.65 photons/μm2/ms), yielding a rod collecting area of 2.6 μm2. This value is higher than expected based on collecting area estimates derived from dimensions of the rod outer segment (Nakatani et al., Reference Nakatani, Tamura and Yau1991). More direct comparisons based on our light path, which produced polarized light, were as follows. The overlap integral of the LED emission spectrum and the rhodopsin absorption spectrum (Lamb, Reference Lamb1995) was 0.87. The length and diameter of the rabbit rod outer segment are l = 19 μm and d = 1.5 μm, respectively (Nakatani et al., Reference Nakatani, Tamura and Yau1991). We used (Baylor et al., Reference Baylor, Lamb and Yau1979b),

where Q isom = 0.67 and α = 0.016/μm and found that the collecting area (A C) of rabbit rods was 0.72 μm2. Therefore, we conclude that the photon flux measured according to Fig. 1A must be systematically lower than the actual value because of improper focusing onto the radiometer. This error may be due to refraction of an air–water interface and the distance from the aperture to the detector. Regardless of the disagreement between calibration and theory, the rod suction recordings ensure that our estimate of the stimulus strength is accurate.
Results
Characterization of rod responses and noise
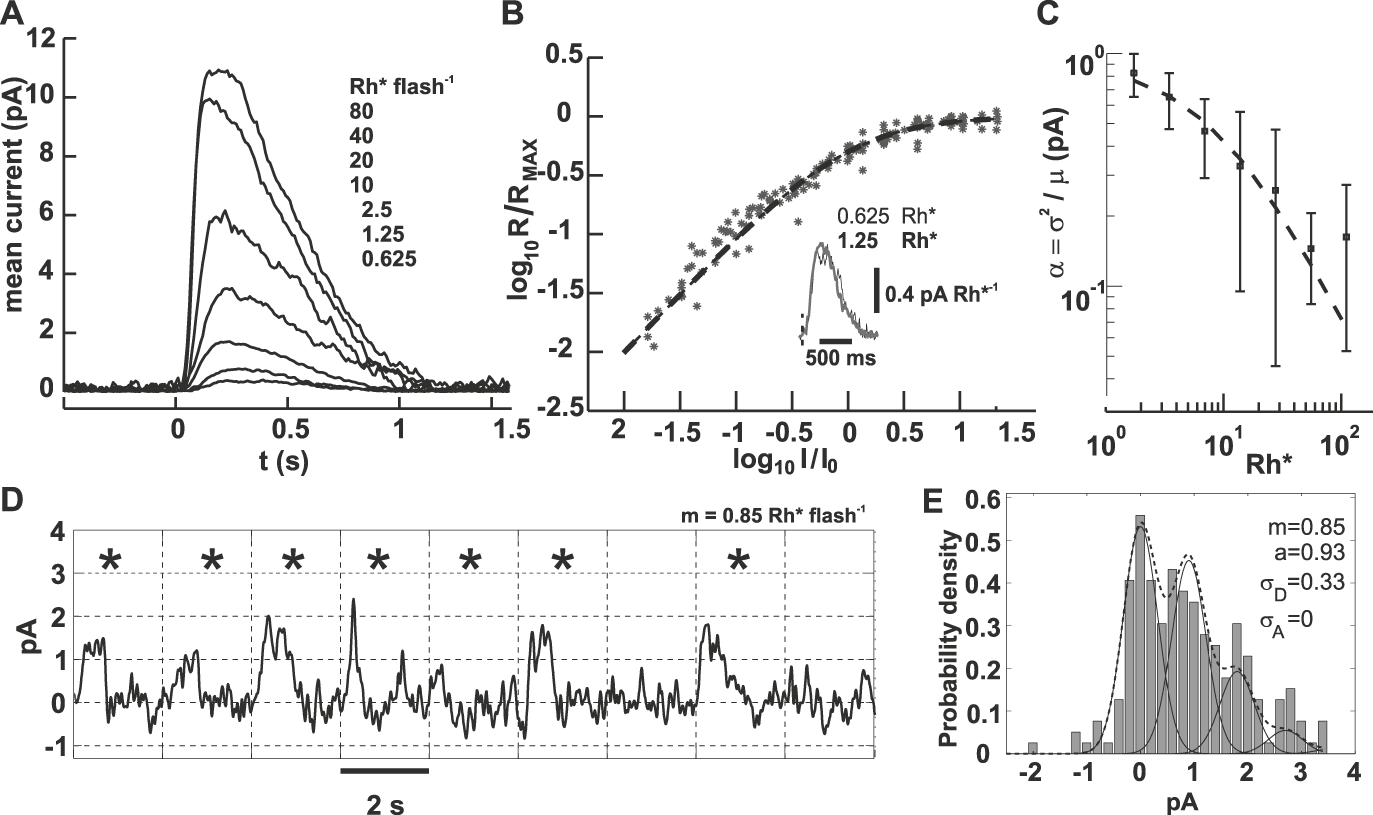
Suction electrode recordings of responses to brief flashes were used to determine the noise and SPR magnitudes of rods. A family of trial-averaged flash responses is shown in Fig. 2A. Rods responded linearly to dim flashes and then exhibited compressive saturation as flash intensity increased (Fig. 2B). This is demonstrated by the fit of the trial-averaged peak amplitudes (r) to eqn. (3) with unit exponent (h = 1) and half-maximal intensity (I 0 = 1):

Rod suction electrode recordings demonstrate the noise that obscures the SPR. (A) A family of responses to increasing flash energies. Each trace is the average of 10–100 flash presentations. Flashes were delivered at 0 s. Dark current for this cell was ~12 pA, and the intensity that produced the half-maximal response was 17.25 Rh*. (B) Data collected from 15 rods were fit to eqn. (3). Responses for each rod were normalized to the dark current and scaled by the intensity that produced the half-maximal response. Inset: an overlay of the two lowest flash strengths divided by their flash energies shows the similarity in waveform, which is expected for linear summation. Flash onset is indicated by the vertical dashed line. (C) The contribution of each Rh* to the flash response decreases with increasing stimulus strength. Plotted is the ratio of the variance to the mean at the peak of the flash response. Data from 15 rods were fit to eqn. (4) with parameters I 0 = 8.4 Rh* and a = 0.92 pA. (D) A segment of a 400-s rod suction recording that encompassed nine flash presentations at 0.5 Hz is shown. Flashes delivered on average 0.85 Rh*, and from Poisson statistics, ~40% should have generated no response. Tick marks on the abscissa and vertical grid lines correspond to the flash times. Asterisks indicate the flash responses whose correlation with the mean response was >0.51. From Poisson statistics, singletons and multiples should have occurred with probabilities 0.36 and 0.21, respectively. Baseline drift was corrected by fitting and then subtracting a spline to the average current of 100-ms periods in darkness that were spaced 2 s apart. Bandwidth = DC to 5 Hz. (E) The response amplitude histogram of the entire 400 s record in (D) is shown (200 flashes). No spline subtraction was used. Amplitudes were generated by correlation with a scaled portion of the mean flash response with each trial (Field and Rieke, Reference Field and Rieke2002). The dotted line is from eqn. (5), with individual peaks corresponding to 0, 1, 2, and 3 photoisomerizations shown by the solid lines. Only a and σD parameters were allowed to vary. Best-fit parameters are shown.

We estimated the SPR amplitude by calculating the ratio of the variance to the mean current response [eqn. (1)] for combined data from 15 rods (Fig. 2C). The calculated values decreased as the flash intensity increased, which we quantified by fitting the measured currents to a Weber–Fechner relation of the form:

Here, α is the contribution of each Rh* to the flash response. As flash intensity increases, the individual contributions of each Rh* decrease in size. The parameter a can be interpreted as the mean amplitude of dark-adapted responses to single photons (Schneeweis & Schnapf, Reference Schneeweis and Schnapf2000). For rabbit rods, the best-fit parameters were a = 0.92 pA and I 0 = 8.4 Rh*. The value for a compares favorably with previous estimates of the SPR amplitude for rabbit rods of 0.8 pA (Nakatani et al., Reference Nakatani, Tamura and Yau1991) and is close to the ~1 pA value for mouse rods (Field & Rieke, Reference Field and Rieke2002).
SPRs with such small amplitudes are difficult to distinguish among the random baseline fluctuations. Fig. 2D shows a series of flash responses. The responses to the second and fifth trials are likely singletons, and there are numerous noise events with similar amplitude. To estimate the signal-to-noise ratio (SNR) of rabbit rods, we measured the noise of our rod recordings by two methods designed to minimize the effects of baseline drift. First, for the full-length record of the cell in Fig. 2D, maximum response amplitudes were determined from the correlation of a scaled version of the mean response with each record, equivalent to the output of a matched filter (Field & Rieke, Reference Field and Rieke2002). This method largely ignores changes in holding current between flash presentations. An amplitude histogram was compiled and fit to a model p(r) of the probability density, a sum of Gaussians each with mean ka, weighted by their Poisson probability p(k) (Baylor et al., Reference Baylor, Lamb and Yau1979a):

For dim flashes, we ignored compression of SPR amplitude, a. The number of Rh* per flash is k with mean m. The standard deviation of the current fluctuations in darkness is σD and the deviation of a from the mean value is σA. To fit the histogram, m was determined from eqn. (2) and held constant, while a and σD were allowed to vary. σA was held constant at zero. From the fit, σ D was 0.33 pA, and the estimated SNR (a/σ D) was 2.8. A second method averaged the standard deviation of 100-ms periods of rod currents in darkness, taken from several rods. Baseline drift occurred on a much longer timescale, and the average noise value from this method was 0.4 pA, yielding an SNR of 0.92/0.4 = 2.3. The noise in darkness could not be attributed to electrode or recording errors because responses to saturating flashes were much quieter (not shown), but whether this SNR is physiological is uncertain. Primate rods with 0.7 pA SPR amplitudes have even better SNR (0.7/0.15 = 4.7, from Baylor et al., Reference Baylor, Nunn and Schnapf1984). Some of the difference might be accounted for by our use of Ames solution rather than Locke solution.
Nonlinear responses of RBP cells
The poor rod SNR poses a problem for photon counting in RBPs. Larger excursions of the continuous noise could be misinterpreted by the RBP as a response. In combination with thermal isomerizations, these false-positive responses due to continuous noise could contribute to the “dark light” in rods (Schneeweis & Schnapf, Reference Schneeweis and Schnapf2000; Field et al., Reference Field, Sampath and Rieke2005).
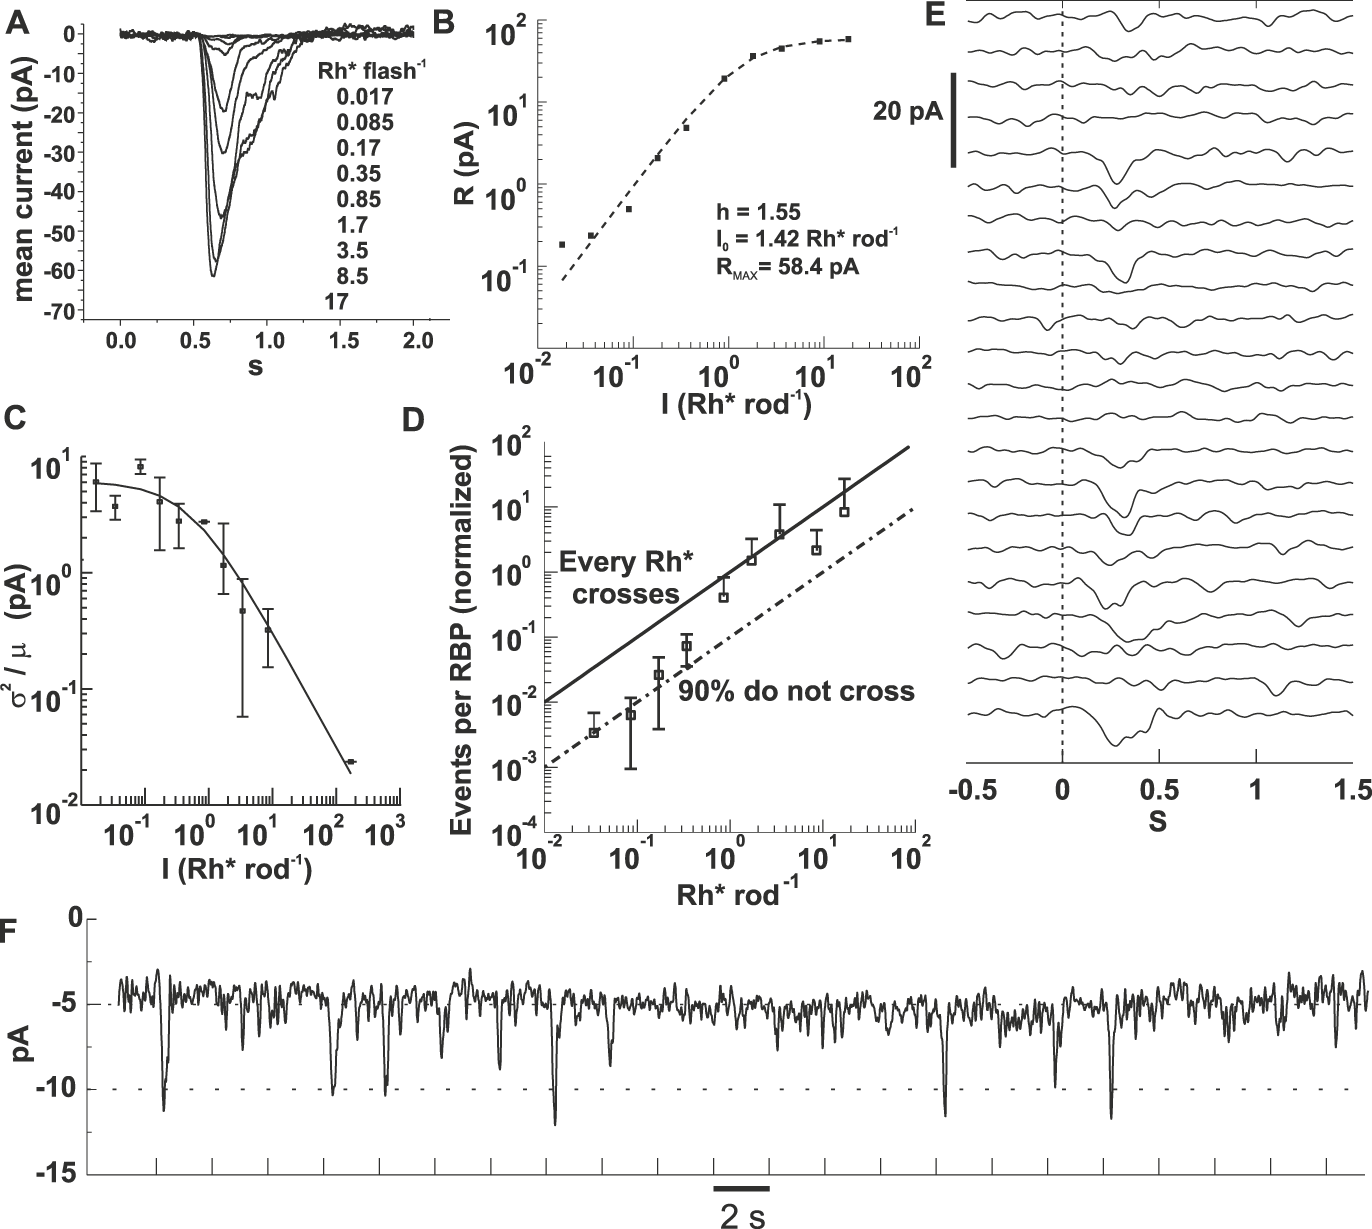
The operation of a nonlinearity at the rod to RBP synapse would suppress responses to small changes in rod glutamate release and disproportionately amplify larger responses to stimuli above a threshold (supralinearity). We found evidence for supralinearity from the best-fit parameters to eqn. (3), where I 0 is the intensity that yields the half-maximal response and h is the exponent that determines the degree of the supralinearity (h > 1). For the cell shown in Fig. 3A and 3B, h = 1.55. From fits to several RBP’s flash families, I 0 was 1.8 ± 0.9 Rh*/rod and h = 1.65 ± 0.37 (n = 7). Thus, rabbit RBPs respond supralinearly to changes in glutamate release from rods (Field & Rieke, Reference Field and Rieke2002; Berntson et al., Reference Berntson, Smith and Taylor2004).
RBP responses depend nonlinearly on flash strength. (A) Baseline subtracted currents recorded from a RBP in the perforated patch configuration. Each trace is an average of 3–20 flash presentations. Flashes were delivered at 0.5 s. Vh = −60 mV. (B) Peak currents of (A) plotted against flash intensity were fitted to eqn. (3). Best-fit parameters are displayed in the plot. (C) The ratio of the ensemble variance to the mean yielded the unitary response amplitude for RBPs (n = 12). As flash intensity increases, the current contributed by each Rh* decreases. The solid line is eqn. (4) with parameters a RBP = 6.1 pA, I 0 = 0.52 Rh*/rod. (D) Rh* events in rods are discarded by RBPs. The number of unitary events in a RBP is given by eqn. (2). Data from individual cells (n = 5) were averaged and scaled so that the points above 1 Rh* were bounded by the upper black line, which marks the input–output relationship corresponding to synaptic transfer of every Rh* in the rods. The lower line was drawn to mark 90% loss due to nonlinear transfer. The transition from 10 to 100% transmission occurs over the range of 0.3–2 Rh* in which the probability of multiple photon absorptions and the consequent threshold crossings also increases. (E) An example of a RBP response to repeated flashes delivering on average 0.17 Rh*/rod. Note the low-amplitude noise during periods without a stimulus. (F) Same data in (E), but the trials are concatenated. The holding current for this cell was 5 pA. Most of the successful responses have amplitude of 5 or 6 pA, as suggested by the fit in (C). Tick marks denote flash timing. Bandwidth = DC to 5 Hz for (A), (E), and (F).

Next, we examined how the operation of the nonlinear synapse affected transmission of rod SPRs to RBPs. To do this, we first estimated the unitary response amplitude of RBPs by calculating the ratio of the variance produced by the flash and the mean. Data from 12 RBPs are combined in Fig. 3C. A fit to eqn. (4) gave parameters a RBP = 6.1 pA and I 0 = 0.52 Rh*/rod. At this point, we assumed that a RBP represented the mean amplitude of the response of a RBP to the absorption of a single photon by one rod in its receptive field. Additional analysis supports this assertion (Fig. 4A).
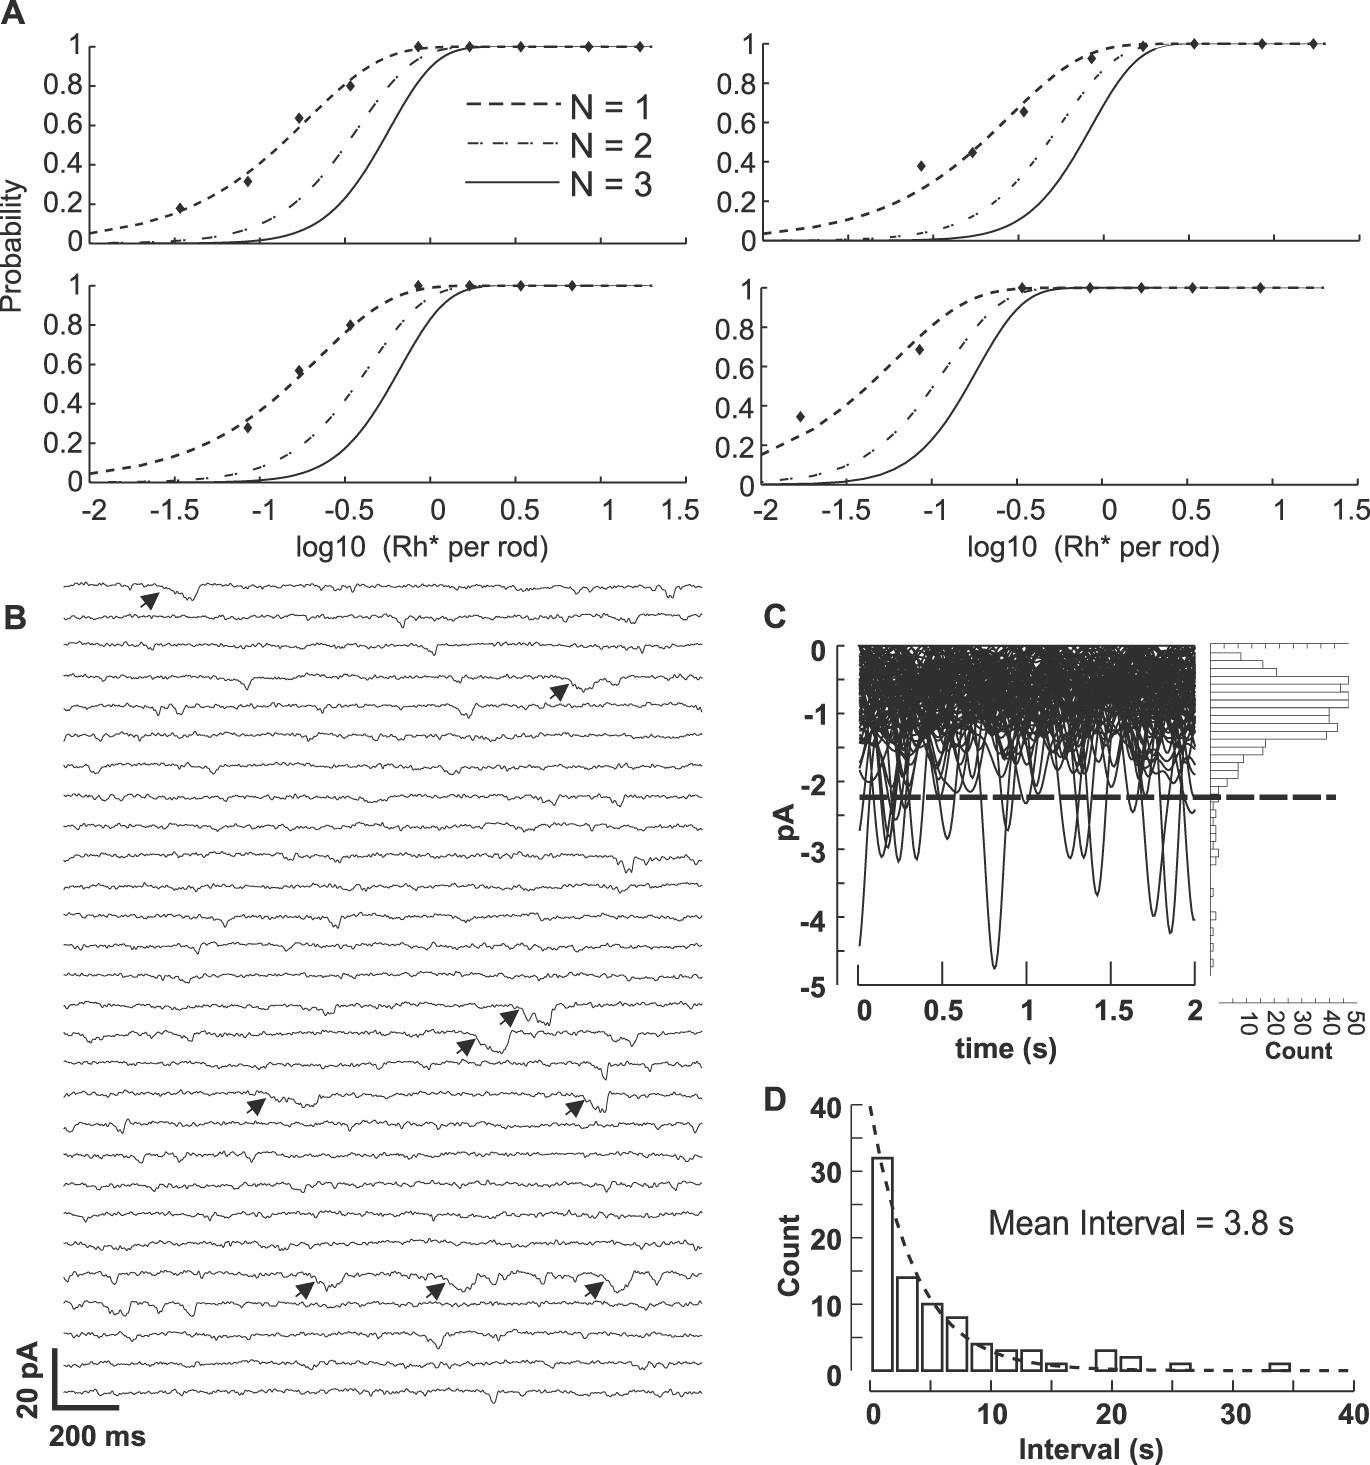
RBPs respond to single-photon absorptions and noise in RBPs may result from thermal isomerizations of rhodopsin. (A) Examples of fits for four RBPs to CPDs for the requirements of one, two, or three photons (N). Despite the steep nonlinearity at the rod RBP synapse, RBPs respond to single photons. (B) RBPs in darkness exhibit low-amplitude as well as larger discrete noise events. A 56-s portion of a 180-s recording of a RBP in darkness is shown. The current was segmented into 2-s sweeps for display purposes. Bandwidth = DC to 5 Hz. There are several discrete events that resemble the SPRs depicted in Fig. 3E and 3F. Events that exceed the threshold in (C) are marked with arrows. (C) Ninety two-second sweeps from the cell in (B) were match filtered to isolate events resembling the time course of the SPR and overlaid. The dashed line indicates placement of the event detection threshold, which was set at the mean plus 3 times the standard deviation of the entire record. The histogram to the right shows the amplitudes of all downward deflections in the current. Most of the low-amplitude noise appears normally distributed, but not the events above threshold, which we consider the result of thermal isomerizations. (D) Intervals between events detected by threshold crossings were binned and fit to an exponential to find the mean interval. The plotted histogram was generated from data compiled from eight RBP cells, providing an estimate of 3.8 s between SPR-like events in RBPs.

Fig. 3E and 3F demonstrates the increase in RBP SNR at the cost of lost rod signal. Responses to 22 consecutive flashes delivering on average 0.17 Rh*/rod are stacked in Fig. 3E and concatenated in Fig. 3F. The data in Fig. 3F illustrate the stability and low holding currents (5–10 pA) of our RBP recordings. Because the noise is lower than in rods, responses can be detected by visual inspection. Each flash should have generated a response in ~17 of the 100 rods within the RBP’s receptive field. That half of the flashes failed to generate a response suggests that some rod responses were attenuated by the nonlinear transmission. The attenuation was visualized by plotting the number of unitary events per RBP calculated from the ratio of the square of the ensemble mean and the variance [eqn. (2)] against the flash intensity (Fig. 3D). For this analysis, we used five cells whose half-maximal response intensities were the most similar and closest to the mean. The slopes of the curves for individual data were also similar. For normalization, the average responses were scaled to have the upper bound indicated by the solid line, which represents linear transfer from rods to RBPs. The lower dashed line represents 10% transmission due to the nonlinearity. Beginning with the lowest intensity, as the flash intensity increases, the transfer of rod events to RBPs increases from 10% efficiency to 100% efficiency.
The results from Fig. 3 demonstrate that, for the dimmest flashes, ~90% of the rod SPRs are discarded by the threshold nonlinearity at rod synapses with RBPs. One might conclude that two or more simultaneous rod SPRs are required for a response, although this would imply summation before thresholding. To test the number of required photons to generate a RBP SPR, we fit plots of response probability against stimulus intensity to cumulative Poisson distributions (CPDs) (Fig. 4A). Failures and successes were classified based on their correlation with the mean of all trials. The scaling factors of CPDs corresponding to one, two, or three required photons were varied, translating the curves along the abscissa (Hecht et al., Reference Hecht, Shlaer and Pirenne1942; Sakitt, Reference Sakitt1972), and goodness of fit was calculated. In all cases, the best-fit CPD is the one for which a single photon is sufficient to generate a RBP response. The inverse of the scaling factor required to match each CPD provided an estimate of the effective receptive field, which in our slice preparation was 7.8 ± 4.8 rods (n = 6 RBPs). Since ~100 rods synapse onto each RBP, this is in general agreement with the quantum efficiency of ~10% determined from Fig. 3D. Single-photon CPDs fit the data despite threshold elimination of the majority of rod SPRs, indicating that a response in a RBP requires a SPR from just a single rod. Therefore, the nonlinearity can be considered to have the same functional consequence as a decrease in quantum efficiency (Field et al., Reference Field, Sampath and Rieke2005).
Noise in RBPs
With a nonlinearity discarding a substantial portion of the rod SPRs, one might expect noise events in rods to be nearly eliminated in RBPs. However, RBPs exhibited two different types of noise: low-amplitude currents and larger currents that resemble the SPR (Fig. 4B). The precise mechanism and the shape of the nonlinearity are unclear, and we propose that the sigmoidal input–output relationship (van Rossum & Smith, Reference van Rossum and Smith1998; Berntson et al., Reference Berntson, Smith and Taylor2004; Field & Rieke, Reference Field and Rieke2002; Robson et al., Reference Robson, Maeda, Saszik and Frishman2004;) allows transmission of what we provisionally term “subthreshold” noise events in rods. These subthreshold events manifest as small currents in RBPs that do not match the full response to a photon absorption (Sterling & Smith, Reference Sterling and Smith2004). With 100 possible rod inputs, these low-amplitude events contribute substantially to the baseline noise. The standard deviation of RBP currents in darkness that exhibited both types of events (Fig. 4B and 4C) was 0.7 ± 0.24 pA (n = 8 RBP), yielding a RBP SNR of 8.7.
We believe that the large SPR-like events in darkness represent thermal isomerizations based on the following analysis. Continuous recordings of RBPs in darkness were match filtered using a Gaussian with temporal characteristics of the average dim flash response. The matched filtering preserved the amplitude of the SPR-like events and attenuated the smaller briefer events. We defined a threshold set at the mean plus 3 times the standard deviation. As evidenced in Fig. 4C, this threshold divided the distribution of event amplitudes into a normally distributed population and a set of outliers. From the nine recordings, the average mean, standard deviation, and threshold were −1.2 pA ± 0.46, 0.7 ± 0.24 pA, and −3.3 ± 1.2 pA, respectively. Intervals between all the outliers (that exceeded the set threshold) were binned (Fig. 4D) and fit to an exponential decay. Assuming a Poisson distribution, the fit yielded a mean interval of 3.8 s. Since single-rod SPRs can elicit a response in a RBP, dividing the frequency of events in RBPs by their effective receptive fields yielded an estimate of the rate of thermal isomerizations in rods of 0.033/s. This value falls in the range of values predicted from psychophysical experiments of 0.004–0.11/s (Barlow, Reference Barlow1957) and compares favorably with the averages of 0.08/s found for primate rods (Schneeweis & Schnapf, Reference Schneeweis and Schnapf2000) and 0.01/s found for mouse rods (Burns et al., Reference Burns, Mendez, Chen and Baylor2002). Since the effective receptive field is a measure of nonlinear thresholding as well as possible photon screening, the rate calculated for rods is a maximum. The true rate might be lower because thermal events are not subject to screening like experimental stimuli, and the effective receptive field for thermal events could be larger if nonlinear thresholding were the only active process. These data suggest that RBP events that resemble the SPR result from thermal isomerizations of rhodopsin. Thus, the noise events in rods can be classified into two populations based on their amplitude and waveform.
Discussion
Our results support a model of noise reduction at the rod RBP synapse that utilizes supralinear transmission to suppress small rod events and amplify those that exceed a threshold criterion. Suction recordings from rabbit rods reveal large fluctuations in darkness that confound genuine SPRs. With such a poor SNR for the rod SPR, the threshold-like nonlinearity attenuates most rod noise at a cost of losing most of the rod SPRs. The diminished quantum efficiency would seem at odds with detection of single photons, but the data also demonstrate that absorption of a single photon is sufficient for a RBP response (Fig. 4A). The fraction of rod SPRs discarded by rabbit RBPs is the largest yet reported, consistent with the low rod SNR we observed. It may be that RBPs are somehow tuned to the noise of their rods, with nonlinearities far to the right of the SPR’s mean to counteract the poor SNR. Since primate rods have the highest observed SNR (Baylor et al., Reference Baylor, Nunn and Schnapf1984), it will be of interest to examine rod SPR transmission in primate retinas to determine the placement of the midpoint of the RBP nonlinearity.
The results also suggest that the dark-adapted rod to RBP synapse signals the absorption of one or two photons in a rod and that other pathways utilize the upper part of the dynamic range of the rod response (Taylor & Smith, Reference Taylor and Smith2004; Hornstein et al., Reference Hornstein, Verweij, Li and Schnapf2005). This is evidenced by the saturation of the number of unitary events generated in RBPs as the number of Rh* in rods is increased (Fig. 3D) as well as the saturation of the RBP currents (I 0 = 1.8 Rh*/rod, Fig. 3B) and the Weber–Fechner-like decrease of the unitary response amplitude, I 0 = 0.52 Rh*/rod (Fig. 3C). Taken together, these data suggest that the rod RBP synapse saturates with just a few Rh*. Since the rod SPR amplitude began decreasing at greater intensities (I 0 = 8.4 Rh*/rod, Fig. 2C), other routes, such as direct contact with OFF cone bipolars (Tsukamoto et al., Reference Tsukamoto, Morigiwa, Ueda and Sterling2001; Li et al., Reference Li, Keung and Massey2004) and rod-cone coupling (Hornstein et al., Reference Hornstein, Verweij, Li and Schnapf2005; Trexler et al., Reference Trexler, Li and Massey2005), might respond better to multiple-photon events in rods.
Last, one of the most interesting findings in this study was that rabbit RBPs are surprisingly noisy despite the nonlinear threshold and discarding of a large fraction of rod SPRs. We classified the noise into two different groups based on amplitude and waveform. Low-amplitude excursions from a stable baseline probably represent weak initiations of the second messenger cascade (Dhingra et al., Reference Dhingra, Lyubarsky, Jiang, Pugh, Birnbaumer, Sterling and Vardi2000, Reference Dhingra, Jiang, Wang, Lyubarsky, Savchenko, Bar-Yehuda, Sterling, Birnbaumer and Vardi2002, Reference Dhingra, Faurobert, Dascal, Sterling and Vardi2004; Shen et al., Reference Shen, Heimel, Kamermans, Peachey, Gregg and Nawy2009; Morgans et al., Reference Morgans, Brown and Duvoisin2010). We propose that rod events must have either sufficient amplitude or duration or both in order to meet the cooperativity needs of the RBP cascade and generate a full response. A computer simulation by Clark and van Rossum (Reference Clark and van Rossum2006) found that a sigmoidal input–output relationship performed better than a step function description of the rod RBP synapse in recreating sparsely illuminated images at low light levels. The low-amplitude noise in our RBP recordings supports the existence of a sigmoidal synaptic relationship. The second grouping of noise events was based on their similarity to the SPR in both amplitude and time course. Intervals between these larger events were Poisson distributed and their frequency agreed with thermal isomerization rates in other systems. Both types of RBP noise may generate noise in postsynaptic cells, such as AII (rod) amacrine cells. This leads one to wonder whether a threshold operates also at the RBP to AII synapse. We have found in concurrent studies examining this question that AII amacrines exhibit frequent synaptic input from RBPs that is blocked by AMPA (α-amino-3-hydroxyl-5-methyl-4-isoxazole-propionate) receptor antagonists as well as mGluR6 antagonists (unpublished observations). These results suggest that at least some of the rod-induced noise found here in RBPs is transmitted to AIIs. The cellular or synaptic mechanisms that occur later in the pathway to deal with the residual noise in RBPs and AIIs merit further scrutiny.
Acknowledgments
We would like to thank Drs. Wei Li, Stephen C. Massey, Ruth Heidelberger, Ehud Kaplan, and David A. Rusak for helpful comments and discussion. This research was funded by the National Eye Institute (EY16392 to E.B.T. and core grant EY01867) and an unrestricted grant to the department of ophthalmology from Research to Prevent Blindness.