1. Introduction
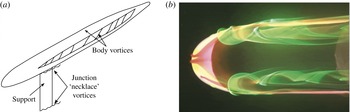
When a submarine manoeuvres, a complex three-dimensional separation can occur over the body, which can lead to strong streamwise-oriented vortices in the wake, and such vortices can have an important effect on the forces and moments acting on the submarine (Han & Patel Reference Han and Patel1979; Lloyd & Campbell Reference Lloyd and Campbell1986; Chesnakas & Simpson Reference Chesnakas and Simpson1997; Bridges et al. Reference Bridges, Blanton, Brewer and Park2003; Gregory, Joubert & Chong Reference Gregory, Joubert and Chong2004; Karlsson & Fureby Reference Karlsson and Fureby2009; Hess et al. Reference Hess, Fu, Cubbage, Ratcliffe, Hoyt and Roddy2010). For a body of revolution in pitch, similar vortices (‘body vortices’) are formed by the roll-up of the boundary layer due to azimuthal pressure gradients, and this formation process is illustrated in figure 1 for a simplified model of a submarine. This body of revolution is mounted using a support that is a semi-infinite extension of the sail.
(a) Simplified SUBOFF submarine model in pitch with a sail-like support on the windward side. (b) Rhodamine dye visualization of the model in a water channel at a pitch angle of
 ${\it\alpha}=15^{\circ }$
and
 $\mathit{Re}_{L}=40\times 10^{3}$
, white light illumination. The view is from the leeward side, and flow is from left to right.

The visualization shown in figure 1 was performed in a water channel at a Reynolds number of
 $\mathit{Re}_{L}=40\,000$
, where
 $\mathit{Re}_{L}=U_{\infty }L/{\it\nu}$
,
 $L$
is the model length,
 $U_{\infty }$
is the free stream velocity and
 ${\it\nu}$
is the fluid kinematic viscosity. At this low Reynolds number, the boundary layer on the body is laminar. A primary pair of streamwise counter-rotating vortices are seen to form on the leeward side of the model. Similar flow fields have been observed over a wide range of Reynolds numbers by, for example, Han & Patel (Reference Han and Patel1979) for a 4.3:1 spheroid and Vatsa, Thomas & Wedan (Reference Vatsa, Thomas and Wedan1989), Fu, Shekarriz & Huang (Reference Fu, Shekarriz and Huang1994), Chesnakas & Simpson (Reference Chesnakas and Simpson1997), Karlsson & Fureby (Reference Karlsson and Fureby2009) and Feymark et al. (Reference Feymark, Chapuid, Fureby and Liefvendahl2012) for a 6:1 prolate spheroid. Werlé (Reference Werlé1962), Hornung & Perry (Reference Hornung and Perry1984) and Bippes (Reference Bippes1987) described the separation topologies over similar bodies at low and moderate angles of attack, but here we are concerned with the evolution of the streamwise counter-rotating vortices which comprise the turbulent wake of such bodies in pitch.
Even when a bluff body is at zero pitch and yaw, it is possible for asymmetric wakes to develop. For example, Grandemange, Cadot & Gohlke (Reference Grandemange, Cadot and Gohlke2012a
), Grandemange et al. (Reference Grandemange, Gohlke, Parezanović and Cadot2012b
) and Grandemange, Gohlke & Cadot (Reference Grandemange, Gohlke and Cadot2013, Reference Grandemange, Gohlke and Cadot2014) took measurements in the wake of an axisymmetric body mounted using a support similar to ours at
 $\mathit{Re}_{L}=5.25\times 10^{4}$
. They found that any non-axisymmetric disturbance provided by the support leads to a preferred azimuthal orientation for the flow field. By using various control devices, Grandemange et al. were able to demonstrate that very small changes in geometry or orientation with respect to the flow (such as small pitch and yaw angles) can have a significant impact on the global flow topology.
For a body of revolution in pitch, we would naively expect the wake to be symmetric about the plane of pitch. However, this is not always the case. For example, there is a wealth of literature on asymmetric forebody vortex shedding, although this phenomenon has primarily been reported on slender bodies with sharp noses at high (
 ${>}40^{\circ }$
) angles of attack (Nelson & Pelletier Reference Nelson and Pelletier2003; Bridges Reference Bridges2006). In those cases, it appears that small asymmetries near the separation location can drastically change the wake structure because cross-flow separation is convectively unstable, amplifying such perturbations.
In this respect, Keener & Chapman (Reference Keener and Chapman1977) compared asymmetric wakes behind slender bodies and delta wings with large sweepback angles. They observed that both for sharp delta wings, where the separation point is fixed at the leading edge, and for slender-nosed bodies at high angles of attack, where the separation location is in general not fixed, vortex wake asymmetry can occur. They concluded that the asymmetric wake is the result of an inviscid instability that occurs when the two vortices are ‘crowded together’ near the tip of the body, and also that the asymmetry in the wake of a body of revolution does not require asymmetry in the separation locations. The inviscid instability argument was further investigated by Bridges (Reference Bridges2008), who used a potential flow model for the shedding of vortices in the wake of a slender body. Bridges (Reference Bridges2008) suggested that an initial disturbance that rotates the vortex pair by a small angle grows rapidly as the vortices convect downstream.
Such an asymmetry was also encountered by Gregory, Joubert & Chong (Reference Gregory, Joubert and Chong2007) in their study of the cross-flow separation of a body in a steady turn. They noted a ‘tilting or skewness in the off-body vortex’ which they could not ascribe to errors in their measurement techniques. The skewed vortex core was elliptical, and its semi-minor axis did not align with the plane of symmetry of the model, suggesting asymmetric vortex strengths.
The work by Keener & Chapman (Reference Keener and Chapman1977), Gregory et al. (Reference Gregory, Joubert and Chong2007) and Bridges (Reference Bridges2008) is important in that we find, for the first time, similar large-scale asymmetries occurring in the wake of a blunt-nosed SUBOFF model at relatively small angles of pitch (up to
 $+12^{\circ }$
). The experiments were performed on two geometrically similar models, a 1:120 scale model tested in a low-speed wind tunnel at
 $\mathit{Re}_{L}=2.4\times 10^{6}$
and a 1:240 scale model tested in a pressurized facility over a Reynolds number range of
 $2.4\times 10^{6}\leqslant \mathit{Re}_{L}\leqslant 30\times 10^{6}$
. The maximum Reynolds number is considerably larger than any previously reported in the literature for a pitched body of revolution. The other significant study at very high Reynolds number (up to
 $\mathit{Re}_{L}=110\times 10^{6}$
) is that of Bridges et al. (Reference Bridges, Blanton, Brewer and Park2003), whose primary concern was the effect of a sail tip vortex on the pressure distribution and moments acting on a submarine-like body executing a turn, and no wake measurements were reported.
The asymmetries we encounter remain present despite strong perturbations to the tripping device, the body surface roughness, the alignment of the body and free stream turbulence levels. They were also observed on both models, despite changes in size, wind tunnel facility and Reynolds number. We are left with the conclusion that bodies of revolution in pitch can generate strongly asymmetric wakes, a result that could prove to be vital to understanding the performance of manoeuvring axisymmetric bodies.
2. Experiments
The wake was generated by scaled models of a DARPA SUBOFF submarine without appendages, as described in Groves, Huang & Chang (Reference Groves, Huang and Chang1989) and Jiménez, Hultmark & Smits (Reference Jiménez, Hultmark and Smits2010a
). Two models were tested, a 1:120 scale model and a 1:240 scale model. Jiménez et al. (Reference Jiménez, Hultmark and Smits2010a
) studied the intermediate wake of the 1:120 scale model in the axisymmetric configuration (zero pitch and yaw) for
 $1.1\times 10^{6}<\mathit{Re}_{L}<67\times 10^{6}$
. On the support side, a significant signature of the support wake was observed at all downstream locations. We expect the support to play a less significant role in the present study, since Hosder & Simpson (Reference Hosder and Simpson2007) found that the primary separation lines on the non-sail side of a model with a sail were essentially the same as for the bare model with no sail, as long as the pitch angle was less than
 $15^{\circ }$
.
2.1. Tests on the 1:120 scale model
The length of the 1:120 model was
 $L=0.87~\text{m}$
, with a maximum diameter of
 $D=0.102~\text{m}$
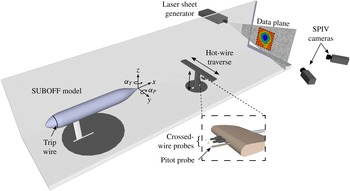
. The model support was located at the intersection of the forebody and mid-body sections where the submarine sail would normally be located, and the support had the same cross-section as the sail given in the SUBOFF specifications. The support was mounted perpendicular to the submarine model, and where it joined the hull it was shaped to accommodate the transverse curvature of the hull. This model was tested in a wind tunnel with a test section measuring
 $0.61~\text{m}\times 0.91~\text{m}$
and 4.27 m long. The general experimental arrangement is depicted in figure 2. For the axisymmetric configuration the blockage ratio is 1.5 %. For
 ${\it\alpha}_{P}=12^{\circ }$
, the blockage ratio is 3.4 %, based on the projected frontal area. We therefore believe that model blockage is not an important factor in our experiments. In the region of the wake, previous experiments with considerably larger blockage found
 $K=({\it\nu}/U_{e}^{2})(\text{d}U_{e}/\text{d}x)\leqslant 10^{-8}$
, where
 $U_{e}$
is the free stream velocity, so that pressure gradient effects are also expected to be negligible.
Experimental arrangement. The pitch, yaw and roll angles and their sign conventions.

The flow velocity was held constant at approximately
 $40~\text{m}~\text{s}^{-1}$
so that the Reynolds number based on the length of the model was fixed at
 $\mathit{Re}_{L}=2.4\times 10^{6}$
for all experiments, while the cross-flow Reynolds number
 $\mathit{Re}_{D}\sin {\it\alpha}$
varied from
 $1.9\times 10^{4}$
to
 $5.7\times 10^{4}$
as
 ${\it\alpha}$
increased from 4° to 12°. In the absence of the model, the mean free stream velocity
 $U_{\infty }$
varied by less than 1.5 % in the measurement plane, and the free stream turbulence intensity was found to be less than 0.4 %. The model was mounted in the centre of the wind tunnel test section, and it could be pitched, yawed or rolled with an accuracy of approximately
 $0.5^{\circ }$
. The model pivoted about the base of the support so that pitching the model moved it downstream by approximately
 $1.2D$
for the maximum pitch angle
 ${\it\alpha}=12^{\circ }$
. The coordinate system is based on the zero-pitch case, and does not move with the model. The velocities in the
 $x$
,
 $y$
and
 $z$
directions are
 $U+u$
,
 $V+v$
and
 $W+w$
respectively, where capital letters denote time-averaged values and lower-case letters denote fluctuating values.
The distance between the stern of the model and the bottom wall of the wind tunnel ranged from
 $3D$
at
 ${\it\alpha}=0^{\circ }$
to
 $1.2D$
at
 ${\it\alpha}=12^{\circ }$
. To investigate the effects of vortex–wall interactions, we performed two-dimensional inviscid potential flow simulations using a Rankine model for the vortices and the Biot–Savart law for the induced motion. The results indicate that the walls begin to influence the wake vortices for locations less than
 $0.5D$
from the wall, which only happens for
 ${\it\alpha}=12^{\circ }$
for
 $x/D>8$
. For these cases, viscous effects also become important due to the presence of the tunnel boundary layer, and such data were therefore not considered in our analysis.
The boundary layer on the model was tripped 75 mm (
 $x/L=0.086$
) downstream of the nose using a 1.6 mm diameter trip wire. Trip wires of 0.8 and 3.2 mm in diameter were also tested to investigate the sensitivity of the wake to the size of the trip wire. These tests are reported below as part of the overall sensitivity study.
Experiments were conducted using Pitot probes, hot wires and stereoscopic particle image velocimetry (SPIV). Hot-wire measurements were performed using DISA 55M01 constant-temperature anemometers. The probes were made in-house by etching Wollaston wire (90 % Pt 10 % Rh) of
 $5~{\rm\mu}\text{m}$
active diameter typically having an exposed length of 1 mm and a frequency response of 65 kHz at
 $40~\text{m}~\text{s}^{-1}$
. A Setra Systems differential pressure transducer with a range of
 $\pm 0.1$
PSID (
 $\pm 7.5~\text{kPa}$
) was used to measure the mean velocity and provide a reference for hot-wire calibration. The angle sensitivity of the crossed wires was determined using the calibration method due to Bradshaw (Reference Bradshaw1971) over
 $\pm 15^{\circ }$
; the method is described in detail by Jiménez et al. (Reference Jiménez, Hultmark and Smits2010a
). For all the flow fields investigated here, the instantaneous velocity angles were within the angle calibration range.
A two-axis (
 $y$
–
 $z$
) traverse carrying a pair of crossed wires (one to measure
 $U$
and
 $V$
, and the other to measure
 $U$
and
 $W$
) and a Pitot-static probe allowed measurements in a
 $0.4~\text{m}\times 0.4~\text{m}$
plane normal to the flow direction. Rotary encoders mounted on the lead screws ensured that an accuracy of
 $\pm 0.1~\text{mm}$
was achieved in both
 $y$
and
 $z$
directions. The crossed-wire measurement planes were located at
 $x/D=2$
, 5 and 8, where
 $x$
is the distance measured downstream of the stern of the model, and the initial single-normal-wire and Pitot data (only figure 13) were recorded at
 $x/D=10$
. The crossed-wire data are not coincident with the single-normal-wire data due to the need for a new holder (required for the angle calibration) for the crossed-wire measurements, which brought the probes slightly closer to the stern of the model. Measurements were typically taken in a
 $30\times 30$
grid with a spacing of 5 mm in both directions. The spacing between the two crossed-wire probes was 12.7 mm. The spacing between the Pitot tube and the furthest crossed wire was 31.8 mm, while the spacing between the Pitot tube and the nearest crossed wire was 19.1 mm. The crossed-wire measurements were interpolated to obtain the velocity components on a single grid corresponding to the Pitot tube locations. The hot-wire and Pitot-static channels were sampled for 15 s each at a frequency of 40 kHz, and an eighth-order Butterworth analogue filter (Krohn-Hite model) was used to low-pass filter the signals at 20 kHz.
The SPIV system was a commercial LaVision System featuring dual-pulsed 50 mJ Nd:YAG lasers, two 5.5 megapixel 16-bit sCMOS cameras, a programmable timing unit and the Davis software suite for data acquisition and processing. A concave cylindrical lens with a focal length of − 10 mm was used to create the light sheet in conjunction with a lens to focus the sheet at the measurement location, resulting in a light sheet thickness of approximately 1 mm. The flow was seeded using
 $1~{\rm\mu}\text{m}$
smoke particles generated by a MAX 3000 MDG fog generator.
The cameras were positioned to see the same field of view with an angular separation between their viewing angles of approximately
 $65^{\circ }$
(figure 2). A pair of 50 mm focal length lenses were used in conjunction with
 $532\pm 10~\text{nm}$
bandpass filters on each of the cameras to filter ambient light. The velocity components (
 $U$
,
 $V$
and
 $W$
) were computed using the stereoscopic cross-correlation of pairs of successive images with 50 % overlap between interrogation domains. The images were processed using an advanced multipass algorithm where the initial and final correlation passes were
 $32\times 32$
pixels and
 $16\times 16$
pixels respectively. Four hundred image pairs were acquired to produce time-averaged vector fields at each plane. Datasets were taken at the following streamwise locations:
 $x/D=2$
, 5, 8, 11, 16, 21 and 26. The set-up for the hot-wire and SPIV experiments is depicted in figure 2. According to Adrian & Westerweel (Reference Adrian and Westerweel2011), the largest error attributed to SPIV is usually the spatial error of the camera calibration. Assuming a spatial error of 0.1 pixel the analysis suggests that the error in the mean velocity for the present experiment was
 $\pm 1.63~\text{m}~\text{s}^{-1}$
.
2.2. Tests on the 1:240 scale model
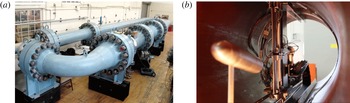
The 1:240 scale model was tested in the High Reynolds Number Test Facility (HRTF), a closed-loop pressurized wind tunnel located in the Gas Dynamics Laboratory at Princeton University. The wind tunnel has a circular working section 4.88 m long with a 0.49 m inner diameter. Two ports, 0.1 and 0.25 m in diameter, allow access to the wind tunnel which has no optical access once sealed (see figure 3). The HRTF can be pressurized up to a maximum of 220 atm and has a maximum free stream velocity of approximately
 $10~\text{m}~\text{s}^{-1}$
. The free stream turbulence intensity ranges from 0.3 % at the lowest Reynolds number to 1.1 % at the highest. Further details regarding the HRTF may be found in Jiménez (Reference Jiménez2007) and Jiménez et al. (Reference Jiménez, Hultmark and Smits2010a
).
The Princeton HRTF.

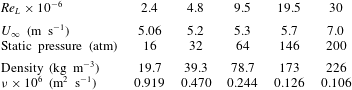
Measurement conditions for the 1:240 scale model. The pitch angle was fixed at
 $8^{\circ }$
.

The 1:240 scale model had a length of 0.435 m with a maximum diameter of 0.051 m. Similarly to the 1:120 scale model, the support for the 1:240 model was located at the intersection of the forebody and mid-body sections, and it had the same cross-section as the sail specified in the SUBOFF geometry (Groves et al.
Reference Groves, Huang and Chang1989). The boundary layer on the model was tripped 37 mm downstream of the nose (
 $x/L=0.086$
) with a 0.8 mm diameter trip wire. Despite the small size of the model, a large range of Reynolds numbers was achieved (
 $2.4\times 10^{6}<\mathit{Re}_{L}<30\times 10^{6}$
). The flow conditions are summarized in table 1. The pitch angle was fixed at
 $8^{\circ }$
. At this angle, the blockage based on frontal area was approximately 4 %.
Measurements were performed using Pitot probes and hot wires. A multiple degree of freedom traverse allowed probes to be placed in a
 $2.4D$
or
 $124\pm 1~\text{mm}$
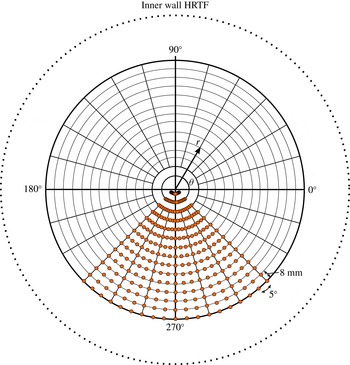
radius about the centre of the wind tunnel, at virtually all azimuthal locations (
 $0^{\circ }<{\it\theta}<360^{\circ }\pm 2^{\circ }$
) and from
 $x/D=2$
to 14. The traverse was very similar to the one used by Jiménez et al. (Reference Jiménez, Hultmark and Smits2010a
) and had a blockage of approximately 2.3 %. In addition, for crossed-wire measurements an angular calibration was performed in situ by pitching the probes by
 $\pm 15^{\circ }$
. Anticipating the vortex locations in the wake, measurements were typically taken using a
 $15\times 19$
grid with a vector spacing of 8 mm in the radial direction and
 $5^{\circ }$
in the azimuthal direction, as shown in figure 4. The probe positioning, calibration and signal acquisition were fully automated in order to minimize the run time.
Typical radial and azimuthal measurement grid locations are denoted by filled circles.

Crossed-wire measurements were performed using two Dantec constant-temperature hot-wire anemometers, using probes similar to those used in the study of the 1:120 scale model. The frequency response was approximately 20 kHz at the lowest Reynolds number and 80 kHz at the highest. Two pairs of Validyne transducers with ranges of
 $\pm 0.5$
psid (
 $\pm 3.5~\text{kPa}$
) and
 $\pm 2~\text{psid}$
(
 $\pm 7~\text{kPa}$
) were used to measure the mean velocity for the low-Reynolds-number and high-Reynolds-number ranges respectively. The transducers were calibrated using either a low-range oil-based calibrator (0.001–0.1 psid) or an Ametek dead-weight tester (1–100 psid). For the atmospheric pressure runs, Datametrics and Setra Systems transducers were used, each with a range between 0.001 and 0.1 psi.
The crossed-wire, Pitot tube, tunnel static pressure and tunnel temperature signals were sampled for 15 s each at a frequency of 40 kHz, and an eighth-order Butterworth analogue filter (Krohn-Hite model) was used to low-pass filter the hot-wire signals at 20 kHz. Each velocity field, at a given downstream location, took approximately 120 min to acquire for the
 $15\times 19$
grid, including the time required to perform prerun and postrun velocity and angle calibrations. The temperature increased during a given run by an amount (
 $^{\circ }\text{C}$
) of at most 0.95, 1.2, 3, 8 and 20 respectively for the five Reynolds numbers studied. The hot-wire data were corrected for temperature changes using the procedure described by Hultmark & Smits (Reference Hultmark and Smits2010). Due to these temperature changes, the pressure in the tunnel typically increased above its starting value during a run, resulting in a small increase in Reynolds number. For the highest Reynolds number, the Reynolds number increased from
 $\mathit{Re}_{L}=28.7\times 10^{6}$
at the beginning of the run to approximately
 $\mathit{Re}_{L}=30\times 10^{6}$
at the end of the run.
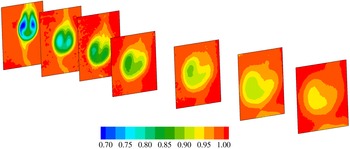
Zero-pitch, zero-yaw contours of
 $U/U_{\infty }$
at
 $x/D=2$
, 5, 8, 11, 16, 21 and 26, obtained using SPIV. Flow is from left to right.

3. Initial results
We begin with the reference case for zero pitch for the 1:120 scale model at
 $\mathit{Re}_{L}=2.4\times 10^{6}$
. The mean streamwise velocity distributions are shown in figure 5. In the lower half of the measurement plane, the presence of the support is apparent. Figure 6 compares these profiles with those obtained previously by Jiménez et al. (Reference Jiménez, Hultmark and Smits2010a
) using the same model mounted in the HRTF. All the profiles were taken in the plane where
 $y=0$
(the ‘vertical’ plane). It should be noted that the data of Jimenez et al. were taken at stations one diameter further downstream than the current data set (
 $x/D=3$
, 6, 9, 12 and 16), and at
 $\mathit{Re}_{L}=1.1\times 10^{6}$
rather than
 $\mathit{Re}_{L}=2.4\times 10^{6}$
. Nevertheless, there is generally good agreement among all the data sets, except that the effects of the support are more pronounced in the SPIV data, particularly for
 $x/D\geqslant 8$
, but the profile in the vertical plane is very sensitive to the support wake position, so that this result could be due to a small error in locating the central plane. The velocity profiles in the horizontal plane (not shown), however, collapse using Townsend’s similarity scaling, indicating that the support does not seem to influence the flow outside of a rather limited azimuthal region downstream of the support. This was observed by Jiménez et al. (Reference Jiménez, Hultmark and Smits2010a
) and is also true of the current data set.
Zero-pitch, zero-yaw mean velocity profiles in the plane where
 $y=0$
: ○,
 $x/D=2$
;
 $\ast$
,
 $x/D=5$
; ♢,
 $x/D=8$
; ▫,
 $x/D=11$
;

 $x/D=15$
. The label ‘bottom’ corresponds to the location downstream of the support. Red symbols, SPIV; blue symbols, Pitot measurements; black symbols, hot-wire data from Jiménez et al. (Reference Jiménez, Hultmark and Smits2010a
).

Figure 7 shows the mean profile measured at
 $x/D=8$
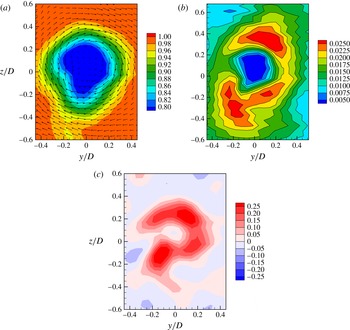
in more detail. The in-plane velocity magnitudes are also shown. A small circulatory motion surrounding the wake core is evident, with a maximum in-plane velocity of less than 2.5 % of
 $U_{\infty }$
. As a result, at this location, the wake has rotated by approximately
 $5^{\circ }$
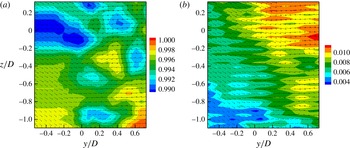
. The vorticity in the wake also clearly shows rotation of the flow in the clockwise sense. As can be seen from figure 8, the streamwise and in-plane velocities for the empty test section are between 0.5 % and 1 % of the average free stream value, with a direction that is broadly from left to right in the cross-stream plane. It is clear that the wake displays asymmetries that do not simply relate to the quality of the incoming flow, even when the model is in a nominally axisymmetric configuration.
Zero-pitch, zero-yaw configuration at
 $x/D=8$
. (a) In-plane velocity vectors superimposed on contours of
 $U/U_{\infty }$
. (b) Contours of
 $\sqrt{V^{2}+W^{2}}/U_{\infty }$
. (c) Mean non-dimensional vorticity,
 ${\it\omega}D/U_{\infty }$
. Data were obtained using Pitot tubes and crossed wires.

Base flow (no model, no support; empty test section) at
 $x/D=8$
. (a) In-plane velocity vectors superimposed on contours of
 $U/U_{\infty }$
. (b) In-plane velocity vectors superimposed on contours of
 $\sqrt{V^{2}+W^{2}}/U_{\infty }$
. Data were obtained using Pitot tubes and crossed wires.

To further investigate this distortion of the wake, the turbulent stress components obtained using crossed wires are shown in figure 9. At this location (
 $x/D=8$
), the maximum streamwise velocity fluctuations are approximately 6 % of the local velocity. The shear stress distributions show the interference caused by the support, which lowers the turbulence levels, as previously observed by Jiménez, Reynolds & Smits (Reference Jiménez, Reynolds and Smits2010b
). The slight asymmetry in the shear stress magnitudes seen in
 $\overline{uw}$
is potentially due to the net circulatory motion seen in figure 7, which would would tend to decrease the negative shear stress and increase the positive shear.
Zero-pitch, zero-yaw contours of the turbulent stresses at
 $x/D=8$
: (a–c)
 $\sqrt{\overline{u^{2}}}/U$
,
 $\sqrt{\overline{v^{2}}}/U$
and
 $\sqrt{\overline{w^{2}}}/U$
; (d,e)
 $\overline{uv}/U^{2}$
and
 $\overline{uw}/U^{2}$
.

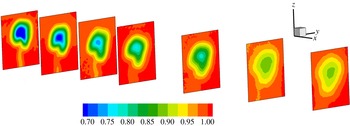
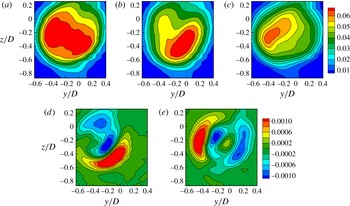
With pitch, the asymmetry of the wake becomes even more pronounced. Figure 10 shows the contours of the streamwise velocities as they evolve downstream for
 ${\it\alpha}=8^{\circ }$
. As expected, we see a pair of vortices that are shed from the body, as shown in figure 1. However, instead of a symmetric wake, we see that the vortices have different strengths, and as the wake evolves downstream they precess about their centre of rotation. The asymmetry is seen more clearly in figure 11, which displays one of the slices (at
 $x/D=8$
) from figure 10. We see the footprint of a rotated pair of vortices in the velocity and the vorticity fields. This result is repeatable, and independent of the measurement technique (hot wires and PIV). As will be discussed below, this feature is also robust to various perturbations.
Pitch:
 ${\it\alpha}=8^{\circ }$
. Contours of
 $U/U_{\infty }$
at
 $x/D=2$
, 5, 8, 11, 16, 21 and 26. Flow is from left to right.

Pitch:
 ${\it\alpha}=8^{\circ }$
. Contours of
 $U/U_{\infty }$
and the in-plane velocities (a) and mean non-dimensional vorticity,
 ${\it\omega}D/U_{\infty }$
(b).

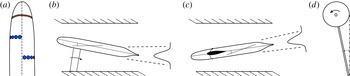
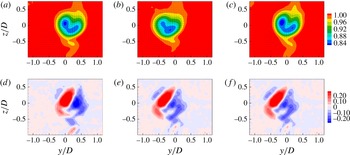
Perturbations in surface roughness (a), pitch (b), yaw (c) and roll (d). In the surface roughness image, the orange band is the trip wire and the blue discs are the surface roughness elements, and the flow goes from top to bottom. The roll image shows a positive roll angle, and the flow is out of the page.

4. Wake sensitivity
In order to investigate the sensitivity of the asymmetric wake structure generated by the 1:120 scale model, the flow over the body was perturbed in a number of different ways, and measurements were obtained for
 ${\it\alpha}=8^{\circ }$
at
 $\mathit{Re}_{L}=2.4\times 10^{6}$
. We varied the diameter of the trip wire, the free stream turbulence in the wind tunnel, the surface roughness on the body, and intentionally placed the model at small yaw and roll angles to simulate imperfect model positioning. The various perturbations are summarized in figure 12.
We begin with the effects of the trip wire. At this Reynolds number (
 $\mathit{Re}_{L}=2.4\times 10^{6}$
), a trip wire is necessary to promote transition to turbulence and generate a consistent wake. To study the effects of trip-wire size, its diameter was varied from 0 (untripped), to 0.8, 1.6 and 3.2 mm (its location was fixed at 75 mm downstream of the bow). The mean velocity fields for a pitch angle of
 ${\it\alpha}=8^{\circ }$
at
 $x/D=10$
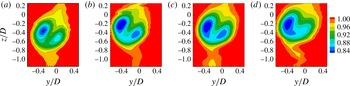
are shown in figure 13. The most obvious feature of the wake is that it is asymmetric at this location regardless of the tripping condition. With increasing trip diameter, the location of the vortex pair moves up (increasing
 $z$
) relative to the location of the stern, but this is most likely due to a slightly more leeward separation of the vortices on the body. Only relatively minor differences are seen among the mean velocity fields for the vortex pairs, except that for the largest trip size the strength of the weaker vortex is noticeably affected, probably because the disturbance caused by the larger trip wire has distorted the boundary layer development. For all other measurements on the 1:120 scale model, the trip-wire diameter was fixed at 1.6 mm to achieve adequate tripping without unduly distorting the wake evolution. It should be noted that the trip-wire sensitivity is more significant in yaw, and the 1.6 mm trip was the smallest size that gave mirror symmetry of the vortices in yaw (Ashok, Van Buren & Smits Reference Ashok, Van Buren and Smits2015).
Pitch:
 ${\it\alpha}=8^{\circ }$
,
 $x/D=8$
. Contours of
 $U/U_{\infty }$
at
 $x/D=10$
: (a–d)
 $d=0$
, 0.8, 1.6, 3.2 mm. The stern of the model is located at
 $x=y=z=0$
. Results were obtained using Pitot probes and hot wires.

To see the effects of free stream turbulence, the turbulence levels in the wind tunnel were increased using a rectangular grid with a mesh spacing of 6 mm and a solidity of 23 % (this grid was previously used by Ashok et al. (Reference Ashok, Bailey, Hultmark and Smits2012) in an investigation of probe response). This gave a free stream turbulence intensity of approximately 3 % at the bow of the model, an order of magnitude larger than the turbulence level in the empty wind tunnel. The free stream turbulence resulted in a negligible change in the wake structure.
Next, surface roughness was investigated using circular roughness elements (‘buttons’) with a height of 1.6 mm, as shown in figure 12. These elements were placed at different azimuthal (
 $100^{\circ }<{\it\theta}<170^{\circ }$
) and axial locations (
 $0.2<x/L<0.4$
), upstream of the separation point, which is in the range
 $0.6<x/L<0.7$
, as reported by Fu et al. (Reference Fu, Shekarriz and Huang1994). The buttons were placed on the left and right sides of the body in symmetric and asymmetric configurations, as listed in table 2; for example,
 $x/L=0.2$
(l) and
 $x/L=0.4$
(r) correspond respectively to an array of roughness elements at
 $x/L=0.2$
on the left side and one at
 $x/L=0.4$
on the right side, which is the configuration shown in figure 12. The differing axial configurations were chosen to influence the separation location and potentially promote asymmetric separation in the opposite sense to the naturally occurring asymmetry. All of the surface roughness configurations listed in table 2 resulted in very small changes in the wake structure, suggesting that surface roughness is also not responsible for the asymmetry.
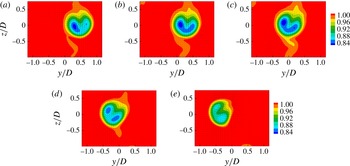
The effect of imperfect model positioning on the wake asymmetry was studied by placing the model at small yaw and roll angles. Figures 14 and 15 show the wake for yaw angles
 ${\it\alpha}_{Y}$
ranging from
 $2^{\circ }$
to
 $-2^{\circ }$
in increments of
 $1^{\circ }$
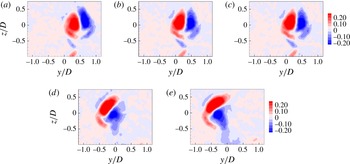
. Even at small angles of yaw, there is a clearly visible rotation of the vortices in the wake which is probably due to the azimuthal movement of the separation locations. The wake is obviously sensitive to small changes in yaw angle, but the asymmetry remains. This observation is supported by the vorticity distributions corresponding to the same yaw angles, as seen in figure 15.
Pitch:
 ${\it\alpha}=8^{\circ }$
,
 $x/D=8$
. Contours of
 $U/U_{\infty }$
for yaw angles of (a)
 $-2^{\circ }$
, (b)
 $-1^{\circ }$
, (c)
 $0^{\circ }$
, (d)
 $+1^{\circ }$
, (e)
 $+2^{\circ }$
.

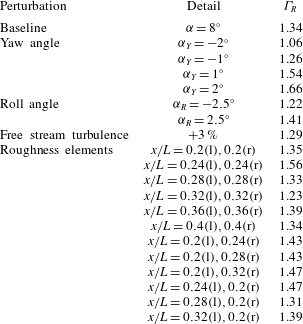
The wake asymmetry parameter
 ${\it\Gamma}_{R}$
for perturbation studies at
 ${\it\alpha}=8^{\circ }$
at
 $x/D=8$
.

The effect of a change in roll angle was studied by rolling the model by
 ${\it\alpha}_{R}=2.5^{\circ }$
in both directions. Figure 16 shows the effects of roll on the distributions of streamwise velocity and vorticity. The roll angle simply translates the wake either to the left or to the right while essentially preserving the asymmetry in the strength of the vortices.
Pitch:
 ${\it\alpha}=8^{\circ }$
,
 $x/D=8$
. Contours of mean vorticity,
 ${\it\omega}D/U_{\infty }$
, for yaw angles of (a)
 $-2^{\circ }$
, (b)
 $-1^{\circ }$
, (c)
 $0^{\circ }$
, (d)
 $+1^{\circ }$
, (e)
 $+2^{\circ }$
.

Pitch:
 ${\it\alpha}=8^{\circ }$
,
 $x/D=8$
. Contours of
 $U/U_{\infty }$
(a–c) and mean vorticity
 ${\it\omega}D/U_{\infty }$
(d–f) for roll angles of
 $2.5^{\circ }$
(a,d),
 $-2.5^{\circ }$
(b,e) and
 $0^{\circ }$
(c,f).

To assign a metric to the asymmetry of the wake, we use the ratio of the clockwise circulation and counterclockwise circulation of the primary vortices (
 $={\it\Gamma}_{R}$
). Table 2 lists the values of
 ${\it\Gamma}_{R}$
for all the perturbations undertaken here, except for the trip-wire results where no circulation data were available. Although we note some deviation from the nominal asymmetric value of
 ${\it\Gamma}_{R}=1.34$
, none of the perturbations had the desired effect of creating a symmetric wake (
 ${\it\Gamma}_{R}=1$
) or causing an asymmetric wake of opposite sense (
 ${\it\Gamma}_{R}<1$
). For instance, with small changes in yaw angle of
 $\pm 2^{\circ }$
, the deviations from the baseline case were
 $+0.32$
and −0.28 respectively, which represents an almost perfect symmetry in response. The asymmetry in the wake appears to be remarkably insensitive to perturbations in the initial and boundary conditions, and so the asymmetry does not appear to be caused simply by errors in experimental design.
Experiments conducted on a prolate spheroid in pitch by Hosder & Simpson (Reference Hosder and Simpson2007) concluded that the separation topology on the side opposite the support is not greatly affected by the presence of the support so long as the pitch angle is less than
 $15^{\circ }$
. Therefore, we also do not expect the support to be a cause of the asymmetries. As indicated earlier, however, asymmetric forebody vortex shedding has been encountered in the context of slender bodies with sharp noses at high angles of attack (
 ${>}40^{\circ }$
). Nelson & Pelletier (Reference Nelson and Pelletier2003) and Bridges (Reference Bridges2006) discuss in detail the extreme sensitivity of such separated flows to small disturbances. Similar asymmetries have not previously been seen for bodies with blunt noses, as for the SUBOFF body, and at the small angles of incidence studied here. It seems likely that in our flow, different separation locations on either side of the body lead to vortices of different strengths. This is in accordance with the observations by Lloyd & Campbell (Reference Lloyd and Campbell1986), who point out that body vortices grow in strength along the body before they are shed. Surface oil and tuft visualizations were attempted to pinpoint the location of separation on the body, but at our flow Reynolds number the results were not sufficiently sensitive to provide this information.
5. Effects of Reynolds number
The effects of Reynolds number were examined using the 1:240 scale model tests in the HRTF. These experiments give further confidence in the results obtained for the 1:120 scale model since they were conducted on a different model and in a different wind tunnel, and yet they lead to essentially the same conclusions regarding the asymmetries in the wake.
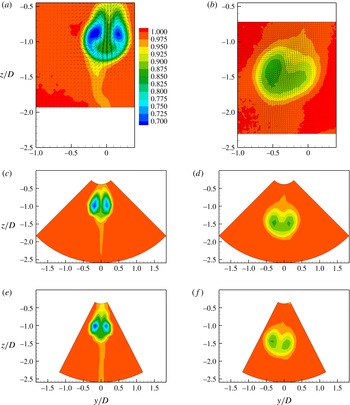
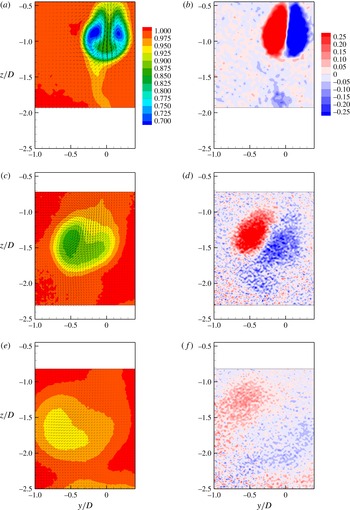
Figure 17(c,d) shows the contours of the mean velocity for the smaller model in the cross-stream (
 $y$
–
 $z$
) plane at
 $x/D=2$
and 11, at
 $\mathit{Re}_{L}=2.4\times 10^{6}$
. The results are compared with those from the 1:120 scale model at the same Reynolds number, shown in figure 17(a,b). The asymmetry visible in the 1:120 scale model wake is also apparent in the 1:240 scale model wake, although it is somewhat weaker. At
 $\mathit{Re}_{L}=19.5\times 10^{6}$
, however, shown in figure 17(c,d), the smaller model displays a degree of rotation that is approximately the same as that seen for the larger model at
 $\mathit{Re}_{L}=2.4\times 10^{6}$
.
Contours of
 $U/U_{\infty }$
for a pitch angle of
 $8^{\circ }$
: (a,c,e)
 $x/D=2$
; (b,d,f)
 $x/D=11$
; (a,b) 1:120 scale model at
 $\mathit{Re}_{L}=2.4\times 10^{6}$
; (c,d) 1:240 scale model at
 $\mathit{Re}_{L}=2.4\times 10^{6}$
; (e,f) 1:240 scale model at
 $\mathit{Re}_{L}=19.5\times 10^{6}$
.

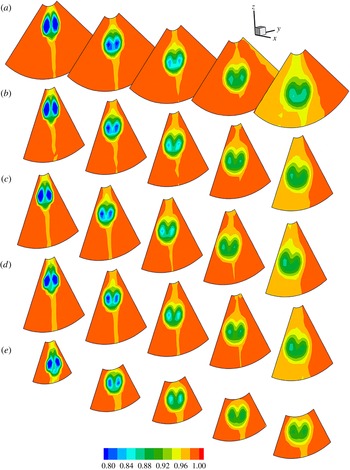
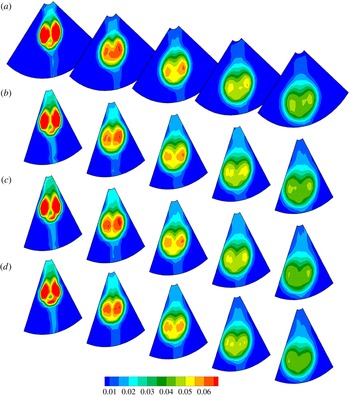
In figure 18 we show a larger Reynolds number range, and we see that for
 $\mathit{Re}_{L}>4.8\times 10^{6}$
the wake mean velocity distribution becomes essentially Reynolds-number-independent. It should be noted that for
 $\mathit{Re}_{L}=30\times 10^{6}$
, a smaller extent of the wake was surveyed because run times were limited due to the temperature increase in the tunnel. The small differences that are apparent when comparing the
 $\mathit{Re}_{L}=30\times 10^{6}$
case with the other cases are mainly due to the differences in the spatial resolution of the measurement grid.
Contours of
 $U/U_{\infty }$
for the 1:240 scale model for a pitch angle of
 $8^{\circ }$
at
 $x/D=2$
, 5, 8, 11, 14;
 $\mathit{Re}_{L}=2.4\times 10^{6}$
(a);
 $4.8\times 10^{6}$
(b);
 $9.5\times 10^{6}$
(c);
 $19.5\times 10^{6}$
(d);
 $30\times 10^{6}$
(e). Flow is from left to right.

Measurements of the
 $z$
-component of the mean velocity,
 $W$
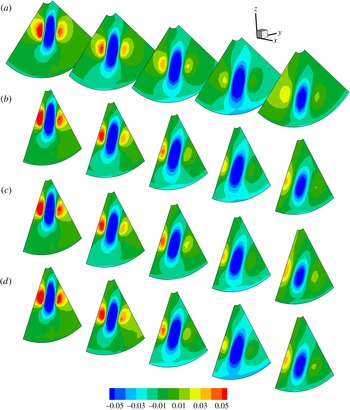
, are presented in figure 19. The strong jet formed between the two vortices highlights the asymmetry. Even for
 $\mathit{Re}_{L}=2.4\times 10^{6}$
, where the asymmetry appeared to be relatively small in terms of the mean streamwise velocity
 $U$
, the
 $W$
velocity field clearly shows an angling of the jet and an asymmetry in strength between the two vortices.
Contours of
 $W/U_{\infty }$
for the 1:240 scale model for a pitch angle of
 $8^{\circ }$
at
 $x/D=2$
, 5, 8, 11, 14;
 $\mathit{Re}_{L}=2.4\times 10^{6}$
(a);
 $4.8\times 10^{6}$
(b);
 $9.5\times 10^{6}$
(c);
 $19.5\times 10^{6}$
(d).

Contours of the r.m.s. value of the streamwise component of the velocity fluctuations,
 $u_{rms}/U$
, are presented in figure 20. We see that
 $u_{rms}/U$
appears to become Reynolds-number-independent for
 $\mathit{Re}_{L}\geqslant 4.8\times 10^{6}$
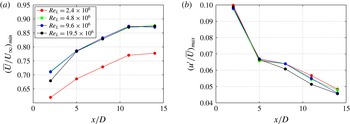
, just as the streamwise mean velocity. To illustrate this Reynolds number dependence more quantitatively, we show in figure 21 the minimum value of
 $U/U_{\infty }$
and the maximum value of
 $u_{rms}/U$
in the cross-stream plane. For
 $\mathit{Re}_{L}>4.8\times 10^{6}$
, at least for
 $x/D\geqslant 5$
, the results are seen to be almost independent of Reynolds number. At the same time, the mean velocity deficit seems to asymptote to a constant value with increasing distance downstream, although the maximum turbulence level is still decreasing. This is in accord with previous studies that have noted the slow approach to self-similarity in wakes with increasing downstream distance. This issue was considered in terms of the SUBOFF wake by Jiménez et al. (Reference Jiménez, Hultmark and Smits2010a
), and for the wake of a disk by Johansson & George (Reference Johansson and George2006).
Contours of
 $u_{rms}/U$
for the 1:240 scale model for a pitch angle of
 $8^{\circ }$
at
 $x/D=2$
, 5, 8, 11, 14;
 $\mathit{Re}_{L}=2.4\times 10^{6}$
(a);
 $4.8\times 10^{6}$
(b);
 $9.5\times 10^{6}$
(c);
 $19.5\times 10^{6}$
(d).

(a) Minimum value of
 $U/U_{\infty }$
for the 1:240 scale model in the cross-stream plane. (b) Maximum value of
 $u_{rms}/U$
in the cross-stream plane.

6. Wake development in pitch
If we accept that asymmetry is an unavoidable feature of the wake, it is of interest to examine the development of the wake as the pitch angle is changed. These tests were performed for the 1:120 scale model at
 $\mathit{Re}_{L}=2.4\times 10^{6}$
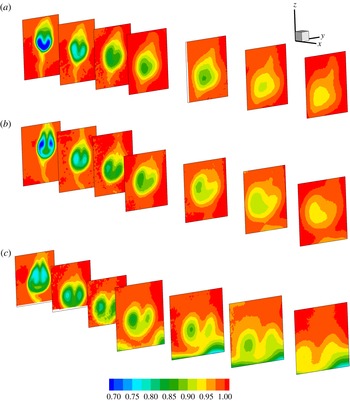
in the conventional wind tunnel. The streamwise velocity distributions for
 ${\it\alpha}=4^{\circ }$
,
 $8^{\circ }$
and
 $12^{\circ }$
are shown in figure 22 for each of the seven downstream locations. It is immediately apparent that the asymmetry about the longitudinal plane of symmetry of the model develops with distance downstream. The asymmetry is already apparent at
 ${\it\alpha}=4^{\circ }$
, although at
 ${\it\alpha}=8^{\circ }$
the vortices are stronger and the asymmetry is more obvious. For
 ${\it\alpha}=12^{\circ }$
we see that the vortices first encounter the boundary layer of the wind tunnel at
 $x/D=11$
, and so the data beyond this point (at this pitch angle) were discarded. We see that at
 $12^{\circ }$
, the velocity deficit in the wake is actually smaller than for
 ${\it\alpha}=8^{\circ }$
. This result is surprising given that one would expect the vortices to have progressively greater circulation due to a greater amount of vorticity being entrained into their cores from the body boundary layer, leading to a larger velocity deficit in the wake. It is possible, of course, that the separation occurs earlier for
 ${\it\alpha}=12^{\circ }$
than
 ${\it\alpha}=8^{\circ }$
and so the start of the wake essentially shifts upstream.
Contours of
 $U/U_{\infty }$
at
 $x/D=2$
, 5, 8, 11, 16, 21 and 26; (a)
 ${\it\alpha}=4^{\circ }$
, (b)
 $8^{\circ }$
, (c)
 $12^{\circ }$
. Flow is from left to right. The results are for the 1:120 scale model at
 $\mathit{Re}_{L}=2.4\times 10^{6}$
.

Figure 23 is typical of the pitch angle behaviour, in that the streamwise velocity and the vorticity fields are coincident. The asymmetry in strength between the two vortices is clearly visible, causing a precession of the vortices. High in-plane velocities are seen, due to the strong jet induced by the vortex pair, and the jet entrains flow from the free stream. The main vortices decay relatively quickly by diffusion, and by the furthest downstream location (
 $x/D=21$
), the vorticity is no longer concentrated in distinct cores.
Pitch:
 ${\it\alpha}=8^{\circ }$
. Contours of mean velocity
 $U/U_{\infty }$
(a,c,e) and mean vorticity
 ${\it\omega}D/U_{\infty }$
(b,d,f) at
 $x/D=2$
(a,b),
 $x/D=11$
(c,d) and
 $x/D=24$
(e,f). The results are for the 1:120 scale model at
 $\mathit{Re}_{L}=2.4\times 10^{6}$
.

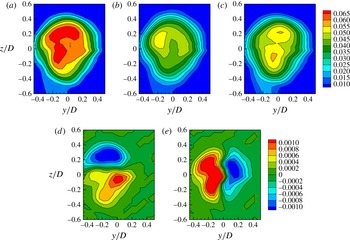
The wake exhibits significantly higher turbulence levels at
 ${\it\alpha}=8^{\circ }$
compared with the zero-pitch, zero-yaw case shown in figure 24. The highest streamwise turbulence intensities are visible in the vortex cores, and
 $\overline{uv}$
is large due to the shear created by the strong jet of velocity between the two vortices. In addition, the largest value of
 $\overline{uw}/U^{2}$
coincides with the region of highest in-plane velocity, as would be expected.
Pitch:
 ${\it\alpha}=8^{\circ }$
. Crossed-wire measurements of the normal and Reynolds stresses at
 $x/D=8$
. The normal stresses are
 $\sqrt{\overline{u^{2}}}/U$
(a),
 $\sqrt{\overline{v^{2}}}/U$
(b) and
 $\sqrt{\overline{w^{2}}}/U$
(c). The Reynolds stresses are
 $\overline{uv}/U^{2}$
(d) and
 $\overline{uw}/U^{2}$
(e). The results are for the 1:120 scale model at
 $\mathit{Re}_{L}=2.4\times 10^{6}$
.

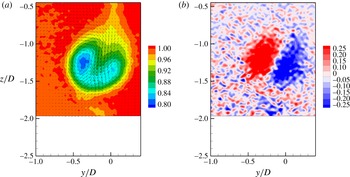
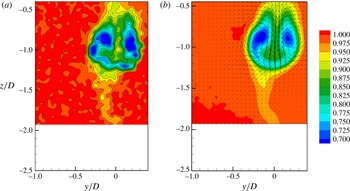
Up to this point we have only examined the time-averaged velocity fields. Figure 25 shows a comparison between a sample instantaneous snapshot of the velocity field and the time-averaged velocity field. It appears that the instantaneous and mean vortex core locations are almost coincident, suggesting that vortex meandering is not a strong feature of the wake in pitch. This also suggests that the asymmetry occurs instantaneously and is not a result of a meandering wake that is simply being time-averaged to appear asymmetric, as was suggested by Fu, Atsavapranee & Hess (Reference Fu, Atsavapranee and Hess2002).
Comparison between a representative instantaneous snapshot of the velocity field (a) and the time-averaged velocity field (b) at
 $x/D=2$
for
 ${\it\alpha}=8^{\circ }$
. The results are for the 1:120 scale model at
 $\mathit{Re}_{L}=2.4\times 10^{6}$
.

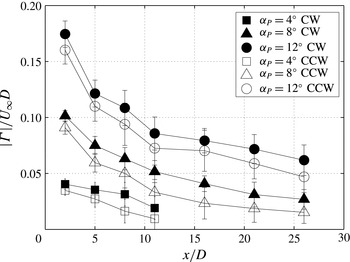
Figure 26 presents the clockwise (CW) and counterclockwise (CCW) circulations as they evolve downstream for all the pitch cases tested. To make the comparison more obvious, the figure shows the absolute value of the circulation strength. In pitch, the CW vortex is always stronger than the CCW vortex, by approximately 10 % for
 ${\it\alpha}=12^{\circ }$
, leading to the CW precession seen in figure 22. For the lower angles, the vortices become too diffuse to track beyond a certain downstream location and therefore the circulation could not be accurately estimated. At
 ${\it\alpha}=12^{\circ }$
the vortices impinge on the wind tunnel boundary layer starting at
 $x/D=11$
. Even though the vortices are still visible (shown in figure 22), the circulation calculation will be influenced by the boundary layer. The ‘error’ bars shown in figure 26 represent one standard deviation of the instantaneous circulation from the mean circulation (equal to approximately
 $\pm 15\,\%$
of the mean value). We note that some of this deviation is due to the integration contour, chosen for the time-averaged vorticity field and kept constant over the 400 ensembles measured. Nevertheless, the instantaneous circulation is reasonably close to the time-averaged value, and helps to confirm our conclusion from figure 25.
Mean circulation estimates in pitch: ▫,
 ${\it\alpha}=4^{\circ }$
; ▵,
 ${\it\alpha}=8^{\circ }$
; ○,
 ${\it\alpha}=12^{\circ }$
. Open symbols represent CCW vortices and filled symbols represent CW vortices. The results are for the 1:120 scale model at
 $\mathit{Re}_{L}=2.4\times 10^{6}$
.

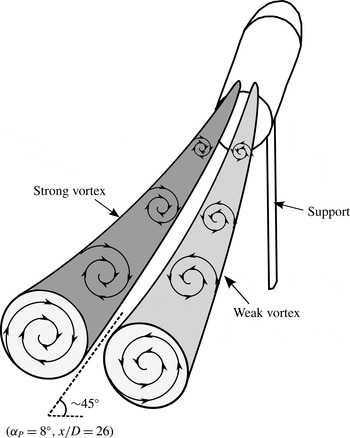
A schematic depicting the different vortex trajectories for pitch is shown in figure 27. It shows how a relatively small asymmetry in strength (
 ${\approx}10\,\%$
) translates to a significant rotation as the vortices develop downstream.
Sketch to illustrate the vortex trajectories in pitch.

7. Conclusions
Experiments were conducted to examine the wake of the DARPA SUBOFF idealized submarine model in pitch. Two different-sized models were tested in two different wind tunnels. For both models, at all angles of pitch and Reynolds numbers considered here, we observed an asymmetric pair of vortices in the wake, even though the experiments were designed to be symmetrical in all aspects. The asymmetry was present in the time-averaged and instantaneous fields, and circulation measurements indicated that the circulation of the CW vortex was consistently approximately 10 % to 20 % stronger than that of the CCW vortex.
The asymmetry seen in our experiments was remarkably robust under a variety of perturbations. Variations in the trip-wire diameter, the addition of discrete surface roughness elements designed to distort the separation locations, changing the level of free stream turbulence and changing the yaw and roll angles of the model did not materially affect the degree of asymmetry. Changing the model, the wind tunnel and increasing the Reynolds number to an order of magnitude larger than previous studies of the pitched wake did not eliminate the asymmetry either, although the precise nature of the asymmetry could be somewhat different.
It is possible, therefore, that the asymmetry had its origin in a convective instability in the flow, as suggested by the analysis of Keener & Chapman (Reference Keener and Chapman1977) and Bridges (Reference Bridges2008). The asymmetry may be due to small differences in the separation locations on the left and right of the body which are amplified as the flow evolves downstream. Alternatively, Jiménez et al. (Reference Jiménez, Hultmark and Smits2010a
) observed that in the axisymmetric case (no pitch or yaw), a low-wavenumber peak was present in the spectra of the streamwise velocity component for
 $\mathit{Re}_{L}\geqslant 12\times 10^{6}$
, corresponding to a Strouhal number of
 $St=fD/U_{\infty }\approx 0.2$
. They noted that this peak may indicate the presence of a coherent shedding process in the wake. It is possible that this shedding process may play a role in developing the asymmetries seen in the pitched case, since shedding from axisymmetric bodies is known to be very sensitive to small disturbances (Perry & Lim Reference Perry and Lim1978).
The asymmetry is surprising given that it was generated by an axisymmetric blunt-nosed body of revolution at low and moderate pitch angles. We note that it is similar to the well-known wake asymmetry phenomenon for sharp-nosed bodies at large angles of attack (Bridges Reference Bridges2008). As a result of the asymmetry, we expect that additional forces and moments (especially a net rolling moment) could occur on bodies of revolution, including submarines, even at low and moderate pitch angles.
We also conclude that Reynolds number independence is achieved for the pitched wake (at a given downstream location) in both the mean velocity and the turbulent velocity fluctuations for
 $\mathit{Re}_{L}>4.8\times 10^{6}$
and
 $x/D\geqslant 5$
.
Acknowledgements
We would like to thank T. Hohman and M. Alaoui for their assistance in the flow visualizations and wind tunnel experiments, and G. Northey, M. Vocaturo and D. Hoffman for their patient technical assistance. This work was supported by ONR grants N00014-09-1-0263 and N00014-13-1-0174 (Program Manager R. Joslin).