

Introduction
Social anxiety disorder (SAD) involves an excessive fear or avoidance of social situations such as going to a party, talking to people in authority or initiating a date, and performance situations such as public speaking or eating in front of others (APA, 1994; Bandelow & Stein, Reference Bandelow and Stein2004). SAD is associated with substantial co-morbidity, psychosocial impairment and poor quality of life (Grant et al. Reference Grant, Hasin, Blanco, Stinson, Chou, Goldstein, Dawson, Smith, Saha and Huang2005). The estimated lifetime and 12-month prevalence of SAD are 5.0–12.1% and 2.8–7.1%, respectively (Kessler et al. Reference Kessler, McGonagle, Zhao, Nelson, Hughes, Eshleman, Wittchen and Kendler1994; Magee et al. Reference Magee, Eaton, Wittchen, McGonagle and Kessler1996; Grant et al. Reference Grant, Hasin, Blanco, Stinson, Chou, Goldstein, Dawson, Smith, Saha and Huang2005), making SAD one of the most prevalent psychiatric disorders in the general population.
Despite the high prevalence and associated personal and societal burden of SAD, few studies have examined the latent structure underlying its symptoms, i.e. a latent factor model which could explain the degree of association across different social fears. The few published studies have obtained a variety of results, supporting the existence of one (Ruscio et al. Reference Ruscio, Brown, Chiu, Sareen, Stein and Kessler2008), three (Safren et al. Reference Safren, Turk and Heimberg1998; Sakurai et al. Reference Sakurai, Nagata, Harai, Yamada, Mohri, Nakano, Noda, Ogawa, Lee and Furukawa2005), four (Safren et al. Reference Safren, Heimberg, Horner, Juster, Schneier and Liebowitz1999; Oakman et al. Reference Oakman, Van Ameringen, Mancini and Farvolden2003) and five (Perugi et al. Reference Perugi, Nassini, Maremmani, Madaro, Toni, Simonini and Akiskal2001) factors. Although those studies used different numbers of items [from 14 in the study by Ruscio et al. (Reference Ruscio, Brown, Chiu, Sareen, Stein and Kessler2008) to 40 in the study by Sakurai et al. (Reference Sakurai, Nagata, Harai, Yamada, Mohri, Nakano, Noda, Ogawa, Lee and Furukawa2005)] and different instruments to conduct their analyses, they have identified factors assessing similar domains including social interaction anxiety, fears of being observed, and public speaking fear. Previous studies have generally been conducted in small, geographically localized, clinical samples, making the results difficult to extrapolate to the general population. Only two studies have been carried out in representative community samples (Cox et al. Reference Cox, Clara, Sareen and Stein2008; Ruscio et al. Reference Ruscio, Brown, Chiu, Sareen, Stein and Kessler2008). Ruscio et al. (Reference Ruscio, Brown, Chiu, Sareen, Stein and Kessler2008), using data from the National Comorbidity Survey Replication (NCS-R), found that a single factor provided a good fit to the covariances observed among social fears but did not examine whether the factor structure (including the number of factors) was the same in individuals with SAD versus those with social fears who did not meet Diagnostic and Statistical Manual of Mental Disorders, 4th Edition (DSM-IV) criteria for SAD. In another study, Cox et al. (Reference Cox, Clara, Sareen and Stein2008) focused on the factor structure of social fears among individuals with SAD, also using the NCS-R database and cross-validating their results with data from the Canadian Community Health Survey on Mental Health and Wellbeing. Cox et al. (Reference Cox, Clara, Sareen and Stein2008) identified three factors, representing social interaction fears, fears of being observed, and public speaking fears. They explained the discrepancy between their results and those of Ruscio et al. (Reference Ruscio, Brown, Chiu, Sareen, Stein and Kessler2008) as a result of differences in sample selection. Cox et al. (Reference Cox, Clara, Sareen and Stein2008) only studied those respondents who met DSM-IV criteria for a lifetime diagnosis of SAD, whereas Ruscio et al. (Reference Ruscio, Brown, Chiu, Sareen, Stein and Kessler2008) studied the whole sample. Neither study examined the relationship of sociodemographic characteristics to social fears or the roles they play in relation to the underlying latent factors.
We sought to advance our understanding of the latent structure of SAD in the community using data from the National Epidemiological Survey on Alcohol and Related Conditions (NESARC), a large psychiatric epidemiological study of US adults. Because of differences in the literature regarding the latent structure of social fears using different data sources, our first aim was to compare within the same data set, and thus controlling for methodology, the latent structure of individuals with SAD and those with social fears but who did not meet DSM-IV criteria for SAD. A difference in the factor structure underlying fears among those with SAD and those without SAD would provide insight into psychological or biological differences in the mechanisms underlying the fears experienced by these two groups. On the other hand, if the factor structure of fears for those with SAD were no different than those without, this would suggest that there is nothing unique about the pattern of fears seen in those with SAD as compared with those with non-pathological social fears or in the mechanisms underlying those fears.
Furthermore, because the prevalence, course and phenomenology of SAD vary across sociodemographic characteristics (Grant et al. Reference Grant, Hasin, Blanco, Stinson, Chou, Goldstein, Dawson, Smith, Saha and Huang2005; Blanco et al. Reference Blanco, Xu, Schneier, Okuda, Liu and Heimberg2011; Polo et al. Reference Polo, Alegria, Chen and Blanco2011; Xu et al. Reference Xu, Schneier, Heimberg, Princisvalle, Liebowitz, Wang and Blanco2011), our second aim was to examine the relationships between the latent structure of social fears and a broad range of sociodemographic characteristics and to test whether some sociodemographic groups tended to be higher or lower on the underlying latent factors or to have higher or lower prevalence of certain social fears than predicted based on the latent factor model. This aim fills a gap in the literature by indicating whether certain groups are more or less likely to experience certain fears. Moreover, the investigation of differences between the frequencies of fears predicted by the latent factor model and those observed for some sociodemographic groups (i.e. known as testing for uniform invariance) will provide insight into whether there is variability in fear profiles for some sociodemographic groups.
Method
Sample
The 2001–2002 NESARC is an assessment of a representative sample of the US population conducted by the National Institute on Alcohol Abuse and Alcoholism (NIAAA). The NESARC target population was the civilian population residing in households or group living quarters, aged 18 years and older. Face-to-face interviews were conducted with 43 093 respondents. The survey response rate was 81%. Blacks, Hispanics and young adults (aged 18–24 years) were oversampled, with data adjusted for oversampling and household- and person-level non-response. The weighted data were then adjusted to represent the US civilian population based on the 2000 Census.
DSM-IV diagnostic interview
The diagnostic interview used to generate diagnoses was the NIAAA Alcohol Use Disorder and Associated Disabilities Interview Schedule-DSM-IV Version (AUDADIS-IV). This structured diagnostic interview, designed for lay professional interviewers, was developed to advance measurement of substance use and mental disorders in large-scale surveys.
Consistent with the DSM-IV, a diagnosis of SAD required a marked or persistent fear of at least one of 14 social or performance situations (including a residual ‘other situation’ category). Exposure to the situation must have almost invariably provoked anxiety (which may have taken the form of a situationally bound or predisposed panic attack), the feared social situation must have been avoided or endured with intense anxiety, and the fear had to be recognized as excessive or unreasonable. All diagnoses of SAD required that the DSM-IV clinical significance criterion be met (i.e. symptoms of the disorder must have caused clinically significant distress and/or impairment in social, occupational, or other areas of functioning). As reported elsewhere (Grant et al. Reference Grant, Dawson, Stinson, Chou, Kay and Pickering2003), test–retest reliability of SAD diagnoses was fair (κ = 0.46), which compares favorably with the test–retest reliability for instruments used in other large epidemiological surveys (Kessler et al. Reference Kessler, Chiu, Demler, Merikangas and Walters2005; Ruscio et al. Reference Ruscio, Brown, Chiu, Sareen, Stein and Kessler2008).
Statistical analysis
Because several factor structures have been identified in previous analyses of different samples, we performed exploratory factor analysis (EFA) of the 13 specific social/performance situations (i.e. excluding the residual ‘other situation’ category, due to its heterogeneity) using the whole NESARC sample and then in the subgroups of individuals with SAD (n = 1956 after dropping 27 respondents with SAD who endorsed only ‘other situations’, which could not be analysed as a coherent fear category), and individuals with one or more feared situations but who did not meet criteria for a diagnosis of SAD (n = 3088). One- to five-factor EFA models using geomin oblique rotation were fit in the full sample and in the two subgroups. The number of underlying factors for the full sample and each subgroup was determined based on the eigenvalues of the tetrachoric correlation matrices, interpretability of the EFA factors by examining loadings >0.40, and the goodness-of-fit measures including the comparative fit index (CFI), Tucker–Lewis index (TLI), and root mean squared error of approximation (RMSEA). Hu et al. (Reference Hu, Bentler and Kano1992) recommended CFI and TLI values above 0.95, and RMSEA values below 0.06, as representing good model fit.
After determining the number of factors in the two subgroups, multiple group EFA (Dolan et al. Reference Dolan, Ooort, Stoel and Wicherts2009), using exploratory structural equation modeling (ESEM) (Muthén and Muthén, Reference Muthén and Muthén1998–2006; Asparouhov & Muthén, Reference Asparouhov and Muthén2009; Marsh et al. Reference Marsh, Muthén, Asparohov, Lüdtke, Robitzsch, Morin and Trautwein2009), was used to test measurement invariance of the fears with respect to group. Specifically, configural (i.e. same fears load on same factors across groups) and weak (i.e. factor loadings equal across groups) invariances were assessed (see Supplementary material). Given a finding of ESEM measurement invariance between the two subgroups (i.e. the same number of factors and equivalent loadings of fear situations onto those factors), an additional EFA was then fit to the combined sample of individuals with at least one feared situation (n = 5044).
The factor structure suggested by the EFA was then tested using confirmatory factor analysis (CFA), in which each feared situation was chosen to load on the factor on which it had the largest loading in the EFA. CFI, TLI and RMSEA were again used to assess the goodness of fit of the CFA. In the current study we chose not to implement cross-validation (e.g. fit EFA models on half the data, then CFA on the other half). Given this study's very large sample size weighted to the national population, there is little sampling variability expected and so it is highly unlikely that different factor solutions would emerge from random halves.
Finally, a multiple indicators multiple causes (MIMIC) approach (Muthén and Muthén, Reference Muthén and Muthén1998–2006) was used to regress the common factors on sociodemographic covariates chosen based on existing literature suggesting their association with differences in the prevalence, phenomenology and course of SAD (Hart et al. Reference Hart, Turk, Heimberg and Liebowitz1999; Stein & Kean, Reference Stein and Kean2000; Fink et al. Reference Fink, Akimova, Spindelegger, Hahn, Lanzenberger and Kasper2009; Moitra et al. Reference Moitra, Beard, Weisberg and Keller2011; Hsu et al. Reference Hsu, Woody, Lee, Peng, Zhou and Ryder2012). The MIMIC approach allows simultaneous examination of several covariates. It provides an alternative to multiple group testing, which requires the creation of mutually exclusive groups (e.g. males versus females) that can be cumbersome when multiple covariates are examined. Standardized estimates of the direct relationship between covariates and the latent factors indicate how many standard deviations higher (or lower) the mean of the latent factor is expected to be for each level of the categorical covariates or for a one standard deviation increase in the continuous covariate (age) while holding all other covariates constant. Statistical significance of the covariate effects on factors was determined when p values were less than 0.01.
The MIMIC model was further used to identify whether any additional direct effects from covariates to specific social/performance situation were warranted, indicating a lack of uniform invariance (intercept invariance) in the relationship between the social/performance situation and the latent factor across specific covariates. Following conventions for testing these additional direct paths (Stark et al. Reference Stark, Chernyshenko and Drasgow2006; Kim et al. Reference Kim, Yoon and Lee2011), we used a conservative modification index (MI) cut-off of 15.2 corresponding to a χ 2 test with 1 degree of freedom and a p value of 0.01/104 = 0.0001 which was Bonferoni corrected based on the 104 tests of eight covariate categories by 13 social/performance situations.
All analyses where conducted in Mplus version 6.1 (Muthén and Muthén, Reference Muthén and Muthén1998–2006), which takes into account the NESARC sampling weights and design effects in all analyses, including parameter as well as standard error estimation and model fit calculations. The default estimator for the analysis was weighted least squares using a diagonal weight matrix (WLSMV) accompanied by standard errors and mean- and variance-adjusted χ 2 test statistics that use a full weight matrix. The WLSMV is a robust estimator that does not assume normally distributed variables and provides the best option for modeling categorical or ordered data. The final confirmatory model was also refit without incorporating the sampling weights to ensure the robustness of the results.
Results
Sociodemographic characteristics of the sample
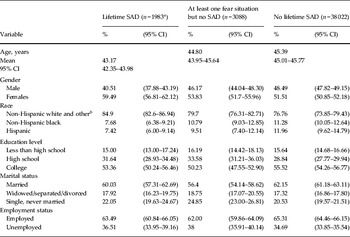
There were 1983 individuals with lifetime SAD, 3088 with one or more social fears but no SAD, and 38 022 individuals with no lifetime SAD (or social fears). Individuals with lifetime SAD were, on average, younger than those with one social fear but no SAD who, in turn, were younger than those with no lifetime SAD. The difference in the proportion of women versus men was largest in the SAD group, intermediate in those with one social fear, and smallest among those with no lifetime SAD. Most individuals in the sample had at least some college education, and this was true of all three groups. Similarly, most individuals in all three groups were married, although the proportion of never-married individuals was slightly higher among individuals who endorsed at least one social fear or met criteria for lifetime SAD than in the no lifetime SAD group. Finally, having a lifetime history of SAD or one or more social fears was also associated with a lower probability of employment (Table 1).
Sociodemographic characteristics

SAD, Social anxiety disorder; CI, confidence interval.
a Individuals with SAD based on a feared situation from the category ‘other’ (n = 27) are included here but not in the following tables examining the 13 specific feared situations.
b ‘Other’ includes 6% combined Native American and Asian/Pacific Islander.
EFAs
Of the 13 lifetime social fears, the most commonly endorsed across the whole sample was ‘speaking or talking in front of other people’ (10.1%), and the least common was ‘being in a small group situation’ (1.4%).
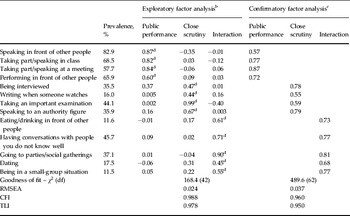
One large eigenvalue, 11.0, was found for the tetrachoric correlation matrix of the 13 fear situations in the full sample, with all other eigenvalues less than 1. This finding in the full sample is strongly suggestive of one underlying factor (correlations between items range: 0.73–0.98) but is highly influenced by the large number of individuals (>88%) with all zero values on the 13 items. That is, when those individuals with all zeros are removed, the eigenvalues and correlations change substantially as described below. The EFA results for the full sample are shown in Supplementary Table S1. Whereas the one-factor model fits very well (RMSEA = 0.021, CFI = 0.999, TLI = 0.999), the factor loadings of the two-factor model yielded interpretable factors, including one factor that combined fears of public performance and close scrutiny, whereas the other included fears of interactions. The three-, the four- and the five-factor models did not further yield separate interpretable factors within the full sample. Specifically, factor 3 in the three-factor model, factor 4 in the four-factor model and factors 4 and 5 in the five-factor model did not have any items with loadings ⩾0.4, and factor 3 in the four-factor model only had two items with loadings ⩾0.4.
Because of the potential for salient underlying structure of the SAD criteria to go undetected when using the full sample with a large proportion of individuals with all zero values, we next examined the factor structure in subgroups endorsing at least one social fear. The first three eigenvalues for the subgroup with SAD ⩾1.0 were: 5.45, 1.99 and 1.17. Similarly, for the subgroup with at least one feared situation but without SAD, there were also only three eigenvalues > 1.0: 4.48, 2.33 and 1.16. Supplementary Table S2 shows the EFA results for the one- to five-factor models in both subgroups. In both groups, the one- and two-factor models did not meet the thresholds for all of the goodness-of-fit criteria, but the three-factor models did (three-factor EFA model: SAD, RMSEA = 0.033, CFI = 0.980, TLI = 0.962; at least one fear but not SAD, RMSEA = 0.022, CFI = 0.985, TLI = 0.971). As expected, the more complex four-factor and five-factor models improved the goodness of fit even further, but the additional factors were deemed to be not broadly interpretable.
Because the three-factor model was the one that best fit the data and the resultant factors were clinically interpretable we focused on this model in subsequent analyses. The ESEM for testing measurement invariance of the three-factor EFA models between the two subgroups found for the unconstrained model a χ 2 = 232 (df = 84), and the constrained model χ 2 = 245 (df = 114), resulting in a robust χ 2 difference value of 54.7 (df = 30; p = 0.004) (note the robust χ 2 difference is not simply the difference of the χ 2) (Asparouhov & Muthén, Reference Asparouhov and Muthén2006). Furthermore, the CFI for the unconstrained model was 0.984 and the CFI for the model with loadings constrained to be the same across groups was 0.982. Thus with a CFI difference <0.01, we concluded that the two subgroups did not differ significantly in the configuration of their three-factor structure and the magnitude of their loadings and present the result of the EFA in the combined group with at least one feared situation in Table 2.
Exploratory and confirmatory factor analysis results for individuals with at least one feared social/performance situation (n = 5044) a

df, Degrees of freedom; RMSEA, root mean squared error of approximation; CFI, comparative fit index; TLI, Tucker–Lewis index; ESEM, exploratory structural equation modeling; SAD, social anxiety disorder.
a Multiple group ESEM showed no significant difference in the three-factor structure between the individuals with SAD and those with at least one feared situation but no SAD (see text); thus they are combined.
b Geomin oblique rotated factor loadings.
c Estimated correlation between factors in confirmatory factor analysis: ‘public performance’ with ‘close scrutiny’ = 0.65, with ‘interaction’ = 0.40, ‘close scrutiny’ with ‘interaction’ = 0.71.
d To help facilitate interpretation, values larger than 0.40 are indicated.
CFAs and MIMIC models
A CFA with three factors, which based on their content we named ‘public performance’, ‘close scrutiny’ and ‘interaction’, was fitted. The three factors were moderately to highly correlated, with ‘close scrutiny’ being correlated 0.65 with ‘public performance’ and 0.71 with ‘interaction’; ‘public performance’ and ‘interaction’ were correlated at 0.40. This model had good fit (RMSEA = 0.037, CFI = 0.960, TLI = 0.950) (Table 2). When the model was refit without sampling weights, the factor loadings were the same to the second decimal place, CFI and TLI were identical, and RMSEA = 0.051.
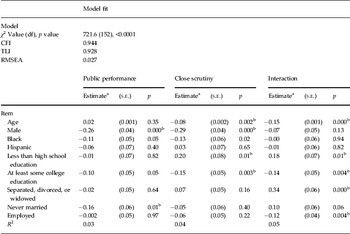
The MIMIC model, including the different effects of sociodemographic variables on the factors and the direct effects of sociodemographic variables on each social fear also demonstrated good fit (RMSEA = 0.028, CFI = 0.946, TLI = 0.931) (Table 3). Age and marital status were significant predictors of the ‘interaction’ factor, such that being younger and separated, widowed, or divorced predicted higher scores on this factor. Gender was a significant predictor of ‘public performance’ and ‘close scrutiny’, such that women were approximately 0.26–0.29 s.d. higher on each factor. Older age and more education were significantly associated with lower scores on both the ‘close scrutiny’ and ‘interaction’ factors. Furthermore, being separated, widowed or divorced was associated with a 0.34 s.d. increase in the ‘interaction’ factor. Overall there was only very minimal variation (2.9–4.7%) in the three latent factors explained by the demographic covariates.
MIMIC model in individuals with one or more fears with or without SAD (n = 5044)

MIMIC, Multiple indicators multiple causes; SAD, social anxiety disorder; df, degrees of freedom; CFI, comparative fit index; TLI, Tucker–Lewis index; RMSEA, root mean squared error of approximation; s.e., standard error.
a Estimates represent the standard deviation change in the latent factors associated with the presence of the particular binary predictor versus the referent category, except for age which is modeled continuously and thus represents the standard deviation change in the latent factors associated with a one standard deviation change in age.
b p < 0.05.
Of the 104 tests for invariance of specific fears as a function of each of the demographic covariates, only three met the critical value for statistical significance. Males were more likely to experience fear associated with dating than would be explained by the ‘interaction’ latent factor (MI = 26.2), blacks were less likely to experience fear from speaking to an authority figure than predicted by the ‘close scrutiny’ factor (MI = 20.1), and increased age was associated with higher than expected fear of taking an important examination than predicted by the ‘close scrutiny’ factor (MI = 15.3).
Discussion
This is the first study to examine the latent structure of social fears among individuals with SAD as well as individuals with social fears but no SAD, to examine whether their latent structure is similar, and to use MIMIC analyses to examine the relationship of sociodemographic characteristics with the latent factors. We highlight three major findings. First, the factor structure of SAD was best described by three correlated factors. Second, the factor structure was the same when considering all individuals who endorsed a social fear as when restricting the analyses to those who met criteria for a DSM-IV diagnosis of SAD. Examination of the factor structure of these subgroups allowed us to reconcile apparently contradictory findings from previous large epidemiological studies. Third, most sociodemographic characteristics had very limited or no effect on the factor structure of SAD.
The latent structure of SAD was best described by three factors: (1) ‘public performance’; (2) ‘close scrutiny’; and (3) ‘interaction’. Our findings are consistent with those obtained by Cox et al. (Reference Cox, Clara, Sareen and Stein2008), who also identified three factors reflecting similar dimensions: (a) a social interaction fears factor, which appears similar to our ‘interaction’ factor; (b) an observation fears factor, which appears similar to our ‘close scrutiny’ factor; and (c) a public speaking fears factor, which appears similar to our ‘public performance’ factor.
The factors identified by our study seem to identify underlying dimensions similar to those in previous studies using different methodological approaches. For example, Safren et al. (Reference Safren, Turk and Heimberg1998, Reference Safren, Heimberg, Horner, Juster, Schneier and Liebowitz1999), analysing two self-report scales, the Social Interaction Anxiety Scale and the Social Phobia Scale, and then the Liebowitz Social Anxiety Scale, identified factors named ‘observation by others’, ‘public speaking’ and ‘anxiety about being observed by others’, which, as Sakurai's ‘scrutiny fears’ (Sakurai et al. Reference Sakurai, Nagata, Harai, Yamada, Mohri, Nakano, Noda, Ogawa, Lee and Furukawa2005) and Perugi's ‘formal speaking anxiety’ (Perugi et al. Reference Perugi, Nassini, Maremmani, Madaro, Toni, Simonini and Akiskal2001), are very similar to our ‘public performance’. The convergence of these findings suggests that SAD may have certain underlying dimensions, possibly with their own neurobiological substrates that may be amenable to more targeted psychological or pharmacological treatments. They seem to represent three different aspects of the fear: the collective rejection implied by ‘public performance’, the individual rejection by someone considered an authority in the case of ‘close scrutiny’, and the rejection by someone in the individual's social world in the ‘interaction’ factor. Future studies should examine potential correlations of these factors with specific brain areas or circuits, as was recently done for latent factors within major depression (Milak et al. Reference Milak, Parsey, Keilp, Oquendo, Malone and Mann2005), or examine the possible association of these factors with genes previously related to anxiety disorders (Gelernter et al. Reference Gelernter, Page, Stein and Woods2004) with environmental factors, or with treatment response. It is possible that the ‘interaction’ factor may be more closely related to brain circuits for the processing of empathy (e.g. mirror neurons) and other emotions, whereas ‘close scrutiny’ may be more related to areas implicated in the processing of threat signals. Identification of biological and psychological substrates underlying these factors may lead to more refined theoretical models of SAD that can improve our understanding and treatment of this disorder.
Our study, the first to examine the factor structure of social fears in both individuals with SAD and in the general population, found that the latent structure is the same in SAD as it is in the subset of the general population who experienced at least one social fear. A challenge for future classifications will be to determine which levels of severity should be considered pathological, i.e. with clinical significance, and suggest the need for treatment and what may be considered normal variations or even healthy levels of adaptation (Ruscio, Reference Ruscio2010). Cross-sectional distress and impairment measures or longitudinal studies of course and complications of SAD may provide some preliminary indications of how to evaluate the potential for a given degree of symptomatology to be clinically significant. Experience from other areas of medicine, such as the assessment of hypertension or cholesterol levels, suggests that progressive refinements of those cut-offs may be necessary as our knowledge of SAD increases (Lauer & Fontanarosa, Reference Lauer and Fontanarosa2001; Chobanian et al. Reference Chobanian, Bakris, Black, Cushman, Green, Izzo, Jones, Materson, Oparil, Wright and Roccella2003). Furthermore, by conducting our analyses in the full sample (i.e. including those with no social fears) as well as in those with at least one social fear, we were able to show that the way that samples were defined influenced the factor structure. These findings may also help to reconcile the findings of different numbers of factors identified in previous studies. In particular, they help to reconcile the findings of a one-factor structure in the study by Ruscio et al. (Reference Ruscio, Brown, Chiu, Sareen, Stein and Kessler2008), who examined the entire sample, and those of Cox et al. (Reference Cox, Clara, Sareen and Stein2008), who identified three factors in a sample limited to individuals with SAD.
A third finding from our study was that sociodemographic characteristics had a limited effect on the factors. Only three modification indices suggested the presence of direct effects from covariates to feared situations. The direct effect of age on taking an examination may be related to declining cognitive ability with age. It may also indicate that this item does not measure social anxiety in older populations because most individuals are less likely to take tests as they age. The direct effect of gender on dating is consistent with the clinical and social observation that men tend to feel more of a need to initiate dating interactions and that social anxiety may result in distress and interference in this area. By contrast, the direct effect of ethnicity on speaking to an authority figure may indicate that, after taking into account the effect of the ‘close scrutiny’ factor, blacks may feel less social anxiety regarding interactions with authority figures. Several authors have suggested that the prevalence or clinical presentation of SAD may vary by culture (Kirmayer, Reference Kirmayer1991; Lepine & Lellouch, Reference Lepine and Lellouch1995; Stein & Matsunaga, Reference Stein and Matsunaga2001; Hong & Woody, Reference Hong and Woody2007), but no prior study had examined invariance of the latent structure of SAD. Our study, by indicating that most sociodemographic characteristics examined had very limited or no effect on the structure of SAD, suggests that social fears tend to aggregate in similar ways in a broad range of populations. The robustness of these associations may help guide future research on the etiology and treatment of SAD and provide indirect support for the generalizability of findings of samples with limited sociodemographic variability. They also further support SAD as a valid nosological entity, an important consideration for future psychiatric classifications.
Our study has several limitations. First, our analyses focus on cross-sectional data and do not examine whether the described latent structures are stable over time. In particular, our analyses do not examine whether the factor loadings and composition are invariant between groups who do and do not respond to treatment. Examination of longitudinal data may help to elucidate this question and shed light on aspects of SAD that are affected by different treatment approaches. Second, because the NESARC sample only included civilians aged 18 years and older, information was unavailable on adolescents. Third, the NESARC is limited to individuals currently living in the USA, and its results may not generalize to individuals living in other countries. Future cross-national studies could help to test whether the findings of this investigation extend to other countries. Additionally, these data only allowed assessment of the structure of SAD in respect to scope of feared situations. Other cognitive, physiological and behavioral symptoms that might further define the structure of the disorder were not addressed by these analyses. Fourth, our analyses were based on 13 items. It is possible that inclusion of a different number of items may have yielded a different solution. However, our results converge with previous studies that have identified factors with similar content despite using different assessment instruments with a much larger number of items (Safren et al. Reference Safren, Turk and Heimberg1998; Sakurai et al. Reference Sakurai, Nagata, Harai, Yamada, Mohri, Nakano, Noda, Ogawa, Lee and Furukawa2005), suggesting that our results are robust.
In conclusion, the underlying structure of feared situations in SAD appears to be best described by three dimensions. Those dimensions are invariant across several levels of severity and sociodemographic characteristics. A challenge for future research will be the examination of biological and psychosocial determinants of those factors and their treatment implications.
Supplementary material
For supplementary material accompanying this paper visit http://dx.doi.org/10.1017/S0033291713000408.
Acknowledgements
This study is supported by National Institutes of Health (NIH) grants DA019606, DA020783, DA023200 and DA023973 (to C.B.) and the New York State Psychiatric Institute (to C.B. and F.R.S.).
Declaration of Interest
None.