1 Introduction
Thin films, characterised by a small ratio of film thickness to typical lateral length scale, arise in many applications on scales that range from the nanoscale to the macroscale. Recently, there has been much interest in instabilities of thin films on the nanoscale, in particular for polymeric films (see Seemann, Herminghaus & Jacobs Reference Seemann, Herminghaus and Jacobs2001a
; Sharma & Verma Reference Sharma and Verma2004; Jacobs, Seemann & Herminghaus Reference Jacobs, Seemann and Herminghaus2008); nematic liquid crystal (NLC) films (see Herminghaus et al.
Reference Herminghaus, Jacobs, Mecke, Bischof, Fery, Ibn-Elhaj and Schlagowski1998; Ziherl, Podgornik & Z̆umer Reference Ziherl, Podgornik and Z̆umer2000; Schlagowski, Jacobs & Herminghaus Reference Schlagowski, Jacobs and Herminghaus2002; van Effenterre & Valignat Reference van Effenterre and Valignat2003; Cazabat et al.
Reference Cazabat, Delabre, Richard and Sang2011); and metal films (see Favazza et al.
Reference Favazza, Trice, Kalyanaraman and Sureshkumar2007; Fowlkes et al.
Reference Fowlkes, Kondic, Diez and Rack2011), to name just a few examples. In many of the considered cases, the instabilities that develop are complicated by interplay of a number of different effects. On the nanoscale, these necessarily include fluid/solid interaction, often modelled by including in the governing equations a disjoining pressure term that plays an important role in determining the film stability. The relevant forms of the disjoining pressure may be rather complicated, reflecting, for example, complex Si/SiO
 $_{2}$
substrates in the case of polymer films (see Jacobs et al.
Reference Jacobs, Seemann and Herminghaus2008), or complex physics of the fluid/solid interaction in the case of metal films (see Ajaev & Willis Reference Ajaev and Willis2003; Wu et al.
Reference Wu, Fowlkes, Rack, Diez and Kondic2010, and the references therein). Often, it is convenient to include additional physical effects to form a so-called ‘effective disjoining pressure’; these may include additional forces of electromagnetic origin, such as for ferrofluids in electric or magnetic fields (see Seric, Afkhami & Kondic Reference Seric, Afkhami and Kondic2014). For NLC films, such effective disjoining pressure is often called a structural disjoining pressure, since it includes the elastic forces that are due to the local structure of the director field (molecular orientation). Most work on this type of problem is carried out within the framework of long-wave theory, which allows for simplifications of otherwise extremely complex free surface problems; we adopt this approach also.
There are a wide range of applications for thin films of NLCs due to their electric field response and optical properties (in particular, birefringence), one of the most widespread uses being in liquid crystal displays (LCDs). Due to the anisotropic features of the dielectric tensor in NLCs, very large refractive indices can be achieved, which can be used to overcome the resolution limits (diffraction limit) of a conventional optical lens (see Liu et al. Reference Liu, Lee, Xiong, Sun and Zhang2010). Electric fields may also be used to tune the dielectric tensor, allowing fine control over electromagnetic waves, a desired feature for a number of applications, including optical imaging, space communications and object detection by lasers (see Palffy-Muhoray Reference Palffy-Muhoray2012).
In the context of NLC films, there are several experimental studies of dewetting on the nanoscale (for example, Ziherl et al.
Reference Ziherl, Podgornik and Z̆umer2000; Schlagowski et al.
Reference Schlagowski, Jacobs and Herminghaus2002; van Effenterre & Valignat Reference van Effenterre and Valignat2003; Cazabat et al.
Reference Cazabat, Delabre, Richard and Sang2011). For thin NLC films deposited on SiO
 $_{2}$
wafers, the films were found to be unstable (dewetted) for a certain range of thicknesses, referred to as the ‘forbidden range’ by Cazabat et al. (Reference Cazabat, Delabre, Richard and Sang2011). Several different physical instability mechanisms have been proposed, and the discussion regarding the relevance of each is far from complete. Possibly relevant physical effects discussed in the literature include thermal effects (see Schlagowski et al.
Reference Schlagowski, Jacobs and Herminghaus2002; van Effenterre & Valignat Reference van Effenterre and Valignat2003) and the pseudo-Casimir effect (see Ziherl et al.
Reference Ziherl, Podgornik and Z̆umer2000), as well as the interplay of elastic and disjoining pressure already discussed above (see Vandenbrouck, Valignat & Cazabat Reference Vandenbrouck, Valignat and Cazabat1999).
The functional form of the (effective) disjoining pressure turns out to be similar for many of the set-ups discussed above; for example, for NLC films, the elastic effects lead to a disjoining pressure qualitatively similar to that found for polymer films on Si/SiO
 $_{2}$
substrates, or even for Newtonian films under inverted gravity conditions (hanging films); see Lin & Kondic (Reference Lin and Kondic2010), Lin et al. (Reference Lin, Kondic, Thiele and Cummings2013b
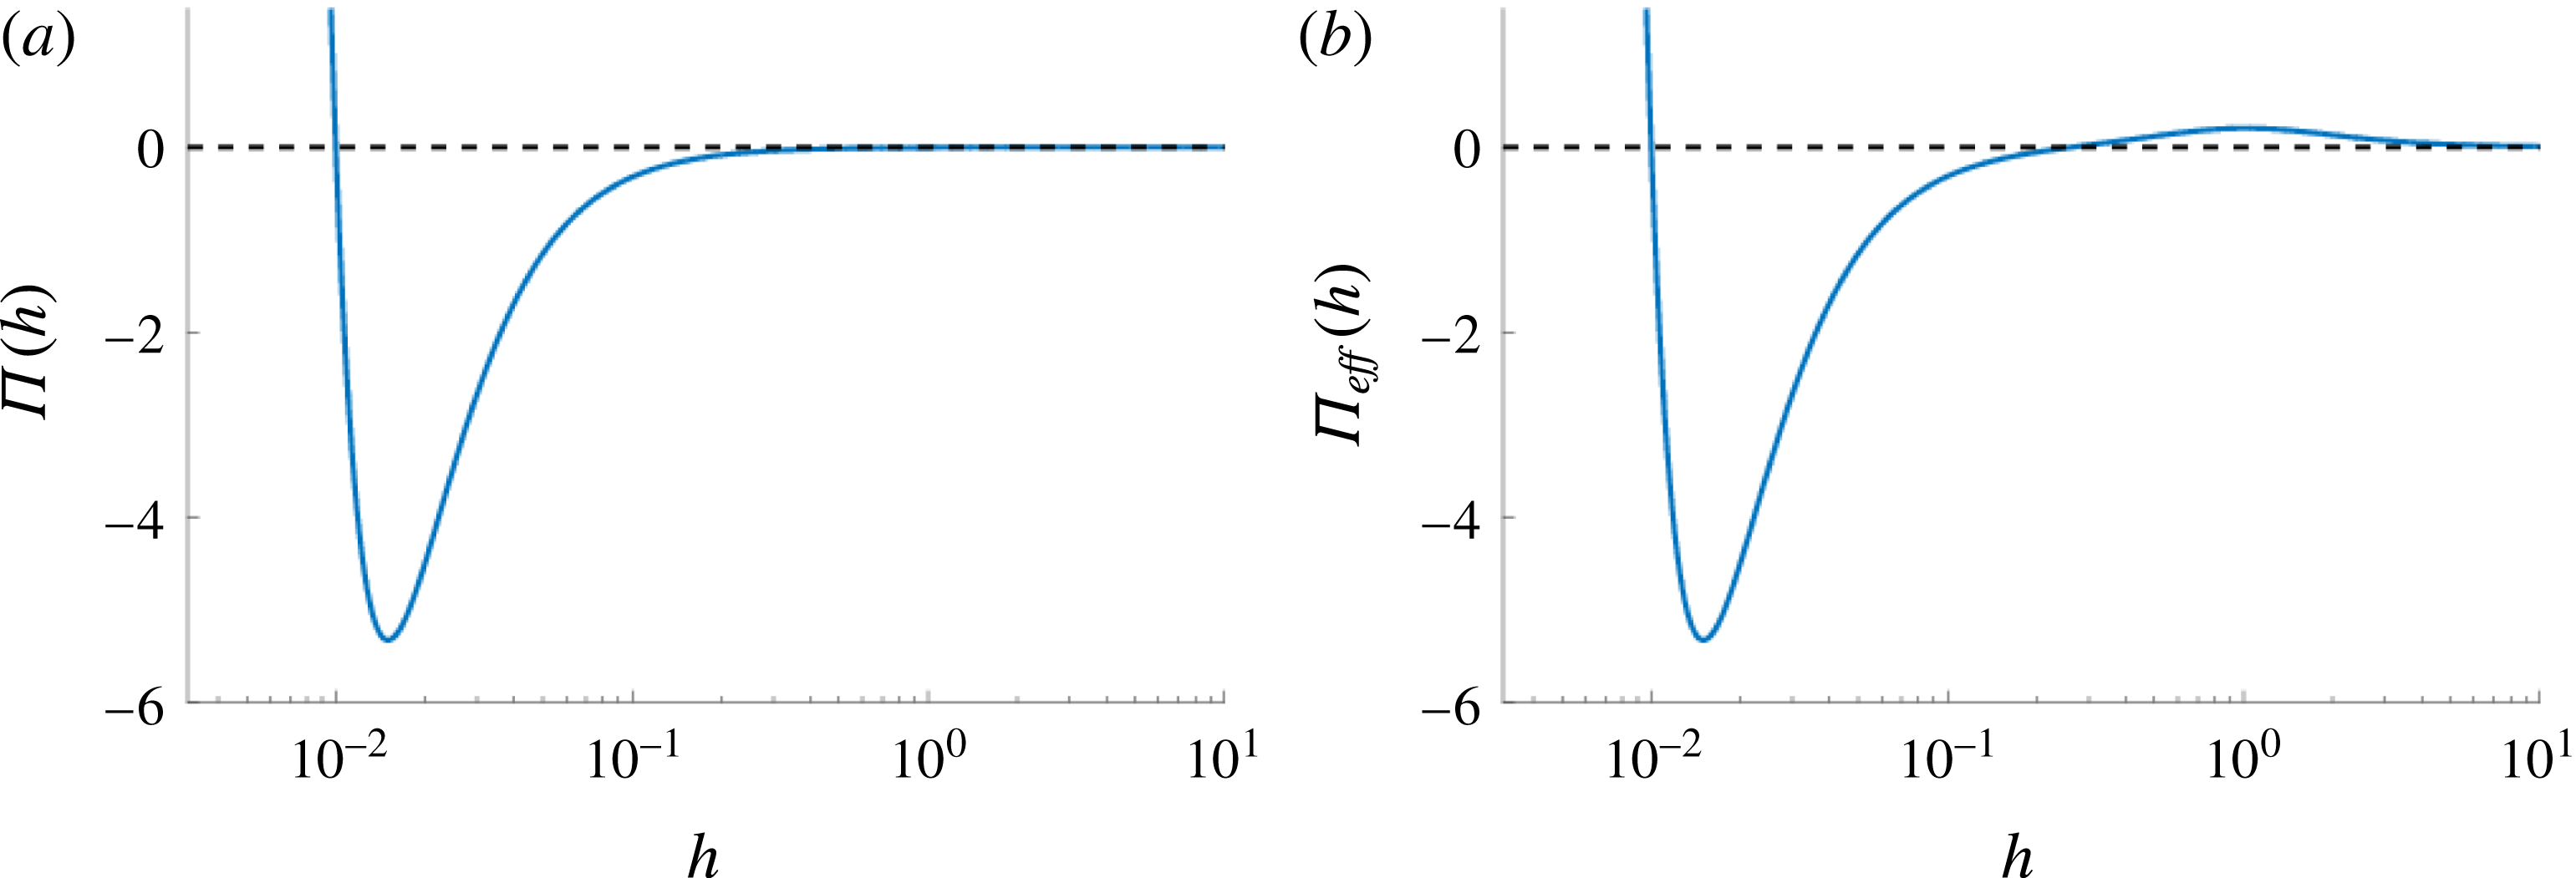
). Our present work is motivated by NLC films; however, as discussed above, the results are generally applicable for many other thin films with a similar form of effective disjoining pressure (see figure 1).
Various instability mechanisms relevant to thin films have been discussed in the literature. For example, in addition to the standard linear stability analysis, which focuses on instabilities due to the presence of random infinitesimal perturbations (often called spinodal dewetting), there are instabilities due to the presence of nucleation centres (Seemann, Herminghaus & Jacobs Reference Seemann, Herminghaus and Jacobs2001b ; Thiele et al. Reference Thiele, Velarde, Neuffer and Pomeau2001; Sharma & Verma Reference Sharma and Verma2004; Diez & Kondic Reference Diez and Kondic2007). Seemann et al. (Reference Seemann, Herminghaus and Jacobs2001b ) further separate nucleation instabilities into two types: heterogeneous nucleation, characterised by nucleation holes with a random (Poisson) distribution that emerge within a sharp time window; and homogeneous nucleation, possibly of thermal origin in experiments, where breakup is continuous and more and more nucleation holes form. In a similar direction, Thiele et al. (Reference Thiele, Velarde, Neuffer and Pomeau2001) and Diez & Kondic (Reference Diez and Kondic2007) considered the metastable and absolutely stable regimes (stability of films with respect to perturbations of finite size). In this work, we explore these various stability regimes in the context of our NLC model and demonstrate parallels between stability properties of our model and the work of Seemann et al. (Reference Seemann, Herminghaus and Jacobs2001b ), Thiele et al. (Reference Thiele, Velarde, Neuffer and Pomeau2001), Sharma & Verma (Reference Sharma and Verma2004), and Diez & Kondic (Reference Diez and Kondic2007), as well as similarities and differences between the referenced works. More precisely, we analyse in detail how the change of film thickness leads to different stability regimes, and the role of the disjoining pressure properties. We furthermore carry out numerical simulations of dewetting, and discuss the connection between instability mechanisms and the properties of the drop patterns that form during the final stages of instability development. We discuss the dynamics that result, both as a consequence of non-local infinitesimal perturbations (covering the whole fluid domain), and of finite-size localised perturbations. Considering both types of perturbations allows us to put together a detailed instability diagram covering the full range of film thicknesses.


The remainder of this paper is organised as follows. In § 2 we outline the derivation of the governing equation in the context of NLC films, highlighting differences between our model and others in the literature, especially with regard to the form of the effective disjoining pressure. In addition, appropriate scalings and physical parameters are discussed, and linear stability analysis (LSA) of a flat film is presented. The issues of particular relevance to NLC films are mostly considered in this section. We then proceed with a general discussion of film instability. In § 3 we discuss so-called spinodal instabilities, due to the presence of global (random) perturbations, intended to model the noise that is always present in physical experiments. Among other topics, we here discuss the formation of secondary (satellite) drops that are found only for a specific range of film thicknesses, and the distance between the emerging drops, whose dependence on the film thickness shows unexpected and rich structure. In § 4 we consider the influence of localised perturbations (nucleation centres) on the film stability. In this section we also apply the marginal stability criterion (MSC) to help us develop additional analytical insight regarding instability development; this approach (to the best of our knowledge) has not yet been discussed in the present context. We discuss both linearly stable and metastable regimes of instability. Section 5 summarises our findings: of particular interest to the reader may be figure 20, which provides a summary of the various instability mechanisms found and discussed throughout the paper.
2 Problem formulation
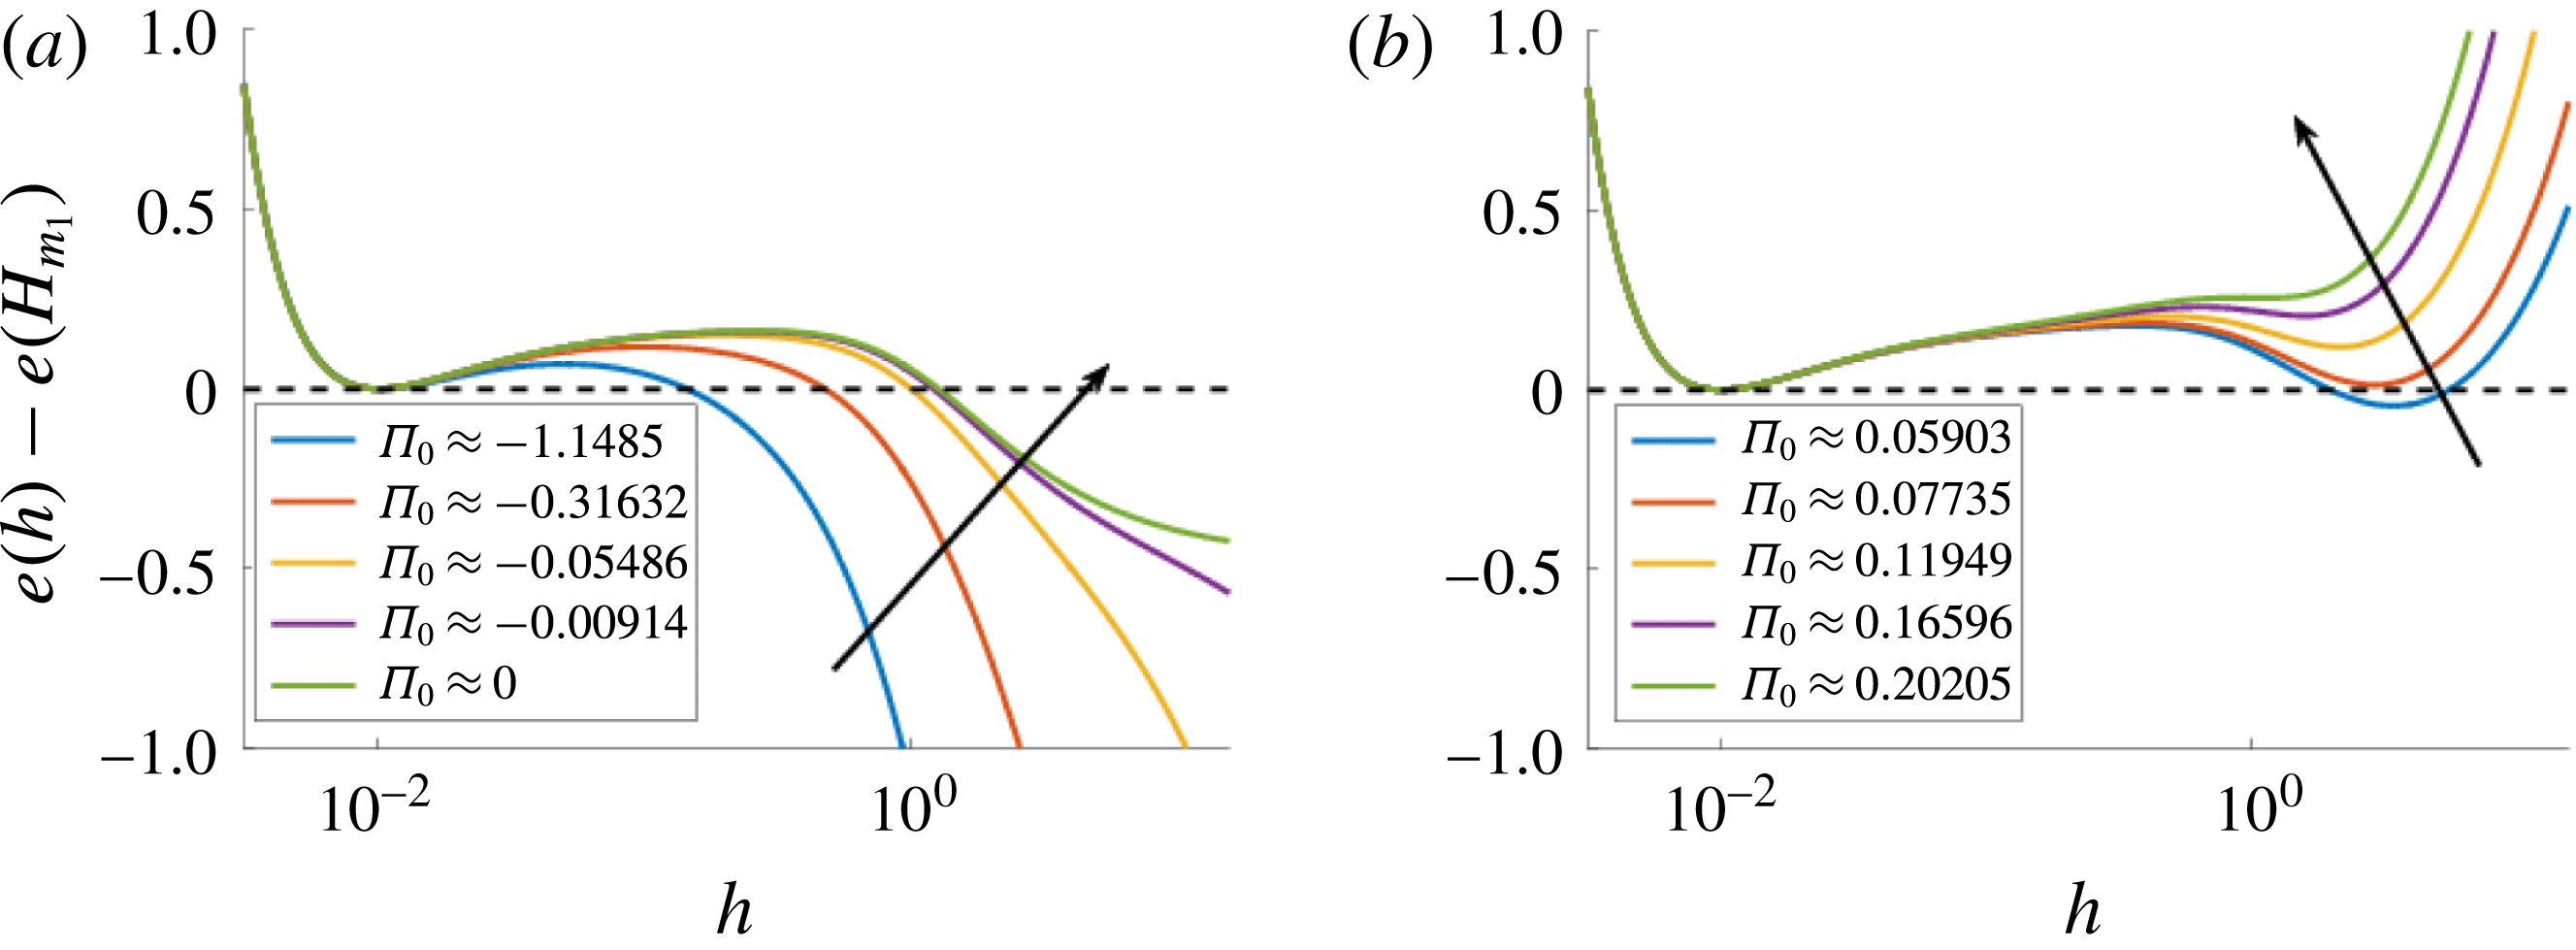
We first outline our model for NLC films of thickness on the nano/microscale, but emphasise that our results are of relevance to other types of thin films (such as polymeric films), which may be described by long-wave equations similar to ours (equation (2.10) later) and which involve an effective disjoining pressure qualitatively similar to that sketched in figure 1(b). Note that the additional local maximum shown in figure 1(b), that is not present in figure 1(a), is important in determining the film stability (see Starov Reference Starov1992; Churaev Reference Churaev1995). In the present paper, such a maximum results from the nematic contribution; for polymer films on a Si/SiO
 $_{2}$
substrate it may be due to the interaction of the polymer film with both SiO
 $_{2}$
and Si layers (see Jacobs et al.
Reference Jacobs, Seemann and Herminghaus2008).
For the thin films that we consider, the effects of gravity are negligible; however, liquid/solid interactions, neglected in our previous work on thin film dynamics of NLCs (see Lin et al. Reference Lin, Kondic, Thiele and Cummings2013b ; Lam et al. Reference Lam, Cummings, Lin and Kondic2015), become important. Our model derives from the Leslie–Ericksen equations (Leslie Reference Leslie1979), which comprise a fluid momentum equation plus incompressibility, analogous to Navier–Stokes; and an additional equation modelling conservation of energy (linear translational energy of the NLC molecules, and angular energy about each NLC molecule’s centre of mass). The fluid momentum equation differs from Navier–Stokes in two key ways: (1) by introducing a new anisotropic stress tensor (linear momentum), and (2) by an additional term modelling angular momentum. For brevity, the full derivation of the long-wave model from the Leslie–Ericksen equations is skipped in the present paper; we present just a brief overview, highlighting where the modelling differs from our earlier work (Lin et al. Reference Lin, Kondic, Thiele and Cummings2013b ).
There are three crucial quantities in our long-wave model:
 $h$
, the free surface height, and the angles
 $\unicode[STIX]{x1D703}$
and
 $\unicode[STIX]{x1D719}$
that characterise the director field,
 $\boldsymbol{n}$
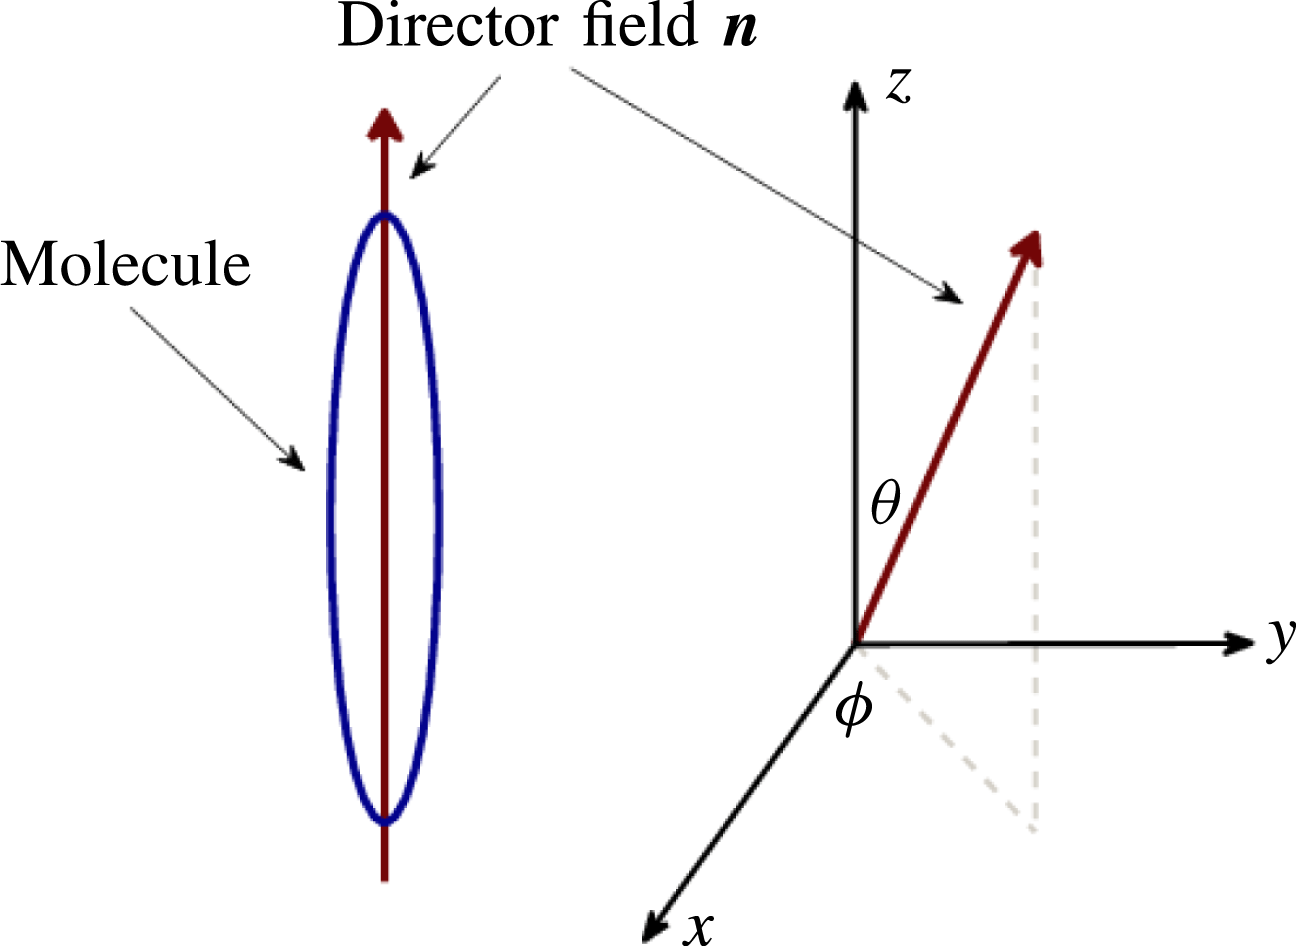
, a unit vector representing the local average orientation of the long axis of the rod-like NLC molecules. It is convenient to express the director field in spherical coordinates,
 $\boldsymbol{n}=(\sin \unicode[STIX]{x1D703}\cos \unicode[STIX]{x1D719},\sin \unicode[STIX]{x1D703}\sin \unicode[STIX]{x1D719},\cos \unicode[STIX]{x1D703})$
, and consider the dependent variables
 $\unicode[STIX]{x1D703}$
, the azimuthal angle, and
 $\unicode[STIX]{x1D719}$
, the polar angle, which vary with the film height
 $h$
(see figure 2 for a schematic). Note that throughout this paper we use hats to distinguish between dimensional and dimensionless variables or parameters, hatted quantities being dimensional.
Analogous to Newtonian fluid models we include surface tension with constant surface energy density
 $\hat{\unicode[STIX]{x1D6FE}}$
, and liquid/solid interaction with volume energy density
 $\hat{A}$
(proportional to the Hamaker constant). Unique to NLCs (with respect to simple fluids) are the isotropic viscosity stress tensor, characterised by six coefficients,
 $\hat{\unicode[STIX]{x1D6FC}}_{i}$
(
 $i=1,6$
); and the elastic response, characterised by three constants
 $\hat{K}_{i}$
(
 $i=1,2,3$
). Similar to other authors (van Effenterre & Valignat Reference van Effenterre and Valignat2003; Ziherl & Z̆umer Reference Ziherl and Z̆umer2003; Rey Reference Rey2008; Delabre, Richard & Cazabat Reference Delabre, Richard and Cazabat2009), we use the one-constant approximation,
 $\hat{K}=\hat{K}_{1}=\hat{K}_{2}=\hat{K}_{3}$
. Furthermore, under the long-wave approximation, only three of the six viscosities (
 $\hat{\unicode[STIX]{x1D6FC}}_{3}$
,
 $\hat{\unicode[STIX]{x1D6FC}}_{4}$
and
 $\hat{\unicode[STIX]{x1D6FC}}_{6}$
) are relevant.
Schematic of the director field of the liquid crystal molecules relative to the Cartesian coordinates.

To non-dimensionalise the Leslie–Ericksen equations five scaling factors are defined:
 ${\hat{H}}$
, the film thickness;
 $\hat{L}$
, the length scale of variations in the plane in the film,
 $(\hat{x},{\hat{y}})$
;
 $\unicode[STIX]{x1D6FF}={\hat{H}}/\hat{L}$
, the small aspect ratio;
 $\hat{U}$
, a characteristic flow velocity;
 $\hat{T}_{F}=\hat{L}/\hat{U}$
, the time scale of fluid flow; and
 $\hat{\unicode[STIX]{x1D707}}=\hat{\unicode[STIX]{x1D6FC}}_{4}/2$
, a representative viscosity scale analogous to the Newtonian viscosity (with
 $\hat{\unicode[STIX]{x1D6FC}}_{i}=0$
for
 $i\neq 4$
, the isotropic viscosity stress tensor reduces to a simple Newtonian stress tensor). The choice of the scales is based on experimental data, and is further discussed in § 2.3.
2.1 Weak free surface anchoring
In addition to the fluid flow time scale,
 $\hat{T}_{F}$
, we may consider the time scale of elastic reorientation across the layer,
 $\hat{T}_{R}=\hat{\unicode[STIX]{x1D707}}{\hat{H}}^{2}/\hat{K}$
. Assuming the time scale of reorientation is much faster than that of fluid flow, a quasistatic approximation (instantaneous elastic equilibrium) can be justified, and the energy equation may be solved to give the director field,
 $\boldsymbol{n}$
, as a function of the instantaneous film height,
 $h$
. In our previous work (see Lin et al.
Reference Lin, Kondic, Thiele and Cummings2013b
) we showed that the spherical director angles
 $\unicode[STIX]{x1D703}$
and
 $\unicode[STIX]{x1D719}$
are then given as
 $$\begin{eqnarray}\displaystyle \unicode[STIX]{x1D703}=a(x,y,t)z+\unicode[STIX]{x1D703}_{{\mathcal{S}}}(x,y,t)\quad \text{and}\quad \unicode[STIX]{x1D719}=\unicode[STIX]{x1D719}_{{\mathcal{S}}}(x,y,t), & & \displaystyle\end{eqnarray}$$
where
 $a(x,y,t)$
depends on the free surface height,
 $h(x,y,t)$
, as discussed below. The functions
 $\unicode[STIX]{x1D703}_{{\mathcal{S}}}$
and
 $\unicode[STIX]{x1D719}_{{\mathcal{S}}}$
depend on the preferred orientation of the NLC molecules at the interfaces, a phenomenon known as anchoring. We assume that the anchoring on the substrate is stronger than that at the free surface, and therefore that
 $\unicode[STIX]{x1D703}_{{\mathcal{S}}}(x,y)$
and
 $\unicode[STIX]{x1D719}_{{\mathcal{S}}}(x,y)$
are imposed by the substrate. In line with observations for physical systems, we assume
 $\unicode[STIX]{x1D703}_{{\mathcal{S}}}$
is constant, while
 $\unicode[STIX]{x1D719}_{{\mathcal{S}}}(x,y)$
may vary only spatially. This solution for the director field feeds into the anisotropic stress tensor. The particular state here in which
 $\unicode[STIX]{x1D703}$
is linear in
 $z$
is often called the hybrid aligned nematic (HAN) state of NLCs.
In general, the preferred polar anchoring angles at the free surface,
 $\unicode[STIX]{x1D703}_{{\mathcal{F}}}$
, and at the substrate,
 $\unicode[STIX]{x1D703}_{{\mathcal{S}}}$
(both assumed constant), are different (antagonistic anchoring). For very thin films, adjusting between these anchoring conditions incurs a large energy penalty in the bulk of the film. To reduce the energy penalty for very thin films, we allow the (weakly anchored) free surface director angle
 $\unicode[STIX]{x1D703}_{{\mathcal{F}}}$
to relax to the same value as the (strongly anchored) substrate director angle
 $\unicode[STIX]{x1D703}_{{\mathcal{S}}}$
for very thin films. Specifically, we take
 $$\begin{eqnarray}\displaystyle \unicode[STIX]{x1D703}=\unicode[STIX]{x1D703}_{{\mathcal{S}}}+(\unicode[STIX]{x1D703}_{{\mathcal{F}}}-\unicode[STIX]{x1D703}_{{\mathcal{S}}})\frac{m(h)}{h}z, & & \displaystyle\end{eqnarray}$$
 $$\begin{eqnarray}\displaystyle m(h)=g(h)\frac{h^{2}}{h^{2}+\unicode[STIX]{x1D6FD}^{2}},\quad g(h)=\frac{1}{2}\left[1+\tanh \left(\frac{h-2b}{w}\right)\right], & & \displaystyle\end{eqnarray}$$
where
 $m(h)$
is a relaxation function (directly related to the anchoring energy at the free surface, see Lin et al. (Reference Lin, Kondic, Thiele and Cummings2013b
)) in which
 $\unicode[STIX]{x1D6FD}$
is the thickness scale at which the bulk elastic energy is comparable to the free surface anchoring energy, and
 $g(h)$
is a ‘cutoff’ function (controlled by
 $w$
,
 $w=0.05$
in this work) that enforces the substrate anchoring on the free surface when the film thickness is close to the equilibrium film thickness,
 $b$
(discussed in more detail later in the text).
Note that with this form of the director field, thicker NLC films are in the HAN state, while films close to the equilibrium thickness have a director field nearly homogeneous across the film thickness. This transition between the states is in agreement with several other models (for example, Ziherl et al.
Reference Ziherl, Podgornik and Z̆umer2000; Delabre et al.
Reference Delabre, Richard and Cazabat2009; Cazabat et al.
Reference Cazabat, Delabre, Richard and Sang2011). Furthermore, dimensional analysis shows that our length scale
 $\unicode[STIX]{x1D6FD}$
may be related to the extrapolation length discussed in the literature (van Effenterre et al.
Reference van Effenterre, Ober, Valignat and Cazabat2001; Ziherl & Z̆umer Reference Ziherl and Z̆umer2003; Delabre et al.
Reference Delabre, Richard and Cazabat2009).
2.2 Long-wave model
To derive a long-wave model for nanoscale thin films, we modify our earlier model, described in Lin et al. (Reference Lin, Kondic, Thiele and Cummings2013b
), by neglecting gravity and including fluid–solid interaction via the disjoining pressure. With this modification, there are five non-dimensional parameters:
 ${\mathcal{C}}$
, the inverse capillary number, representing the ratio of surface tension and viscous forces;
 ${\mathcal{K}}$
, the ratio of the forces due to disjoining pressure and those due to viscous effects;
 ${\mathcal{N}}$
, a scaled inverse Ericksen number, representing the ratio of elastic and viscous forces;
 $\unicode[STIX]{x1D706}$
and
 $\unicode[STIX]{x1D708}$
, scaled effective viscosities. In terms of physical parameters,
 $$\begin{eqnarray}\displaystyle {\mathcal{C}}=\frac{\unicode[STIX]{x1D6FF}^{3}\hat{\unicode[STIX]{x1D6FE}}}{\hat{\unicode[STIX]{x1D707}}\hat{U} },\quad {\mathcal{K}}=\frac{\unicode[STIX]{x1D6FF}^{2}\hat{A}\hat{L}}{\hat{\unicode[STIX]{x1D707}}\hat{U} },\quad {\mathcal{N}}=(\unicode[STIX]{x0394}\unicode[STIX]{x1D703})^{2}\frac{\hat{K}}{\hat{\unicode[STIX]{x1D707}}\hat{U} \hat{L}},\quad \unicode[STIX]{x0394}\unicode[STIX]{x1D703}=\unicode[STIX]{x1D703}_{{\mathcal{F}}}-\unicode[STIX]{x1D703}_{{\mathcal{S}}}, & & \displaystyle\end{eqnarray}$$
 $$\begin{eqnarray}\displaystyle \unicode[STIX]{x1D706}=\frac{2+\unicode[STIX]{x1D702}}{4(1+\unicode[STIX]{x1D702})},\quad \unicode[STIX]{x1D708}=-\frac{\unicode[STIX]{x1D702}}{4(1+\unicode[STIX]{x1D702})},\quad \unicode[STIX]{x1D702}=\frac{\hat{\unicode[STIX]{x1D6FC}}_{3}+\hat{\unicode[STIX]{x1D6FC}}_{6}}{\hat{\unicode[STIX]{x1D707}}}, & & \displaystyle\end{eqnarray}$$
where, recall,
 $\hat{\unicode[STIX]{x1D707}}=\hat{\unicode[STIX]{x1D6FC}}_{4}/2$
. For the remainder of the paper, only two-dimensional geometry will be considered; we leave the three-dimensional case for future work. With this restriction
 $\unicode[STIX]{x1D719}$
can be at most piecewise constant, with value(s)
 $\unicode[STIX]{x1D719}=0$
(substrate anchoring parallel to the
 $x$
-axis) or
 $\unicode[STIX]{x1D719}=\unicode[STIX]{x03C0}/2$
(anchoring perpendicular to the
 $x$
-axis). The governing equation for the free surface height,
 $h(x,t)$
, may then be expressed as
 $$\begin{eqnarray}\displaystyle & \displaystyle h_{t}+[\unicode[STIX]{x1D6F7}({\mathcal{C}}h^{3}h_{xxx}+h^{3}{\unicode[STIX]{x1D6F1}_{eff}}^{\prime }(h)h_{x})]_{x}=0, & \displaystyle\end{eqnarray}$$
 $$\begin{eqnarray}\displaystyle & \displaystyle \unicode[STIX]{x1D6F7}=\left\{\begin{array}{@{}ll@{}}\unicode[STIX]{x1D6F7}_{\Vert }=\unicode[STIX]{x1D706}-\unicode[STIX]{x1D708} & (\unicode[STIX]{x1D719}=0)\\ \unicode[STIX]{x1D6F7}_{\bot }=\unicode[STIX]{x1D706}+\unicode[STIX]{x1D708} & \left(\displaystyle \unicode[STIX]{x1D719}=\frac{\unicode[STIX]{x03C0}}{2}\right).\end{array}\right. & \displaystyle\end{eqnarray}$$
Here
 $\unicode[STIX]{x1D6F7}_{\Vert }$
denotes substrate azimuthal anchoring parallel to the
 $x$
-axis (
 $\unicode[STIX]{x1D719}=0$
) and
 $\unicode[STIX]{x1D6F7}_{\bot }$
denotes anchoring perpendicular to the
 $x$
-axis (
 $\unicode[STIX]{x1D719}=\unicode[STIX]{x03C0}/2$
); note that the value of
 $\unicode[STIX]{x1D6F7}$
influences only the time scale of fluid flow. Furthermore, if
 $\unicode[STIX]{x1D702}=0$
in (2.5), the governing equation (2.6) is independent of
 $\unicode[STIX]{x1D719}$
and our model corresponds to a fluid of isotropic viscosity. The effective disjoining pressure is defined as
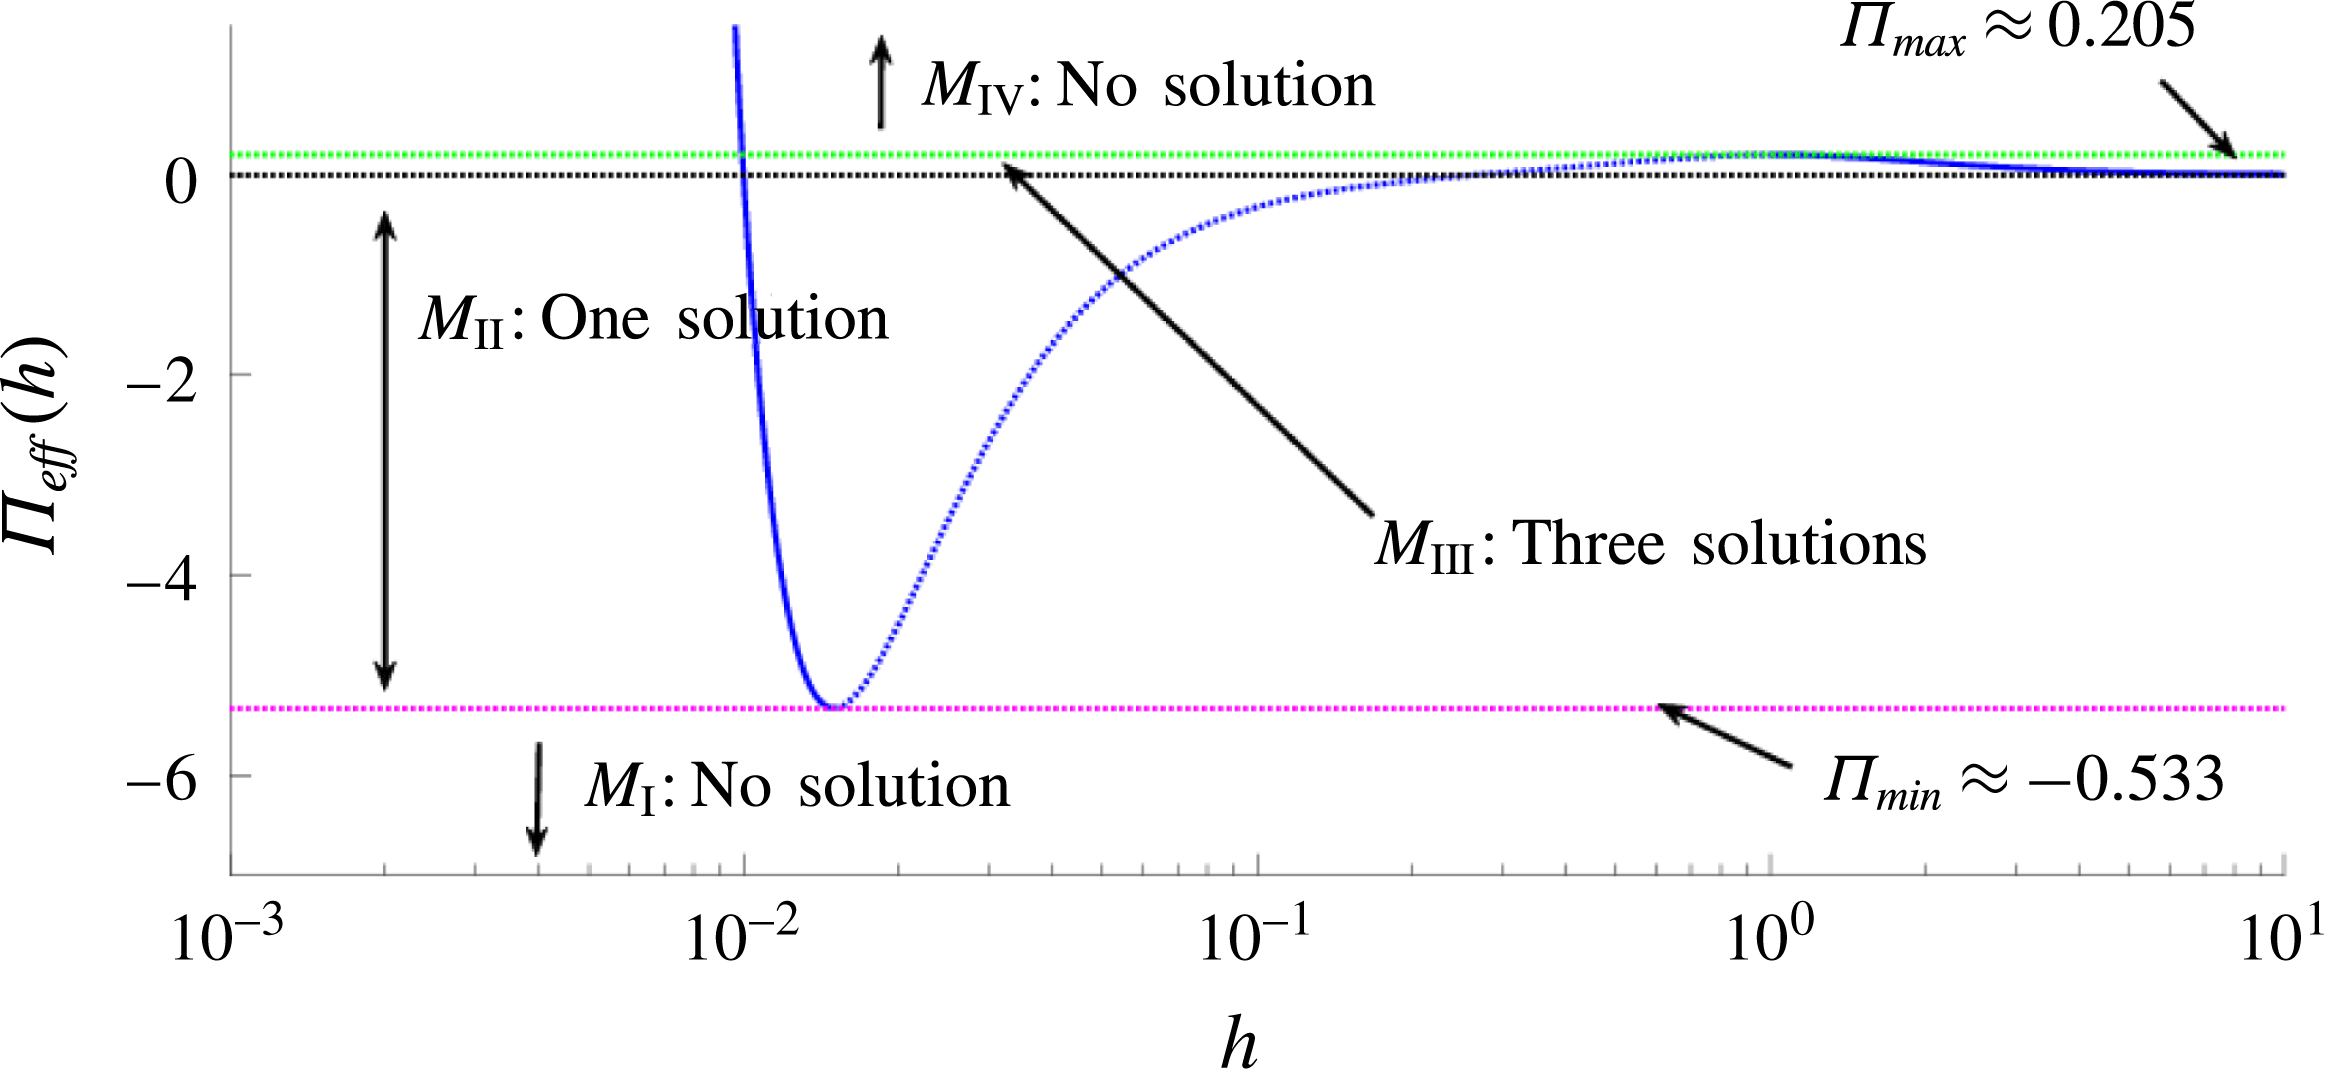
 $$\begin{eqnarray}\displaystyle \unicode[STIX]{x1D6F1}_{eff}(h)={\mathcal{K}}f(h)+\frac{{\mathcal{N}}}{2}\left[\frac{m(h)}{h}\right]^{2}, & & \displaystyle\end{eqnarray}$$
with
 $m(h)$
as defined in (2.3) above. Here, the second term on the right-hand side is the response due to the antagonistic anchoring conditions, while the first term corresponds to the disjoining pressure, taken here to be of power-law form
 $$\begin{eqnarray}\displaystyle \unicode[STIX]{x1D6F1}(h)={\mathcal{K}}f(h)={\mathcal{K}}\left[\left(\frac{b}{h}\right)^{3}-\left(\frac{b}{h}\right)^{2}\right]. & & \displaystyle\end{eqnarray}$$
The form of the effective disjoining pressure, (2.8), is similar to that considered by Vandenbrouck et al. (Reference Vandenbrouck, Valignat and Cazabat1999); however, there are two important differences: (i), the (first) term in (2.9) considered here contains the repulsive term (Born repulsion) preventing the film thickness from reaching zero; such a term is crucial if one wants to carry out simulations; and (ii), in the model of Vandenbrouck et al. (Reference Vandenbrouck, Valignat and Cazabat1999), the free surface azimuthal anchoring is assumed to be determined by the average initial thickness of the film and does not evolve with
 $h$
. The power-law form of disjoining pressure (2.9) is used extensively in the literature; for a review see Craster & Matar (Reference Craster and Matar2009) and for further background regarding solid–fluid interactions, see Israelachvili (Reference Israelachvili1992).
In the case (assumed henceforth) that
 $\unicode[STIX]{x1D719}$
is constant globally, a simple rescaling of time in (2.6) yields
 $$\begin{eqnarray}\displaystyle h_{t}+[{\mathcal{C}}h^{3}h_{xxx}+h^{3}{\unicode[STIX]{x1D6F1}_{eff}}^{\prime }(h)h_{x}]_{x}=0, & & \displaystyle\end{eqnarray}$$
with
 $\unicode[STIX]{x1D6F1}_{eff}$
as defined in (2.8). This equation will be considered in the rest of this paper. Note that, in this model, nematic effects enter only through modification of the disjoining pressure, by adding the structural component. Figure 1 shows typical forms of the disjoining pressure obtained using the parameter values discussed in the following section. The effective disjoining pressure proposed in (2.8) is similar to that expected for many other thin film problems, in particular the well-studied polymer films on Si/SiO
 $_{2}$
substrates (see, for example, Seemann et al.
Reference Seemann, Herminghaus and Jacobs2001a
). Therefore the results that we present in the rest of the manuscript are of relevance to a wide class of complex fluids.
We note that (2.10) may be alternatively derived using the variational or gradient dynamics formulation (see Mitlin Reference Mitlin1993; Thiele, Archer & Pismen Reference Thiele, Archer and Pismen2016). In this thermodynamically motivated approach the governing equation is expressed as
 $$\begin{eqnarray}\displaystyle h_{t}+\unicode[STIX]{x1D735}\boldsymbol{\cdot }\left[Q(h)\unicode[STIX]{x1D735}\left(\frac{\unicode[STIX]{x03B4}F}{\unicode[STIX]{x03B4}h}\right)\right]=0, & & \displaystyle\end{eqnarray}$$
where
 $Q(h)$
is the mobility function, and
 $F$
is the free energy functional. Previous work (see Lin et al.
Reference Lin, Cummings, Archer, Kondic and Thiele2013a
) showed that, with consistent boundary conditions, the gradient dynamics formulation is equivalent to the long-wave approximation of the Leslie–Ericksen equations. In terms of our model,
 $Q(h)=h^{3}$
and
 $$\begin{eqnarray}\displaystyle F(h)=-{\mathcal{C}}\left[1+\frac{(\unicode[STIX]{x1D735}h)^{2}}{2}\right]-\frac{{\mathcal{K}}b^{2}}{2h}\left[\frac{b}{h}-2\right]+{\mathcal{N}}\left[\frac{m(h)^{2}}{2h}-\int ^{h}\frac{m(s)m^{\prime }(s)}{s}\,\text{d}s\right]. & & \displaystyle\end{eqnarray}$$
2.3 Scalings and physical parameters
We now discuss the choice of scaling parameters mentioned in the beginning of § 2 and the material parameters in (2.4) and (2.5) for our model of thin NLC films (2.8) and (2.10). In experimental studies of dewetting of NLC films, the film thickness is typically on the order of 10–100 nm (see Herminghaus et al.
Reference Herminghaus, Jacobs, Mecke, Bischof, Fery, Ibn-Elhaj and Schlagowski1998; Vandenbrouck et al.
Reference Vandenbrouck, Valignat and Cazabat1999); therefore we set the representative film height
 ${\hat{H}}$
(used to scale
 $z$
) to 100 nm. For temperatures far from a phase transition, the lower bound of the forbidden range of thickness is a few nanometres (it corresponds, in the experiments of Cazabat et al. (Reference Cazabat, Delabre, Richard and Sang2011), to a trilayer of molecules). We define this lower bound to correspond to the equilibrium film thickness and set it as
 $\hat{b}=1$
nm. Bulk elastic energy is expected to be comparable to surface anchoring energy for film thicknesses in the 100 nm range; therefore we set
 $\hat{\unicode[STIX]{x1D6FD}}=100$
nm. Periodic undulations are observed on the free surface of films with a height on the order of
 ${\hat{H}}$
, and in experiments by Herminghaus et al. (Reference Herminghaus, Jacobs, Mecke, Bischof, Fery, Ibn-Elhaj and Schlagowski1998) and Cazabat et al. (Reference Cazabat, Delabre, Richard and Sang2011), the wavelength of such undulations is observed to be in the range of 10–100
 $\unicode[STIX]{x03BC}$
m. Choosing the length scale in the
 $(x,y)$
domain
 $\hat{L}=10~\unicode[STIX]{x03BC}$
m, we fix the aspect ratio
 $\unicode[STIX]{x1D6FF}={\hat{H}}/\hat{L}=10^{-2}$
. We choose the time scale of fluid flow
 $\hat{T}_{F}=\hat{L}/\hat{U}$
to match the time scale on which undulations develop in experiments, typically seconds to minutes (see Herminghaus et al.
Reference Herminghaus, Jacobs, Mecke, Bischof, Fery, Ibn-Elhaj and Schlagowski1998); thus we set
 $\hat{T}_{F}=1$
s, corresponding to a velocity scale
 $\hat{U} =10~\unicode[STIX]{x03BC}\text{m}~\text{s}^{-1}$
.
The remaining parameters to be specified are:
 $\hat{\unicode[STIX]{x1D6FE}}$
, the surface tension;
 $\hat{K}$
, the bulk elastic constant;
 $\unicode[STIX]{x1D703}_{{\mathcal{F}}}$
, the free surface azimuthal anchoring angle;
 $\unicode[STIX]{x1D703}_{{\mathcal{S}}}$
, the substrate azimuthal anchoring angle;
 $\hat{A}$
, a force per unit volume, proportional to the Hamaker constant; and
 $\hat{\unicode[STIX]{x1D707}}$
, a representative viscosity. Many experimental studies (such as Vandenbrouck et al.
Reference Vandenbrouck, Valignat and Cazabat1999; van Effenterre & Valignat Reference van Effenterre and Valignat2003; Poulard & Cazabat Reference Poulard and Cazabat2005; Ausserré & Buraud Reference Ausserré and Buraud2011; Cazabat et al.
Reference Cazabat, Delabre, Richard and Sang2011; Schulz & Bahr Reference Schulz and Bahr2011) use the cyanobiphenyl (nCB) series of liquid crystals (where
 $n$
refers to the number of carbons in the aliphatic tail), in particular, 4-Cyano-4
 $^{\prime }$
-pentylbiphenyl (5CB). Therefore, we choose these physical parameters to match 5CB data. It is noted by Cazabat et al. (Reference Cazabat, Delabre, Richard and Sang2011) that, due to impurities in the NLC, published measurements of surface tension are scattered. However, to estimate the order of the non-dimensional parameters in our model, we note that surface tension appears typically to be on the order of
 $10^{-2}~\text{N}~\text{m}^{-1}$
(see Rey & Denn Reference Rey and Denn2002; Cazabat et al.
Reference Cazabat, Delabre, Richard and Sang2011). The elastic constant,
 $\hat{K}$
, is on the order of
 $10^{-11}$
–
 $10^{-10}$
N (see Poulard & Cazabat Reference Poulard and Cazabat2005; Delabre et al.
Reference Delabre, Richard, Guéna, Meunier and Cazabat2008). For the nCB series of NLCs, the molecules prefer to align normal to the free surface (homeotropic anchoring) and, in practice, substrates are often chosen and treated such that molecules align parallel to the substrate, e.g. SiO
 $_{2}$
; therefore we set
 $\unicode[STIX]{x1D703}_{{\mathcal{F}}}=0$
and
 $\unicode[STIX]{x1D703}_{{\mathcal{S}}}=\unicode[STIX]{x03C0}/2$
. Accurate values for the characteristic viscosity of 5CB are scarce in the literature; however, Mechkov, Cazabat & Oshanin (Reference Mechkov, Cazabat and Oshanin2009) was able to fit solutions of a thin film equation to experimental results (this work considers micron-scale drop thicknesses and the model used assumes strong free surface anchoring and neglects fluid/solid interactions) with
 $\hat{\unicode[STIX]{x1D707}}$
on the order of
 $10^{-2}$
Pa s, a value in line with reported data (e.g. Inoue et al.
Reference Inoue, Yoshino, Moritake and Toda2002). Taking account of this available data, we choose
 $\hat{K}=1\times 10^{-11}$
N,
 $\hat{\unicode[STIX]{x1D6FE}}=60\times 10^{-3}~\text{N}~\text{m}^{-1}$
and
 $\hat{\unicode[STIX]{x1D707}}=60\times 10^{-3}$
Pa s.
In summary, the dimensional scaling factors are then fixed as
 $$\begin{eqnarray}\displaystyle \hat{L}=10~\unicode[STIX]{x03BC}\text{m},\quad {\hat{H}}=100~\text{nm},\quad \hat{T}_{F}=1~\text{s},\quad \hat{U} =10~\unicode[STIX]{x03BC}\text{m}~\text{s}^{-1}. & & \displaystyle\end{eqnarray}$$
Note that with the chosen thickness scale,
 $\hat{T}_{R}=\hat{\unicode[STIX]{x1D707}}{\hat{H}}^{2}/\hat{K}=60~\unicode[STIX]{x03BC}\text{s}$
, thus we satisfy the assumption in § 2.1 that the time scale of elastic reorientation across the layer (
 $\hat{T}_{R}$
) is much slower than that of fluid flow (
 $\hat{T}_{F}$
). In addition, with the value of the contact angle to be discussed in § 2.3.1, the contact line velocity of a spreading NLC drop measured by Poulard & Cazabat (Reference Poulard and Cazabat2005) (at the chosen contact angle) is of a similar order to our derived velocity scale
 $\hat{U}$
.
Based on the scales discussed above, the dimensionless parameters we use (at least, for our initial investigations) are
 $$\begin{eqnarray}\displaystyle \unicode[STIX]{x1D6FF}=0.01,\quad \!{\mathcal{C}}=0.0857,\quad \!{\mathcal{N}}=1.67,\quad \!{\mathcal{K}}=[0.0017~\text{m}^{3}~\text{J}^{-1}]\hat{A},\quad \!b=0.01,\quad \!\unicode[STIX]{x1D6FD}=1, & & \displaystyle \nonumber\\ \displaystyle & & \displaystyle\end{eqnarray}$$
and
 $\hat{A}$
, the volume energy density associated with fluid/solid interaction forces (here assumed to have units of
 $\text{J}~\text{m}^{-3}$
), is discussed next.
2.3.1 Contact angle
To define a value for
 $\hat{A}$
and thus
 ${\mathcal{K}}$
(see (2.4), (2.14)) we relate the spreading parameter (a function of the contact angle) to the stored energy per unit area of the film using the Young–Laplace equation (see Diez & Kondic Reference Diez and Kondic2007). The spreading parameter
 ${\hat{S}}$
is given by
 $$\begin{eqnarray}\displaystyle {\hat{S}}=\hat{\unicode[STIX]{x1D6FE}}(1-\cos \unicode[STIX]{x1D717}_{c})=\hat{E}({\hat{h}}=\infty )=-\int _{\hat{b}}^{\infty }\hat{\unicode[STIX]{x1D6F1}}_{eff}({\hat{h}})\,\text{d}{\hat{h}}, & & \displaystyle\end{eqnarray}$$
where
 $\unicode[STIX]{x1D717}_{c}$
is the equilibrium contact angle,
 $\hat{E}({\hat{h}})$
is the stored energy per unit area, and
 $\hat{\unicode[STIX]{x1D6F1}}_{eff}({\hat{h}})=(\hat{\unicode[STIX]{x1D707}}\hat{U} /\unicode[STIX]{x1D6FF}\hat{L})\unicode[STIX]{x1D6F1}_{eff}(h)$
, where
 $\unicode[STIX]{x1D6F1}_{eff}$
is defined by (2.8): the usual disjoining pressure plus the elastic ‘structural’ component, dependent on the function
 $m(h)$
and with prefactor
 ${\mathcal{N}}$
. This elastic term of the integral in (2.15) cannot be evaluated analytically, due to the complicated functional form of
 $m(h)$
as defined in (2.3). However, direct numerical integration shows (for the chosen values of
 $b$
,
 $\unicode[STIX]{x1D6FD}$
and
 $w$
) that the value of (2.15) is almost the same if the approximation
 $g(h)=1$
in the definition of
 $m(h)$
is made (less than 1 % difference). Setting
 $g(h)=1$
, the integral in (2.15) may be evaluated analytically; but the result is not simple to work with. Therefore, we asymptotically expand in
 $\unicode[STIX]{x1D700}=b/\unicode[STIX]{x1D6FD}=0.01\ll 1$
and retain the leading-order term. The contact angles for NLC on Si (or SiO
 $_{2}$
) substrates were measured by Poulard & Cazabat (Reference Poulard and Cazabat2005) to be approximately
 $10^{-2}$
–
 $10^{-1}$
radians; thus assuming the contact angle is small,
 $\unicode[STIX]{x1D717}_{c}\ll 1$
, (2.15) may be expressed as
 $$\begin{eqnarray}\displaystyle \hat{A}=\frac{\hat{\unicode[STIX]{x1D6FE}}\unicode[STIX]{x1D717}_{c}^{2}}{\hat{b}}\left(1+\unicode[STIX]{x1D705}\left[\frac{\unicode[STIX]{x03C0}}{4}\unicode[STIX]{x1D700}+O(\unicode[STIX]{x1D700}^{4})\right]\right),\quad \unicode[STIX]{x1D705}=\frac{\hat{K}}{\hat{\unicode[STIX]{x1D6FE}}\hat{b}\unicode[STIX]{x1D717}_{c}^{2}}. & & \displaystyle\end{eqnarray}$$
To express (2.16) in terms of the non-dimensional parameters (2.14), the order
 $\unicode[STIX]{x1D700}^{4}$
term in (2.16) is neglected, and the approximated equation is multiplied by
 $\unicode[STIX]{x1D6FF}/\hat{\unicode[STIX]{x1D707}}\hat{U}$
to yield
 $$\begin{eqnarray}\displaystyle {\mathcal{K}}b\approx {\mathcal{C}}\left(\frac{\unicode[STIX]{x1D717}_{c}}{\unicode[STIX]{x1D6FF}}\right)^{2}+\frac{{\mathcal{N}}}{\unicode[STIX]{x1D6FD}\unicode[STIX]{x03C0}}, & & \displaystyle\end{eqnarray}$$
where
 $b=\hat{b}/{\hat{H}}$
is the dimensionless equilibrium thickness. For the chosen values of
 $\hat{\unicode[STIX]{x1D6FE}}$
and
 $\hat{K}$
, and
 $\unicode[STIX]{x1D717}_{c}=0.06$
,
 $\unicode[STIX]{x1D705}\unicode[STIX]{x03C0}\unicode[STIX]{x1D700}/4\approx 0.364$
in (2.16), therefore, it is reasonable to neglect the elastic contribution to the spreading parameter. This is in agreement with liquid crystals of low molar mass, where the anchoring energy on the free surface is usually significantly smaller than the isotropic surface tension energy (see Rey Reference Rey2000). Neglecting the elastic term in (2.16) then
 $\hat{A}=\hat{\unicode[STIX]{x1D6FE}}\unicode[STIX]{x1D717}_{c}^{2}/\hat{b}$
, and with
 $\unicode[STIX]{x1D717}_{c}=0.06$
, we then obtain
 ${\mathcal{K}}=36.0$
.
2.4 Linear stability analysis (LSA)
We now focus on the stability properties of a flat film, and in particular on the influence of the average film thickness,
 $H_{0}$
. For this purpose, we first carry out LSA of a flat film solution to our governing equation (2.10). Assuming a solution of the form
 $h(x,t)=H_{0}+\unicode[STIX]{x1D716}\text{e}^{\text{i}qx+\unicode[STIX]{x1D714}t}$
, where
 $0<\unicode[STIX]{x1D716}\ll 1$
, substitution in (2.10) yields the dispersion relation
 $$\begin{eqnarray}\displaystyle \unicode[STIX]{x1D714}=-H_{0}^{3}[{\mathcal{C}}q^{2}-{\unicode[STIX]{x1D6F1}_{eff}}^{\prime }(H_{0})]q^{2}, & & \displaystyle\end{eqnarray}$$
where
 $$\begin{eqnarray}\displaystyle {\unicode[STIX]{x1D6F1}_{eff}}^{\prime }(h)={\mathcal{K}}f^{\prime }(h)-{\mathcal{N}}\frac{M(h)}{h^{3}};\quad M(h)=m^{2}(h)-hm(h)m^{\prime }(h), & & \displaystyle\end{eqnarray}$$
with
 $f(h)$
defined by (2.9),
 $m(h)$
by (2.3) and parameters
 ${\mathcal{C}}$
,
 ${\mathcal{K}}$
, and
 ${\mathcal{N}}$
by (2.4); their values are given in § 2.3.
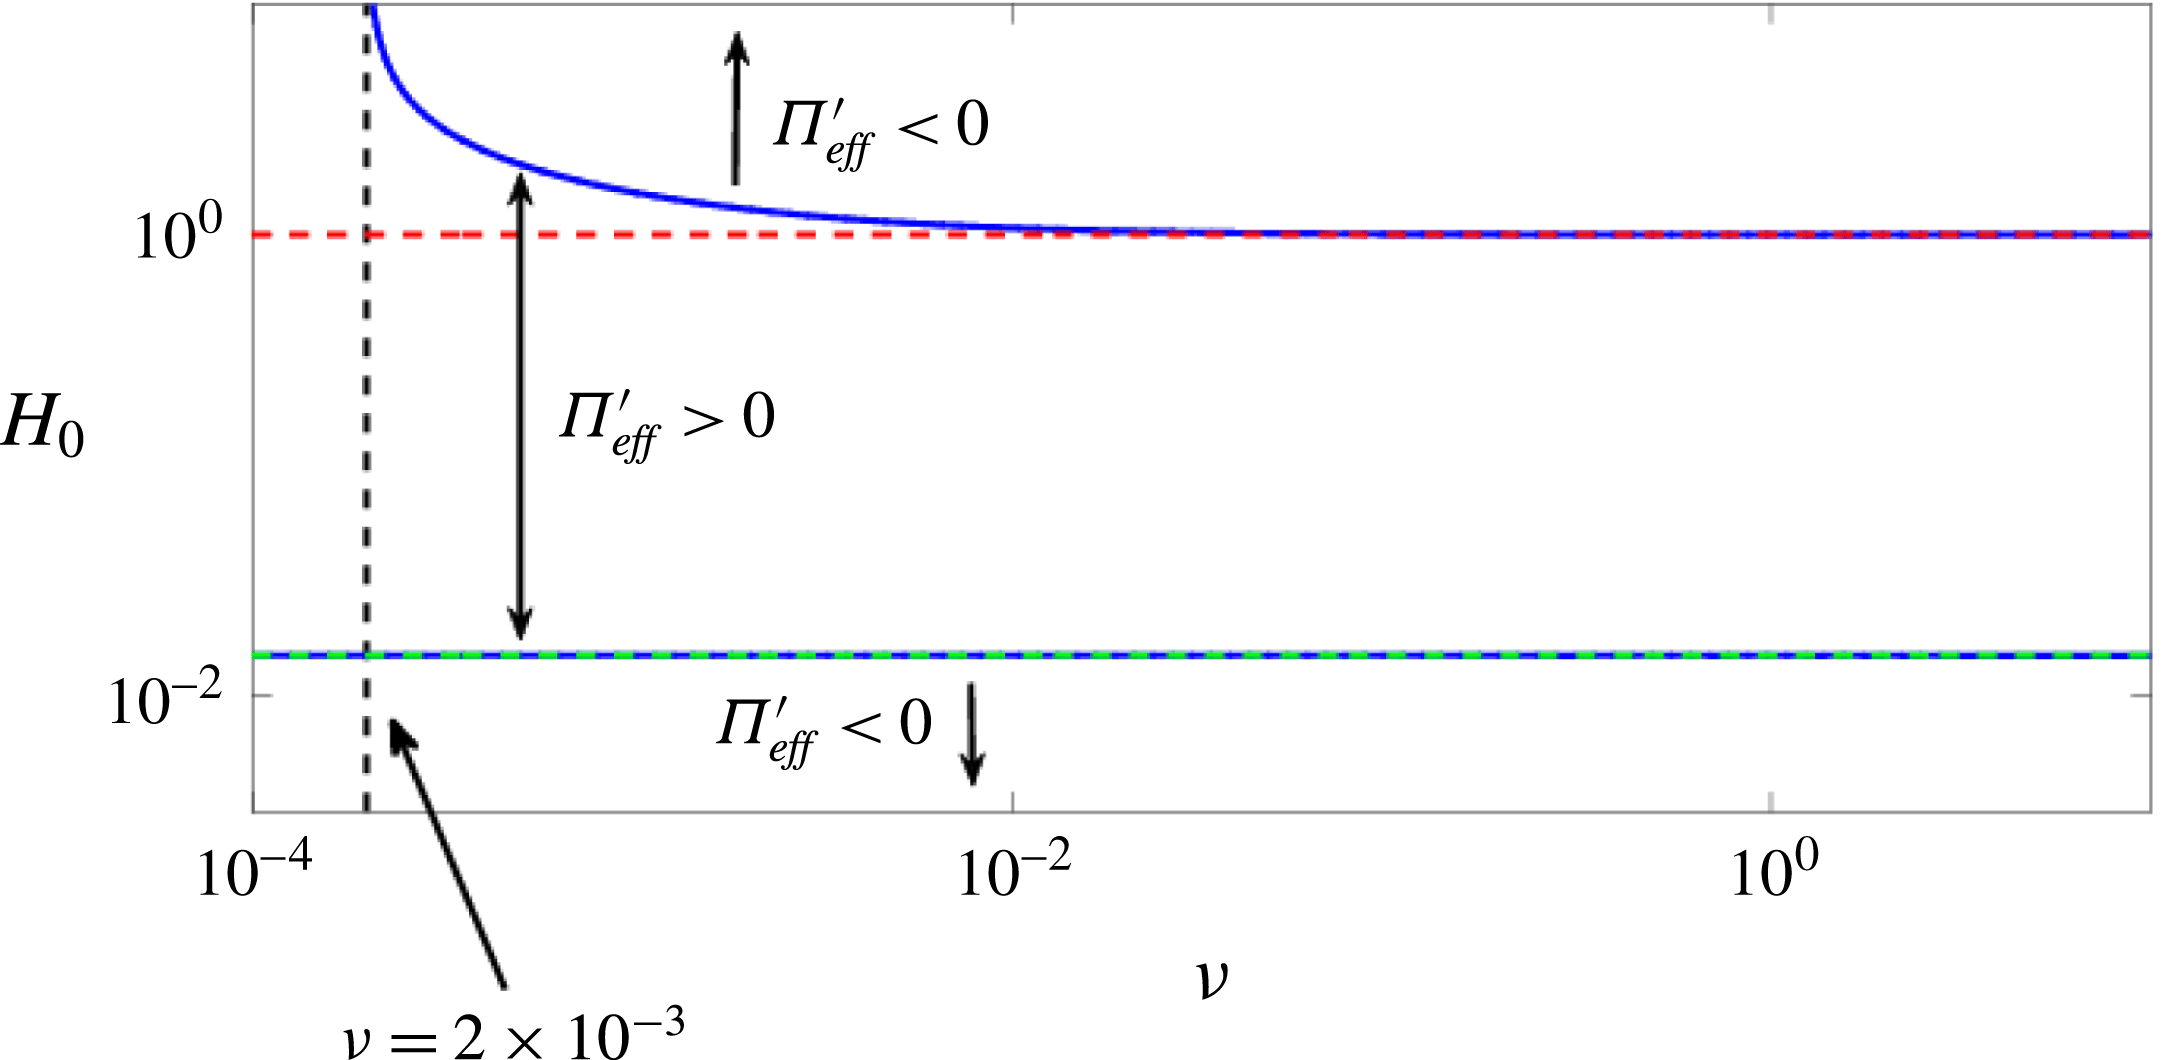
The zeros of (2.20) (blue solid curves), the zero of
 $M(H_{0})$
(top horizontal dashed red line), and the zero of
 $f^{\prime }(H_{0})$
(dashed cyan line, lying almost entirely on the lower blue curve). The region enclosed by the blue curves denotes film thicknesses
 $H_{0}$
that are linearly unstable, i.e.
 ${\unicode[STIX]{x1D6F1}_{eff}}^{\prime }(H_{0})>0$
. The lower horizontal dashed black line corresponds to a critical
 ${\mathcal{N}}/{\mathcal{K}}$
value; below that value, the destabilising effect of fluid/solid interaction is stronger than the stabilising elastic response.

Assuming that
 $q$
is real, a film is always stable if
 ${\unicode[STIX]{x1D6F1}_{eff}}^{\prime }(H_{0})<0$
, and is unstable otherwise. Therefore, the values of
 $H_{0}$
for which the film is unstable are determined by the roots of
 $$\begin{eqnarray}\displaystyle \frac{{\unicode[STIX]{x1D6F1}_{eff}}^{\prime }(H_{0})}{{\mathcal{K}}}=f^{\prime }(H_{0})-\frac{{\mathcal{N}}}{{\mathcal{K}}}\frac{M(H_{0})}{H_{0}^{3}}, & & \displaystyle\end{eqnarray}$$
which are calculated numerically and plotted (as two blue curves) in figure 3 in the
 $({\mathcal{N}}/{\mathcal{K}},H_{0})$
-plane. In addition the roots of
 $f^{\prime }(H_{0})=0$
and
 $M(H_{0})=0$
are also plotted. Denoting the two roots of (2.20) as
 $H_{-}$
(the smaller root) and
 $H_{+}$
(the larger root), and noting that the region enclosed by blue curves corresponds to
 ${\unicode[STIX]{x1D6F1}_{eff}}^{\prime }(H_{0})>0$
, figure 3 demonstrates that, for
 $H_{0}\in (H_{-},H_{+})$
, a flat film is unstable; therefore, we conjecture that the unstable range of film thicknesses in our model may be related to a range of so-called ‘forbidden thicknesses’ noted experimentally by Cazabat et al. (Reference Cazabat, Delabre, Richard and Sang2011) for comparable films. It can be seen that, for the range of
 ${\mathcal{N}}/{\mathcal{K}}$
considered,
 $H_{-}$
is closely approximated by the zero of the disjoining pressure
 $f^{\prime }(H_{-})\approx 0$
; thus
 $H_{-}\approx 3b/2$
(see (2.9)): the lower thickness threshold between linear stability and instability is primarily determined by fluid/solid interaction forces.
For
 ${\mathcal{N}}/{\mathcal{K}}>0.01$
, the largest root of (2.20),
 $H_{+}$
, corresponds approximately to the root of
 $M(H_{0})$
, suggesting that, for sufficiently strong elasticity, the upper threshold between linear instability and stability is determined by the antagonistic anchoring conditions (elastic response). For
 $H_{0}\gg b=0.01$
, we may simplify
 $M(H_{0})$
(see its definition in (2.19)) by setting
 $g(H_{0})=1$
in (2.3), and
 $H_{+}\approx \unicode[STIX]{x1D6FD}$
can be found analytically. This is confirmed numerically using the values from § 2.3, which give
 ${\mathcal{N}}/{\mathcal{K}}=0.0514$
; the second root of (2.20) is then found to be
 $H_{+}\approx 1.0150\approx \unicode[STIX]{x1D6FD}$
(see (2.14)).
In the linearly unstable regime, only perturbations with wavenumber
 $q\in (0,q_{c})$
are unstable; here
 $q_{c}$
is the critical wavenumber given by
 $q_{c}=\sqrt{{\unicode[STIX]{x1D6F1}_{eff}}^{\prime }(H_{0})/{\mathcal{C}}}$
(see (2.18)). The most unstable mode is given by
 $q_{m}=q_{c}\sqrt{2}=2\unicode[STIX]{x03C0}/\unicode[STIX]{x1D706}_{m}$
, with the growth-rate
 $$\begin{eqnarray}\displaystyle \unicode[STIX]{x1D714}_{m}=\frac{Q(H_{0})[{\unicode[STIX]{x1D6F1}_{eff}}^{\prime }(H_{0})]^{2}}{4{\mathcal{C}}}=\frac{H_{0}^{3}[{\unicode[STIX]{x1D6F1}_{eff}}^{\prime }(H_{0})]^{2}}{4{\mathcal{C}}}, & & \displaystyle\end{eqnarray}$$
(see (2.11)). We will use these quantities later in the text. Note that in dimensionless form,
 $q_{c}$
and
 $q_{m}$
do not depend on the mobility function
 $Q(h)$
and the range(s) of unstable thicknesses is/are determined by
 $\unicode[STIX]{x1D6F1}_{eff}(h)$
. Furthermore, the mobility function only affects the growth rate of the instability.
2.5 Comparison to other models
There are several differences between the effective disjoining pressure used in our model (2.8) and others used in the literature. Unique to our model is weak free surface anchoring, which relaxes the free surface azimuthal anchoring as the film height evolves. This leads to a critical thickness value,
 $\unicode[STIX]{x1D6FD}$
, below which the elastic contribution (ignoring fluid/solid interaction forces) is linearly destabilising for a flat film, and above which it is linearly stabilising. Furthermore, and as discussed above, figure 3 shows that for
 ${\mathcal{N}}\gg {\mathcal{K}}$
,
 $H_{+}\approx \unicode[STIX]{x1D6FD}$
, i.e. the upper bound between linear instability and stability is controlled by the elastic response. In comparison, the model presented by Vandenbrouck et al. (Reference Vandenbrouck, Valignat and Cazabat1999) sets the free surface azimuthal anchoring conditions to be a constant for all film thicknesses (the value of which is determined by the average initial film thickness). This is equivalent to strong anchoring (
 $m(h)=1$
in our model), which leads to the elastic response being always linearly stabilising; therefore, in the theory of Vandenbrouck et al. (Reference Vandenbrouck, Valignat and Cazabat1999), the upper threshold between linear instability and stability,
 $H_{+}$
, is determined by the balancing of the destabilising disjoining pressure and the stabilising elastic response, regardless of the values of
 ${\mathcal{N}}$
and
 ${\mathcal{K}}$
.
Furthermore, we note that the effective disjoining pressure term in our model may be expressed as
 $$\begin{eqnarray}\displaystyle {\unicode[STIX]{x1D6F1}_{eff}}^{\prime }(h)h_{x} & = & \displaystyle {\mathcal{K}}f^{\prime }(h)h_{x}-\frac{{\mathcal{N}}}{h^{3}}[m^{2}(h)-hm(h)m^{\prime }(h)]h_{x}\nonumber\\ \displaystyle & = & \displaystyle {\mathcal{K}}f^{\prime }(h)h_{x}-\frac{{\mathcal{N}}m^{2}(h)}{h^{3}}h_{x}-\frac{\unicode[STIX]{x1D735}{\mathcal{G}}(h)}{h},\end{eqnarray}$$
where
 $\unicode[STIX]{x1D735}{\mathcal{G}}(h)$
is the gradient of the free surface anchoring energy. The derivation of
 ${\mathcal{G}}(h)$
is non-trivial and we refer the reader to our previous work for further details (Lam et al.
Reference Lam, Cummings, Lin and Kondic2014; Lin et al.
Reference Lin, Kondic, Thiele and Cummings2013b
). Since the second term on the right-hand side of the last equation in (2.22) is always stabilising, instability arises from the gradients of the free surface anchoring energy (the last term in (2.22)), present only for non-constant
 $m(h)$
(i.e., only for weak anchoring). Thus our model includes an alternative instability mechanism due to elastic forces not captured by the model in Vandenbrouck et al. (Reference Vandenbrouck, Valignat and Cazabat1999).
Excluding the
 $h^{-3}$
term, the effective disjoining pressure in our model (2.8) is qualitatively similar to the total disjoining pressure derived by Ziherl et al. (Reference Ziherl, Podgornik and Z̆umer2000). This term is, however, essential for the purpose of carrying out numerical simulations. In the work by Ziherl et al. (Reference Ziherl, Podgornik and Z̆umer2000), the structural component to the disjoining pressure was derived by first considering the elastic energy due to fluctuations in the director field from some initial state. A critical thickness was defined such that, below this threshold, the initial director field state is uniform, and above, the director field is in the HAN state. Therefore our model has similar underlying physical mechanisms driving instability: (1) transition between a uniform director field for thin films to the HAN state for thick films; (2) interplay between bulk elastic energy and surface anchoring energy as the film thickness changes; and (3) inclusion of fluid/solid interaction forces.
However, there are also the following key differences: (1) the transition between the planar state and the HAN state is continuous in our model, whereas it is discontinuous in Ziherl et al. (Reference Ziherl, Podgornik and Z̆umer2000); (2) Ziherl et al. (Reference Ziherl, Podgornik and Z̆umer2000) assumed that the anchoring at the free surface was stronger than that at the substrate, therefore the uniform director field state for thin films was homeotropic in their model, while it is planar in ours; (3) to obtain similar linearly stable and unstable film thickness values with their model would require setting
 $\unicode[STIX]{x1D6FD}\approx 0.2$
; and (4) only the total disjoining pressures are similar between the two models, the individual components (elastic contribution and disjoining pressure minus the
 $h^{-3}$
term), are qualitatively different.
2.6 Numerical scheme
In the following sections we will present a number of numerical simulations of our model in order to study its behaviour in detail. To solve the governing equation (2.10) numerically, we choose a spatial domain
 $x\in [0,x_{L}]$
, and enforce the following boundary conditions,
 $$\begin{eqnarray}\displaystyle h_{x}(0,t)=h_{xxx}(0,t)=0\quad \text{and}\quad h_{x}(x_{L},t)=h_{xxx}(x_{L},t)=0, & & \displaystyle\end{eqnarray}$$
where the right boundary
 $x_{L}$
is chosen as appropriate for the initial condition considered. The numerical method employed is a fully implicit Crank–Nicolson type discretisation scheme, with adaptive time stepping. A Newton iterative method is implemented at each time step to deal with nonlinear terms. More details about the implemented numerical scheme, as well as discussion of its convergence properties can be found in Lin, Kondic & Filippov (Reference Lin, Kondic and Filippov2012) and Witelski & Bowen (Reference Witelski and Bowen2003). For all numerical simulations
 $\unicode[STIX]{x0394}x=b=0.01$
; such a level of discretisation is sufficient to resolve accurately the length scales of interest. Unless stated otherwise, the parameters in governing equation (2.10) are as given in § 2.3.
3 Films exposed to global perturbations
In this section, we present simulation results for films of thickness
 $H_{0}$
with superimposed perturbations that are non-local in character (cover the whole domain) and are intended to model infinitesimal random perturbations that are expected to be present in physical experiments. We focus on investigating film thicknesses in the linearly unstable regime,
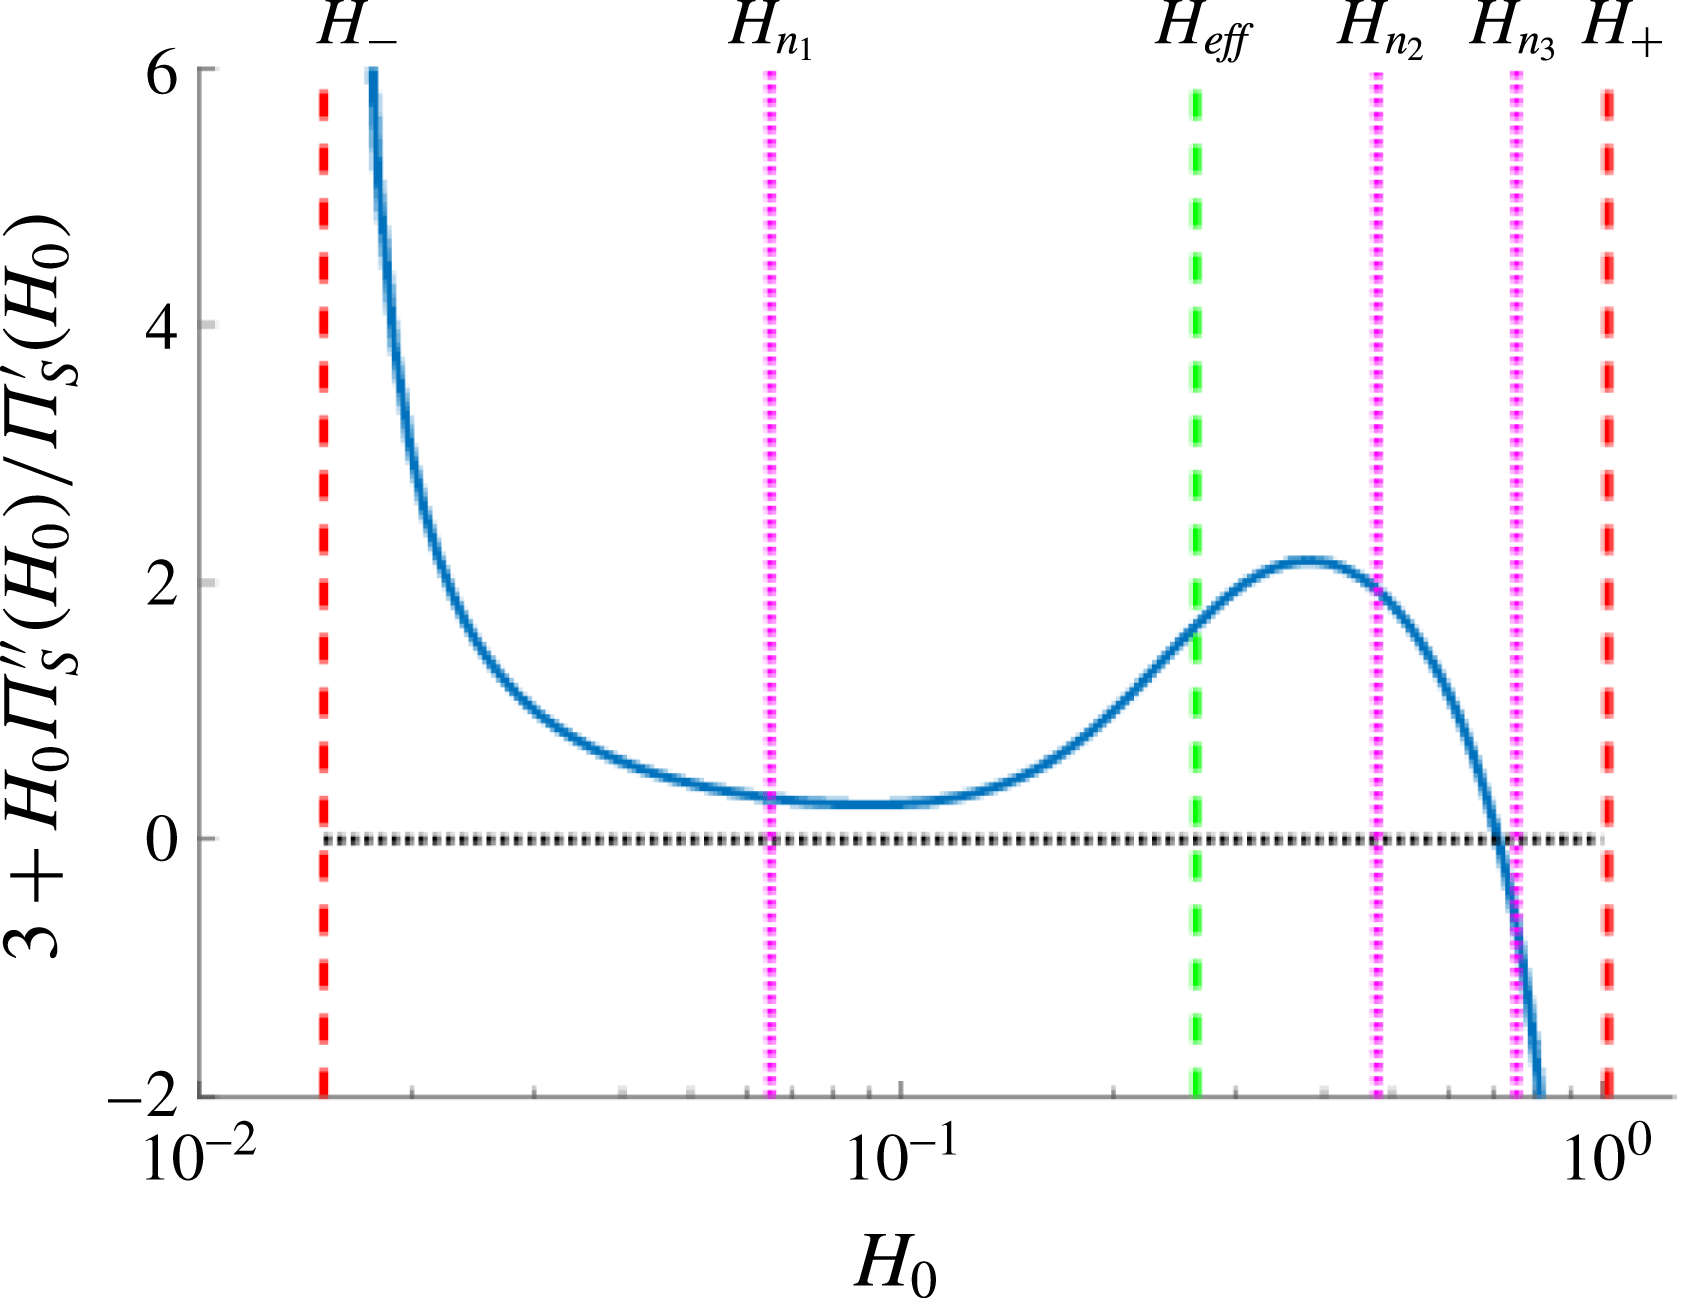
 $H_{0}\in (H_{-},H_{+})\approx (0.015,1.015)$
, and the morphology of dewetted films as a function of
 $H_{0}$
. We start by discussing results for films perturbed by a single wavelength, on a domain equal in size to the imposed perturbation wavelength, and then proceed to consider random perturbations and large domains.
3.1 Simulations: single wavelength perturbation
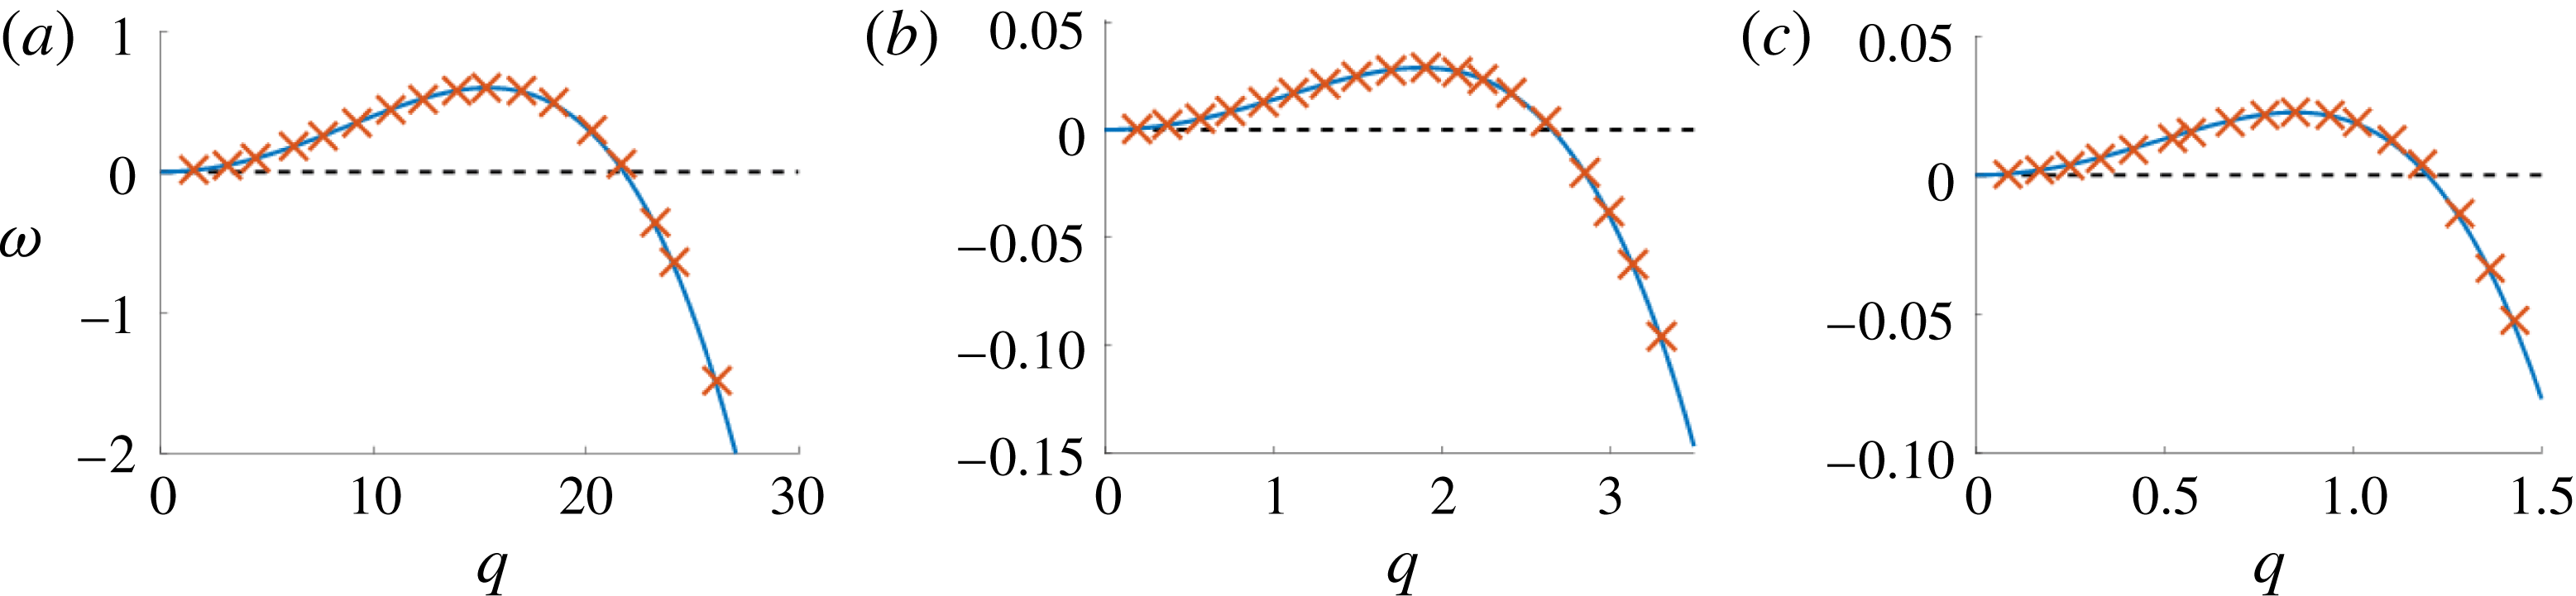
To begin, we validate the numerical scheme by comparing the growth rates extracted from numerical simulations to the expression (2.18) derived from LSA. The initial condition is of the form
 $$\begin{eqnarray}\displaystyle h(x,t=0;H_{0},q)=H_{0}[1+0.01\cos (qx)],\quad x\in [0,x_{L}],\quad x_{L}=\frac{2\unicode[STIX]{x03C0}}{q}, & & \displaystyle\end{eqnarray}$$
where
 $H_{0}$
and
 $q$
will be used to parameterise (3.1). From LSA, the evolution of the above initial condition is approximately given by
 $h(x,t)=H_{0}[1+0.01\text{e}^{\unicode[STIX]{x1D714}t}\cos (qx)]$
, i.e., at early times, the perturbation to the flat film grows exponentially. To extract the growth rate from a simulation, we first compute the difference between the numerical solution at the centre of the domain and the initial film thickness: specifically, we compute
 $E(t)=h(x_{L}/2,t)-H_{0}\approx 0.01H_{0}\text{e}^{\unicode[STIX]{x1D714}t}$
. Thus using a linear least squares method to fit
 $\log (E(t))$
, the growth rate,
 $\unicode[STIX]{x1D714}$
, is given by the gradient of the line of best fit. In figure 4, the growth rates extracted from simulations are compared to those given by the dispersion relation. We see that the numerical simulations and LSA agree extremely well over the range of unstable film thicknesses and
 $q$
-values considered.


Free surface evolution for various initial average film thicknesses,
 $H_{0}$
. The initial condition is given by (3.1) with
 $x_{L}=\unicode[STIX]{x1D706}_{m}$
. Other parameters are given in § 2.3. (a)
 $H_{0}=0.2$
,
 $\unicode[STIX]{x1D714}_{m}^{-1}\approx 34.22$
, (b)
 $H_{0}=0.3$
,
 $\unicode[STIX]{x1D714}_{m}^{-1}\approx 34.64$
, (c)
 $H_{0}=0.6$
,
 $\unicode[STIX]{x1D714}_{m}^{-1}\approx 19.21$
, (d)
 $H_{0}=0.95$
,
 $\unicode[STIX]{x1D714}_{m}^{-1}\approx 423.4$
.

To proceed, we investigate in detail the long-time evolution of the free surface height; in particular, how the resulting film morphologies depend on the initial film thickness,
 $H_{0}$
. To simplify the parameter space, we fix
 $q=q_{m}$
(thus
 $x_{L}=\unicode[STIX]{x1D706}_{m}$
) in (3.1) for the remainder of this section. Figure 5 shows the free surface evolution of the NLC film for several different values of the initial average film thickness,
 $H_{0}$
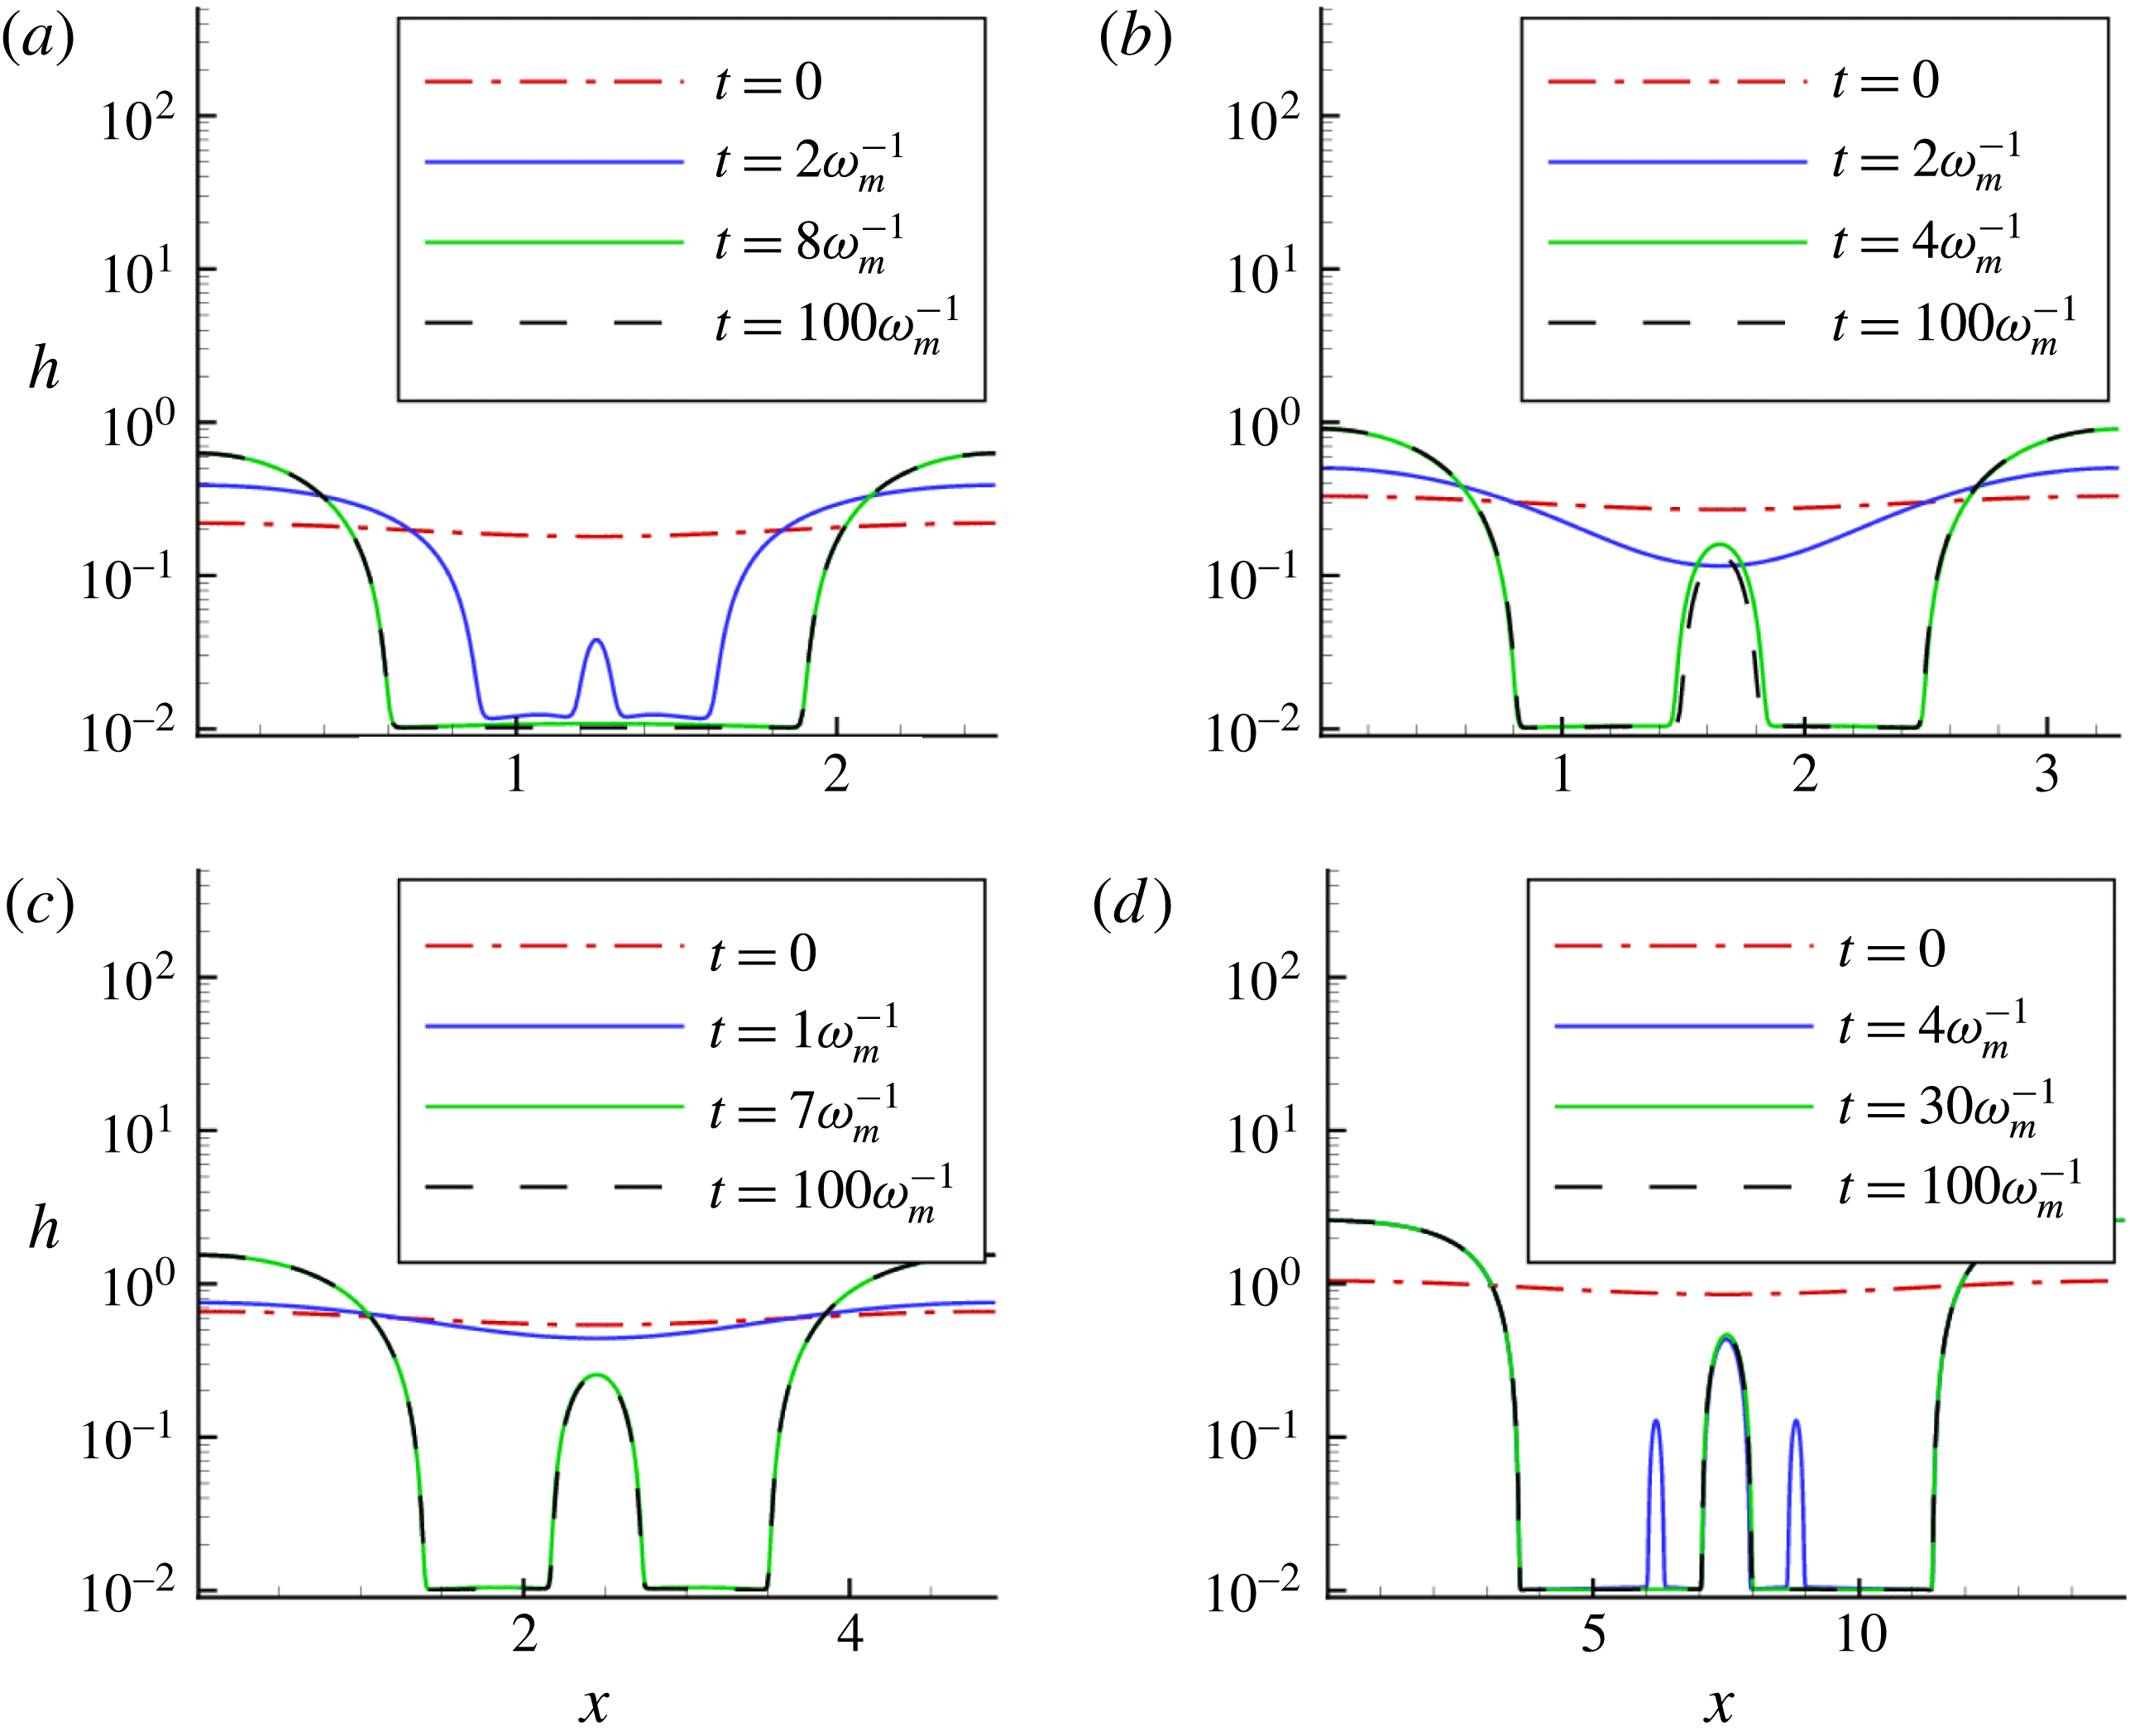
. Initially, the perturbation grows, eventually forming large drops at the domain boundaries, as expected from LSA, and an additional secondary drop at the centre. Note that to properly visualise smaller drops, we plot the free surface height on a log scale. On time scales much longer than the breakup time, comparable to
 $\unicode[STIX]{x1D714}_{m}^{-1}$
, different dynamics emerge, however, depending on the film thickness
 $H_{0}$
. For thinner films, shown in figure 5(a), the secondary drop persists for a short time only; while for thicker films, see figure 5(b,c), the secondary drops exist on a long time scale. For films near the critical thickness of linear instability, see figure 5(d), we observe an additional set of tertiary drops forming on either side of the secondary drop. These tertiary drops form at the same time as the primary drops, and exist on a time scale that is longer than that of dewetting, but shorter than that on which the secondary drop persists. We note that the times considered here are not asymptotically long, as considered by Glasner & Witelski (Reference Glasner and Witelski2003).
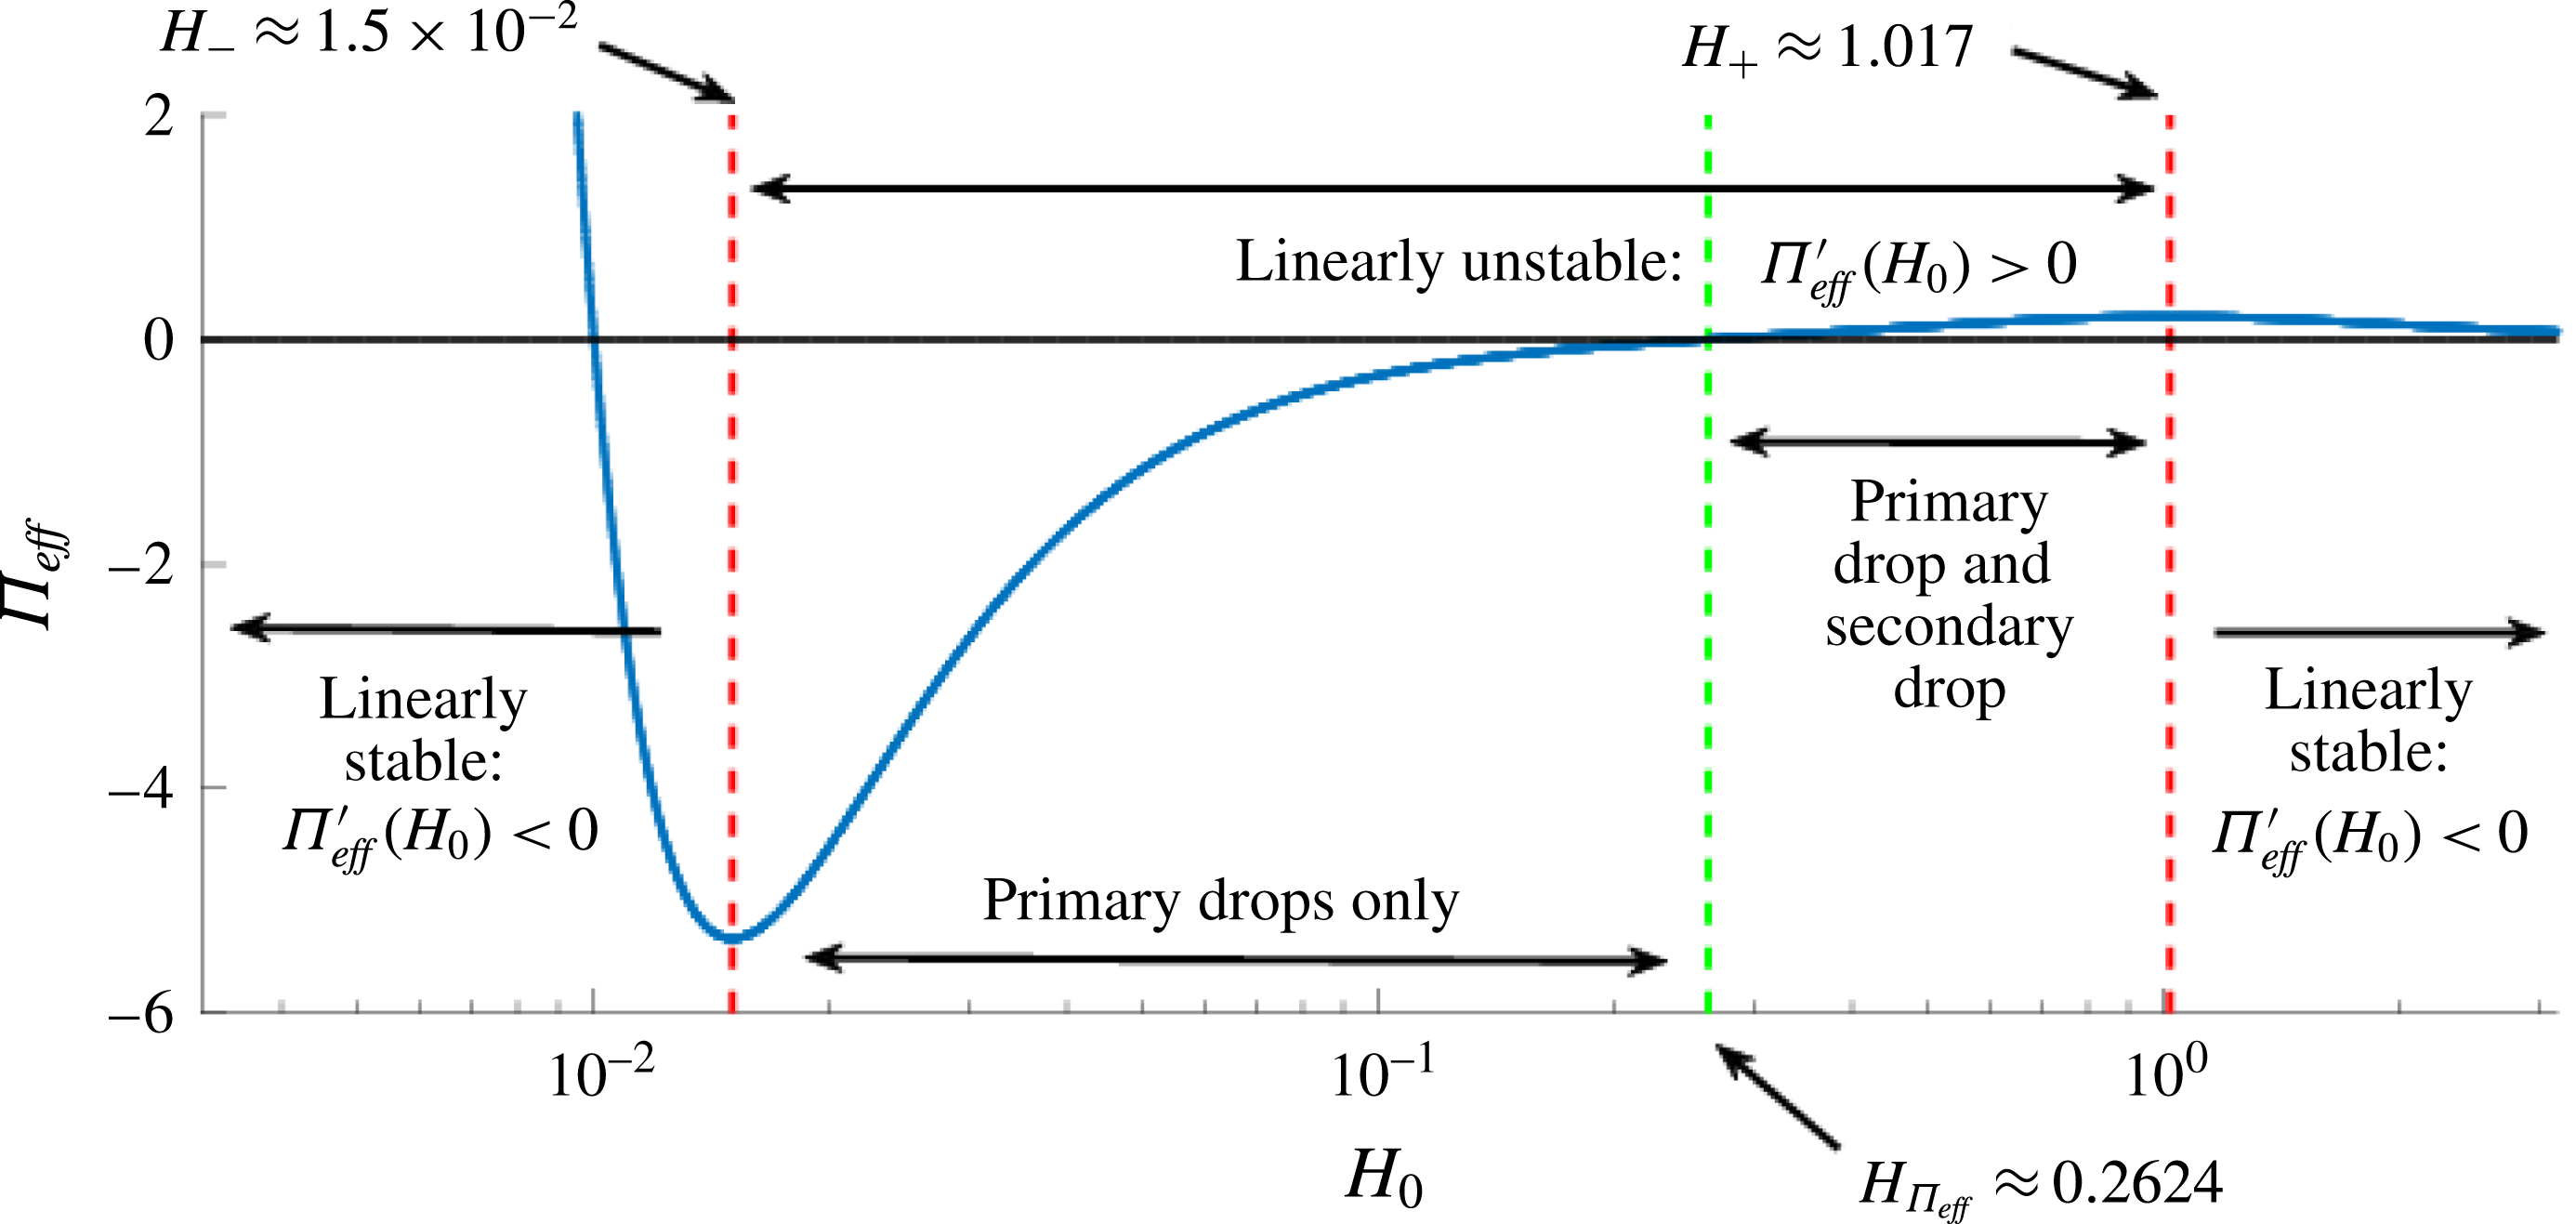
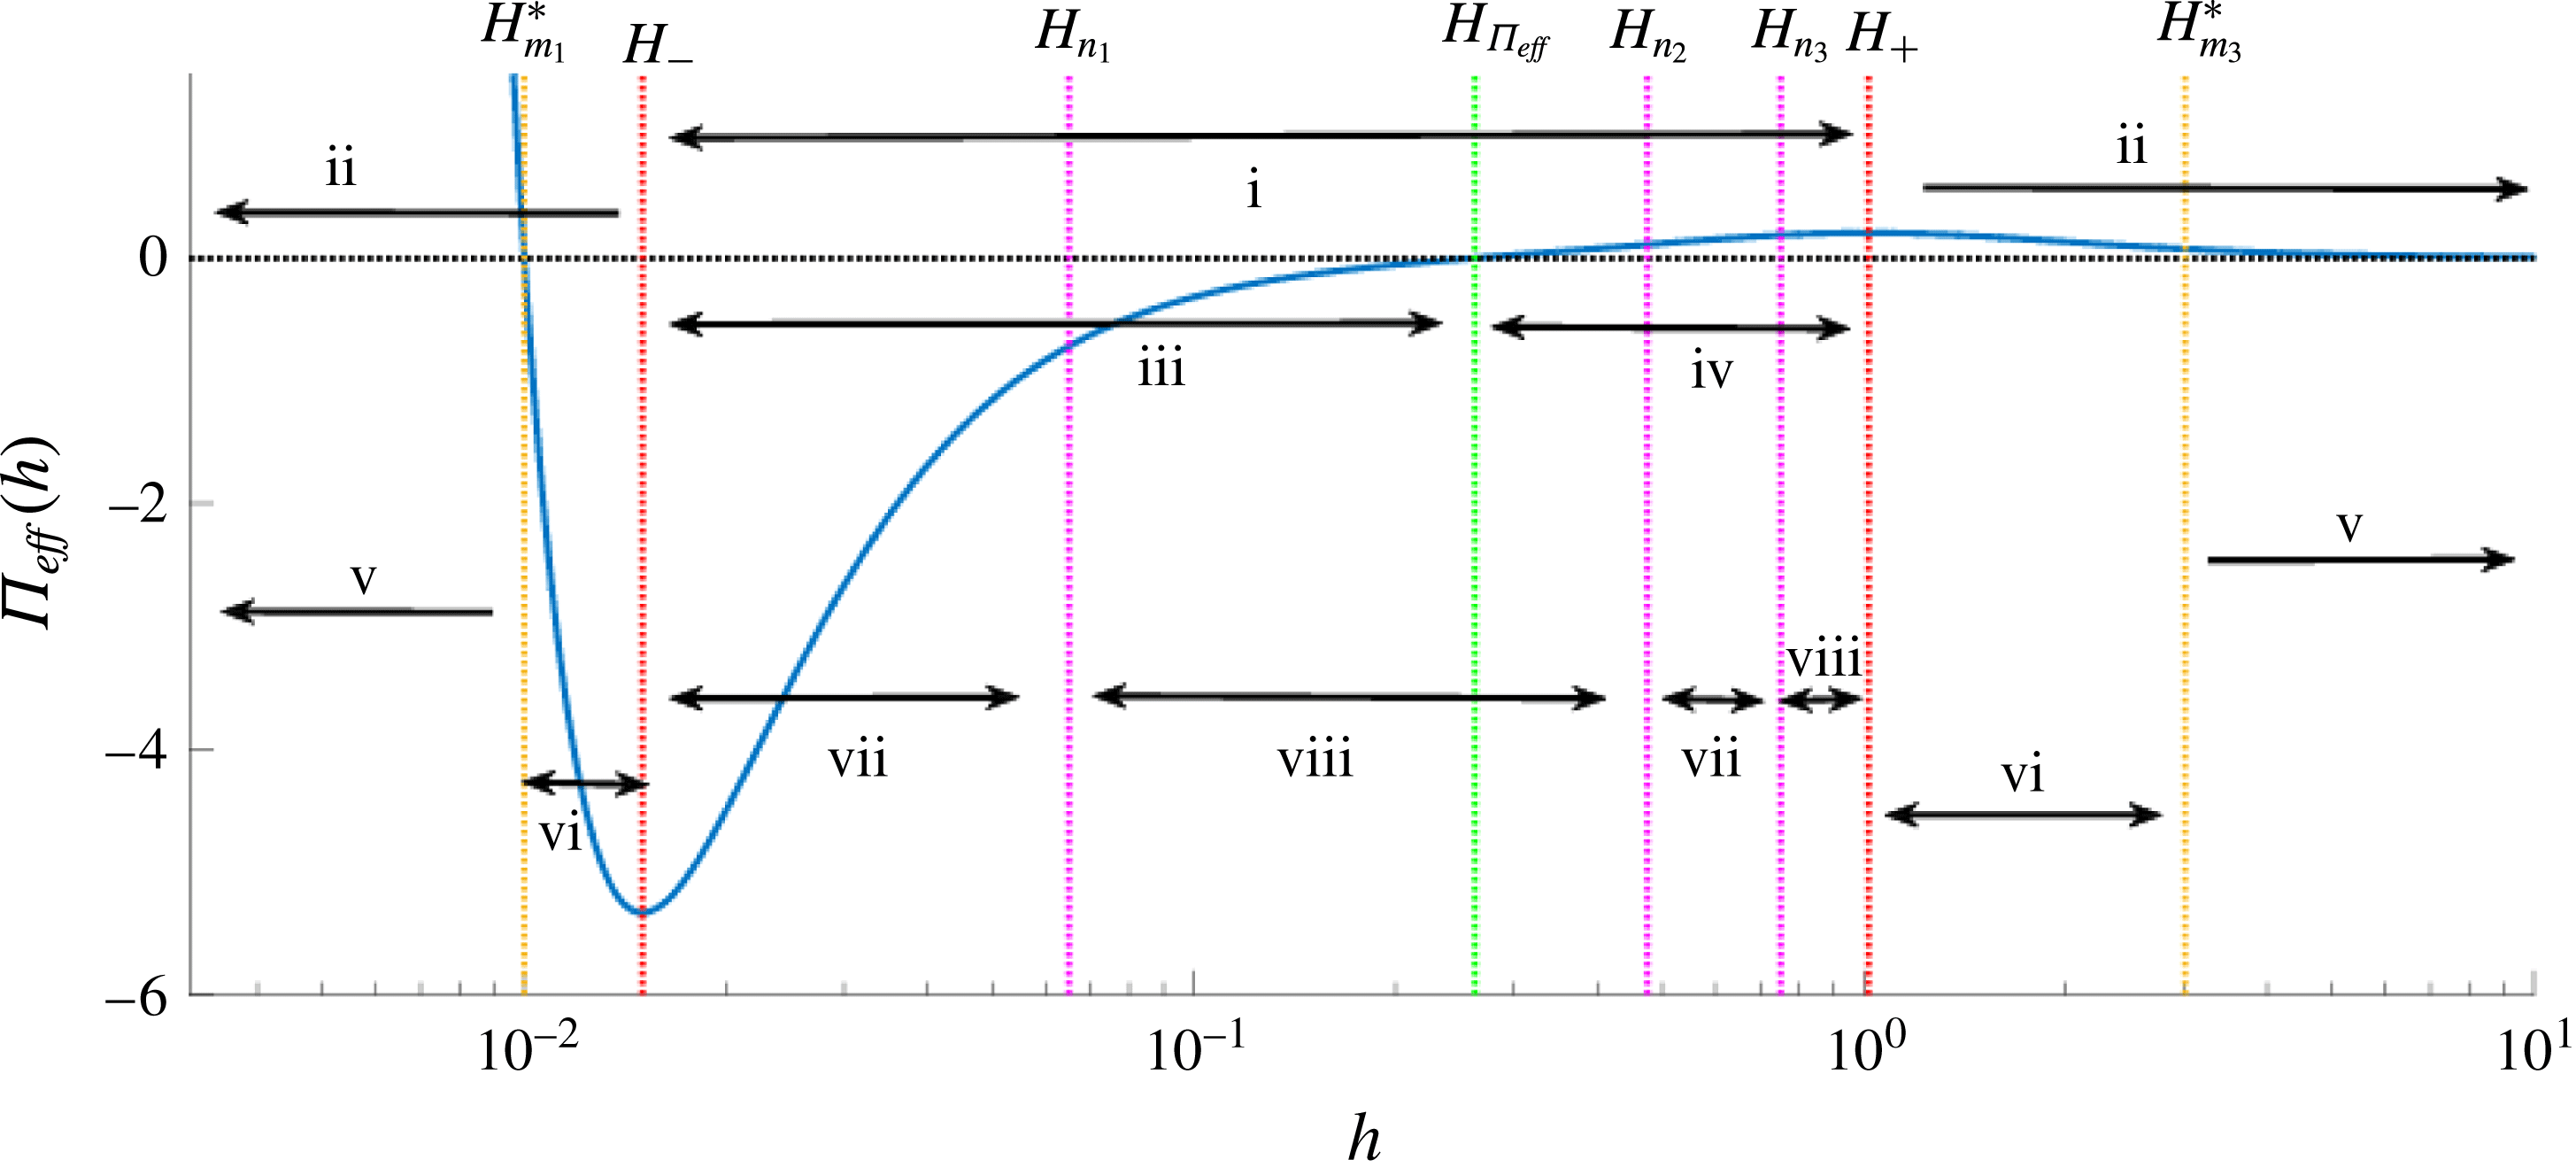
A summary of the final states obtained in simulations and their relationship to the effective disjoining pressure. The region enclosed by the (outer) dashed red lines is unstable. The dashed green line, at
 $H=H_{\unicode[STIX]{x1D6F1}_{eff}}$
, corresponds to the zero of the effective disjoining pressure. These line patterns will be used consistently for all remaining figures in this paper.

Our simulations reveal that droplets may be classified according to their heights, with distinct droplet sizes emerging at different times over the course of a simulation. Figure 6 shows schematically our findings regarding film stability and existence of secondary drops on time scales that are long compared to
 $\unicode[STIX]{x1D714}_{m}^{-1}$
. The region enclosed by the dashed red lines denotes the linearly unstable regime (determined by the zeros of
 ${\unicode[STIX]{x1D6F1}_{eff}}^{\prime }(h)$
, see (2.19)), and the dashed green line corresponds to
 $H_{\unicode[STIX]{x1D6F1}_{eff}}\approx 0.2624$
, the zero of the effective disjoining pressure
 $\unicode[STIX]{x1D6F1}_{eff}$
(2.8). The secondary drops are found only for film thicknesses with positive disjoining pressure, as we discuss further below in § 3.2. To the best of our knowledge, this finding is novel, and is one of the predictions of the present work. It would be of interest to verify it experimentally, not only for NLC films, but also for other films where positive disjoining pressures may be found; for example, for polymer films where positive disjoining pressure is due to fluid/substrate interaction; or for ferrofluid films in electric or magnetic fields (see Seric et al.
Reference Seric, Afkhami and Kondic2014).
3.2 Simulations: multiple random perturbations
To test the connection between the formation of secondary drops and the sign of the disjoining pressure, we carried out simulations in large domains with imposed perturbations of random amplitudes. The initial condition is defined as
 $$\begin{eqnarray}\displaystyle h(x,t=0;H_{0},x_{L})=H_{0}[1+\unicode[STIX]{x1D716}\unicode[STIX]{x1D712}(x;x_{L})],\quad \unicode[STIX]{x1D712}(x;x_{L})=\mathop{\sum }_{n=1}^{300}a_{n}\cos \left(\frac{nx}{x_{L}}\right),\quad x\in [0,x_{L}], & & \displaystyle \nonumber\\ \displaystyle & & \displaystyle\end{eqnarray}$$
where
 $a_{n}\in [-1,1]$
are uniformly distributed,
 $\unicode[STIX]{x1D716}$
is chosen such that
 $|\unicode[STIX]{x1D716}\unicode[STIX]{x1D712}(x;x_{L})|\leqslant 0.01$
(i.e. the total perturbation size is bounded by 0.01), and
 $H_{0}$
and
 $x_{L}$
will be used to parameterise (3.2). Note that for each simulation shown, a new set of random coefficients,
 $a_{n}$
, are generated.
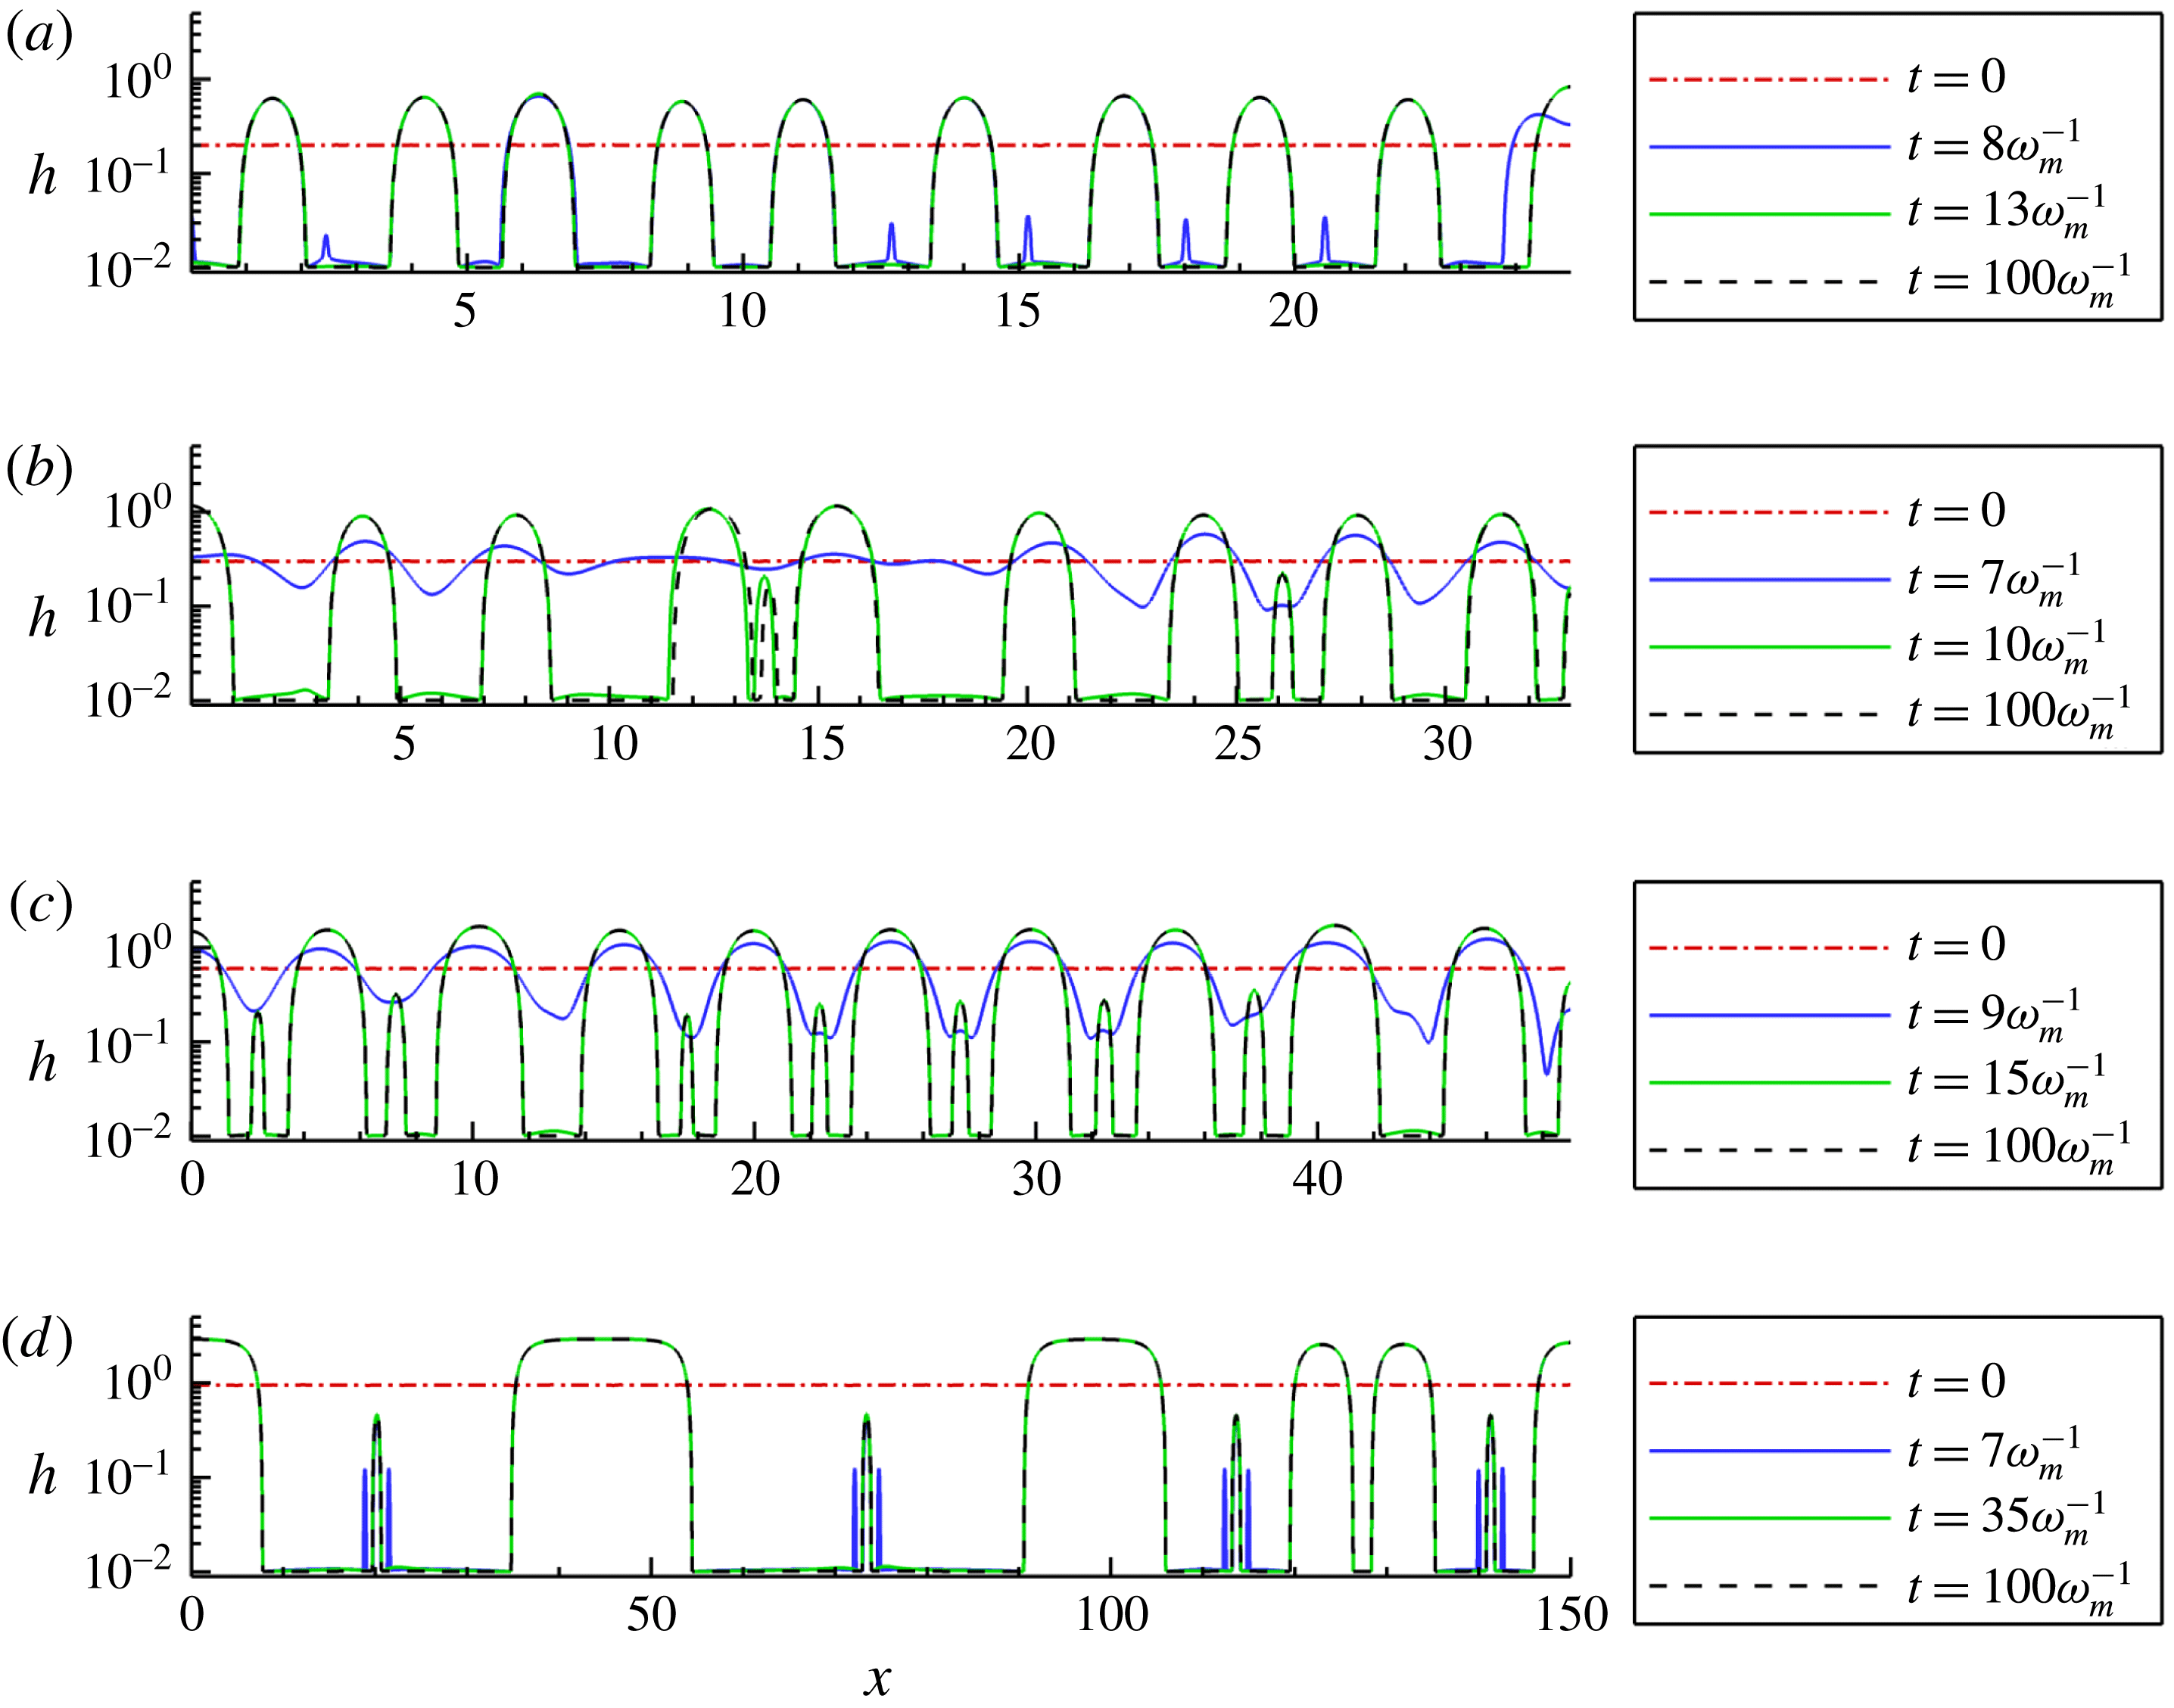
Free surface evolution for various initial average film thicknesses,
 $H_{0}$
. The initial condition is given by (3.2) with
 $x_{L}=10\unicode[STIX]{x1D706}_{m}$
. Other parameters are given in § 2.3. (a)
 $H_{0}=0.2$
,
 $\unicode[STIX]{x1D714}_{m}^{-1}\approx 34.22$
, (b)
 $H_{0}=0.3$
,
 $\unicode[STIX]{x1D714}_{m}^{-1}\approx 34.64$
, (c)
 $H_{0}=0.6$
,
 $\unicode[STIX]{x1D714}_{m}^{-1}\approx 19.21$
, (d)
 $H_{0}=0.95$
,
 $\unicode[STIX]{x1D714}_{m}^{-1}\approx 423.4$
.

Figure 7 shows the free surface evolution for initial condition (3.2) with
 $x_{L}=10\unicode[STIX]{x1D706}_{m}$
, and the same parameters and same range of initial thicknesses,
 $H_{0}$
, as in figure 5. The main observation is that a minimum film thickness is still required for formation of long-lived secondary drops.
To discuss this finding in more detail, we also consider the drop sizes, defined by the heights of drop centres,
 $H_{l}$
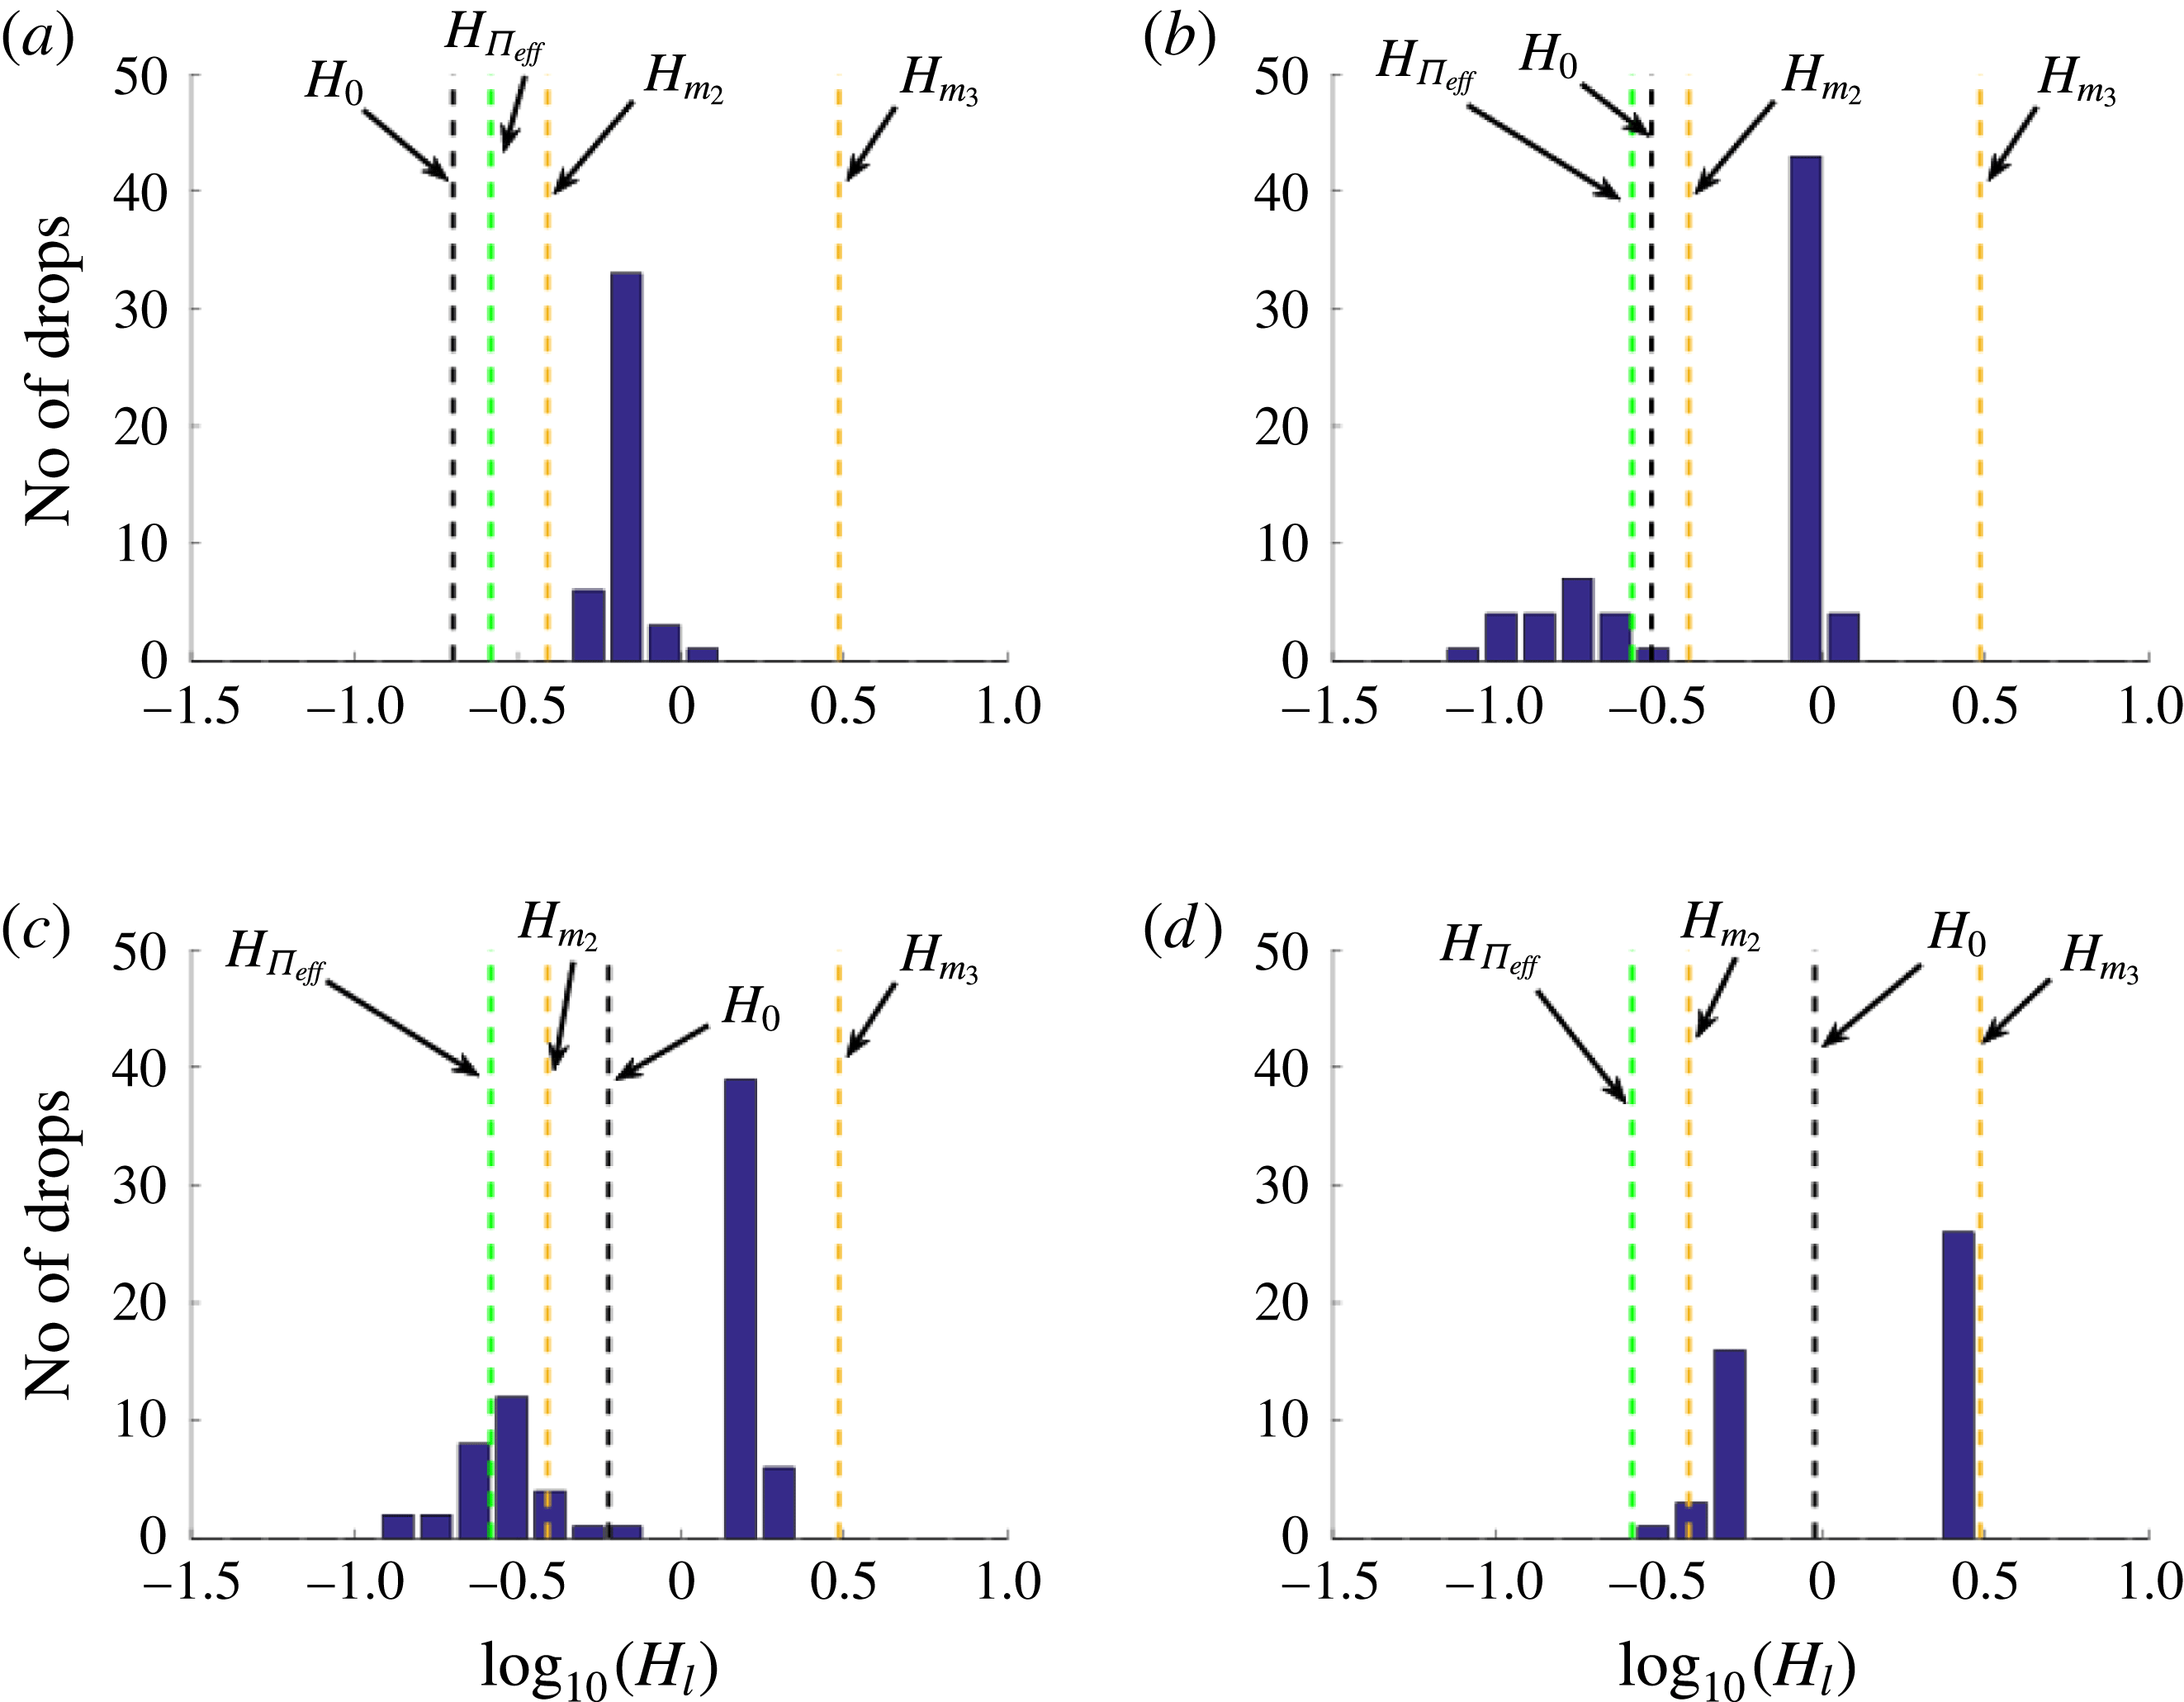
. Figure 8 shows a histogram of the log of the drop heights extracted from simulations corresponding to the same
 $H_{0}$
values as used in figure 7, but carried out on a larger domain (
 $x_{L}=50\unicode[STIX]{x1D706}_{m}$
) to improve statistics. We see that for
 $H_{0}<H_{\unicode[STIX]{x1D6F1}_{eff}}$
, figure 8(a), the distribution is unimodal; and for
 $H_{0}>H_{\unicode[STIX]{x1D6F1}_{eff}}$
, figure 8(b–d), the distribution is bimodal (recall that
 $H_{\unicode[STIX]{x1D6F1}_{eff}}$
is the zero of the effective disjoining pressure,
 $\unicode[STIX]{x1D6F1}_{eff}(H_{\unicode[STIX]{x1D6F1}_{eff}})=0$
). In addition, the dashed black line denotes the initial film thickness
 $H_{0}$
, and it may be seen that
 $H_{0}$
provides an adequate threshold value between (larger) primary drops and (smaller) secondary drops (if they exist). The relevance of the dashed gold lines will be discussed shortly in § 3.3, but for now, note that as
 $H_{0}\rightarrow H_{+}$
(see figure 8
d), the height of primary drops converges to the rightmost gold line.
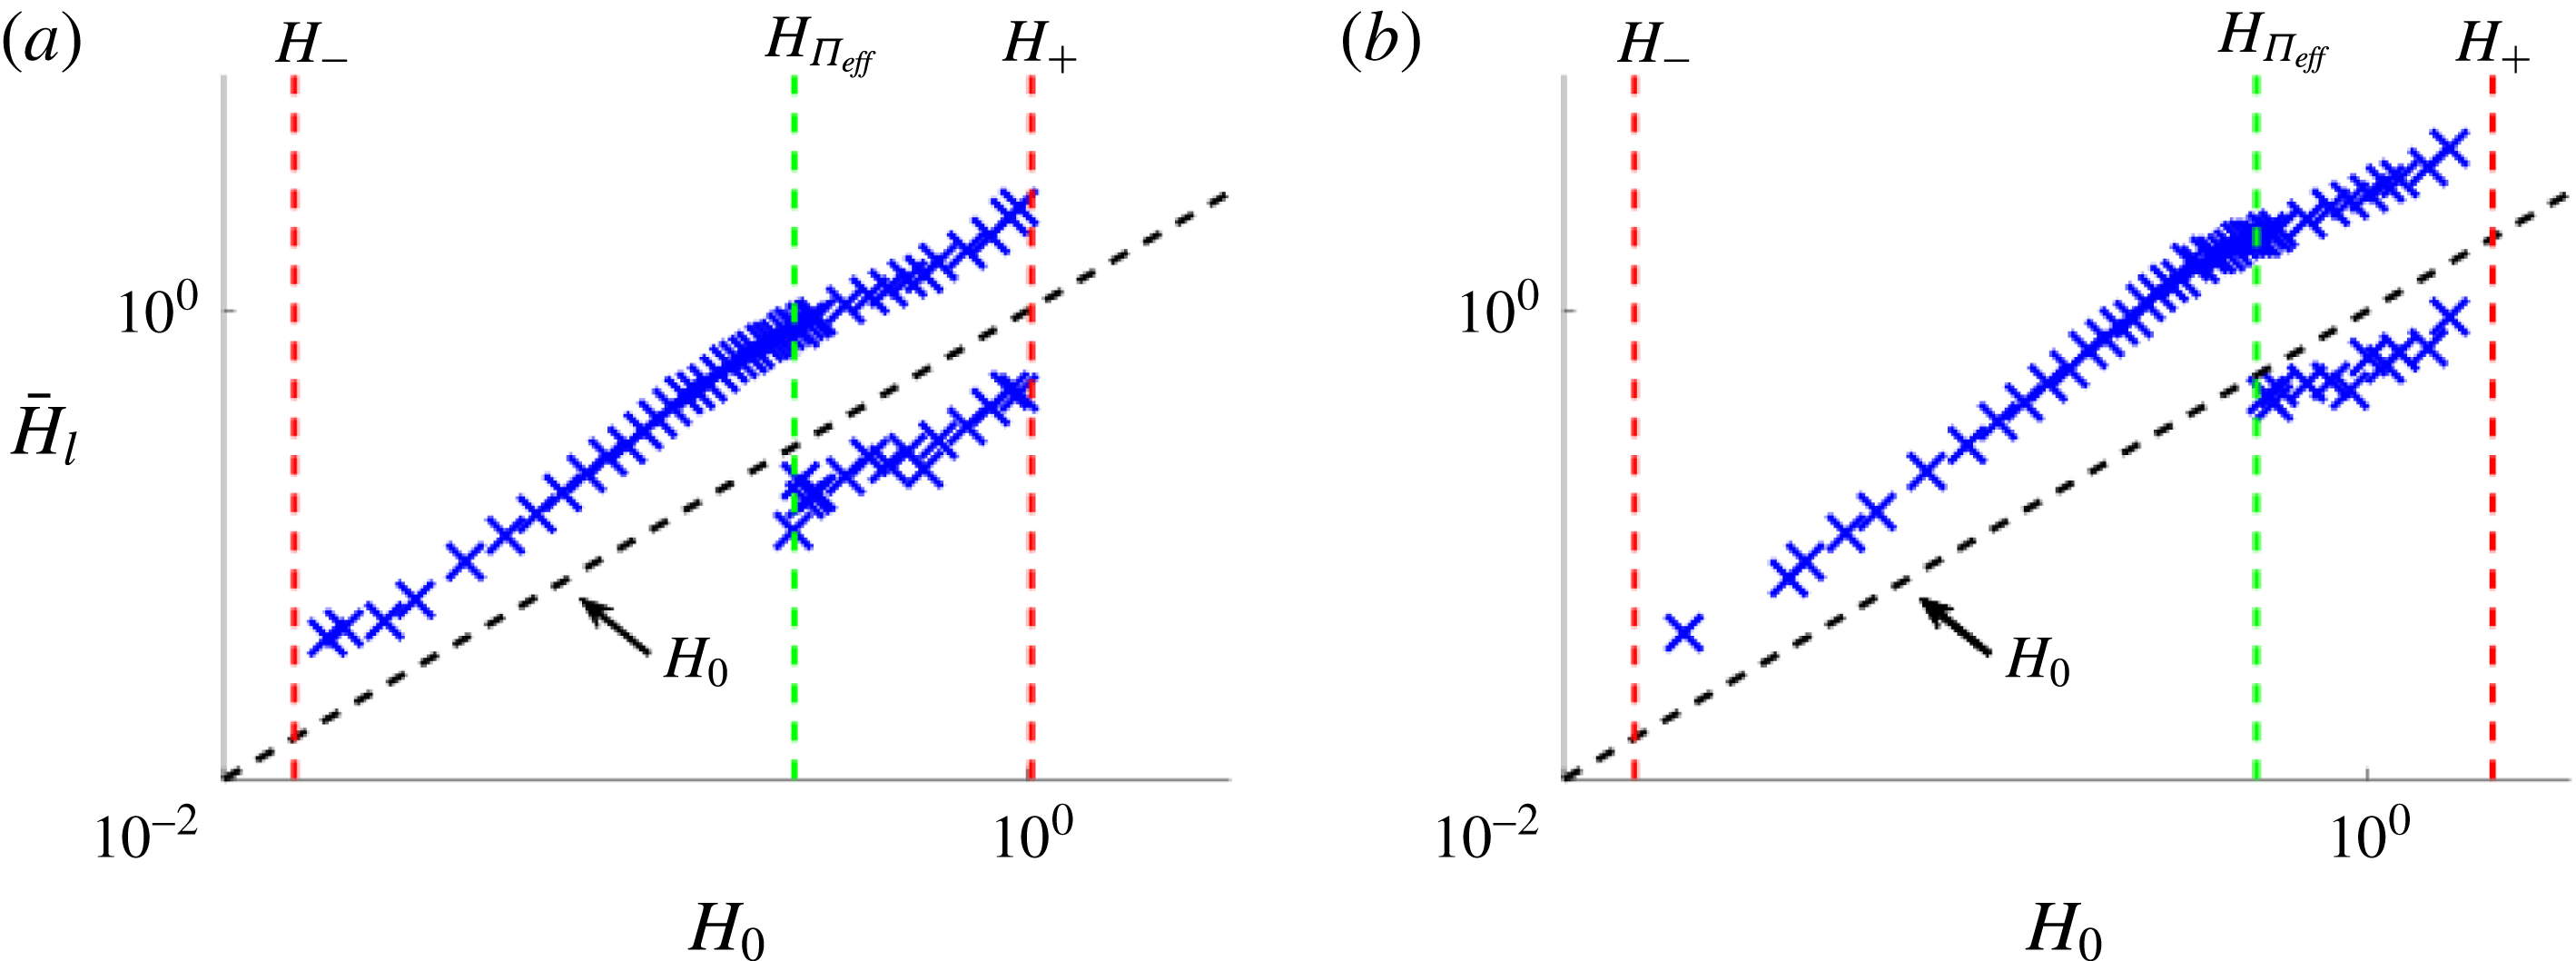
To further illustrate the generality of our finding that secondary drops occur only if
 $\unicode[STIX]{x1D6F1}_{eff}(H_{0})>0$
, we next consider the mode(s) of the drop heights,
 $\bar{H}_{l}$
, the value(s) of which is/are given by the peak(s) of the distribution of
 $H_{l}$
in the histograms in figure 8, for two values of
 $\unicode[STIX]{x1D6FD}$
(the parameter defining the thickness where the bulk elastic energy is comparable to surface anchoring energy, see (2.8)). Figure 9 plots
 $\bar{H}_{l}$
as a function of
 $H_{0}$
: panel (a) corresponds to the parameters used in figure 8 (
 $\unicode[STIX]{x1D6FD}=1$
) and panel (b) shows data for simulations with
 $\unicode[STIX]{x1D6FD}=2$
. We clearly see that, in both cases, the secondary droplets appear only for film heights such that
 $\unicode[STIX]{x1D6F1}_{eff}(H_{0})>0$
, and that
 $H_{0}$
(black dashed line) can be used to differentiate primary and secondary drops.
Histogram of initial individual drop heights extracted from the corresponding simulations in figure 7. We see that when
 $\unicode[STIX]{x1D6F1}_{eff}(H_{0})>0$
, panels (b), (c) and (d), the distribution is bimodal (primary and secondary drops), whereas for
 $\unicode[STIX]{x1D6F1}_{eff}(H_{0})<0$
, panel (a), the distribution is unimodal (primary drops only). The black dashed line denotes the initial film thickness,
 $H_{0}$
, and dashed gold (light grey) lines denote the range of metastable thicknesses, to be discussed in § 4.2.1. (a)
 $H_{0}=0.2$
, (b)
 $H_{0}=0.3$
, (c)
 $H_{0}=0.6$
, (d)
 $H_{0}=0.95$
.

Mode(s) of drop heights (peak(s) of histogram data in figure 8) for (a)
 $\unicode[STIX]{x1D6FD}=1$
and (b)
 $\unicode[STIX]{x1D6FD}=2$
. When
 $\unicode[STIX]{x1D6F1}_{eff}(H_{0})$
changes from negative to positive values green (light grey) dashed line, the distribution of the height of drop centres transitions from unimodal (primary drops only) to a bimodal distribution (primary and secondary drops). Furthermore, the initial film thickness,
 $H_{0}$
(black dashed line), proves an adequate threshold between the heights of the primary and secondary drops. Note that for
 $\unicode[STIX]{x1D6FD}=1,2$
,
 $H_{\unicode[STIX]{x1D6F1}_{eff}}=0.2624,0.5275$
, respectively.

3.3 Relation to previous work
Before closing this section we comment on the relation of our results to those previously reported in the literature on instabilities of polymer films. To begin, we extract the distances,
 $D_{l}$
, between neighbouring primary drop centres (ignoring secondary drops with
 $H_{l}<H_{0}$
), and normalise
 $D_{l}$
by
 $\unicode[STIX]{x1D706}_{m}$
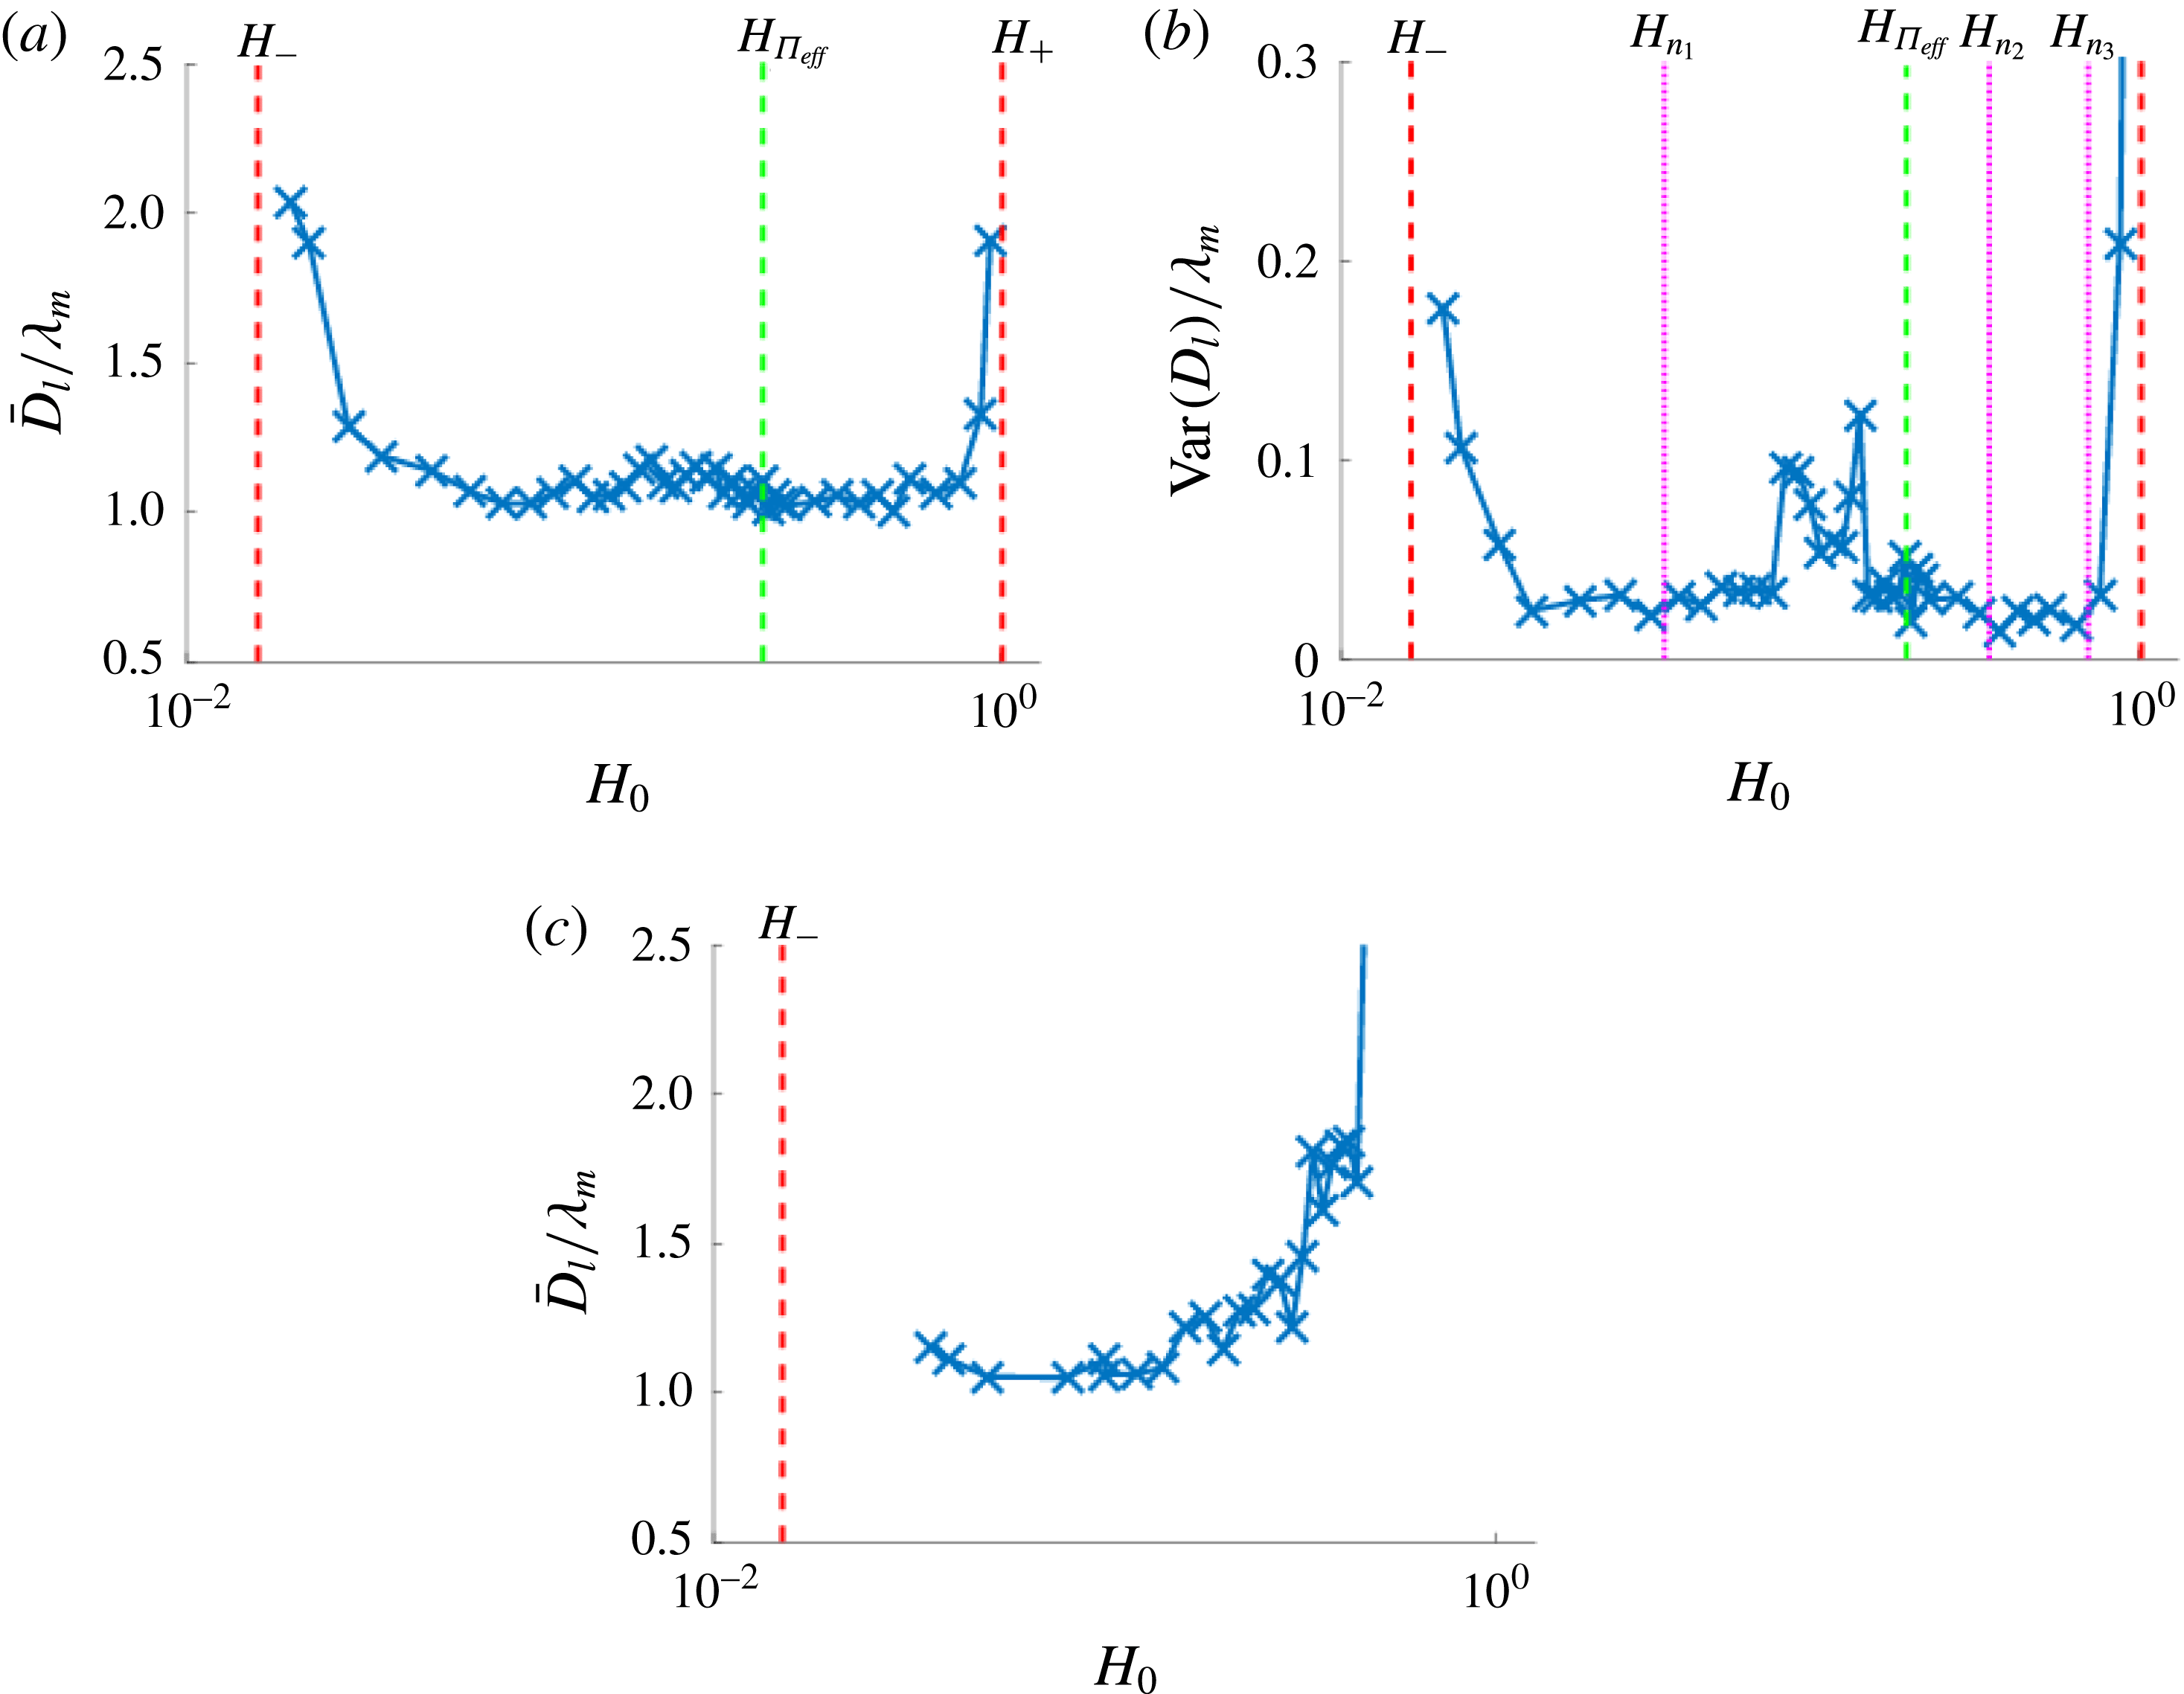
. Figure 10 shows the mean distance,
 $\bar{D}_{l}$
, for both the present model (figure 10
a) and for the Newtonian equivalent (figure 10
c). For
 $H_{0}$
not near the boundaries (
 $H_{\mp }$
) of the linearly unstable regime (for Newtonian films,
 $H_{+}\rightarrow \infty$
within the present model that ignores gravity),
 $\bar{D}_{l}\approx 1.15\unicode[STIX]{x1D706}_{m}$
, consistent with LSA. Near the boundaries, however,
 $\bar{D}_{l}$
increases dramatically and is no longer related to
 $\unicode[STIX]{x1D706}_{m}$
. For very thin films (near
 $H_{-}$
), the increase of
 $\bar{D}_{l}$
is due to coarsening occurring on a time scale similar to that of dewetting; therefore, drops merge before the entire film completely dewets. For thicker films (near
 $H_{+}$
) the increase in the distance between drop centres appears to be due to a different mechanism that appears rather general, since it is operational for both NLC and Newtonian films. Note that, for the same range of thicknesses, Seemann et al. (Reference Seemann, Herminghaus and Jacobs2001b
) suggest that thermal (homogeneous) nucleation may be relevant; our results suggest that even without thermal effects (not included in our model), similar behaviour may emerge. The significance of figure 10(b) is discussed in § 4 later. More detailed comparison with experimental observations requires three-dimensional simulations that will be discussed elsewhere; see Lam, Cummings & Kondic (Reference Lam, Cummings and Kondic2018). For now, we note that the comparison with dewetting experiments by Vandenbrouck et al. (Reference Vandenbrouck, Valignat and Cazabat1999) is favourable: for a 42.8 nm thick NLC film considered in this work, (
 $H_{0}=0.428$
), our model predicts
 $\unicode[STIX]{x1D706}_{m}=39.2~\unicode[STIX]{x03BC}$
m, which is near the experimentally measured characteristic length scale of 30
 $\unicode[STIX]{x03BC}$
m. Furthermore, the time scale for dewetting to occur in experiments is approximately 6–7 min, which is close to simulations results,
 $15\unicode[STIX]{x1D714}_{m}^{-1}=5.6$
min with
 $\unicode[STIX]{x1D714}_{m}^{-1}=22.47$
at
 $H_{0}=0.428$
.
(a) Mean spacing between primary drop (
 $H_{l}>H_{0}$
) centres,
 $\bar{D}_{l}$
, normalised by
 $\unicode[STIX]{x1D706}_{m}$
, and (b)
 $(\text{variance in }D_{l})/\unicode[STIX]{x1D706}_{m}$
, for a randomly perturbed NLC film of thickness
 $H_{0}$
. The dotted magenta lines denote thickness threshold values extracted from simulations of a film exposed to localised perturbations. The derivation and meaning of these lines will be further discussed in § 4 and compared; for now, we note the increase in the variance in the region bounded by
 $H_{n_{1}}$
and
 $H_{n_{2}}$
, and the region bounded by
 $H_{n_{1}}$
and
 $H^{+}$
. (c) Distance between drop centres (no secondary drops) for a Newtonian film (
 ${\mathcal{N}}=0$
). Note that here there is no upper bound between linear instability and stability (i.e.
 $H^{+}$
is not defined) and all films thicker than
 $H_{-}$
(dashed red line) are unstable.

Regarding the formation of secondary drops, we note that previous works, such as Sharma & Verma (Reference Sharma and Verma2004) or Thiele et al. (Reference Thiele, Velarde, Neuffer and Pomeau2001), do not report their existence. A possible reason for this may be the difference in scales. To see this, consider the ratio
 $\unicode[STIX]{x1D70C}=H_{+}/H_{-}$
. For the problem considered here,
 $\unicode[STIX]{x1D70C}=O(10^{2})$
, while in Thiele et al. (Reference Thiele, Velarde, Neuffer and Pomeau2001) and Sharma & Verma (Reference Sharma and Verma2004),
 $\unicode[STIX]{x1D70C}=O(1)$
. Therefore, in the present problem it is possible to distinguish clearly features that may be invisible for smaller
 $\unicode[STIX]{x1D70C}$
. While we are unaware of experimental evidence of smaller secondary drops forming during the dewetting of thin films of NLC on a solid substrate, drops of different sizes have been observed on liquid substrates (see Cazabat et al.
Reference Cazabat, Delabre, Richard and Sang2011). Similar smaller drops are observed in experiments with metal films (see Ruffino et al.
Reference Ruffino, Pugliara, Carria, Romano, Bongiorno, Spinella and Grimaldi2012; Saritaş, Özen & Aydinli Reference Saritaş, Özen and Aydinli2013).
Next, we discuss the shape of the primary drops. Figure 7 shows that, for
 $H_{0}\rightarrow H_{+}$
, the base of these drops widens. Such behaviour is found consistently for simulations with initial film thickness in the linearly unstable regime. In the example shown in figure 7(d), the larger (primary) drops are approximately flat for ten or more length units, then transition in height to the equilibrium film; therefore, ignoring the secondary drops, figure 8(d) may be interpreted as showing coexistence of two flat films, resembling NLC films observed on silicon (or silicon oxide) substrates (see Cazabat et al.
Reference Cazabat, Delabre, Richard and Sang2011). Similarly to our results, as
 $H_{0}\rightarrow H^{+}$
, Sharma & Verma (Reference Sharma and Verma2004) observe the height profiles transitioning from ‘hills and valleys’ (see figure 7
c) to ‘pancakes’ (wide drops) (see figure 7
d).
Sharma & Verma (Reference Sharma and Verma2004) also show that an analytical result may be obtained for the minimum (equilibrium film thickness) and the maximum (height of drop centres) of steady-state solutions. We will discuss an extension of these results to our set-up later in § 4.2.1; for the present purposes it is sufficient to mention the prediction that, for sufficiently long times, the thickness value denoted by
 $H_{m_{3}}$
in figure 8 should be reached. We observe such behaviour only for
 $H_{0}\lessapprox H_{m_{3}}$
for the times considered. Once again, it is quite possible that the details of the influence of the film thickness could not be captured in Sharma & Verma (Reference Sharma and Verma2004) due to insufficient separation of scales.
4 Films exposed to a localised perturbation
In this section we focus on instabilities induced by a localised perturbation, with the main motivation of comparing and contrasting results with those of the preceding section where the film was perturbed globally. In physical experiments, localised perturbations (also referred to as nucleation centres) may be due to impurities, substrate defects, or some localised modification of the film structure. To facilitate the comparison between the influence of local and global perturbations on film stability, we still model such localised perturbations by perturbing the initial film thickness, anticipating that this is sufficient to gain basic insight into the influence of more complex perturbation types, listed above, that may occur in physical experiments.
We use the following initial condition
 $$\begin{eqnarray}\displaystyle h(x,t=0)=H_{0}\left[1-d\exp \left(-\left[\frac{x}{0.2W}\right]^{2}\right)\right], & & \displaystyle\end{eqnarray}$$
i.e. a film of thickness
 $H_{0}$
with a localised perturbation at the left boundary,
 $x=0$
, where a line of symmetry is assumed. The parameters
 $W$
and
 $d$
control the width and depth of the perturbation, respectively.
In § 4.1 below we consider the linearly unstable regime. Here, we describe first the computational results in § 4.1.1 and then consider an analytical approach, based on marginal stability analysis. This approach, discussed in §§ 4.1.3 and 4.1.4 allows us to gain better insight into instability development, in particular regarding emerging wavelengths. Finally, in § 4.2 we discuss the results relevant to linearly stable films.
4.1 Linearly unstable regime
Here we fix
 $d=0.1$
and
 $W=\unicode[STIX]{x1D706}_{m}$
in (4.1). The domain length is initially set to
 $5\unicode[STIX]{x1D706}_{m}$
, and the right boundary is dynamically expanded as a simulation progresses. Our simulations should therefore be representative of a localised perturbation imposed on a film of infinite extent.
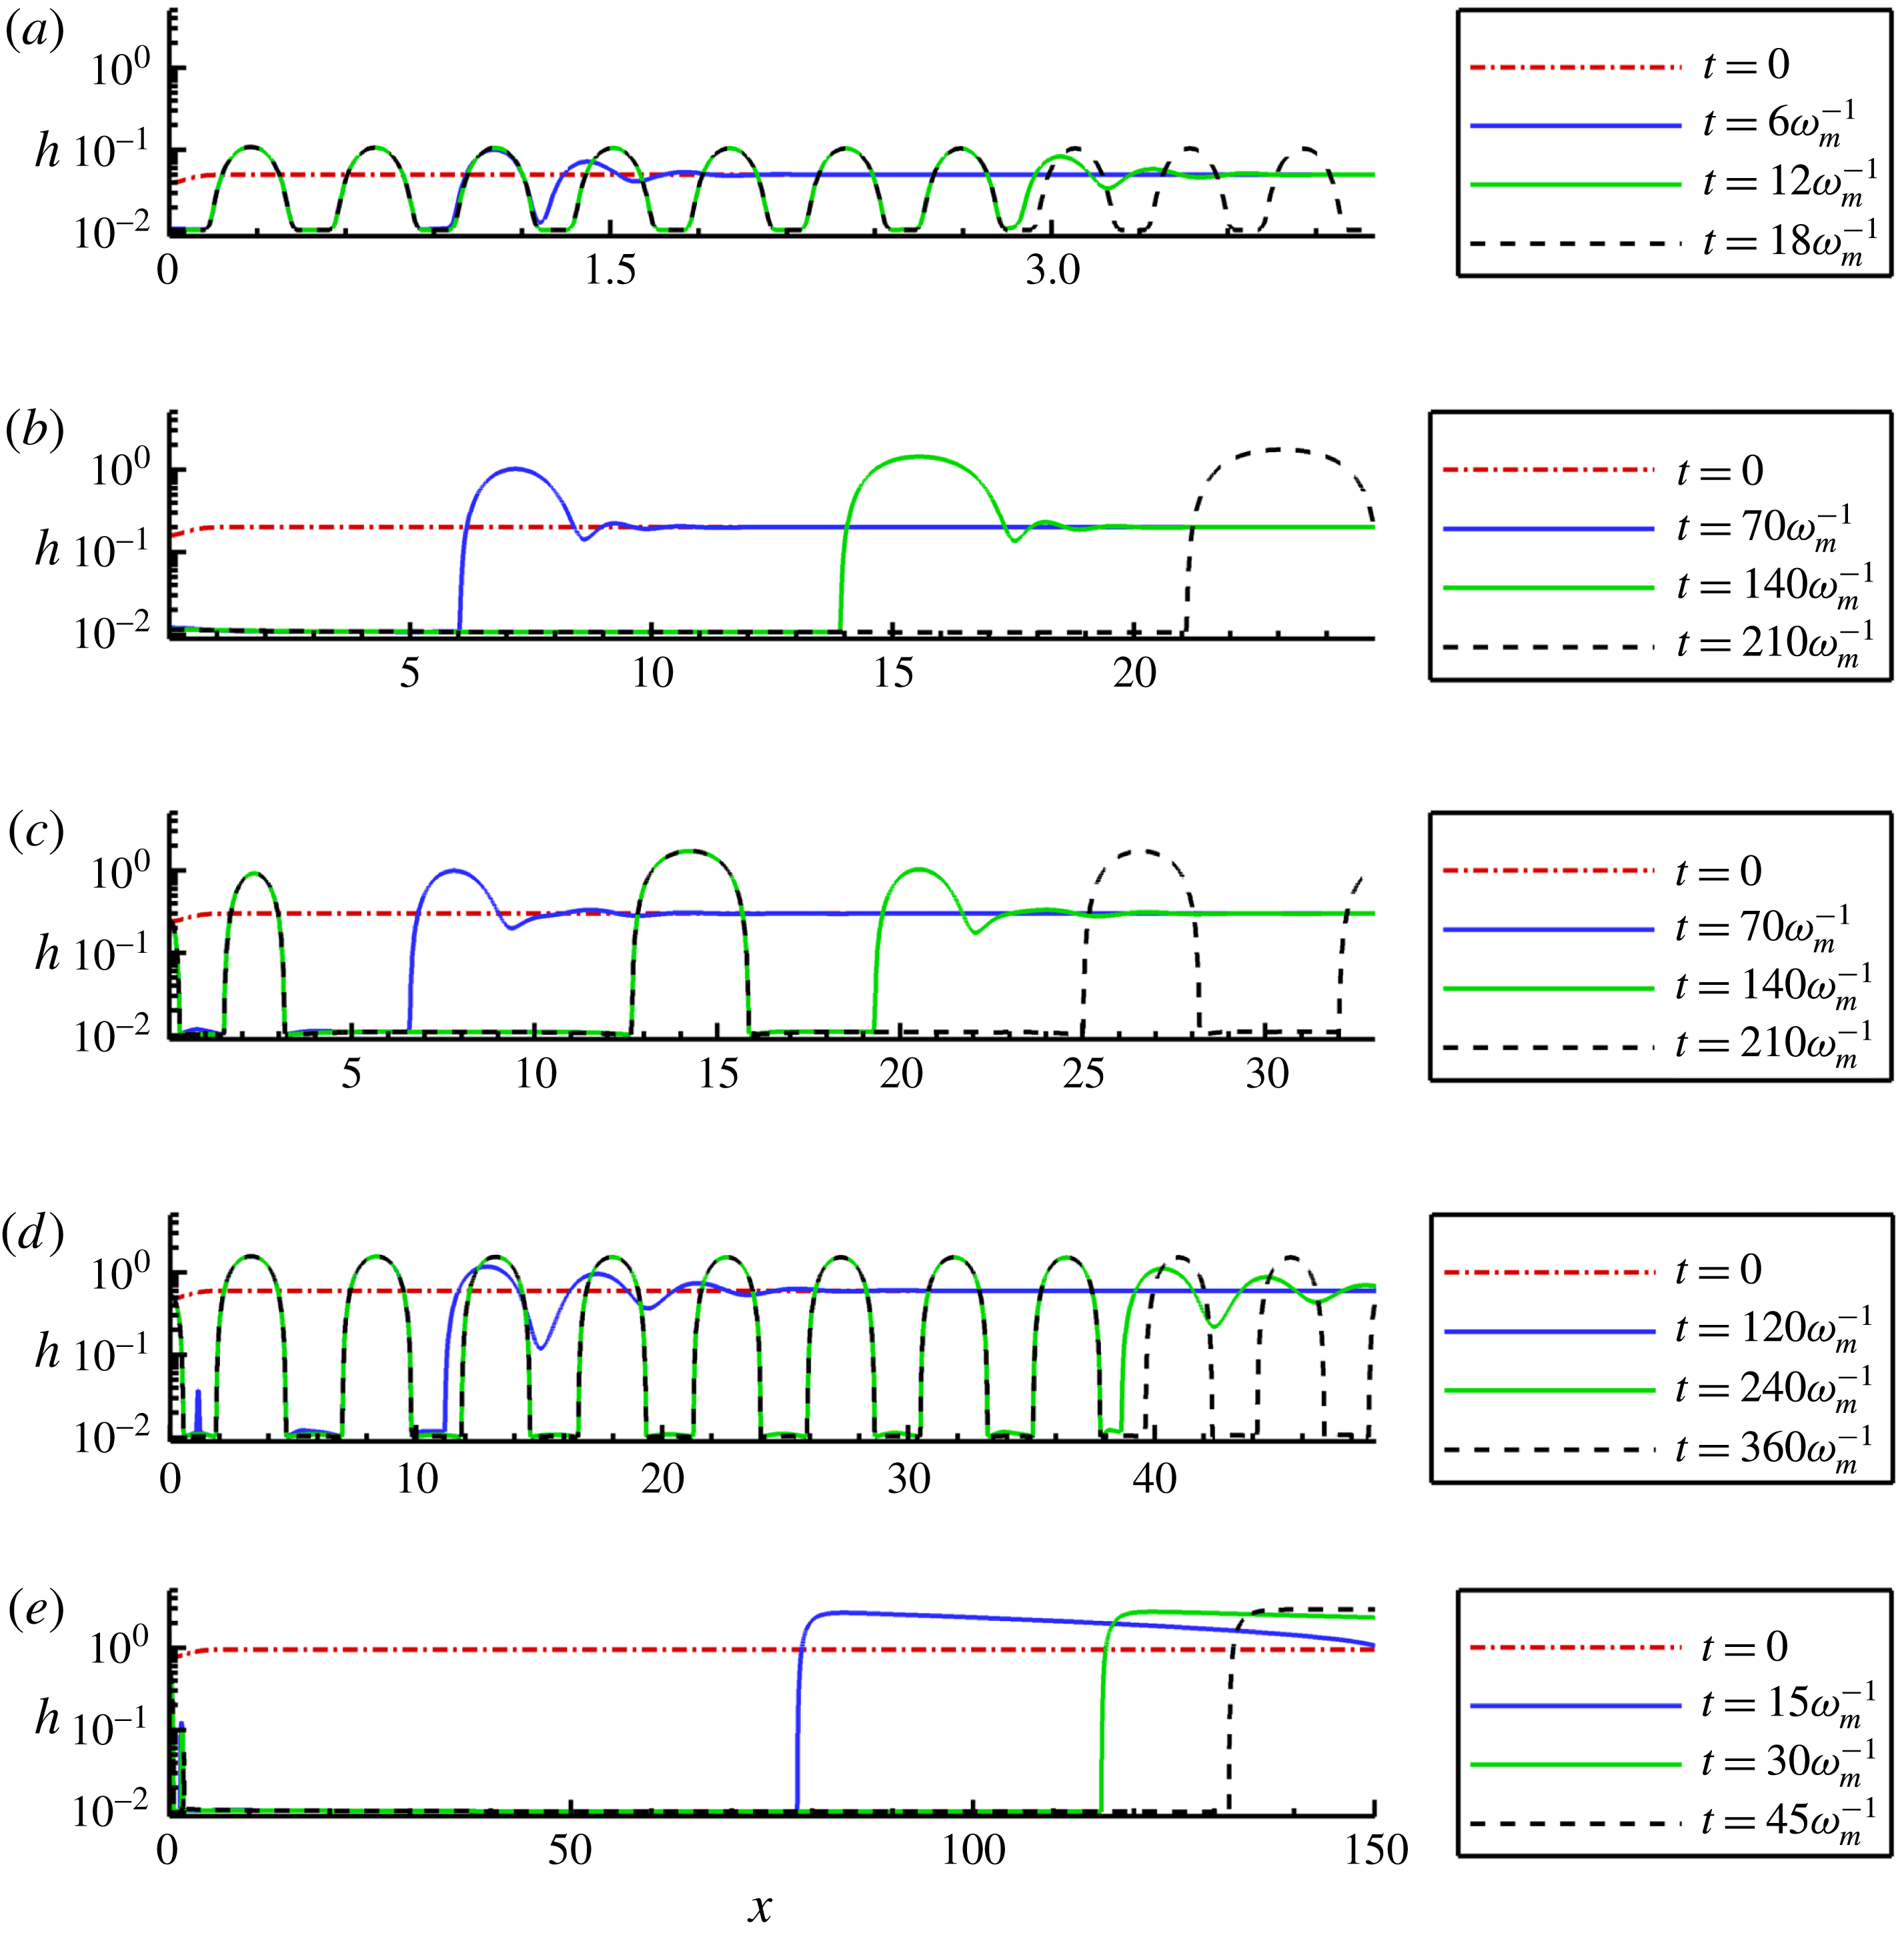
The free surface evolution for various initial average film thicknesses,
 $H_{0}$
. The initial condition is given by (4.1). Note that the film profiles shown in (b) and (e) form drops, but for times longer than shown here. The domain size shown in each panel is
 $10\unicode[STIX]{x1D706}_{m}$
; the simulation domains extend beyond the right boundary. The other parameters are given in § 2.3. (a)
 $H_{0}=0.05$
,
 $\unicode[STIX]{x1D714}_{m}^{-1}\approx 1.681$
, (b)
 $H_{0}=0.2$
,
 $\unicode[STIX]{x1D714}_{m}^{-1}\approx 34.22$
, (c)
 $H_{0}=0.3$
,
 $\unicode[STIX]{x1D714}_{m}^{-1}\approx 34.64$
, (d)
 $H_{0}=0.6$
,
 $\unicode[STIX]{x1D714}_{m}^{-1}\approx 19.21$
, (e)
 $H_{0}=0.95$
,
 $\unicode[STIX]{x1D714}_{m}^{-1}\approx 423.4$
.

4.1.1 Computational results
Figure 11 shows simulation results obtained with initial condition (4.1) and using the same parameter sets as in figures 5 and 7, as well as an additional thickness value,
 $H_{0}=0.05$
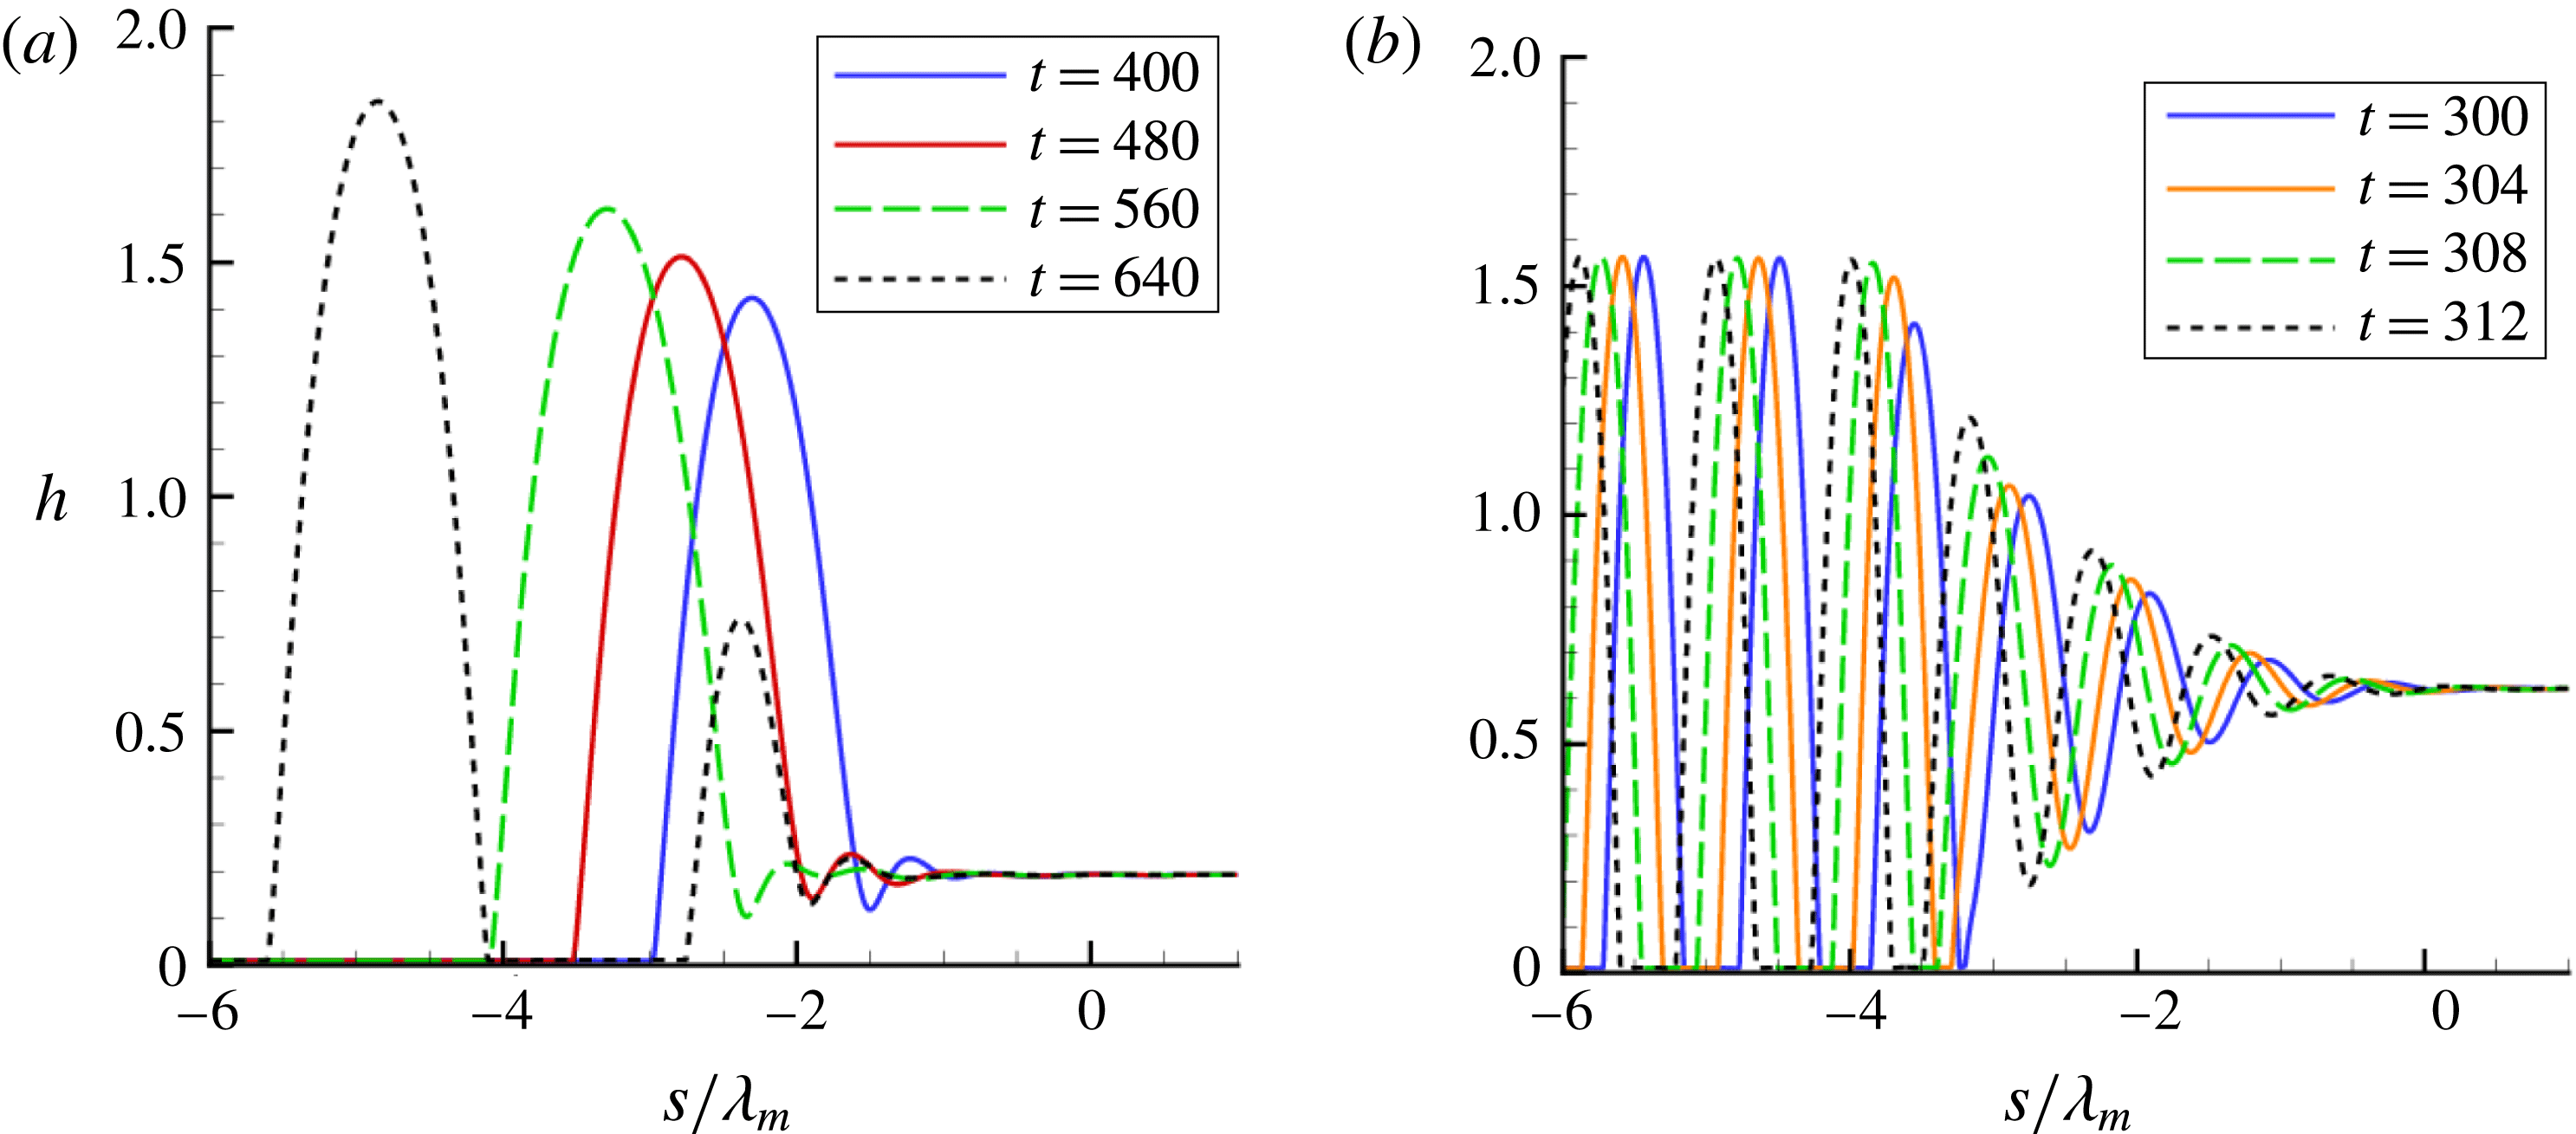
. The main observation is that the localised perturbation propagates to the right and successively touches down, forming drops; however, comparing these results to those obtained using random infinitesimal perturbations we note two main differences: first, no secondary drops are seen for localised perturbations; and second, the distance between drops is close to
 $\unicode[STIX]{x1D706}_{m}$
only for some values of
 $H_{0}$
; for example, in figure 11 the agreement with LSA is found only for
 $H_{0}=0.05$
and
 $H_{0}=0.6$
, panels (a) and (d), respectively. Note that while in panel (c) two different drop heights are observed (see
 $x\approx 2$
and
 $x\approx 14$
), the magnitude of the drop heights is similar; therefore, we do not classify the smaller drops as secondary drops as was done in the previous section. The emergence of different drop heights with similar magnitude was observed by others (see Thiele et al. (Reference Thiele, Neuffer, Pomeau and Velarde2002)) and will be further discussed in § 4.1.4.
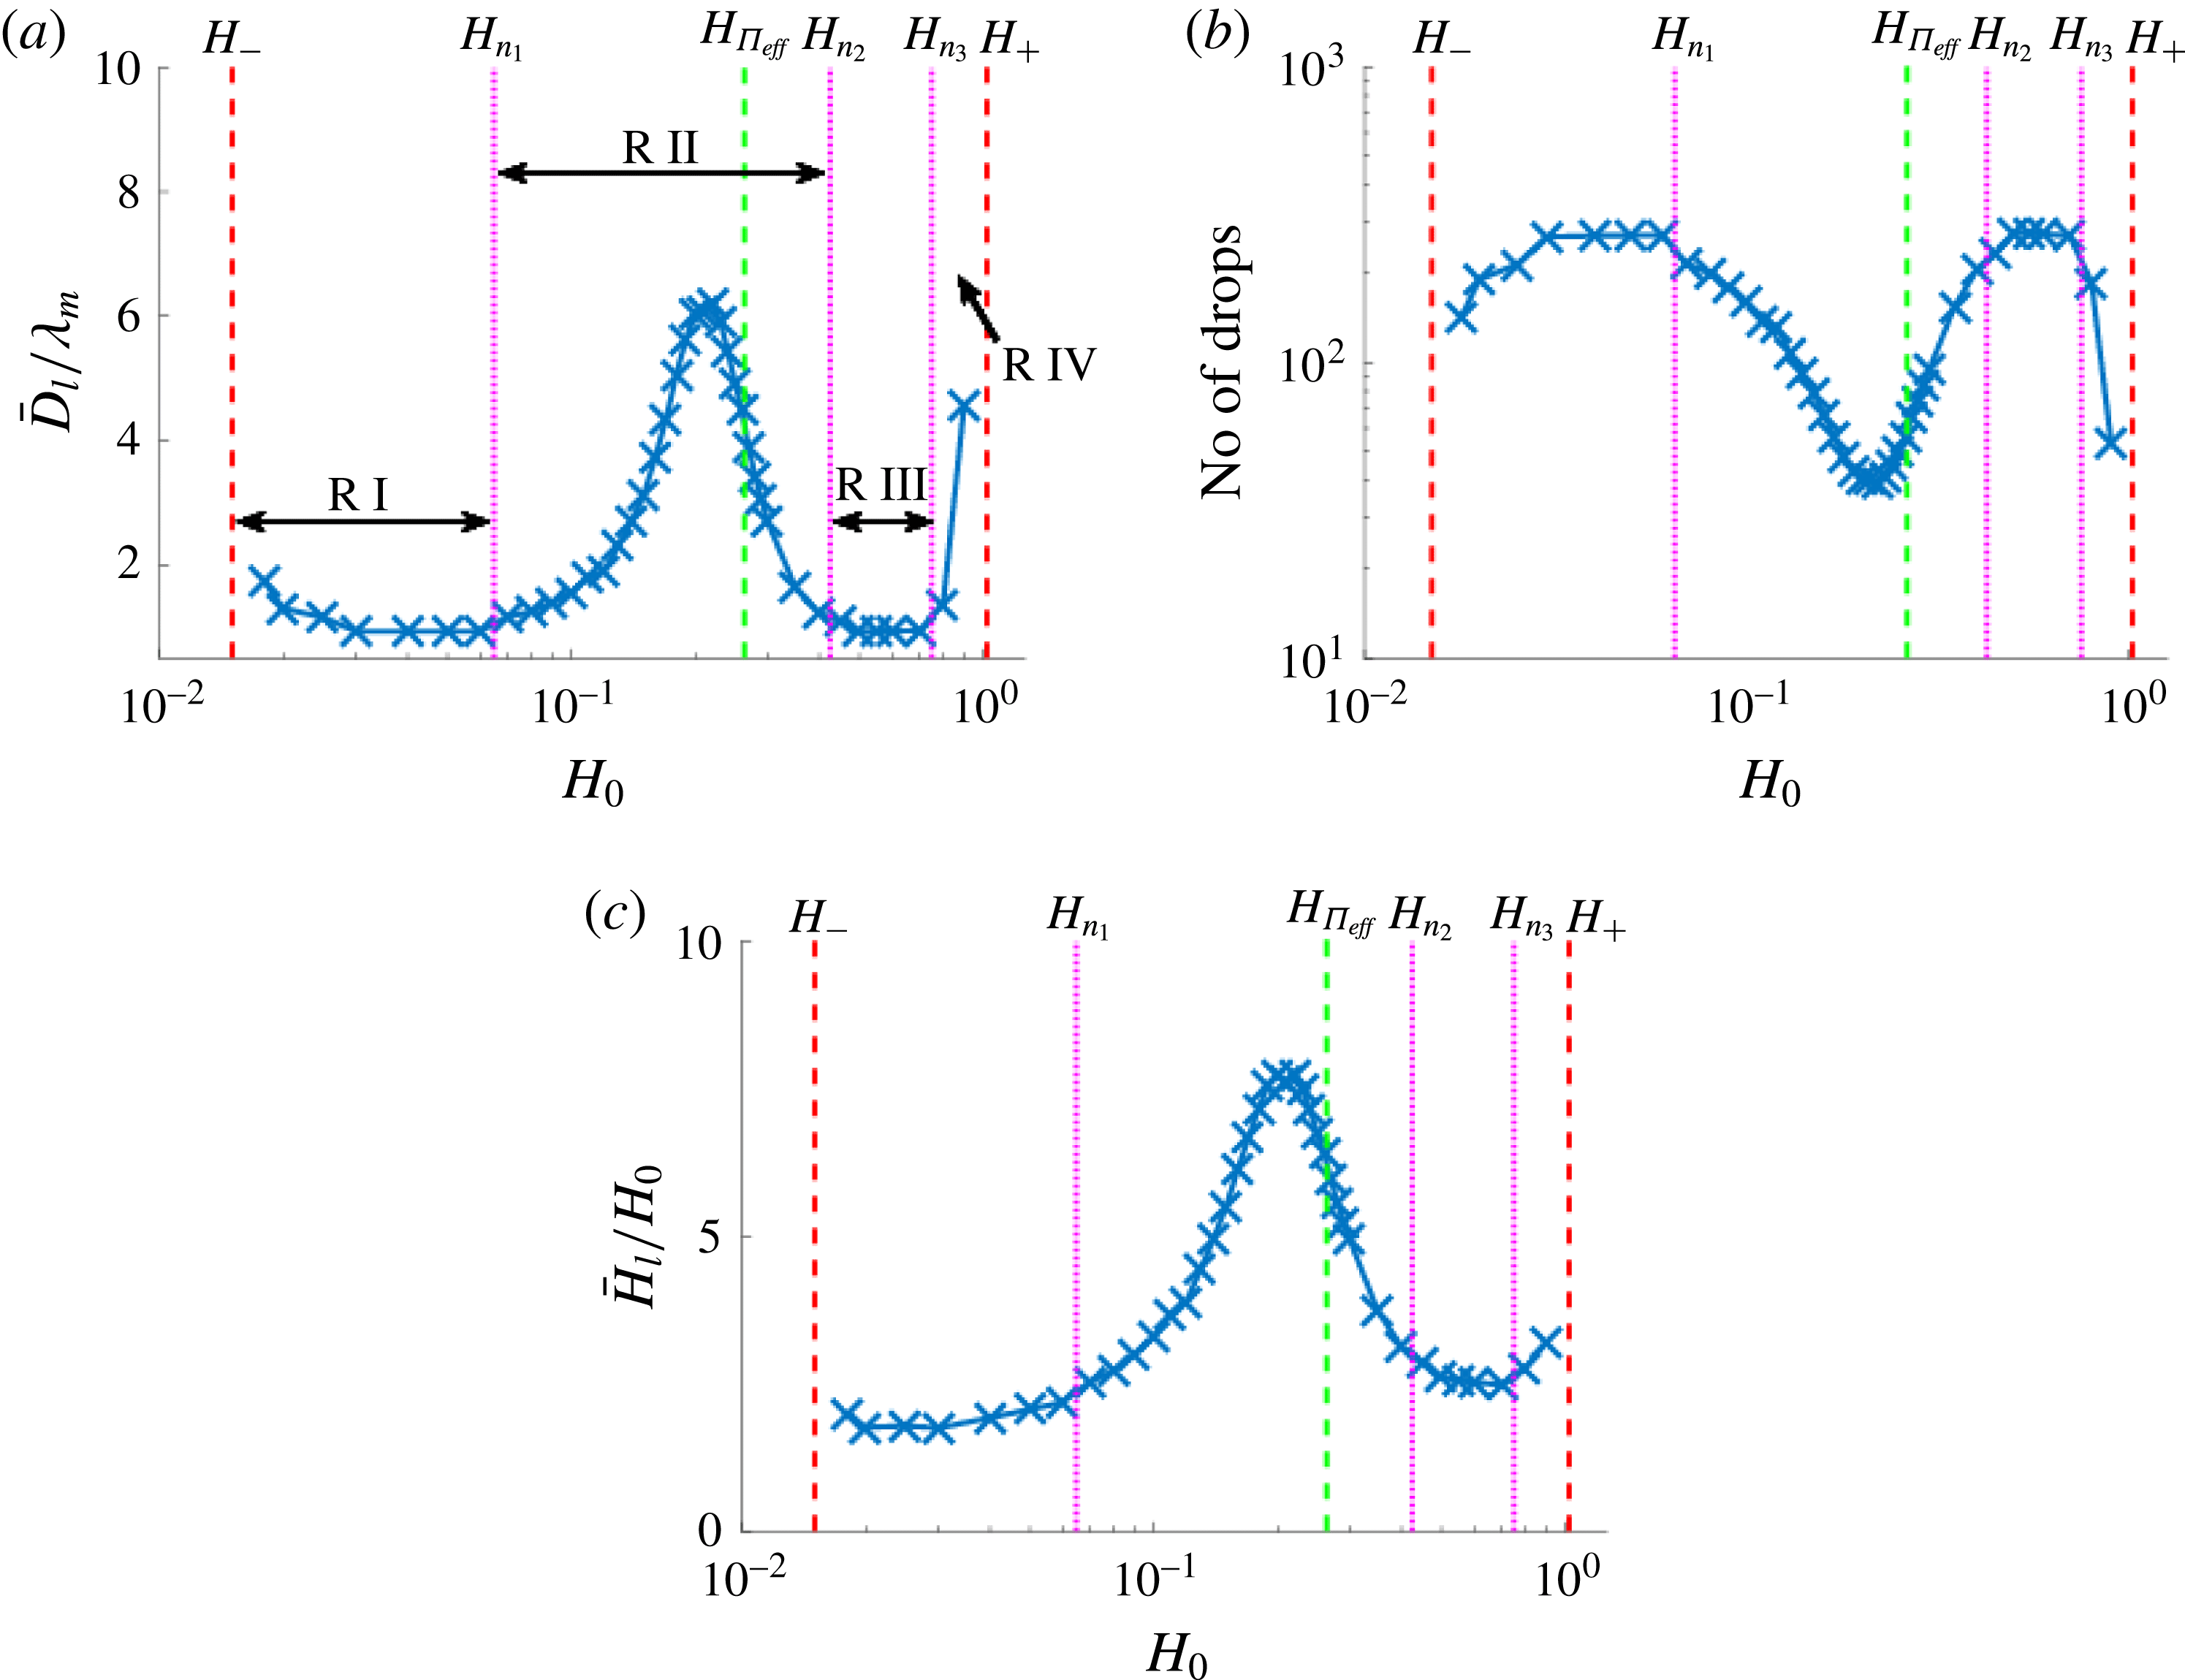
(a) The mean distance between drop centres,
 $\bar{D}_{l}$
, normalised by
 $\unicode[STIX]{x1D706}_{m}$
, at
 $t=350\unicode[STIX]{x1D714}_{m}^{-1}$
; (b) the corresponding number of drops; and (c) the mean height of drop centres,
 $\bar{H}_{l}$
, normalised by
 $H_{0}$
. The magenta dotted lines correspond to the values of
 $H_{0}$
for which
 $\bar{D}_{l}/\unicode[STIX]{x1D706}_{m}$
crosses the value 1.1. The other parameters are given in § 2.3.

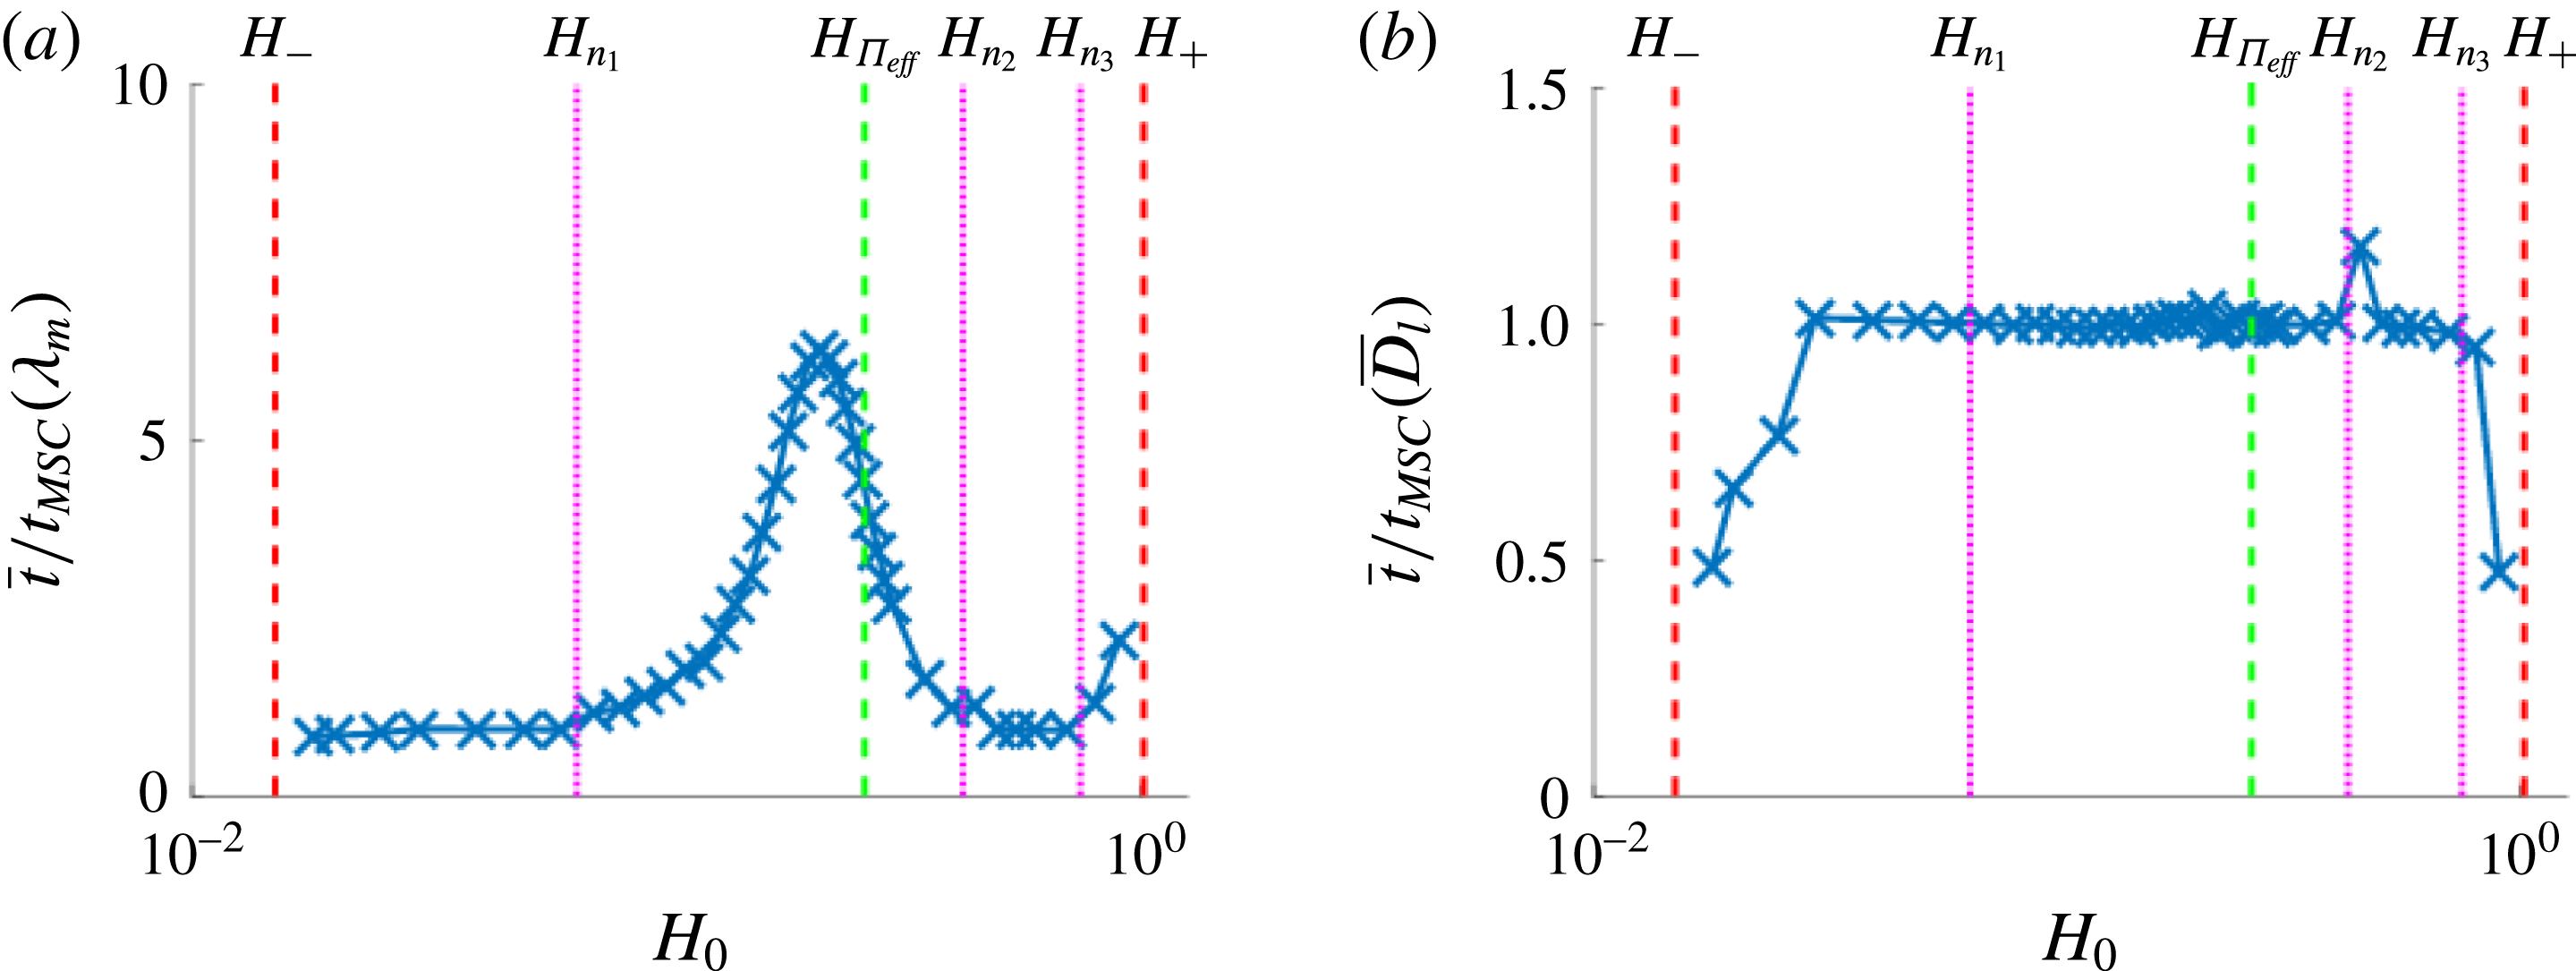
To investigate further the dewetting process we calculate the mean distance between drop centres,
 $\bar{D}_{l}$
. Figure 12(a) shows the results; to improve statistics, the simulations are carried out in large domains expanded in time to
 $320\unicode[STIX]{x1D706}_{m}$
. We observe the existence of four different regimes characterised by the magnitude of
 $\bar{D}_{l}/\unicode[STIX]{x1D706}_{m}$
, separated by three distinct film heights (marked by the dotted magenta lines showing where
 $\bar{D}_{l}/\unicode[STIX]{x1D706}_{m}\approx 1.1$
, to characterise departure from LSA predictions) and denoted
 $H_{n_{1}}$
,
 $H_{n_{2}}$
and
 $H_{n_{3}}$
. We see that in the regions marked R I and R III, the distance between drop centres is well approximated by
 $\unicode[STIX]{x1D706}_{m}$
; however, there exist regions R II and R IV, where there is no correlation between
 $\bar{D}_{l}$
and
 $\unicode[STIX]{x1D706}_{m}$
.
Regimes for which
 $\bar{D}_{l}\not \approx \unicode[STIX]{x1D706}_{m}$
have been reported before (Thiele et al.
Reference Thiele, Velarde, Neuffer and Pomeau2001; Diez & Kondic Reference Diez and Kondic2007) for different thin film models; however, the main findings differ from those presented here. Thiele et al. (Reference Thiele, Velarde, Neuffer and Pomeau2001) and Diez & Kondic (Reference Diez and Kondic2007) both identify a
 $\bar{D}_{l}\not \approx \unicode[STIX]{x1D706}_{m}$
regime near the upper threshold
 $H_{+}$
between linear instability and stability (see the R IV regime in figure 12
a). The work by Thiele et al. (Reference Thiele, Velarde, Neuffer and Pomeau2001) furthermore discusses a corresponding regime close to
 $H_{-}$
; in the present formulation, this is a subset of the R I region very close to
 $H_{-}$
where, similarly to the results for a film exposed to random perturbations (see figure 10
a) the difference between
 $\bar{D}_{l}$
and
 $\unicode[STIX]{x1D706}_{m}$
is due to coarsening occurring on the considered time scale. Thiele et al. (Reference Thiele, Velarde, Neuffer and Pomeau2001) describe this transition to the
 $\bar{D}_{l}\not \approx \unicode[STIX]{x1D706}_{m}$
regime as a super/subcritical transition (spinodal to nucleation-dominated regime). A new finding in the present work is the existence of multiple super/subcritical transitions (our R II and R IV regimes).
Before exploring the instability development due to a local perturbation more rigorously, we first note a connection to our previous results for randomly perturbed films. Recalling the results for the mean distance between drop centres,
 $\bar{D}_{l}$
, for films exposed to random perturbations (see figure 10
a), while
 $\bar{D}_{l}/\unicode[STIX]{x1D706}_{m}\approx 1.15$
mostly everywhere, there appears to be small peak in
 $\bar{D}_{l}/\unicode[STIX]{x1D706}_{m}$
in the thickness range corresponding to the R II regime. To highlight this connection further, in figure 10(b) the variance in
 $D_{l}/\unicode[STIX]{x1D706}_{m}$
is plotted as a function of the initial film thickness
 $H_{0}$
. We see that the variance increases in the R II and R IV regime, suggesting that there is a connection between the results for randomly and locally perturbed films. A possible explanation of this connection is that, on large domains, the film does not dewet everywhere at the same time even if exposed to random perturbations; therefore, at the locations where the film dewets initially, the solution may appear as due to a localised perturbation, with retracting fronts modifying the distance between the drops that form eventually. The influence of these fronts may result in a large variance, explaining the results captured by figures 10(a,b).
We also note a possible connection to the theoretical and experimental results presented by Seemann et al. (Reference Seemann, Herminghaus and Jacobs2001b
), Thiele et al. (Reference Thiele, Velarde, Neuffer and Pomeau2001) and Diez & Kondic (Reference Diez and Kondic2007). Seemann et al. (Reference Seemann, Herminghaus and Jacobs2001b
) suggest that as
 $H\rightarrow H_{+}$
(or
 $H_{-}$
), where by definition
 ${\unicode[STIX]{x1D6F1}_{eff}}^{\prime }(H_{+})=0$
(
 ${\unicode[STIX]{x1D6F1}_{eff}}^{\prime }(H)$
corresponds to
 $\unicode[STIX]{x1D719}^{\prime \prime }(h)$
in the referenced work), the barrier to nucleation vanishes, thus nucleation by thermal activation is possible. While our model does not include thermal effects, our results are similar to those observed by Seemann et al. (Reference Seemann, Herminghaus and Jacobs2001b
). Therefore, the R IV regime in our results, and the nucleation reported by Thiele et al. (Reference Thiele, Velarde, Neuffer and Pomeau2001) and Diez & Kondic (Reference Diez and Kondic2007) (again no thermal effects considered), may be analogous to the thermal nucleation regime.
4.1.2 Rescaling the governing equation
We note that under appropriate scaling, solutions of the form
 $h(x,t)=H_{0}[1+\unicode[STIX]{x1D716}h_{1}(x,t)+\unicode[STIX]{x1D716}^{2}h_{2}(x,t)+O(\unicode[STIX]{x1D716}^{3})]$
, where
 $0<\unicode[STIX]{x1D716}\ll 1$
, are to leading order independent of the model parameters. The scalings are as follows:
 $$\begin{eqnarray}\displaystyle h=H_{0}\unicode[STIX]{x1D6F9},\quad x=\sqrt{\frac{{\mathcal{C}}}{{\unicode[STIX]{x1D6F1}_{eff}}^{\prime }(H_{0})}}\unicode[STIX]{x1D701},\quad \text{and}\quad t=\frac{{\mathcal{C}}}{Q(H_{0})[{\unicode[STIX]{x1D6F1}_{eff}}^{\prime }(H_{0})]^{2}}\unicode[STIX]{x1D70F}, & & \displaystyle\end{eqnarray}$$
where for generality we keep the general mobility function,
 $Q(h)$
. The rescaled leading-order equation is
 $$\begin{eqnarray}\displaystyle h_{1,\unicode[STIX]{x1D70F}}+h_{1,\unicode[STIX]{x1D701}\unicode[STIX]{x1D701}\unicode[STIX]{x1D701}\unicode[STIX]{x1D701}}+h_{1,\unicode[STIX]{x1D701}\unicode[STIX]{x1D701}}=0, & & \displaystyle\end{eqnarray}$$
and the mode of maximum growth and its corresponding growth rate are
 $\check{q}_{m}=1/\sqrt{2},\check{\unicode[STIX]{x1D714}}_{m}=1/4$
, respectively (here the check notation denotes the values obtained from the rescaled model). We see that as long as
 $h_{1}(x,t)=O(1)$
(i.e., as long as linear theory is applicable), the evolution for different choices of
 $H_{0}$
differs only by spatial and temporal scales. Recall that the initial conditions (3.1), (3.2) and (4.1) were chosen to scale with
 $\unicode[STIX]{x1D706}_{m}$
and
 $H_{0}$
, so the corresponding initial conditions in the rescaled variables are identical. The governing equation for
 $h_{2}(x,t)$
is
 $$\begin{eqnarray}\displaystyle h_{2,\unicode[STIX]{x1D70F}}+h_{2,\unicode[STIX]{x1D701}\unicode[STIX]{x1D701}\unicode[STIX]{x1D701}\unicode[STIX]{x1D701}}+h_{2,\unicode[STIX]{x1D701}\unicode[STIX]{x1D701}}=-\left[h_{1}\frac{Q^{\prime }(H_{0})}{Q(H_{0})}\left(h_{1,\unicode[STIX]{x1D701}\unicode[STIX]{x1D701}\unicode[STIX]{x1D701}}+\left[1+\frac{Q(H_{0}){\unicode[STIX]{x1D6F1}_{eff}}^{\prime \prime }(H_{0})}{Q^{\prime }(H_{0}){\unicode[STIX]{x1D6F1}_{eff}}^{\prime }(H_{0})}\right]h_{1,\unicode[STIX]{x1D701}}\right)\right]_{\unicode[STIX]{x1D701}}, & & \displaystyle\end{eqnarray}$$
for general
 $Q(h)$
, and for
 $Q(h)=h^{n}$
,
 $$\begin{eqnarray}\displaystyle h_{2,\unicode[STIX]{x1D70F}}+h_{2,\unicode[STIX]{x1D701}\unicode[STIX]{x1D701}\unicode[STIX]{x1D701}\unicode[STIX]{x1D701}}+h_{2,\unicode[STIX]{x1D701}\unicode[STIX]{x1D701}}=-\left[\frac{h_{1}}{H_{0}}\left(nh_{1,\unicode[STIX]{x1D701}\unicode[STIX]{x1D701}\unicode[STIX]{x1D701}}+\left[n+\frac{H_{0}{\unicode[STIX]{x1D6F1}_{eff}}^{\prime \prime }(H_{0})}{{\unicode[STIX]{x1D6F1}_{eff}}^{\prime }(H_{0})}\right]h_{1,\unicode[STIX]{x1D701}}\right)\right]_{\unicode[STIX]{x1D701}}. & & \displaystyle\end{eqnarray}$$
For any unstable film thickness
 $H_{0}$
, the second-order equations only differ by the forcing term on the right-hand side, which is independent of the inverse capillary number,
 ${\mathcal{C}}$
, suggesting that the effective disjoining pressure determines the transition between different dewetting morphologies. Figure 13 plots the term enclosed by inner square brackets in (4.5) for
 $n=3$
and other parameters as given in § 2.3. Note that this term is an increasing function of
 $H_{0}$
in most of the R II regime (between
 $H_{n_{1}}$
and
 $H_{n_{2}}$
), in contrast to its behaviour elsewhere. While we do not yet have a clear explanation of how this observation is related to the film breakup properties seen in the R II regime, we expect that it may be useful in future analysis of different stability regimes.
The inner square bracketed term in (4.4).

4.1.3 Marginal stability criterion: outline
Marginal stability criterion (MSC) theory analyses front propagation into an unstable state using Fourier transforms and asymptotic theory. The analysis in some cases allows one to rationalise the manner in which an unstable front (resulting from the presence of a localised perturbation) propagates into an unstable flat film. In particular, the outcome of this approach is the front speed, which can then be correlated with the time of breakup at which consecutive drops form, and their distance. To begin, we give a brief overview of MSC theory and its main results in the present context; the reader is referred to the comprehensive review by van Saarloos (Reference van Saarloos2003) for further details. Then in the following section we discuss the correlation of MSC predictions with our computational results.
We assume that the solution of the rescaled leading-order governing equation (4.3) has a spatial Fourier series representation, i.e.
 $$\begin{eqnarray}\displaystyle h_{1}(\unicode[STIX]{x1D701},\unicode[STIX]{x1D70F})=\int _{-\infty }^{\infty }\breve{h}_{1}(\check{q},\unicode[STIX]{x1D70F})\text{e}^{\check{q}\unicode[STIX]{x1D701}\text{i}}\,\text{d}\check{q}. & & \displaystyle\end{eqnarray}$$
Furthermore, with the ansatz
 $$\begin{eqnarray}\displaystyle \breve{h}_{1}(\check{q},\unicode[STIX]{x1D70F})=\tilde{h}_{1}(\check{q})\text{e}^{-\check{\unicode[STIX]{x1D714}}(\check{q})\unicode[STIX]{x1D70F}\text{i}}, & & \displaystyle\end{eqnarray}$$
substituting (4.6) into (4.3) yields
 $$\begin{eqnarray}\displaystyle \int _{-\infty }^{\infty }[-\text{i}\check{\unicode[STIX]{x1D714}}(\check{q})+\check{q}^{4}-\check{q}^{2}]\tilde{h}_{1}(\check{q})\text{e}^{\check{q}\unicode[STIX]{x1D701}\text{i}-\check{\unicode[STIX]{x1D714}}(\check{q})\unicode[STIX]{x1D70F}\text{i}}\,\text{d}\check{q}=0, & & \displaystyle\end{eqnarray}$$
where
 $\tilde{h}_{1}(\check{q})$
is the Fourier transform of the initial condition (assumed analytic). Satisfying (4.3) for arbitrary
 $\tilde{h}_{1}(\check{q})$
gives the dispersion relation,
 $$\begin{eqnarray}\displaystyle \check{\unicode[STIX]{x1D714}}(\check{q})=-\text{i}(\check{q}^{4}-\check{q}^{2}). & & \displaystyle\end{eqnarray}$$
In the reference frame travelling with velocity
 $\check{V}=(\sqrt{{\mathcal{C}}}/Q(H_{0})[{\unicode[STIX]{x1D6F1}_{eff}}^{\prime }(H_{0})]^{3/2})V$
, the solution can be expressed as
 $$\begin{eqnarray}\displaystyle h_{1}(s,\unicode[STIX]{x1D70F})=\int _{-\infty }^{\infty }\tilde{h}_{1}(\check{q})\text{e}^{\text{i}\check{q}s}\text{e}^{-\text{i}[\check{\unicode[STIX]{x1D714}}(\check{q})-\check{V}\check{q}]\unicode[STIX]{x1D70F}}\,\text{d}\check{q}, & & \displaystyle\end{eqnarray}$$
where
 $s=\unicode[STIX]{x1D701}-\check{V}\unicode[STIX]{x1D70F}$
. If the above integral converges,
 $h_{1}(s,\unicode[STIX]{x1D70F})$
satisfies the rescaled governing equation (4.3), and
 $\check{V}$
is defined as the ‘linear spreading speed’ by van Saarloos (Reference van Saarloos2003).
Following van Saarloos (Reference van Saarloos2003), we now consider the limit
 $\unicode[STIX]{x1D70F}\rightarrow \infty$
and use a saddle-point approximation (steepest descent method) to approximate the integral in (4.10). The saddle point
 $\check{q}^{\ast }$
satisfies
 $$\begin{eqnarray}\displaystyle \check{V}=\left.\frac{\text{d}\check{\unicode[STIX]{x1D714}}(\check{q})}{\text{d}\check{q}}\right|_{\check{q}^{\ast }}. & & \displaystyle\end{eqnarray}$$
To eliminate exponent terms of the integrand in (4.10) that lead to decay or growth in
 $\unicode[STIX]{x1D70F}$
, we set
 $$\begin{eqnarray}\displaystyle \check{V}=\frac{\check{\unicode[STIX]{x1D714}}_{i}(\check{q})}{\check{q}_{i}}, & & \displaystyle\end{eqnarray}$$
where
 $\check{V}\in \mathbb{R}$
(by definition), the
 $i$
subscript denotes the imaginary part of variables, and an
 $r$
subscript will be used to denote the real part. Recall
 $\check{\unicode[STIX]{x1D714}}(\check{q})$
is a polynomial in
 $\check{q}$
and thus differentiable, so that (4.11) may be expressed as
 $$\begin{eqnarray}\displaystyle \check{V}=\text{Re}\left[\left.\frac{\text{d}\check{\unicode[STIX]{x1D714}}}{\text{d}\check{q}}\right|_{\check{q}^{\ast }}\right]=\left.\frac{1}{2}\left[\frac{\unicode[STIX]{x2202}\check{\unicode[STIX]{x1D714}}_{r}}{\unicode[STIX]{x2202}\check{q}_{r}}+\frac{\unicode[STIX]{x2202}\check{\unicode[STIX]{x1D714}}_{i}}{\unicode[STIX]{x2202}\check{q}_{i}}\right]\right|_{\check{q}^{\ast }}, & & \displaystyle\end{eqnarray}$$
and
 $$\begin{eqnarray}\displaystyle \text{Im}\left[\left.\frac{\text{d}\check{\unicode[STIX]{x1D714}}}{\text{d}\check{q}}\right|_{\check{q}^{\ast }}\right]=\left.\frac{1}{2}\left[\frac{\unicode[STIX]{x2202}\check{\unicode[STIX]{x1D714}}_{i}}{\unicode[STIX]{x2202}\check{q}_{r}}-\frac{\unicode[STIX]{x2202}\check{\unicode[STIX]{x1D714}}_{r}}{\unicode[STIX]{x2202}\check{q}_{i}}\right]\right|_{\check{q}^{\ast }}=0. & & \displaystyle\end{eqnarray}$$
Furthermore, by definition,
 $\check{\unicode[STIX]{x1D714}}_{r}$
and
 $\check{\unicode[STIX]{x1D714}}_{i}$
satisfy the Cauchy–Riemann equations, simplifying (4.13) and (4.14) to
 $$\begin{eqnarray}\displaystyle \check{V}(\check{q}^{\ast })=\left.\frac{\unicode[STIX]{x2202}\check{\unicode[STIX]{x1D714}}_{r}}{\unicode[STIX]{x2202}\check{q}_{r}}\right|_{\check{q}^{\ast }}\quad \text{and}\quad \text{Im}\left[\left.\frac{\text{d}\check{\unicode[STIX]{x1D714}}}{\text{d}\check{q}}\right|_{\check{q}^{\ast }}\right]=\left.\frac{\unicode[STIX]{x2202}\check{\unicode[STIX]{x1D714}}_{i}}{\unicode[STIX]{x2202}\check{q}_{r}}\right|_{\check{q}^{\ast }}=0, & & \displaystyle\end{eqnarray}$$
respectively. Satisfying the second condition in (4.15) gives an expression for
 $\check{q}_{r}$
as a function of
 $\check{q}_{i}$
and taking the derivative of (4.12) with respect to
 $\check{q}_{i}$
yields
 $$\begin{eqnarray}\displaystyle \frac{\text{d}\check{V}}{\text{d}\check{q}_{i}}=\frac{1}{\check{q}_{i}}\left[\frac{\unicode[STIX]{x2202}\check{\unicode[STIX]{x1D714}}_{r}}{\unicode[STIX]{x2202}\check{q}_{r}}+\frac{\text{d}\check{q}_{i}}{\text{d}\check{q}_{r}}\frac{\unicode[STIX]{x2202}\check{\unicode[STIX]{x1D714}}_{r}}{\unicode[STIX]{x2202}\check{q}_{i}}-\frac{\check{\unicode[STIX]{x1D714}}_{i}(\check{q})}{\check{q}_{i}}\right]. & & \displaystyle\end{eqnarray}$$
Evaluating the above equation at the saddle point, and substituting (4.12) and (4.15), we find
 $$\begin{eqnarray}\displaystyle \left.\frac{\text{d}\check{V}}{\text{d}\check{q}_{i}}\right|_{\check{q}^{\ast }}=0, & & \displaystyle\end{eqnarray}$$
and thus
 $\check{q}_{i}^{\ast }$
is a critical point of
 $\check{V}$
. We note that this critical point is a minimum of
 $\check{V}$
; however, this information is not required to determine
 $\check{V}$
itself (see van Saarloos (Reference van Saarloos2003) for further details). Equations (4.11), (4.15) and (4.17) provide the necessary conditions to determine
 $\check{q}_{r}^{\ast }$
,
 $\check{q}_{i}^{\ast }$
and
 $\check{V}$
. Therefore, with the rescaled dispersion relationship defined by (4.9),
 $$\begin{eqnarray}\displaystyle \check{q}^{\ast }=\sqrt{\frac{3+\sqrt{7}}{4}}+\sqrt{\frac{1}{6}[\sqrt{7}-1]}\text{i}\approx 0.791+0.262i, & & \displaystyle\end{eqnarray}$$
and
 $$\begin{eqnarray}\displaystyle \check{V}=\frac{1}{9}\sqrt{1+\sqrt{7}}(5+\sqrt{7})\approx 1.622\quad \Rightarrow \quad V\approx 1.622\frac{Q(H_{0})[{\unicode[STIX]{x1D6F1}_{eff}}^{\prime }(H_{0})]^{3/2}}{\sqrt{{\mathcal{C}}}}, & & \displaystyle\end{eqnarray}$$
where the second equation in (4.19) is given in the unscaled variables. We note in passing that the MSC also provides the condition for when a front propagating to the right will spread with the linear spreading speed asymptotically. If the initial condition decays faster than
 $\text{e}^{-\check{q}^{\ast }\unicode[STIX]{x1D701}}$
as
 $\unicode[STIX]{x1D701}\rightarrow \infty$
, then the instability will spread with velocity
 $V$
given by (4.19), and the solution is referred to as a pulled front. For an initial condition that does not decay fast enough, the instability will propagate into the unstable state with a speed greater than
 $V$
. The solution is then referred to as a pushed front and deriving an expression for the speed at which it spreads is non-trivial. For the present problem, the initial condition (4.1) is a Gaussian perturbation, thus decays sufficiently fast, and a pulled front is expected.
Regarding the time scale for successive drop formation, we note that if a localised perturbation leads to a coherent pattern behind the front, it is periodic in time, i.e.,
 $H(s)=H(\unicode[STIX]{x1D701}-\check{V}\unicode[STIX]{x1D70F})=H(\unicode[STIX]{x1D701}+\check{\unicode[STIX]{x1D706}}-\check{V}\unicode[STIX]{x1D70F})=H(\unicode[STIX]{x1D701}-\check{V}(\unicode[STIX]{x1D70F}+{\check{t}}_{MSC}))$
, where
 ${\check{t}}_{MSC}$
is the time between successive drops detaching from behind the front at distances
 $\check{\unicode[STIX]{x1D706}}$
apart. Satisfying
 $H(\unicode[STIX]{x1D701}+\check{\unicode[STIX]{x1D706}}-\check{V}\unicode[STIX]{x1D70F})=H(\unicode[STIX]{x1D701}-\check{V}(\unicode[STIX]{x1D70F}+{\check{t}}_{MSC}))$
yields
 $$\begin{eqnarray}\displaystyle {\check{t}}_{MSC}=\frac{\check{\unicode[STIX]{x1D706}}}{\check{V}}=\frac{2\unicode[STIX]{x03C0}}{\check{q}\check{V}}\approx 5.478\quad \text{or}\quad t_{MSC}=5.478\frac{{\mathcal{C}}}{Q(H_{0})[{\unicode[STIX]{x1D6F1}_{eff}}^{\prime }(H_{0})]^{2}}, & & \displaystyle\end{eqnarray}$$
where, for future reference,
 $\check{q}=\check{q}_{m}$
was used in the first expression to obtain the second one. In the next section we proceed with correlating the presented MSC results with the computational ones.
The speed of the propagating front, (4.19), may alternatively be obtained by using pinch point analysis, with a key difference of how the complex integral path is chosen in the Fourier representation (4.10) (see Huerre (Reference Huerre, Wesfreid, Brand, Manneville, Albinet and Boccara1988) and Huerre & Rossi (Reference Huerre, Rossi, Godréche and Manneville1998) for further details on pinch point analysis). Our previous results (see Lin & Kondic (Reference Lin and Kondic2010) and Lam et al. (Reference Lam, Cummings, Lin and Kondic2014)) for flow of a thin film down an inclined plane relied on the results of such analysis to derive the velocity of wave packet boundaries (
 $V$
in the MSC analysis). In that work, analytical and numerical simulations confirmed the existence of three stability regimes behind the front travelling down the inclined plane: stable, convectively unstable, and absolutely unstable. These same instabilities were discussed by van Saarloos (Reference van Saarloos2003) within a different physical context. The two unstable regimes were further subdivided into two cases: coherent pattern formation (periodic array of drops) and incoherent pattern formation; however, a general analytical theory for predicting these cases is not yet available. We will discuss our computational results within this context briefly in the next section.
Typical evolution of the film thickness in the reference frame travelling with the linear spreading speed
 $V$
in (a) the R II regime and (b) the R III regime. Note that the
 $x$
-axis has been scaled by
 $\unicode[STIX]{x1D706}_{m}$
to highlight departure from the LSA predictions in the R II regime.

Having explicit results for the time scales on which localised and random perturbations lead to dewetting and drop formation, given by
 $t_{MSC}$
and
 $\unicode[STIX]{x1D714}_{m}^{-1}$
, respectively, allows one to discuss which instability is relevant and actually destabilises a film. Considering the ratio of these time scales, however, shows it to be independent of the film thickness. This finding at first sight appears at odds with the commonly accepted paradigm that for thin films spinodal instability is relevant, while for thick ones nucleation is dominant; see, e.g. Seemann et al. (Reference Seemann, Herminghaus and Jacobs2001b
). One explanation is that the nucleation instability may be operational for thin films as well (assuming that nucleating centres are available), but this is not obvious due to the same wavelengths resulting from both localised and global perturbations (for example, in the R III regime, compare figures 10
a and 12
a). However, more careful discussion of this important issue requires simulations in three dimensions, and we therefore defer it to future work.
4.1.4 Marginal stability criterion: correlation with computational results
We now return to simulations of our model, and consider them in light of the MSC predictions. Using the analytical result (4.19) for the linear spreading speed,
 $V$
, of the propagating perturbation, simulation results may be plotted in the reference frame moving with this speed. Furthermore, to emphasise the difference between the dewetting dynamics for different regimes, the travelling wave variable,
 $s=x-Vt$
, is scaled by
 $\unicode[STIX]{x1D706}_{m}$
.
Figure 14 shows typical results in R II and R III regimes (the results in R I are similar to those in R III). First, we see that the instabilities caused by the localised perturbation are essentially bounded by
 $s=0$
, demonstrating that the MSC correctly predicts the speed with which instabilities propagate into the unstable flat region. Furthermore, since the front speed is given by the MSC, we are in the pulled front case as expected. Second, the differences between the dewetting dynamics in the various regimes are easily observed, and we discuss these differences next. Movies (Movies 1–4 in the online supplementary material available at https://doi.org/10.1017/jfm.2017.919) are also available to better illustrate the instability evolution.
In the R III regime, see figure 14(b) and Movie 1, in the reference frame travelling with the MSC speed
 $V$
, the solution is a leftward-propagating travelling wave, with a stationary envelope (in the travelling reference frame). Furthermore, as the travelling wave propagates to the left, its amplitude (close to the front) grows monotonically and dewets the film periodically with wavelength
 $\unicode[STIX]{x1D706}_{m}$
, therefore leading to coherent pattern formation.
In the R II regime, however, the instability evolution is more complicated. Here, the amplitude of the waves connecting the capillary ridge to the flat film (see, e.g.,
 $s/\unicode[STIX]{x1D706}_{m}\in [-2,1]$
in figure 14
a) does not grow monotonically as it travels to the left, but oscillates until some critical amplitude is reached. In this regime (and similarly in R IV, not discussed for brevity), both coherent and incoherent pattern formation is possible; see Movies 2–4 for examples that illustrate either coherent pattern formation (Movie 2); a bimodal pattern where drops of two different sizes are produced (Movie 3); or a disordered state, where the evolution resembles the R III regime sporadically interrupted by a different type of dynamics (Movie 4). Clearly, more work is needed to understand the details of pattern formation in the R II (and R IV) regimes; we leave this for the future and for now focus on the main features of the results, without delving further into various modes of breakup in the R II regime.
The mean time between drop formation extracted from simulations, normalised by (4.20) with (a)
 $\unicode[STIX]{x1D706}=\unicode[STIX]{x1D706}_{m}$
and (b)
 $\unicode[STIX]{x1D706}=\bar{D}_{l}$
, i.e. the mean distance between drop centres obtained in simulations.

To compare the film breakup times predicted by the MSC (4.20) to the results of simulations, we extract the mean time between formation of successive drops. The results are plotted in figure 15 as a function of the initial film thickness,
 $H_{0}$
, normalised by (4.20) with (a)
 $\unicode[STIX]{x1D706}=\unicode[STIX]{x1D706}_{m}$
and (b)
 $\unicode[STIX]{x1D706}=\bar{D}_{l}$
(the mean distance between drop centres extracted from simulations). Similarly to the results given in figure 12(a), figure 15(a) shows that with
 $\unicode[STIX]{x1D706}=\unicode[STIX]{x1D706}_{m}$
the MSC prediction (4.20) gives good agreement with the numerics in regions R I and R III; however, there is no agreement in R II and R IV. Substituting instead the mean distance between drop centres
 $\unicode[STIX]{x1D706}=\bar{D}_{l}$
into (4.20), figure 15(b) demonstrates that the MSC gives the correct result for all film thicknesses not near the threshold values between instability and stability (dashed red lines). This result suggests that the MSC approach provides the correct result for breakup times once the instability wavelength is selected; however, the MSC does not provide information about this selected wavelength in the R II regime.
We note that, while a nonlinear variant of the MSC has been developed, it applies only to pushed fronts (see van Saarloos Reference van Saarloos2003) that are not relevant here. An alternative theory mentioned (but not thoroughly analysed) by van Saarloos (Reference van Saarloos2003) is the Eckhaus or Benjamin–Feir resonance, based upon interaction between unstable waves. Further work is needed to analyse whether such interaction could be responsible for the observed instability in the R II and R IV regimes.
To summarise: for linearly unstable films subjected to a localised perturbation, we have extracted the mean spacing between drop centres and the mean formation times of successive drops, as a function of the initial film thickness,
 $H_{0}$
. It has been shown that there exists a region, R II in figures 12(a) and 15(a), such that the results in the nonlinear evolution regime differ significantly from the predictions of LSA. Our understanding is that the effects leading to the existence of regimes R II and R IV are fully nonlinear.
4.2 Linearly stable regime
We now switch focus to locally perturbed films with initial film thicknesses in the linearly stable regime, in particular for
 $H_{0}>H_{+}$
. First, we investigate the behaviour of linearly stable films exposed to a finite-amplitude disturbance (metastability). Then, once dewetting is induced, we investigate the speed at which a localised perturbation propagates into the stable film region.
4.2.1 Metastability: analytical findings
We first adapt the results of Thiele et al. (Reference Thiele, Velarde, Neuffer and Pomeau2001) and Diez & Kondic (Reference Diez and Kondic2007), and derive the metastable regime. Note that this regime is referred to as the heterogeneous nucleation regime by Seemann et al. (Reference Seemann, Herminghaus and Jacobs2001b ); however, in contrast to the results to be presented here, Seemann et al. (Reference Seemann, Herminghaus and Jacobs2001b ) provide no upper bound to this regime.
A linearly stable film is metastable if there exists a thinner, linearly stable, film with lower energy; hence, given a perturbation of sufficient size, the perturbation can push the thicker film into the energetically preferable thinner film state (dewetting). To derive an expression for the energy per unit length of a film, we analyse steady-state solutions to the governing equation (2.10) that connect two flat films of different thicknesses.
To begin, we set
 $h_{t}(x,t)=0$
in (2.10), integrate with respect to
 $x$
, and divide by
 $Q(h)=h^{3}$
to yield
 $$\begin{eqnarray}\displaystyle {\mathcal{C}}h_{xxx}+{\unicode[STIX]{x1D6F1}_{eff}}^{\prime }(h)h_{x}=d_{0}, & & \displaystyle\end{eqnarray}$$
where
 $d_{0}$
is the constant of integration. Note that the metastability analysis from this point on is independent of the form of the mobility function
 $Q(h)$
. Similarly to Sharma & Verma (Reference Sharma and Verma2004), we use the far-field conditions
 $$\begin{eqnarray}\displaystyle h(x\rightarrow -\infty ,t)=H_{min},\quad h(x\rightarrow \infty ,t)=H_{max},\quad H_{min}<H_{max}, & & \displaystyle\end{eqnarray}$$
and
 $$\begin{eqnarray}\displaystyle h_{x}(x,t)=h_{xx}(x,t)=h_{xxx}(x,t)=0,\quad x\rightarrow \pm \infty , & & \displaystyle\end{eqnarray}$$
where
 $H_{min}$
and
 $H_{max}$
are constants to be determined. Applying boundary conditions (4.23) to (4.21), we find
 $d_{0}=0$
. Equation (4.21) is then integrated again in
 $x$
to obtain
 $$\begin{eqnarray}\displaystyle {\mathcal{C}}h_{xx}+\unicode[STIX]{x1D6F1}_{eff}(h)=\unicode[STIX]{x1D6F1}_{0}, & & \displaystyle\end{eqnarray}$$
where
 $\unicode[STIX]{x1D6F1}_{0}$
is the constant of integration. To satisfy (4.22) and (4.23), we require
 $\unicode[STIX]{x1D6F1}_{eff}(h)$
to have the same value,
 $\unicode[STIX]{x1D6F1}_{0}$
, for at least two different film thicknesses; i.e. ignoring the transition region between the flat films of thickness
 $H_{min}$
and
 $H_{max}$
, the effective disjoining pressure is constant across the film. We may then parameterise steady-state solutions, satisfying boundary conditions (4.22) and (4.23), by
 $\unicode[STIX]{x1D6F1}_{0}$
.

 $e(h)-(H_{m_{1}})$
, where
 $e(h)$
is defined in (4.26), for an initial film profile with (a) negative effective disjoining pressure,
 $\unicode[STIX]{x1D6F1}_{0}<0$
and (b) positive effective disjoining pressure,
 $\unicode[STIX]{x1D6F1}_{0}>0$
. Arrows denote the direction of increasing
 $\unicode[STIX]{x1D6F1}_{0}$
.

Recalling figure 6, there are, at most, three different film thicknesses with the same disjoining pressure; hence, there are at most three roots to
 $\unicode[STIX]{x1D6F1}_{eff}(h)=\unicode[STIX]{x1D6F1}_{0}$
, which we denote as
 $H_{m_{1}}$
,
 $H_{m_{2}}$
and
 $H_{m_{3}}$
, where
 $H_{m_{1}}<H_{m_{2}}<H_{m_{3}}$
. Furthermore, we define four regimes:
 $\text{M}_{\text{I}}$
(no roots of
 $\unicode[STIX]{x1D6F1}_{eff}(h)=\unicode[STIX]{x1D6F1}_{0}$
),
 $\text{M}_{\text{II}}$
(two roots),
 $\text{M}_{\text{III}}$
(three roots) and
 $\text{M}_{\text{IV}}$
(one root) (see figure 16). Note that
 $H_{m_{1}}$
and
 $H_{m_{3}}$
correspond to the left and right solid blue curves, respectively, in figure 16 (thus represent linearly stable solutions), and
 $H_{m_{2}}$
is denoted by the central dotted blue curve (a linearly unstable solution).
A solution to the steady-state boundary values problem specified by (4.22)–(4.24) requires at least two unique roots; therefore there are no possible solutions in
 $\text{M}_{\text{I}}$
or
 $\text{M}_{\text{IV}}$
, and solutions only exist for
 $\unicode[STIX]{x1D6F1}_{0}\in (\unicode[STIX]{x1D6F1}_{min},\unicode[STIX]{x1D6F1}_{max})$
, where
 $\unicode[STIX]{x1D6F1}_{min}$
and
 $\unicode[STIX]{x1D6F1}_{max}$
are the local minimum and local maximum of
 $\unicode[STIX]{x1D6F1}_{eff}(h)$
, respectively, the values of which are given in figure 16 (for the chosen parameter values). In
 $\text{M}_{\text{II}}$
, there are two roots of (4.22)–(4.24), thus one solution joining these states, with
 $H_{min}=H_{m_{1}}$
and
 $H_{max}=H_{m_{2}}$
i.e. the solution in
 $\text{M}_{\text{II}}$
connects a thin linearly stable film to a thicker unstable one.
In
 $\text{M}_{\text{III}}$
, there are three roots; thus we can choose two different
 $H_{min}$
and
 $H_{max}$
(see figure 17). Since
 $H_{m_{2}}$
is a linearly unstable thickness, the corresponding steady-state solutions are also unstable. Ignoring the unstable solution branch, we see that there is a one-parameter family of stable steady solutions in
 $\text{M}_{\text{III}}$
; thus we set
 $$\begin{eqnarray}\displaystyle \unicode[STIX]{x1D6F1}_{0}\in (0,\unicode[STIX]{x1D6F1}_{max}),\quad H_{min}=H_{m_{1}}\quad \text{and}\quad H_{max}=H_{m_{3}}. & & \displaystyle\end{eqnarray}$$
Integrating (4.24) with respect to
 $h$
yields
 $$\begin{eqnarray}\displaystyle \frac{{\mathcal{C}}}{2}\left(h_{x}\right)^{2}+e(h)=e_{0},\quad e(h)=r(h)+\unicode[STIX]{x1D6F1}_{0}h, & & \displaystyle\end{eqnarray}$$
where
 $e(h)$
is the energy per unit length of the film due to the effective disjoining pressure. Here, the constant of integration
 $e_{0}$
may be interpreted as the total energy due to surface tension and effective disjoining pressure, and
 $$\begin{eqnarray}\displaystyle r(h)=-\int ^{h}\unicode[STIX]{x1D6F1}_{eff}(s)\,\text{d}s=\frac{{\mathcal{K}}b^{2}}{2h}\left[\frac{b}{h}-2\right]-{\mathcal{N}}\left[\frac{m^{2}(h)}{2h}-\int ^{h}\frac{m(s)m^{\prime }(s)}{s}\,\text{d}s\right]. & & \displaystyle\end{eqnarray}$$
Recalling the free energy functional (2.12), we note that
 $F(h)=-[{\mathcal{C}}(1+(h_{x})^{2}/2]-r(h)$
. Setting
 $e_{0}=e(H_{m_{1}})$
we plot
 $e(h)-e_{0}$
in figure 17 for various
 $\unicode[STIX]{x1D6F1}_{0}$
, and observe that only for
 $\unicode[STIX]{x1D6F1}_{0}>0$
are there two local minima for
 $e(h)-e(H_{m_{1}})$
(see figure 17
b). In addition, we note that the film thicknesses at the local minima (
 $H_{m_{1}}$
and
 $H_{m_{3}}$
) correspond to linearly stable films, and the film thickness at the local maximum (
 $H_{m_{2}}$
) corresponds to a linearly unstable film.
Following Thiele et al. (Reference Thiele, Velarde, Neuffer and Pomeau2001), we seek a value of
 $\unicode[STIX]{x1D6F1}_{0}$
such that the two local minima of (4.27) have the same energy. Specifically, we seek a value of
 $\unicode[STIX]{x1D6F1}_{0}$
that satisfies
 $$\begin{eqnarray}\displaystyle \frac{\unicode[STIX]{x2202}e(H_{min})}{\unicode[STIX]{x2202}h}=\frac{\unicode[STIX]{x2202}e(H_{max})}{\unicode[STIX]{x2202}h}=0, & & \displaystyle\end{eqnarray}$$
and
 $$\begin{eqnarray}\displaystyle e(H_{min})=e(H_{max}). & & \displaystyle\end{eqnarray}$$
Note that
 $$\begin{eqnarray}\displaystyle \frac{\unicode[STIX]{x2202}e}{\unicode[STIX]{x2202}h}=0\quad \Leftrightarrow \quad \unicode[STIX]{x1D6F1}_{eff}(h)=\unicode[STIX]{x1D6F1}_{0}, & & \displaystyle\end{eqnarray}$$
therefore by inspection, (4.28) and (4.29) are equivalent to satisfying the far-field conditions, (4.22) and (4.23), in (4.24) and (4.26), respectively.
We now apply these results to the specific problem in question. For the parameters chosen in § 2.3,
 $\unicode[STIX]{x1D6F1}_{0}=\unicode[STIX]{x1D6F1}_{0}^{\ast }\approx 0.07273$
satisfies (4.28) and (4.29), and
 $$\begin{eqnarray}\displaystyle H_{min}^{\ast }=H_{m_{1}}^{\ast }\approx 0.99799\times 10^{-2},\quad H_{m_{2}}^{\ast }\approx 0.39024,\quad H_{max}^{\ast }=H_{m_{3}}^{\ast }\approx 3.05160, & & \displaystyle \nonumber\\ \displaystyle & & \displaystyle\end{eqnarray}$$
where ‘*’ superscripts denote the values obtained by using
 $\unicode[STIX]{x1D6F1}_{0}^{\ast }$
in (4.24). The metastability regime is thus given by
 $$\begin{eqnarray}\displaystyle H_{0}\in (H_{m_{1}}^{\ast },H_{-})\cup (H_{+},H_{m_{3}}^{\ast }). & & \displaystyle\end{eqnarray}$$
The region
 $(H_{m_{1}}^{\ast },H_{-})$
corresponds to a narrow range of film thicknesses close to the equilibrium thickness, which we do not consider further. Films thicker than
 $H_{m_{3}}^{\ast }$
are absolutely stable, thus no perturbations may induce dewetting. The identified metastable region
 $(H_{+},H_{m_{3}}^{\ast })$
is considered by numerical simulations in the next section.
Before closing we note the following: (1) In Seemann et al. (Reference Seemann, Herminghaus and Jacobs2001b
), the metastable regime (heterogeneous nucleation in that work) is defined as
 $H_{0}>H_{+}$
. Extending our presented metastability analysis to the disjoining pressure models of Seemann et al. (Reference Seemann, Herminghaus and Jacobs2001b
), we find that for all positive disjoining pressures values (
 $\unicode[STIX]{x1D6F1}_{0}$
in (4.26)), condition (4.29) is never satisfied; specifically, we find that for all
 $\unicode[STIX]{x1D6F1}_{0}>0$
,
 $e(H_{min})<e(H_{max})$
, hence there is no upper bound for the metastable regime, consistent with the findings of Seemann et al. (Reference Seemann, Herminghaus and Jacobs2001b
). Therefore, the existence of absolutely stable films is one of the distinguishing features of the effective disjoining pressure considered here. (2) Satisfying (4.28) implies that
 $H_{min}$
and
 $H_{max}$
are critical points of
 $e(h)$
; however, to satisfy condition (4.28) with
 $H_{min}\neq H_{max}$
, there must exist at least three distinct critical points, i.e., at least three different thicknesses must be characterised by the same disjoining pressure. In our model, this corresponds to positive disjoining pressure. This finding is in agreement with Herminghaus et al. (Reference Herminghaus, Jacobs, Mecke, Bischof, Fery, Ibn-Elhaj and Schlagowski1998), Poulard et al. (Reference Poulard, Voué, De Coninck and Cazabat2006), Seemann et al. (Reference Seemann, Herminghaus and Jacobs2001b
), where it is stated that a disjoining pressure of the form shown in figure 1(b) will lead to metastability, a coexistence of films of different thicknesses. (3) In the work of Sharma & Verma (Reference Sharma and Verma2004), the solution derived in this section is referred to as a pancake solution. We will refer to this solution as a front solution since (4.22) and (4.23) are analogous to the far-field conditions used for a travelling front solution in our previous work (see Lam et al.
Reference Lam, Cummings, Lin and Kondic2014). Note that the same nomenclature is used by Thiele et al. (Reference Thiele, Velarde, Neuffer and Pomeau2001); the derivation of the front solution in that work is slightly different from that presented here; however, the two methods yield the same result.
 $d_{min}(H_{0};W)$
as a function of
 $H_{0}$
for various values of
 $W$
. Black arrow denotes direction of increasing
 $W$
.

4.2.2 Metastability: numerical simulations
In this section, we investigate numerically the evolution of localised perturbations in the metastable regime,
 $H_{0}\in (H_{+},H_{m_{3}}^{\ast })\approx (1.015,3.0516)$
. The initial condition is specified by (4.1), which is parameterised by the initial film height,
 $H_{0}$
. To explore the influence of the perturbation properties, we vary
 $W$
and
 $d$
, respectively the width and depth of the perturbation. In particular, we discuss the quantity
 $d_{min}(H_{0};W)$
, the minimum perturbation amplitude required to induce dewetting. Since we are only interested if breakup occurs for a particular set of
 $d$
and
 $W$
, it is not necessary to dynamically expand the right boundary in the
 $x$
domain; therefore, to reduce simulation time, we fix
 $x\in [0,200]$
.
Figure 18 plots
 $d_{min}(H_{0};W)$
as a function of
 $H_{0}$
for various values of
 $W$
. In the region above
 $d_{min}(H_{0};W)$
(solid curves) and below the dotted black line (
 $d=1$
), the initial condition given by (4.1) induces dewetting. We see that for all values of
 $W$
considered,
 $d_{min}(H_{0};W)\rightarrow 0$
as
 $H_{0}\rightarrow H_{+}$
; i.e. as the film thickness approaches the threshold
 $H_{+}$
between linear stability and instability, an infinitesimally small perturbation (
 $d\ll 1$
) will induce dewetting, as expected. More importantly, figure 18 demonstrates that as
 $H_{0}\rightarrow H_{m_{3}}$
,
 $d_{min}(H_{0};W)\rightarrow 1$
; i.e. as the film thickness
 $H_{0}$
approaches the threshold
 $H_{m_{3}}$
between metastability and absolute stability, the initial condition (4.1) has to essentially rupture the film (
 $d\approx 1$
) for dewetting to be observed. This demonstrates that the analysis in § 4.2.1 provides a correct upper bound for the metastable regime. Note that
 $d_{min}(H_{m_{3}};W)$
is a monotonically decreasing function of the perturbation width
 $W$
. This is expected, since the transition region between a film of thickness
 $H_{0}$
and the minimum of the initial condition (4.1) increases as
 $W$
increases, thus the transition region (which was assumed to be small and ignored in § 4.2.1) is no longer negligible.
We note that the presented results suggest that our model may transition between the regimes called thermal and heterogeneous nucleation (see Seemann et al.
Reference Seemann, Herminghaus and Jacobs2001b
). As
 $H_{0}\rightarrow H_{+}$
, more and more holes are expected as the solution evolves, which may be a result of relatively small perturbations requiring more time to be experimentally measurable compared to the larger perturbations. In contrast, for
 $H_{0}$
significantly larger than
 $H_{+}$
, only perturbations above the threshold value
 $d_{min}$
will form holes, effectively enforcing an upper bound on the time window within which hole nucleation is observed. Therefore, as
 $H_{0}\rightarrow H_{+}$
from above,
 $d_{min}\rightarrow 0$
and the time window (
 $\propto d_{min}^{-1}$
) in which holes form transitions from a sharp window, to a infinitely long time window, within which more and more holes can form.
(a) Front position and (b) front speed as a function of time extracted for various initial film thicknesses,
 $H_{0}$
, within the metastable regime. Black arrows denote the direction of increasing
 $H_{0}$
.

We now briefly describe the film evolution once dewetting is induced. Similarly to our simulations in § 4.1.1, the right boundary in the
 $x$
domain is dynamically expanded; we set the initial domain to
 $[0,10]$
. Simulations show that when dewetting occurs, a retracting front forms, and propagates without additional dewetting events into the flat film region. Similarly to Münch (Reference Münch2005), we extract from our simulation results the front position,
 $x_{f}(t)$
, and its speed,
 $v_{f}(t)$
. Figure 19(a) shows that at long times,
 $x_{f}(t)\propto t^{1/2}$
. Not surprisingly, this power law is different from the
 $t^{2/3}$
power law found by Münch (Reference Münch2005) for a thin film model in the slip-dominated regime. Figure 19(b) shows that, at long times,
 $v_{f}(t)\propto t^{-1/2}$
, whereas in the linearly unstable regime, simulations and analysis show that propagation speed is a constant (see § 4.1.3).
5 Conclusions
While this work has been motivated by NLC films, we have presented results that are relevant to a much wider class of problems involving thin films on substrates, such that the fluid–solid interaction involves a relatively complex form of effective disjoining pressure (sketched in figure 20). Such a form has been derived in the present work as an effective disjoining pressure that includes an elastic contribution for NLC films; however, similar functional forms have been extensively considered in the literature focusing on polymer films on Si/SiO
 $_{2}$
substrates (see, for example, Jacobs et al. (Reference Jacobs, Seemann and Herminghaus2008) and the references therein).
In the NLC context, novel elements include dynamic relaxation of the free surface polar anchoring,
 $\unicode[STIX]{x1D703}_{F}$
, as a function of film thickness
 $h(x,t)$
. In addition, we have highlighted differences and similarities between the presented model, and others discussed in the literature (for example, Cazabat et al. (Reference Cazabat, Delabre, Richard and Sang2011), van Effenterre & Valignat (Reference van Effenterre and Valignat2003), Schlagowski et al. (Reference Schlagowski, Jacobs and Herminghaus2002), Ziherl et al. (Reference Ziherl, Podgornik and Z̆umer2000)). Furthermore, our model exhibits a range of film thickness such that a film is linearly unstable, which is analogous to the so-called ‘forbidden range’ discussed in the literature (Cazabat et al.
Reference Cazabat, Delabre, Richard and Sang2011).
Summary of the various stability regimes discussed in this paper in relation to the effective disjoining pressure. The dashed lines denote analytically derived values and dotted lines denote values extracted from numerical simulations. See the text for explanation of numbered regions.

More generally, an extensive statistical analysis of our computational results, combined with novel analytical results based on the marginal stability criterion, has allowed us to identify a variety of instability mechanisms. In addition to the linearly unstable regime, where infinitesimally small perturbations induce dewetting, there are regimes that require perturbations of sufficient magnitude to induce dewetting (metastability), and regimes that are stable with respect to perturbations of any size (absolute stability). We have also identified the regimes that are linearly unstable, but susceptible to nucleation-dominated dynamics. While we do not consider thermal effects, we find that for some film thicknesses (close to the stability boundaries) our results are similar to other results attributed to a thermal nucleation mechanism, suggesting that consideration of thermal effects may not in fact be needed to explain the dynamics. Also, we have formulated analytical procedures for identifying most of the stability regimes found computationally. In particular, the application of marginal stability analysis has allowed us to reach new insights.
Figure 20 summarises the various stability regimes uncovered, and correlates them with the form of effective disjoining pressure. The following regions are identified:
-
(i) Linearly unstable regime,
 $H_{0}\in (H_{-},H_{+})\approx (1.5b,\unicode[STIX]{x1D6FD})$
, where
$b$
is the equilibrium thickness and
$\unicode[STIX]{x1D6FD}$
is the film thickness at which elastic force are relevant (see § 2.3 and § 2.4).
-
(ii) Linearly stable regime,
$H_{0}\notin (H_{-},H_{+})$
. -
(iii) Linearly unstable regime with negative disjoining pressure,
$H_{0}\in (H_{-},H_{\unicode[STIX]{x1D6F1}_{eff}})$
, where
$H_{\unicode[STIX]{x1D6F1}_{eff}}$
is the thickness marking the sign change of
$\unicode[STIX]{x1D6F1}_{eff}$
(
$\unicode[STIX]{x1D6F1}_{eff}(H_{\unicode[STIX]{x1D6F1}_{eff}})=0$
). If randomly perturbed, the film will dewet and form primary drops only (see § 3). -
(iv) Linearly unstable regime with positive disjoining pressure,
$H_{0}\in (H_{\unicode[STIX]{x1D6F1}_{eff}},H_{+})$
. If randomly perturbed, the film will dewet and form primary and secondary drops. -
(v) Absolutely stable regime,
$H_{0}<H_{m_{1}}^{\ast }$
or
$H_{0}>H_{m_{3}}^{\ast }$
. The film is stable with respect to any perturbation (see § 4.2). -
(vi) Metastable regime,
$H_{0}\in (H_{m_{1}}^{\ast },H_{-})\cup (H_{+},H_{m_{3}}^{\ast })$
. A linearly stable film is unstable with respect to finite-size perturbations. -
(vii) Spinodal regime,
$H_{0}\in (H_{-},H_{n_{1}})\cup (H_{n_{2}},H_{n_{3}})\subset (H_{-},~H_{+})$
. A linearly unstable film perturbed by either localised or random perturbations will result in the mean distance between drop centres,
$\bar{D}_{l}$
, as predicted by LSA, i.e.
$\bar{D}_{l}\approx \unicode[STIX]{x1D706}_{m}$
(see § 4.1). -
(viii) Nucleation regime within the linearly unstable regime,
$H_{0}\in (H_{n_{1}},H_{n_{2}})\cup (H_{n_{3}},H_{+})\subset (H_{-},~H_{+})$
. A linearly unstable film perturbed by a localised perturbation will lead to
$\bar{D}\not \approx \unicode[STIX]{x1D706}_{m}$
, and for a randomly perturbed film the variance in the distribution of inter-drop distances is significantly larger than for the spinodal regime, although we still find that
$\bar{D}\approx \unicode[STIX]{x1D706}_{m}$
.










The regime often called ‘heterogeneous nucleation’ includes the regimes (vi) and (viii); the ‘spinodal’ regime is defined under (vii).
There are several potential directions for future work. Statistical analysis has shown interesting connections between the observed phenomena and properties of the effective disjoining pressure; however, no clear physical mechanism has been identified analytically. Further investigation of the presented results is therefore required. Also, generalising our results to three-dimensional flows is another area of interest, and is the subject of our ongoing research. We hope that our computational results, statistical analysis, and theoretical results will inspire future experimental and analytical investigations, which may provide additional insight into the phenomena presented.
Acknowledgements
The authors thank Uwe Thiele for useful comments on an early version of this manuscript. The authors also gratefully acknowledge financial support from NSF DMS 1211713 and CBET 1604351.
Supplementary movies
Supplementary movies are available at https://doi.org/10.1017/jfm.2017.919.