





Introduction
Effective weed detection and localization are crucial for site-specific weed control (SSWC) in commercial turfgrass systems, such as athletic complexes, golf courses, and sod farms. These systems typically encompass large, intensively managed areas where uniform herbicide applications and mechanical removal are costly, labor-intensive, and increasingly constrained by environmental regulations. SSWC facilitates optimal resource allocation, early intervention, and customized control strategies, fostering data-driven decision-making in turfgrass management (Westwood et al. Reference Westwood, Charudattan, Duke, Fennimore, Marrone, Slaughter, Swanton and Zollinger2018). Weed detection is the primary step in SSWC, requiring accurate identification of weed plants for tailored control treatments (Tu et al. Reference Tu, Hurd and Randall2001). Differences in weed morphology and physiology among the species necessitate distinct herbicide management strategies (Beckie Reference Beckie2006). Mowing is a popular weed management strategy in turfgrass, but it is only effective on upright-growing species (e.g., Canada thistle [Cirsium arvense (L.) Scop] and dallisgrass [Paspalum dilatatum Poir.]), and generally less effective on prostrate or low-growing weeds such as prostrate knotweed (Polygonum aviculare L.) and white clover (Trifolium repens L.) (Busey Reference Busey2003; DeBels et al. Reference DeBels, Griffith, Kreuser, Melby and Soldat2012). Thus, identifying the specific species, growth stage, and characteristics can help effectively implement SSWC. Moreover, accurate weed plant localization reduces off-target application and resource wastage (Esposito et al. Reference Esposito, Crimaldi, Cirillo, Sarghini and Maggio2021; Swinton Reference Swinton2005).
Computer vision (CV) and machine learning (ML) technologies are increasingly important for developing weed detection capabilities that enable SSWC in agriculture. Coleman et al. (Reference Coleman, Bender, Hu, Sharpe, Schumann, Wang, Bagavathiannan, Boyd and Walsh2022) reviewed 50 yr of research on weed detection, highlighting the potential utility of deep learning (DL) models for SSWC. The CV and DL technologies enable the development of automated weed recognition systems, significantly reducing labor costs and agricultural inputs (Rai et al. Reference Rai, Zhang, Ram, Schumacher, Yellavajjala, Bajwa and Sun2023). Researchers have investigated weed detection in turfgrass using deep convolutional neural network (CNN) models and other image processing techniques. For instance, Yu et al. (Reference Yu, Schumann, Cao, Sharpe and Boyd2019a, Reference Yu, Sharpe, Schumann and Boyd2019b) have identified multiple weed species, including dandelion (Taraxacum officinale F.H. Wigg.), ground ivy (Glechoma hederacea L.), spotted spurge [Chamaesyce maculata (L.) Small; syn.: Euphorbia maculata L.], dollar weed (Hydrocotyle spp.), old world diamond-flower [Oldenlandia corymbosa L.; syn.: Hedyotis corymbosa (L.) Lam.], and Florida pusley (Richardia scabra L.), achieving high classification accuracy (F1 scores > 0.95) within perennial ryegrass (Lolium perenne L.) and common bermudagrass [Cynodon dactylon (L.) Pers.] turf. The F1 score, a common metric for evaluating DL models, represents the weighted average of precision and recall, with values ranging from 0 to 1, where 0 indicates extremely poor performance of the model (Yacouby and Axman Reference Yacouby and Axman2020).
Zhang et al. (Reference Zhang, Maleski, Jespersen, Waltz, Rains and Schwartz2021) evaluated the residual neural network (ResNet) architecture for general weed detection in sod fields using unmanned aerial system (UAS) imagery, reporting detection accuracies ranging from 57% to 90%. Similarly, Parra et al. (Reference Parra, Marin, Yousfi, Rincón, Mauri and Lloret2020) and Hahn et al. (Reference Hahn, Roosjen, Morales, Nijp, Beck, Velasco Cruz and Leinauer2021) explored edge detection techniques and random forest models to identify weeds such as T. repens, daisy (Bellis perennis L.), and yarrow (Achillea millefolium L.) in turfgrass. Meanwhile, Xie et al. (Reference Xie, Hu, Bagavathiannan and Song2021) developed a probabilistic map-based algorithm for yellow nutsedge (Cyperus esculentus L.) detection in turfgrass, achieving promising results by reducing image labeling time by 95%. These collective research efforts underscore the importance of tailored approaches for effective weed detection in diverse turfgrass systems.
The CNN models can be used to detect weeds and locate them within an image, enabling targeted treatments using CV-based smart-sprayers (Jin et al. Reference Jin, Bagavathiannan, McCullough, Chen and Yu2022; Petelewicz et al. Reference Petelewicz, Zhou, Schiavon, MacDonald, Schumann and Boyd2024). Jin et al. (Reference Jin, McCullough, Liu, Yang, Zhu, Chen and Yu2023) developed a grid-based spraying system for treating weeds in dormant bermudagrass, but real-time weed detection and treatment remain a challenge in actively growing bermudagrass (Yu et al. Reference Yu, Sharpe, Schumann and Boyd2019b). Additionally, localization based on grid cell values requires applicators to traverse entire fields, which is inefficient when weed populations are heterogeneous. In contrast, Zhang et al. (Reference Zhang, Wang, Hu, Liu and Chen2020) utilized the You Only Look Once (YOLOv3) model to convert UAS image pixel coordinates into geodetic coordinates, achieving a low average positional error of 0.1 m. This advancement enables precise weed localization, facilitating the use of GPS-equipped UAS and ground sprayers for SSWC (Gerhards and Oebel Reference Gerhards and Oebel2006).
Weeds are often unevenly distributed across fields, making it crucial to optimize the total path length to improve the efficiency of an applicator. For example, the limited battery life of a UAS sprayer (20 to 25 min) restricts its ability to cover a large area (Vijayakumar et al. Reference Vijayakumar, Gurjar, Bagavathiannan, Kumar, Chauhan and Mahajan2025). However, with optimized path planning, a UAS sprayer can treat weeds over a larger area with the same battery power. Plessen (Reference Plessen2025) evaluated the application of the traveling salesman problem for path planning in spot spraying with UAS sprayers, showing promising results in optimizing the total path length. The path planning algorithm (PPA) minimizes redundant flight time by determining the optimal shortest route for the UAS sprayer to cover all designated spray points.
Annual bluegrass (Poa annua L.) has developed resistance to multiple herbicide modes of action in turfgrass systems (Breeden et al. Reference Breeden, Brosnan, Mueller, Breeden, Horvath and Senseman2017; Brosnan et al. Reference Brosnan, Breeden, Zobel, Patton and Law2020a, 2020b; McCurdy et al. Reference McCurdy, Bowling, de Castro, Patton, Kowalewski, Mattox, Brosnan, Ervin, Askew and Goncalves2023; Patton et al. Reference Patton, Braun, Schortgen, Weisenberger, Branham, Sharp, Sousek, Gaussoin and Reicher2019) and is therefore, a significant challenge for turf managers (Neal Reference Neal2024; Scherner et al. Reference Scherner, Melander, Jensen, Kudsk and Avila2017). Herbicide resistance and the inability to control P. annua may compromise the efficiency of turfgrass systems, damaging their aesthetic appeal and functionality (Balogh and Anderson Reference Balogh and Anderson2020). The application of CV/ML for site-specific management of this weed species has the potential to enhance turfgrass management and sustainability.
Research on weed detection in turfgrass systems is limited, with no studies specifically focused on detecting P. annua. Detection of small, green P. annua in dense, mowed turfgrass, such as bermudagrass, can be particularly challenging. Additionally, it remains unknown whether UAS-based imagery can be used to effectively detect and localize P. annua in turfgrass. To develop an effective framework for weed detection and localization in turf, it is imperative to address these knowledge gaps. Therefore, the specific objectives of this study were: (1) to detect P. annua in bermudagrass turf using UAS imagery and ML techniques; (2) to localize individual weed plants using ML tools for SSWC; and (3) to optimize path planning for efficient UAS-based targeting of spatially distributed P. annua plants.
Materials and Methods
Data Collection
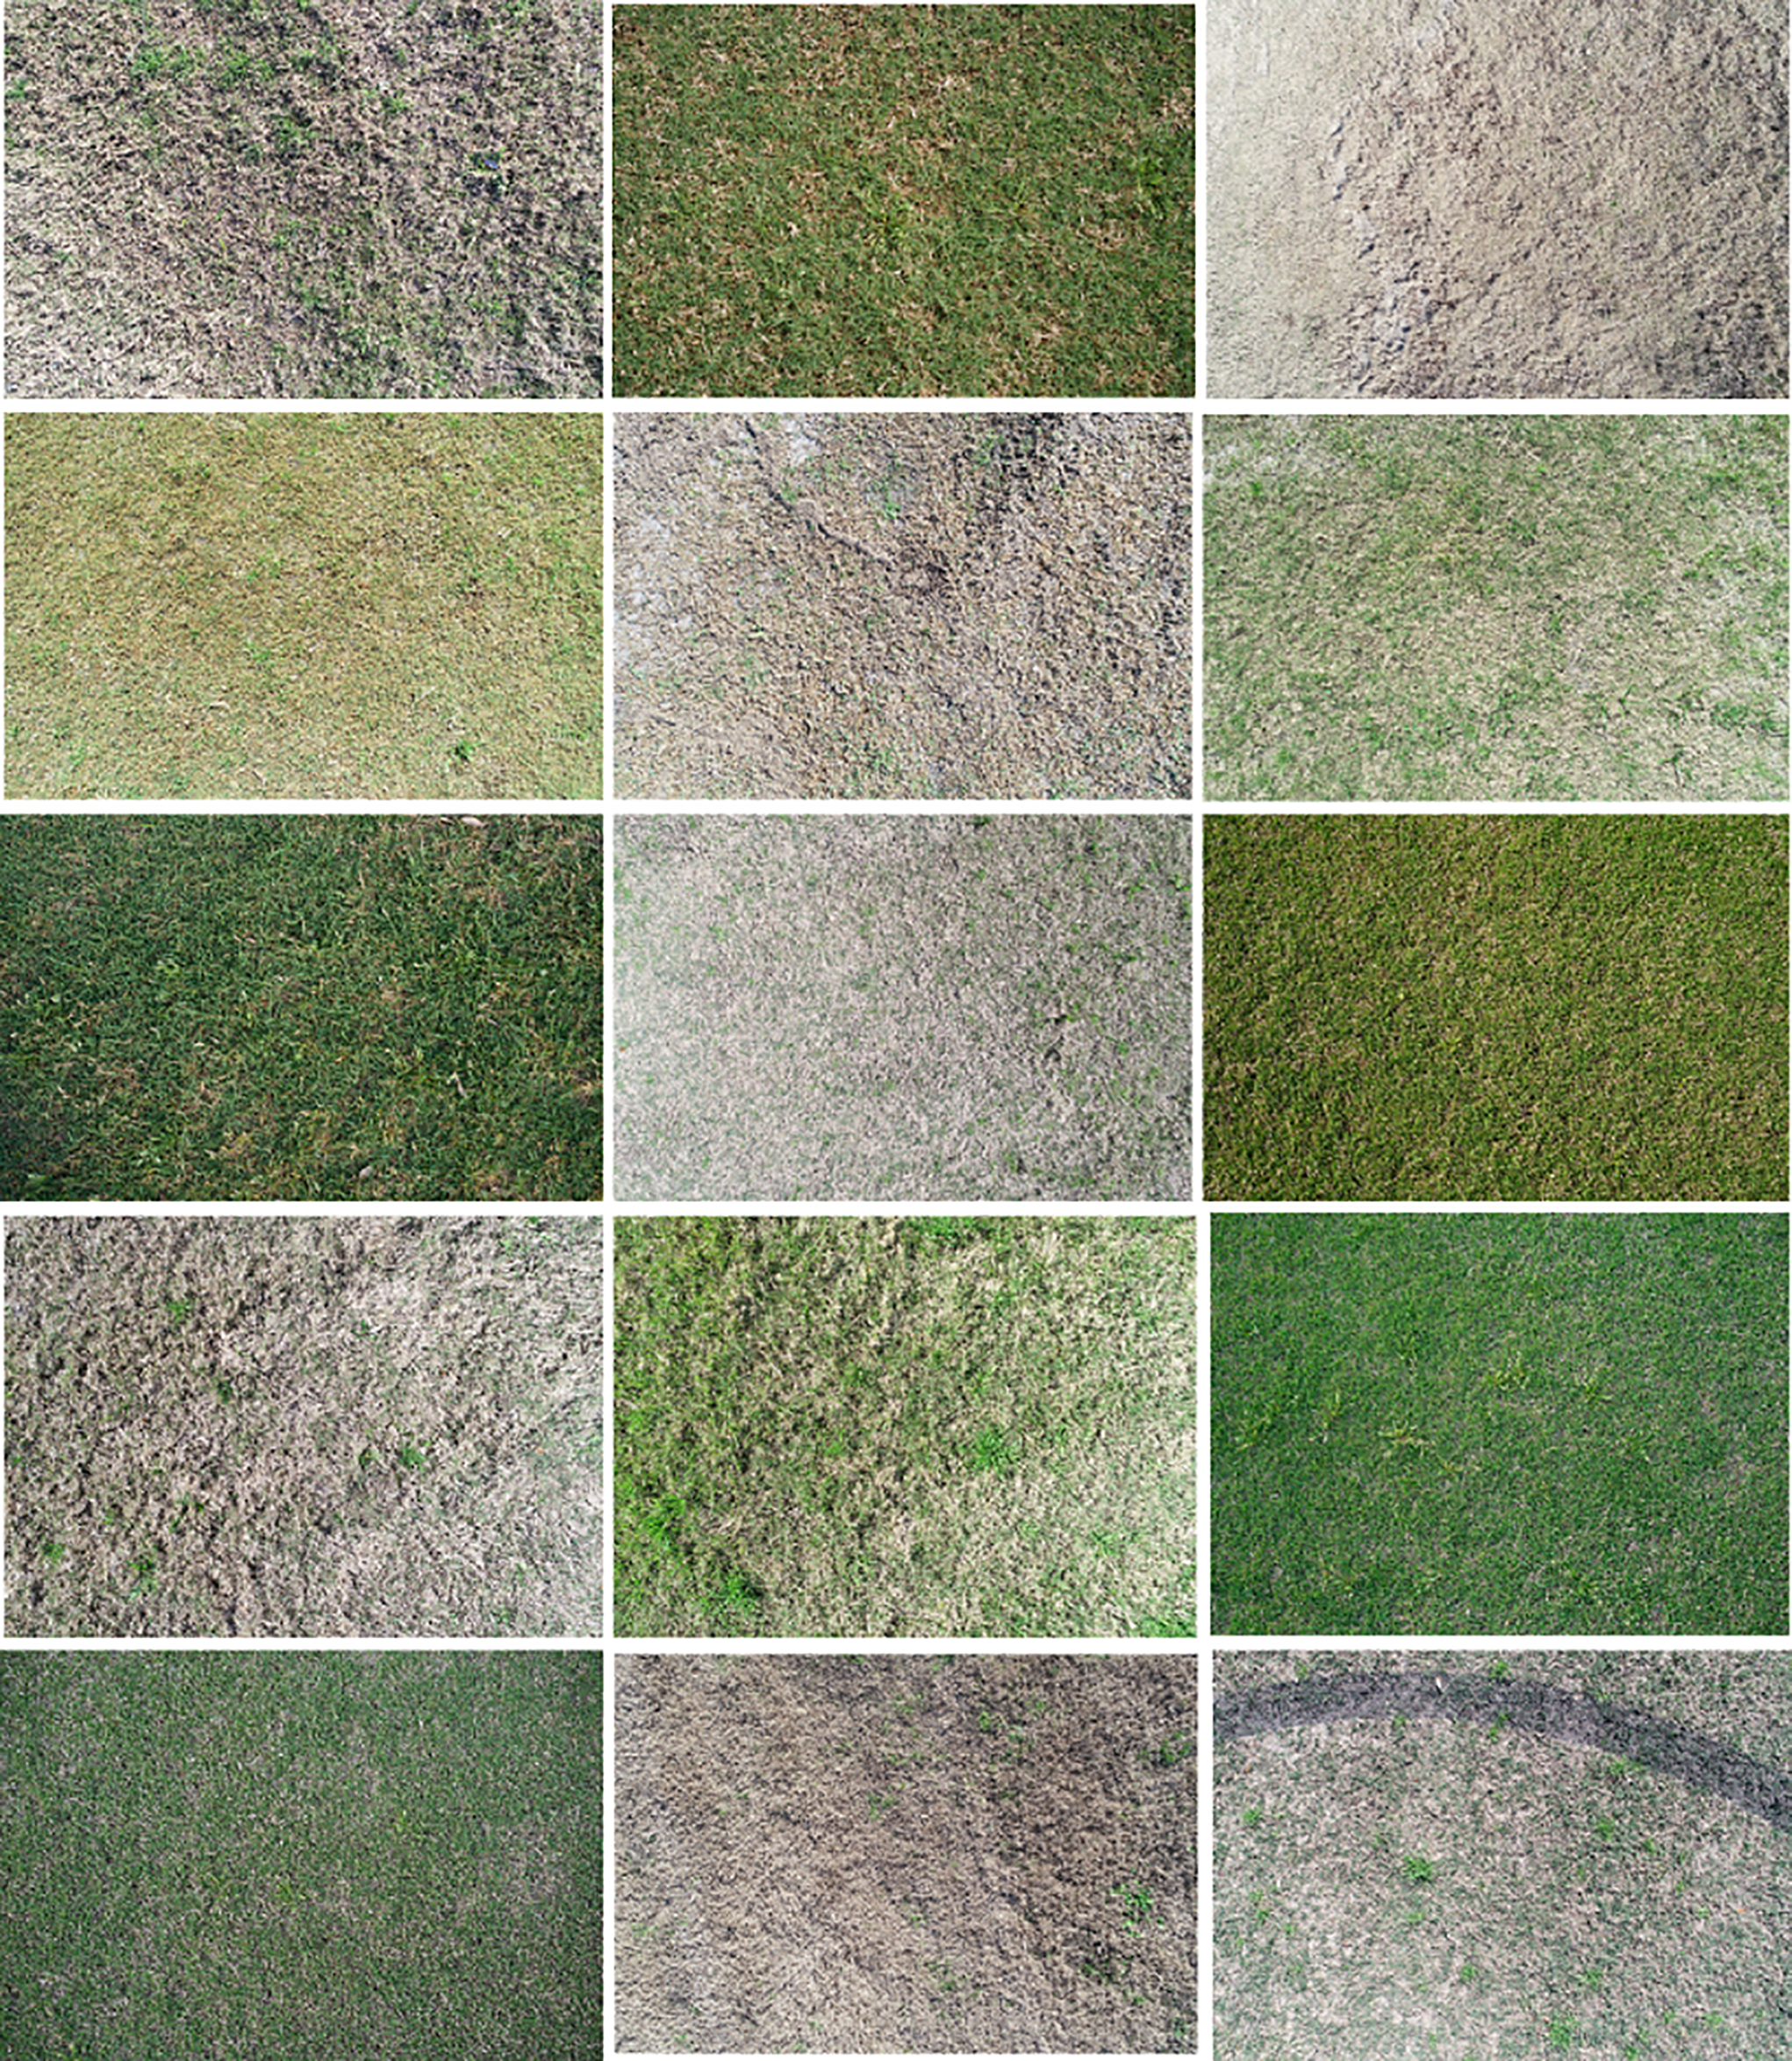
Experiments were conducted during the springs of 2023 and 2024 at three locations: the Deer Park Soccer Complex (29.70363889, −95.09997222) in Deer Park, TX, with ‘Tifway 419’ hybrid bermudagrass; the Scotts Miracle-Gro Facility for Lawn and Garden Research (30.618333, −96.365694) in College Station, TX, with common bermudagrass; and the Simpson Drill Field (30.613833, −96.342611) at Texas A&M University, College Station, TX, with Tifway 419 hybrid bermudagrass. A DJI Phantom 4 Pro (12 MP RGB camera) and a DJI Phantom 4 RTK (20 MP RGB camera, SZ DJI® Technology, Shenzhen, Guangdong, China) UAS were used to collect images of seedling, vegetative, and flowering stages of P. annua. Different growth stages (germination to flowering) of P. annua were included as part of a diverse image dataset for training the ML models. The UAS images were collected in both manual and autonomous modes under different illumination conditions (e.g., sunny, partially cloudy, and cloudy) and turfgrass environments to create a diverse dataset for developing a robust P. annua detection algorithm in bermudagrass (Figure 1). The flight altitude of the manual aerial data collection ranged from 1.5 to <5 m, while the autonomous mode was at 5 m. The autonomous flight mode images were captured in a grid pattern with 70% front and side overlap. To ensure accurate georeferencing, six ground control points (GCPs) were deployed across the field, and a handheld real-time kinematic (RTK) GNSS unit (Emlid Reach2+) was used to collect latitude and longitude coordinates for each GCP.
Selected RGB images of Poa annua in bermudagrass turf across diverse environmental, management, and growth conditions.

Figure 1 Long description
The image contains fifteen separate photos of grass and weeds. Each photo depicts different types of grass and weeds under various environmental, management, and growth conditions. The photos are arranged in a grid with three columns and five rows. Each photo shows a close-up view of the grass or weed, highlighting the differences in morphology and physiology among the species. The colors range from green to brown, indicating varying health and growth stages of the plants. The photos are intended to demonstrate the diversity in weed species and the importance of accurate identification for effective site-specific weed control.
Image Annotation and Dataset Preparation
A total of 1,837 UAS images, representing 31,859 instances of P. annua, were selected. These images were annotated with bounding boxes using the LabelImg image annotation tool (Tzutalin Reference Tzutalin2015). The images obtained through both manual and autonomous flight modes were annotated with a single class (labeled as “poa”), and the annotated data were exported in YOLO format. The original UAS imagery, with dimensions of 5,472 (width) by 3,648 (height) pixels, was downscaled to 1,280 by 1,280 pixels to reduce computational requirements, with black padding added to maintain the aspect ratio. To check the dataset’s robustness, K-fold cross-validation with K = 5 was used to evaluate the models on the entire dataset (Wong and Yeh Reference Wong and Yeh2019).
Model Selection, Training, and Evaluation
For identifying P. annua in bermudagrass turf, two object detection architectures were evaluated: one based on a CNN (YOLO11) (https://github.com/ultralytics/ultralytics) and the other on a transformer (Real-Time Detection Transformer [RT-DETR]) (Zhao et al. Reference Zhao, Lv, Xu, Wei, Wang, Dang, Liu and Chen2024). Each model variant was trained with a batch size of four, with six data loader workers, and an input image resolution of 1,280 × 1,280 pixels. The remaining hyperparameters were kept at their default setting during training. The model variants were trained and tested on the Ubuntu 20.04.4 LTS (Canonical Ltd., London, UK) operating system using a 50-GB graphics processing unit (GPU) and a 250-GB random-access memory (RAM). The model’s performance was assessed using standard metrics, including precision (P), recall (R), mean average precision (mAP)@0.50, and F1 score (Yacouby and Axman Reference Yacouby and Axman2020). The experimental units were the individual folds in 5-fold cross-validation for each model variant, and the ANOVA included model variant (i.e., YOLO11, RT-DETR) as the fixed factor. All analyses were performed using JMP® (Pro v. 16.0; SAS Institute Inc., Cary, North Carolina, USA) and treatment mean separations were conducted using Tukey’s honestly significant difference (HSD) method, with a significance level of α = 0.05.
Weed Localization
The photogrammetry software Agisoft Metashape v. 1.8.5 (Agisoft®, St Petersburg, Russia) was used to generate orthophotos from images captured in autonomous flight mode (ground sampling distance ≈ 2.8 mm/pixel). These orthophotos were georeferenced, assigning latitude and longitude information to each pixel. A custom-trained ML “poa-weed’ model was employed for weed recognition within the orthophotos. Upon weed detection in an image, the center of the bounding box was determined by averaging the x and y coordinates of the top-left (x 1, y 1) and bottom-right (x 2, y 2) corners. The GeoTransform function (Anonymous 2025) was then applied to convert the bounding box’s center point from image coordinates (pixel, line) to geographic coordinates (X geo = longitude, Y geo = latitude) (Equations 1 and 2).
 $X\_{\rm{geo}} = {\rm{GT}}\left( 0 \right) + X\_{\rm{pixel}}\;{\rm{*}}\;{\rm{GT}}\left( 1 \right) + Y\_{\rm{line}}\;{\rm{*}}\;{\rm{GT}}\left( {\rm{2}} \right)$
 $Y\_{\rm{geo}} = {\rm{GT}}\left( 3 \right) + X\_{\rm{pixel}}\;{\rm{*}}\;{\rm{GT}}\left( 4 \right) + Y\_{\rm{line}}\ {\rm{*}}\;{\rm{GT}}\left( {\rm{5}} \right)$
where:
GT(0) is the x-coordinate of the upper-left corner of the upper-left pixel,
GT(1) is the pixel resolution/pixel width,
GT(2) is the row rotation,
GT(3) is the y-coordinate of the upper-left corner of the upper-left pixel,
GT(4) is the column rotation, and
GT(5) is the pixel resolution/pixel height.
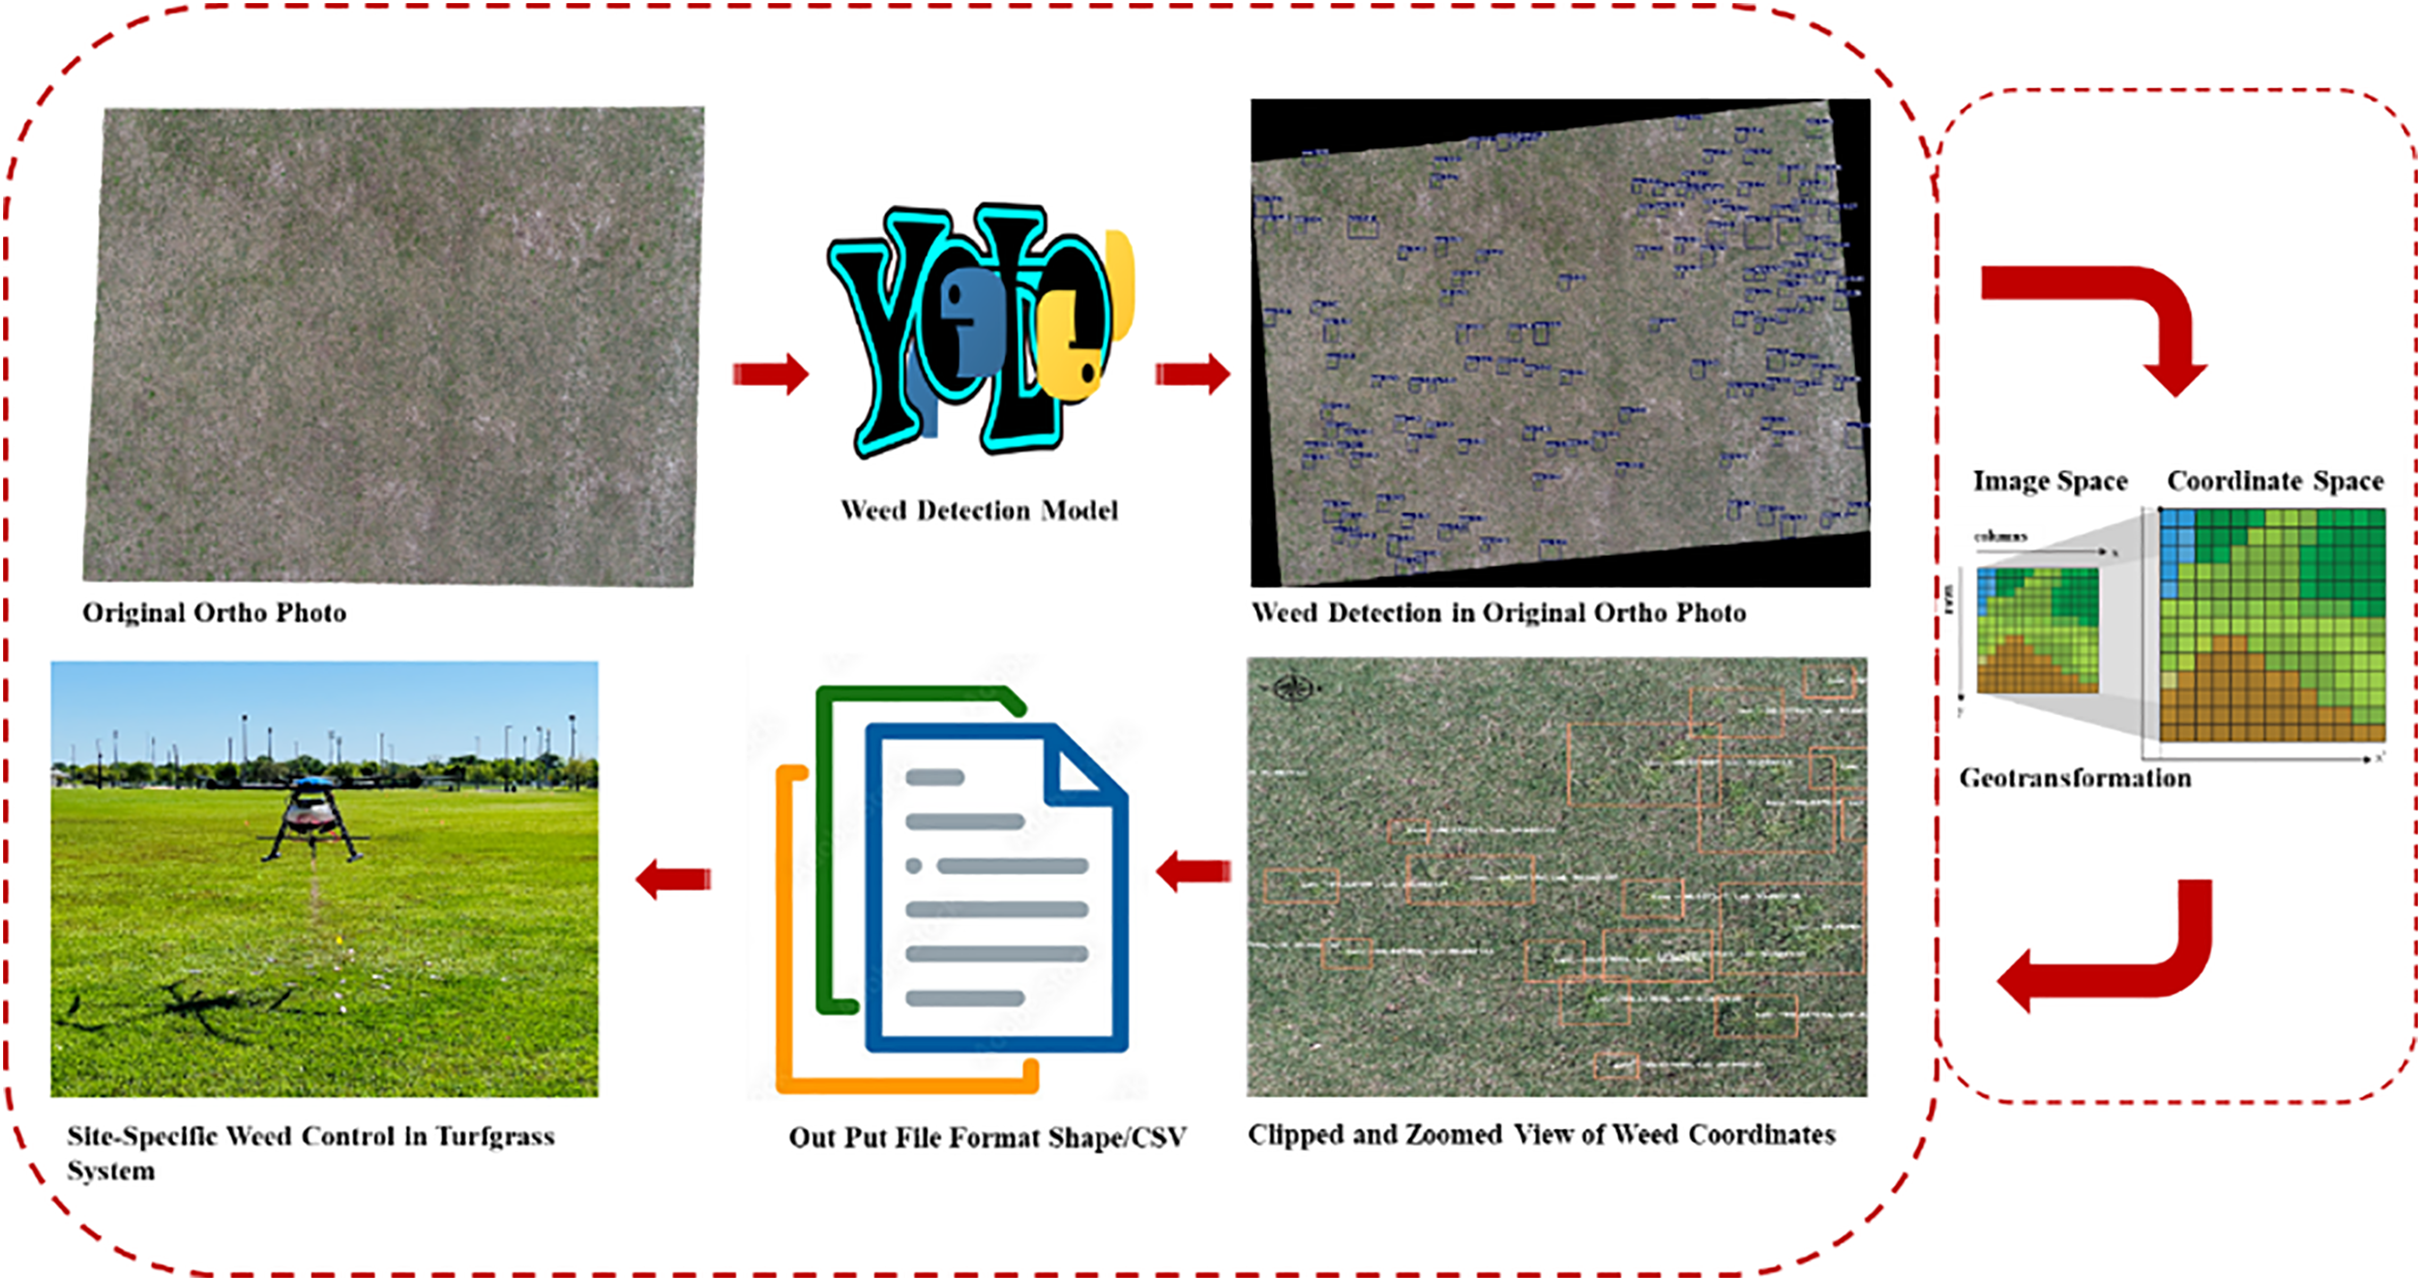
After image coordinates are transformed into geocoordinates, the model output can be in the form of a shapefile or a comma-separated values (CSV) file, depending on user preference; however, both file formats were used in this study (Figure 2). Because the UAS images were captured with a 70% overlap, it is possible for the same weed plant to be detected multiple times in overlapping images, potentially leading to duplicate weed coordinates in the output file. Therefore, a Python script was written to eliminate duplicate coordinates from the input CSV file and generate a new CSV file containing only unique coordinates. However, in the current study, orthophotos were used, and their quality was not affected by the percentage of overlap, allowing for the reduction of overlap in autonomous flight plans. This allows operators to capture larger areas, flying at a low altitude (thus high optical resolution), with the same battery capacity.
A schematic diagram describing the entire workflow, including aerial image collection, analysis, weed map generation, and site-specific control of Poa annua in bermudagrass turf.

Weed Localization Accuracy Assessment
To verify the accuracy of weed localization, ArcGIS Pro 3.0.0 (ESRI, Redlands, CA, USA) was used. Orthophotos were imported, and the center points of P. annua plants were identified and manually marked within each image. To avoid detection errors associated with overlapping images, only the single weed plants were selected and marked (Figure 3). To locate individual weeds in the orthophoto manually, the Create Feature Class tool in the geoprocessing tool kit of ArcGIS Pro software was used. The Point Feature function was selected to mark P. annua in the orthophoto, and the resulting feature class was exported to a CSV file. Subsequently, the same orthophoto was used for weed detection and localization using a custom-trained weed model. Both model output formats, CSV and shapefile, were exported for accuracy assessment. The resulting shapefile was then superimposed on the orthophoto to visualize the weed locations identified by the model. To quantify the difference between the manually marked weed positions and the model-predicted positions, distances were calculated using the geodesic function in the geopy package (Anonymous 2018; Equation 3). Root mean-square error (RMSE), mean, and SE were also calculated.
 ${\rm{Distance\;}} = {\rm{\;geopy}}.{\rm{distance}}.{\rm{geodesic}}\left( {{\rm{coords}}\_1,{\rm{\;coords}}\_2} \right).{\rm{m}}$
An example image showing the manual marking of Poa annua in bermudagrass turf to verify the accuracy of weed localization. For the final comparison, only individual weeds without occlusion were selected to avoid manual errors when locating overlapping weed centroids.

where coords_1 denotes the manually located weed centroid, and coords_2 represents the model-predicted weed centroid.
Path Planning for SSWC
Two heuristic algorithms, nearest neighbor (NN) and ant colony optimization (ACO), were used to determine the shortest navigation path length for SSWC. The NN algorithm is deterministic, starting at an initial point (i.e., fixed) and iteratively moving to the nearest unvisited location until all spots are covered. In contrast, ACO is a probabilistic algorithm inspired by the behavior of ants searching for food, in which they deposit pheromones along their paths and tend to follow routes with stronger pheromone levels. To optimize the path for spot spraying, two separate Python scripts were written to implement these algorithms. For the ACO algorithm, the following parameters were chosen: num_ants = 200, num_iterations = 100, alpha = 1, beta = 2, and evaporation rate = 0.5 (https://github.com/Akavall/AntColonyOptimization). To evaluate the algorithms, 10 random images were selected, and weed coordinates were extracted using the custom-trained weed detection model. The algorithms were then used to arrange the extracted coordinates in the shortest path. The Haversine formula was applied to calculate the cumulative distance (D) (Anonymous n.d.; Equation 4).
 $$D = \text {haversine}(\theta ) = \text {sin}^2\left( {{\raise0.7ex\hbox{$\theta $} \mathord{\left/
{\vphantom {\theta 2}}\right.}\lower0.7ex\hbox{$2$}}} \right)$$
where θ is the central angle between two points on the surface of a sphere, typically measured in radians. To compare the effectiveness of the PPAs, a one-way ANOVA was performed using the statistical software JMP® Pro v. 16.0. Before ANOVA, the cumulative distance data were log transformed in Microsoft Excel 2019 (Microsoft, Seattle, WA, USA).
Results and Discussion
Poa annua Detection and Model Comparison
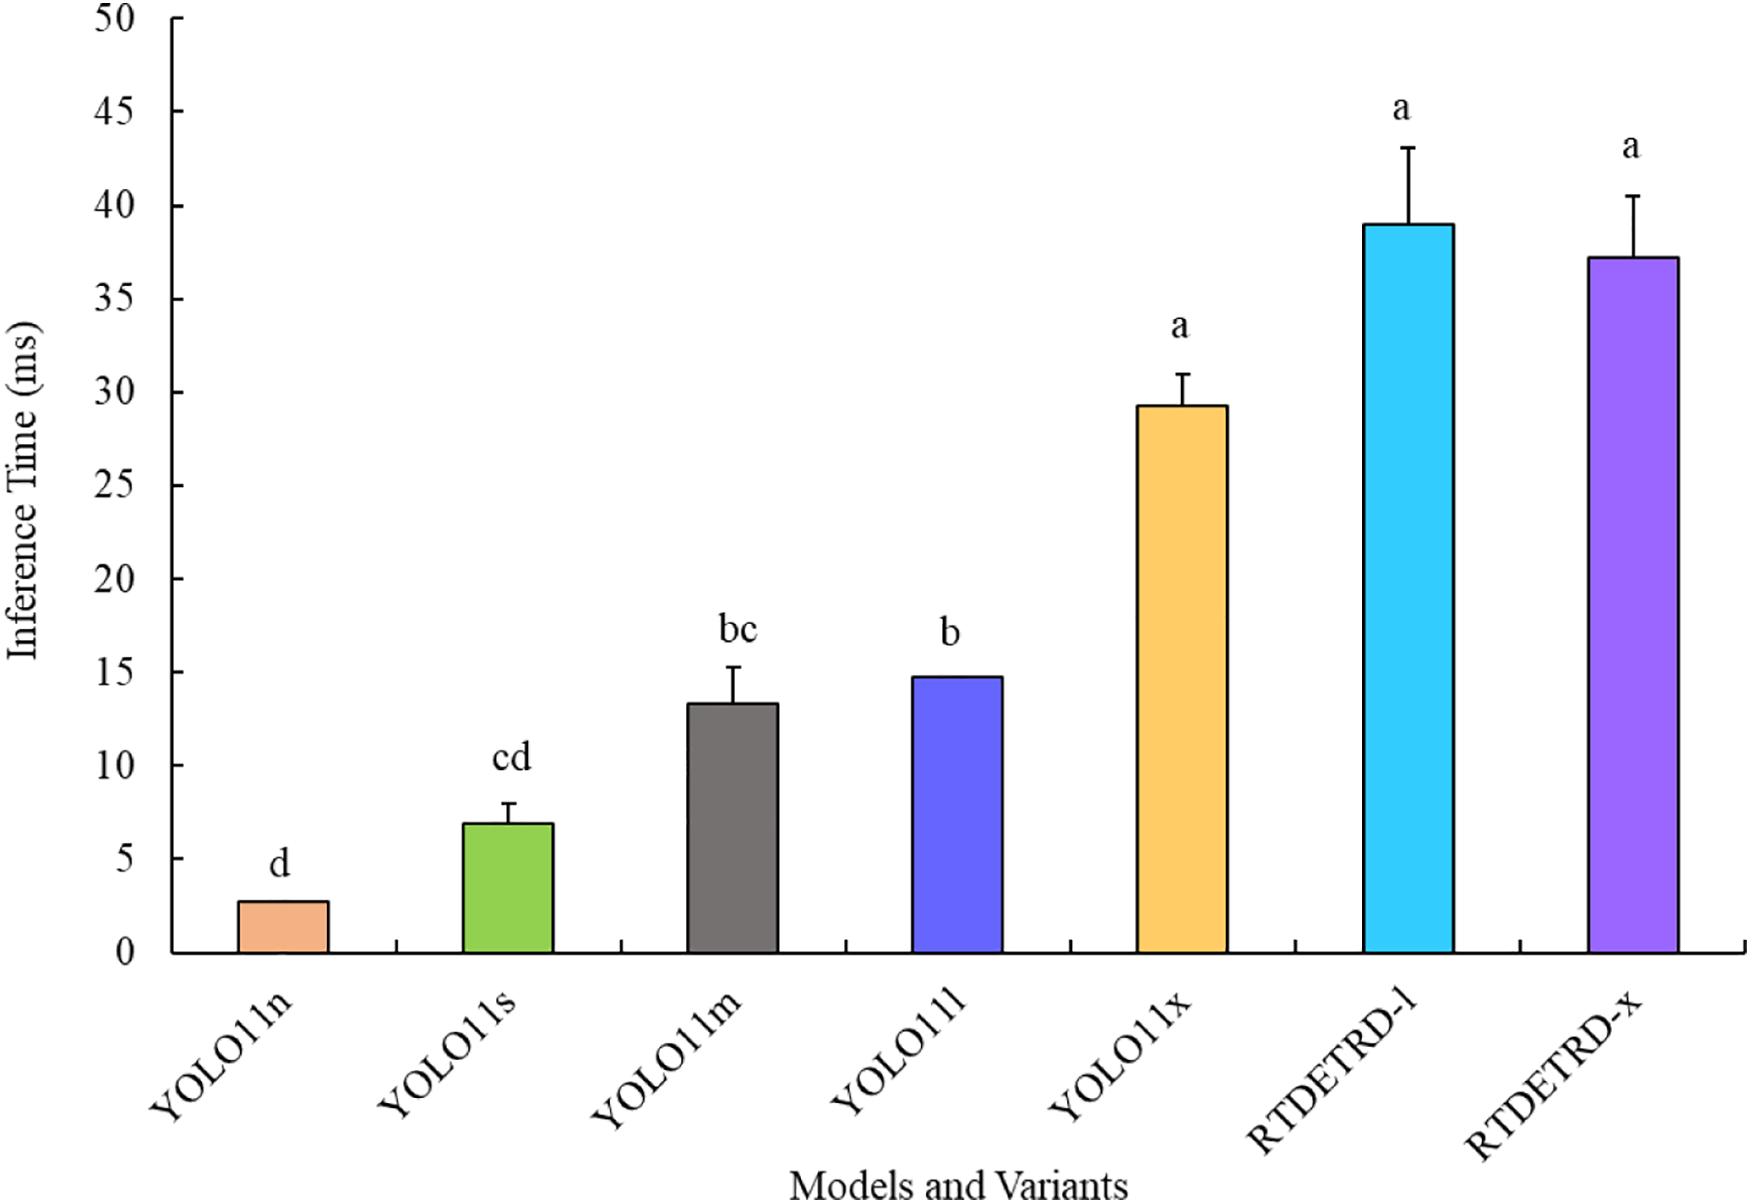
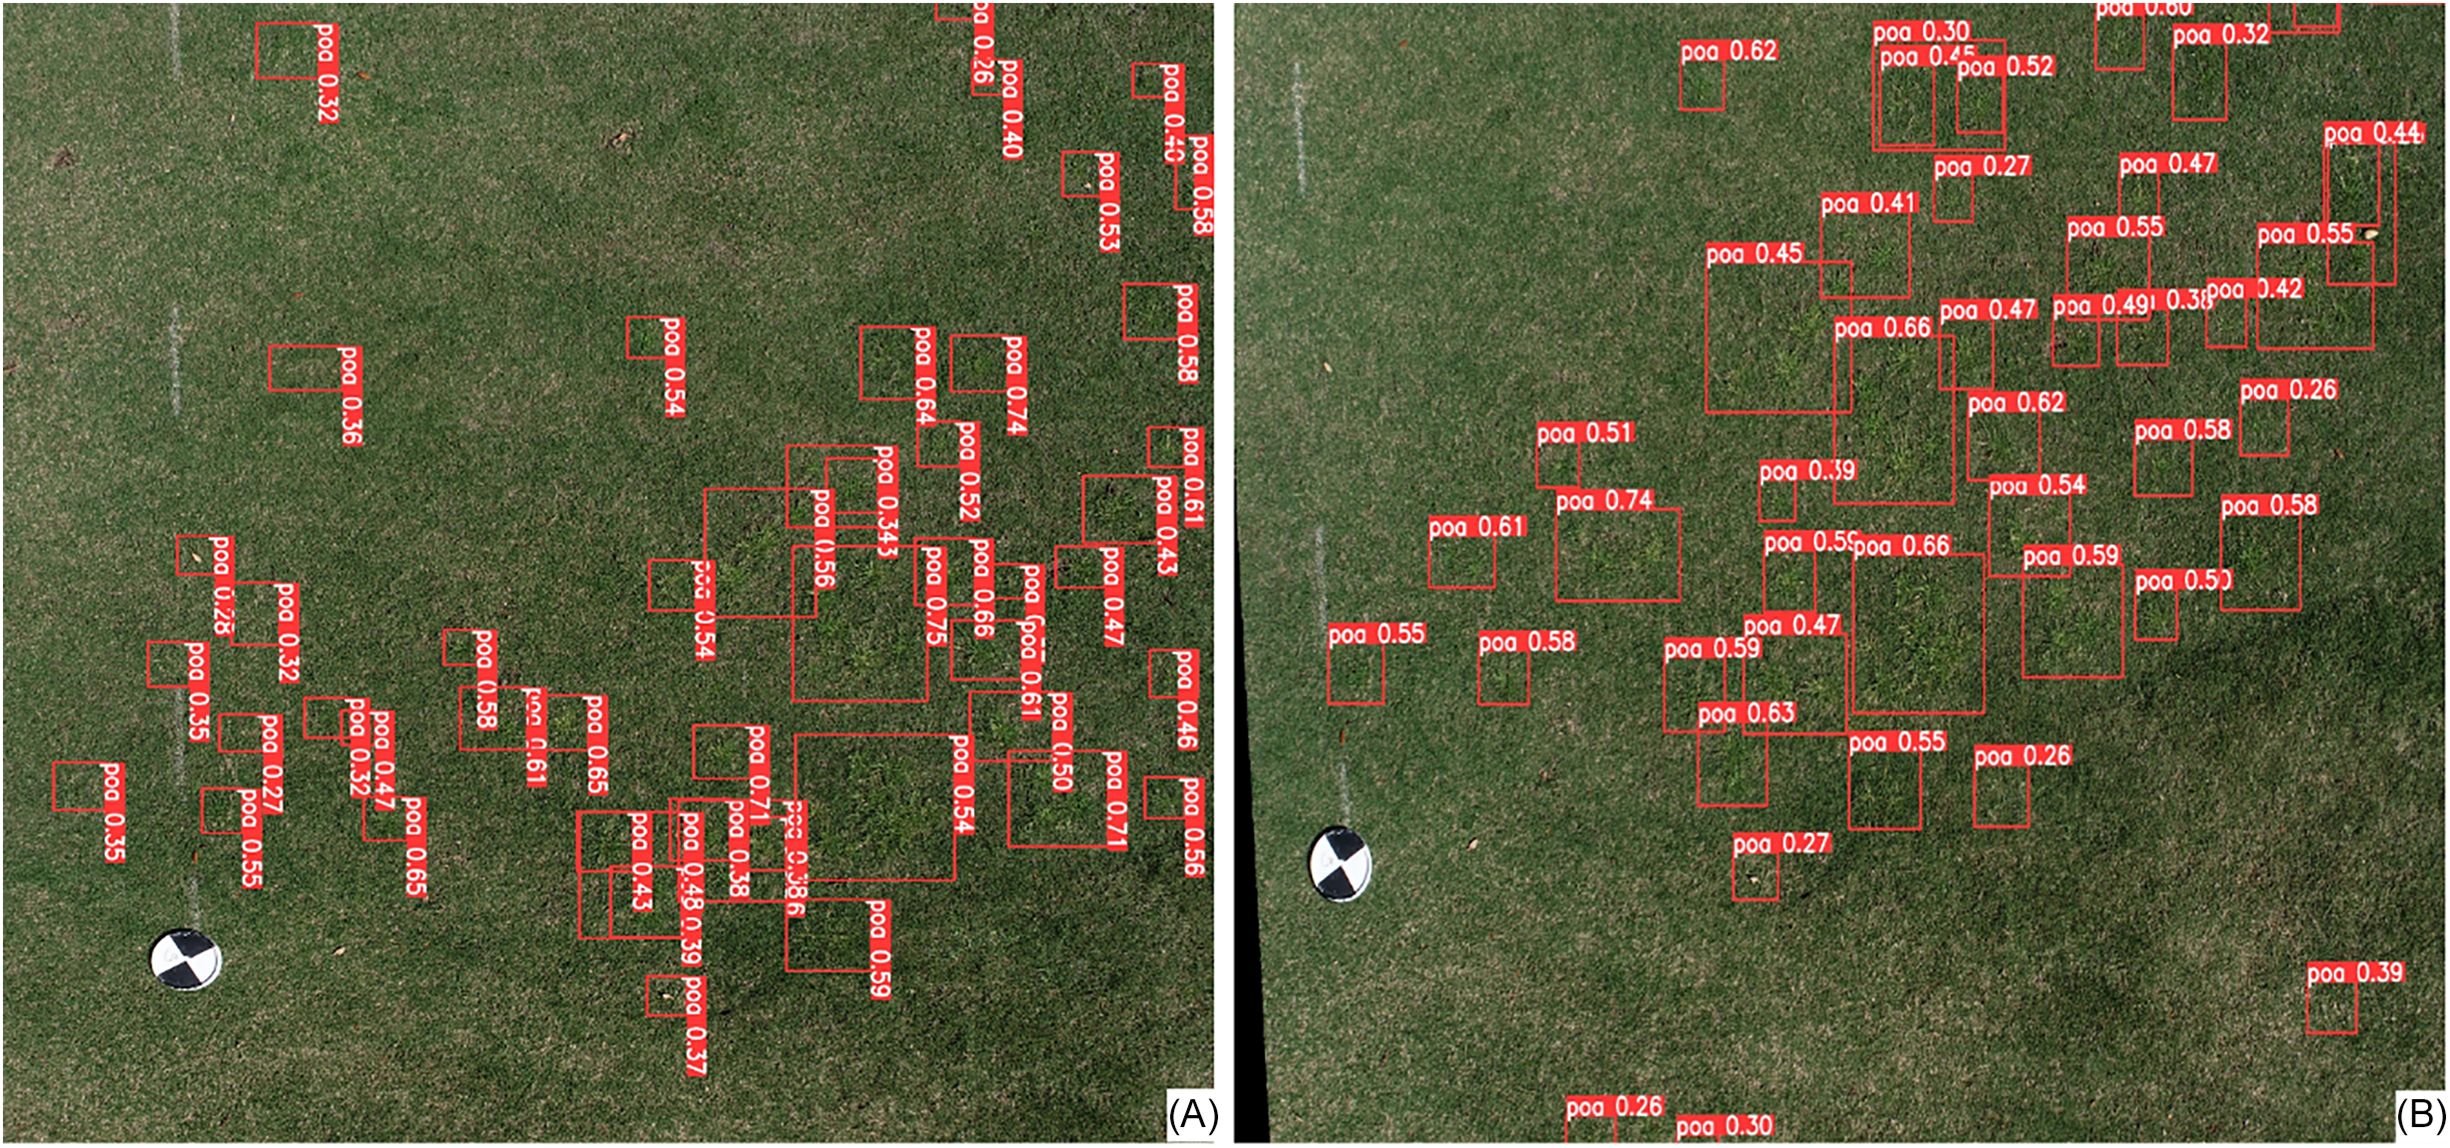
A comprehensive evaluation of the YOLO11 and transformer (RT-DETR) models demonstrated consistent performance in detecting P. annua on a bermudagrass background (Table 1). However, in terms of inference speed, the YOLO11n variant outperformed all other variants without compromising model performance (Figures 4 and 5). Among the YOLO11 variants, YOLO11n demonstrated the best performance, achieving an F1 score of 0.646 and a mAP@0.50 of 0.682, yet it was comparable to the other variants tested (Table 1). This includes the RT-DETR model variants RT-DETR-l and RT-DETR-x.
Performance metrics (F1 score, precision, recall, and mAP@0.50) obtained during the evaluation of YOLO11 and RT-DETR model variants for Poa annua recognition in bermudagrass.

Table 1. Long description
A performance comparison table detailing five evaluation metrics across seven different object detection model variants. All values include a mean score, a standard deviation ($\pm$), and a superscript lowercase letter “a”.
a Means ± SE within a column followed by a common letter are not significantly different based on Tukey’s honestly significant difference (HSD) test (α = 0.05).
Inference time (in milliseconds) incurred per image during the validation of YOLO11 and RT-DETR model variants on 31,000 instances of Poa annua, using Ubuntu 20.04.4 LTS with an NVIDIA RTX A6000 graphics processing unit (50-GB memory) and 250-GB RAM. The whiskers represent the standard errors of the mean. Bars topped by different letters indicate significant differences based on Tukey’s honestly significant difference (HSD) test (α = 0.05).

Example of Poa annua detection using an unmanned aerial system (UAS) in autonomous flight mode using the YOLO11n model. The autonomous flight was conducted at 5-m altitude when the bermudagrass was actively growing. (A) An original raw UAS imagery and (B) the raw image transformed into a georeferenced image using a photogrammetry software (Agisoft Metashape).

Figure 5 Long description
Two images side by side. Panel A: A photo of a grass field with red bounding boxes and labels indicating detected Poa annua plants. The labels include confidence values. Panel B: The same grass field image transformed into a georeferenced image using photogrammetry software, with similar red bounding boxes and labels indicating detected Poa annua plants and their confidence values.
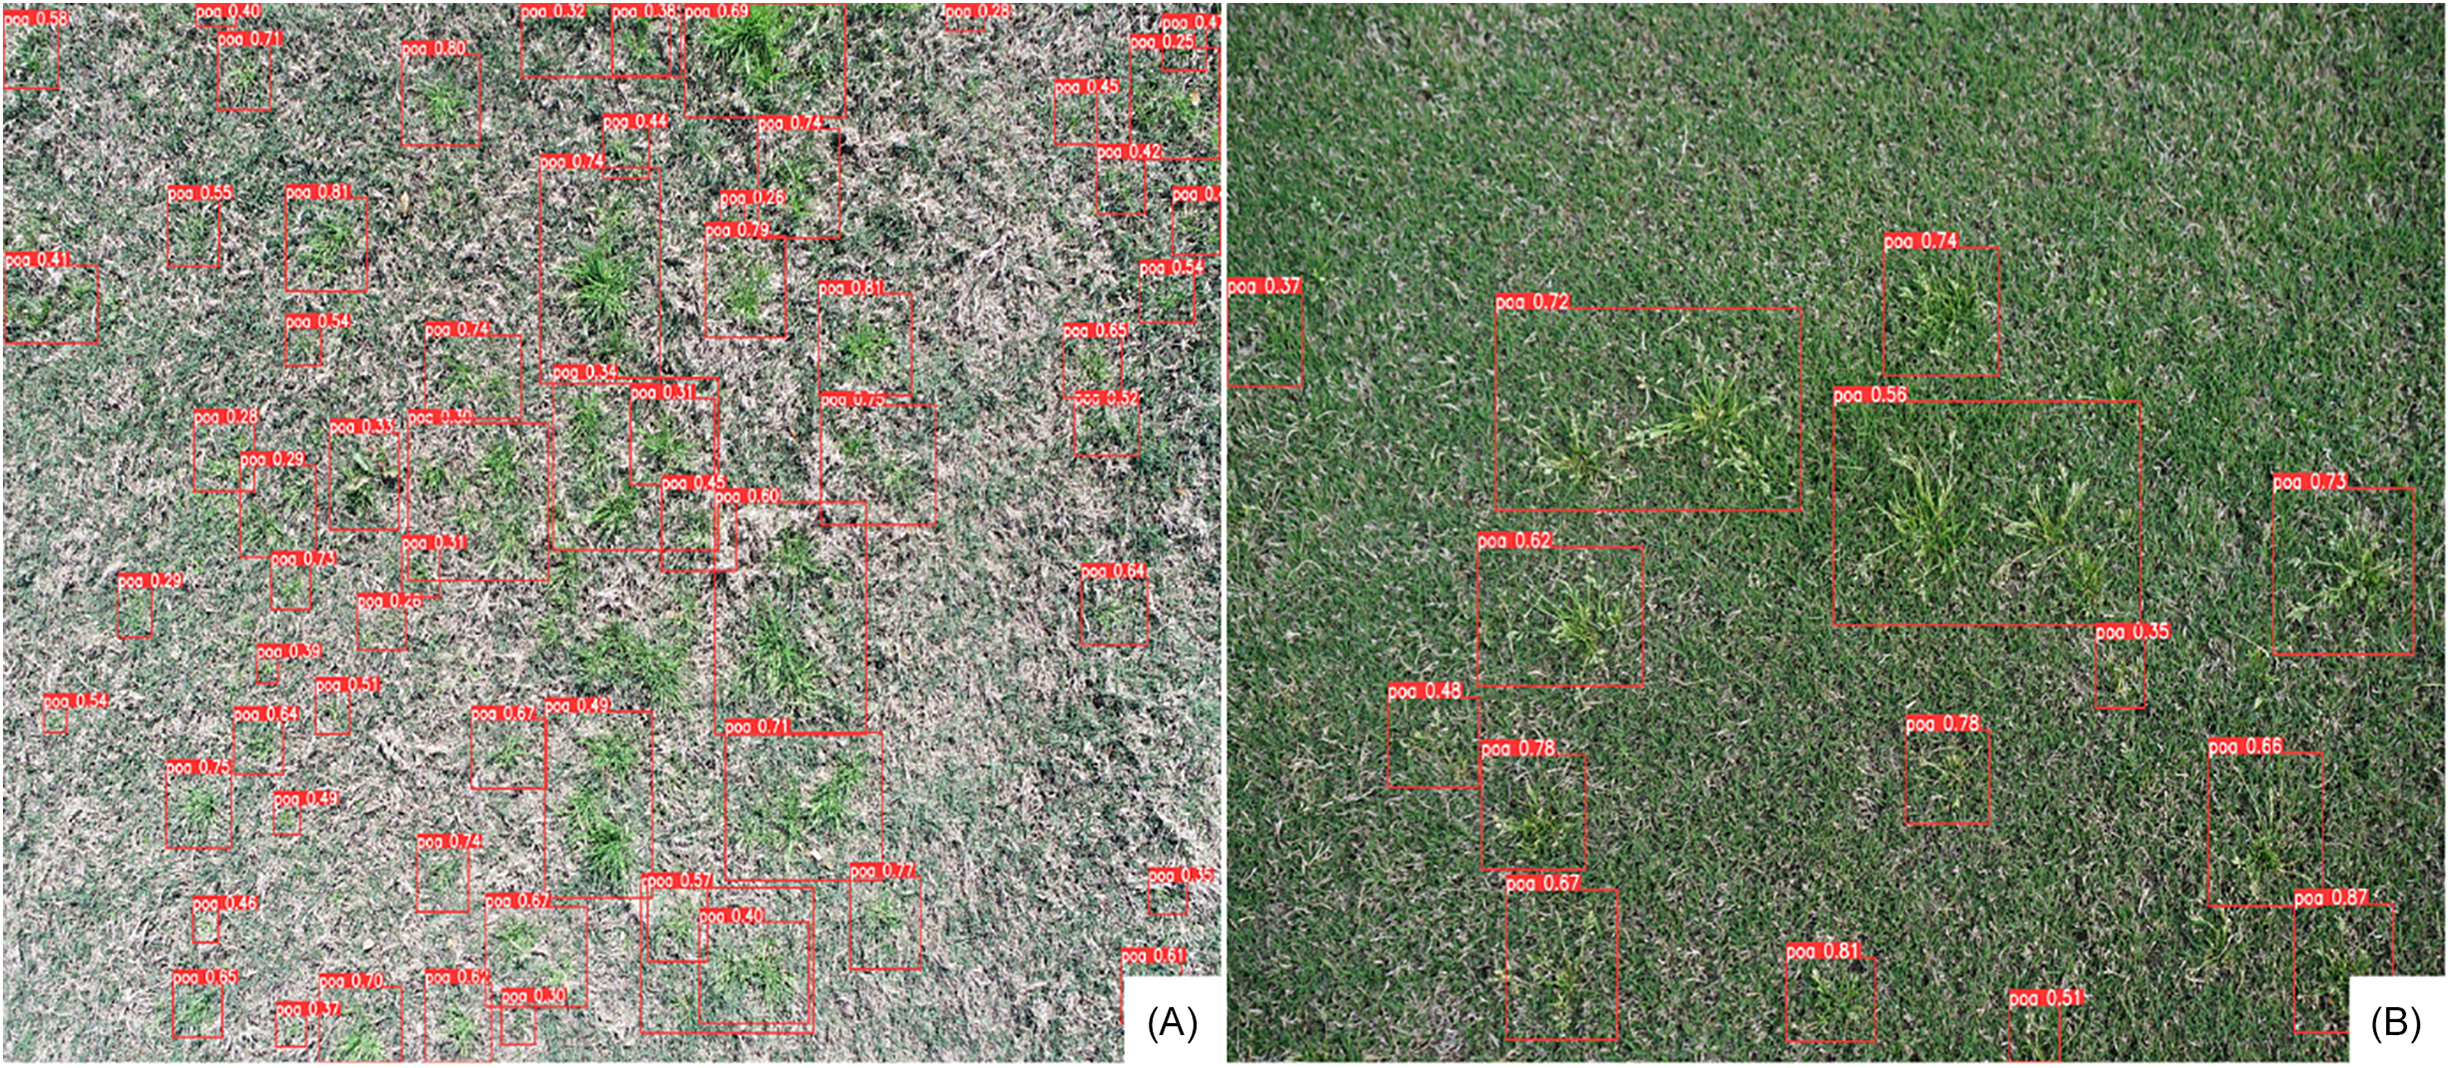
The models evaluated in this study demonstrate excellent performance compared with results from several previous studies on weed detection in actively growing turf. For instance, Zhuang et al. (Reference Zhuang, Jin, Chen, Meng, Wang, Yu and Muthukumar2022) found F1-score values of only 0.56 for YOLOv3, 0.53 for Faster R-CNN, and 0.53 for VFNet for general weed detection in bahiagrass (Paspalum notatum Flueggé). In another study, Yu et al. (Reference Yu, Schumann, Cao, Sharpe and Boyd2019a) reported F1 scores of 0.99, 0.66, and 0.94 for DetectNet, GoogLeNet, and VGGNet, respectively, in detecting P. annua within dormant bermudagrass. The dataset used by Yu et al. (Reference Yu, Schumann, Cao, Sharpe and Boyd2019a) was small, featured a simple turf background (i.e., green on brown), and consisted of proximal images. In comparison, the models presented in this study exhibit stronger generalization capability, as they were trained on a robust UAS imagery dataset. The dataset included complex backgrounds (grass [P. annua] within grass [bermudagrass]), sparse weed distribution, varying growth stages, diverse turf environments, and varying mowing conditions (Figures 1 and 6).
Example of Poa annua detection in bermudagrass turf using unmanned aerial system (UAS) imagery and YOLO11n model: (A) detection in dormant bermudagrass at an early weed growth stage and (B) detection in actively growing bermudagrass at the flowering stage. These images were collected in manual flight mode at an altitude of approximately 3 m.

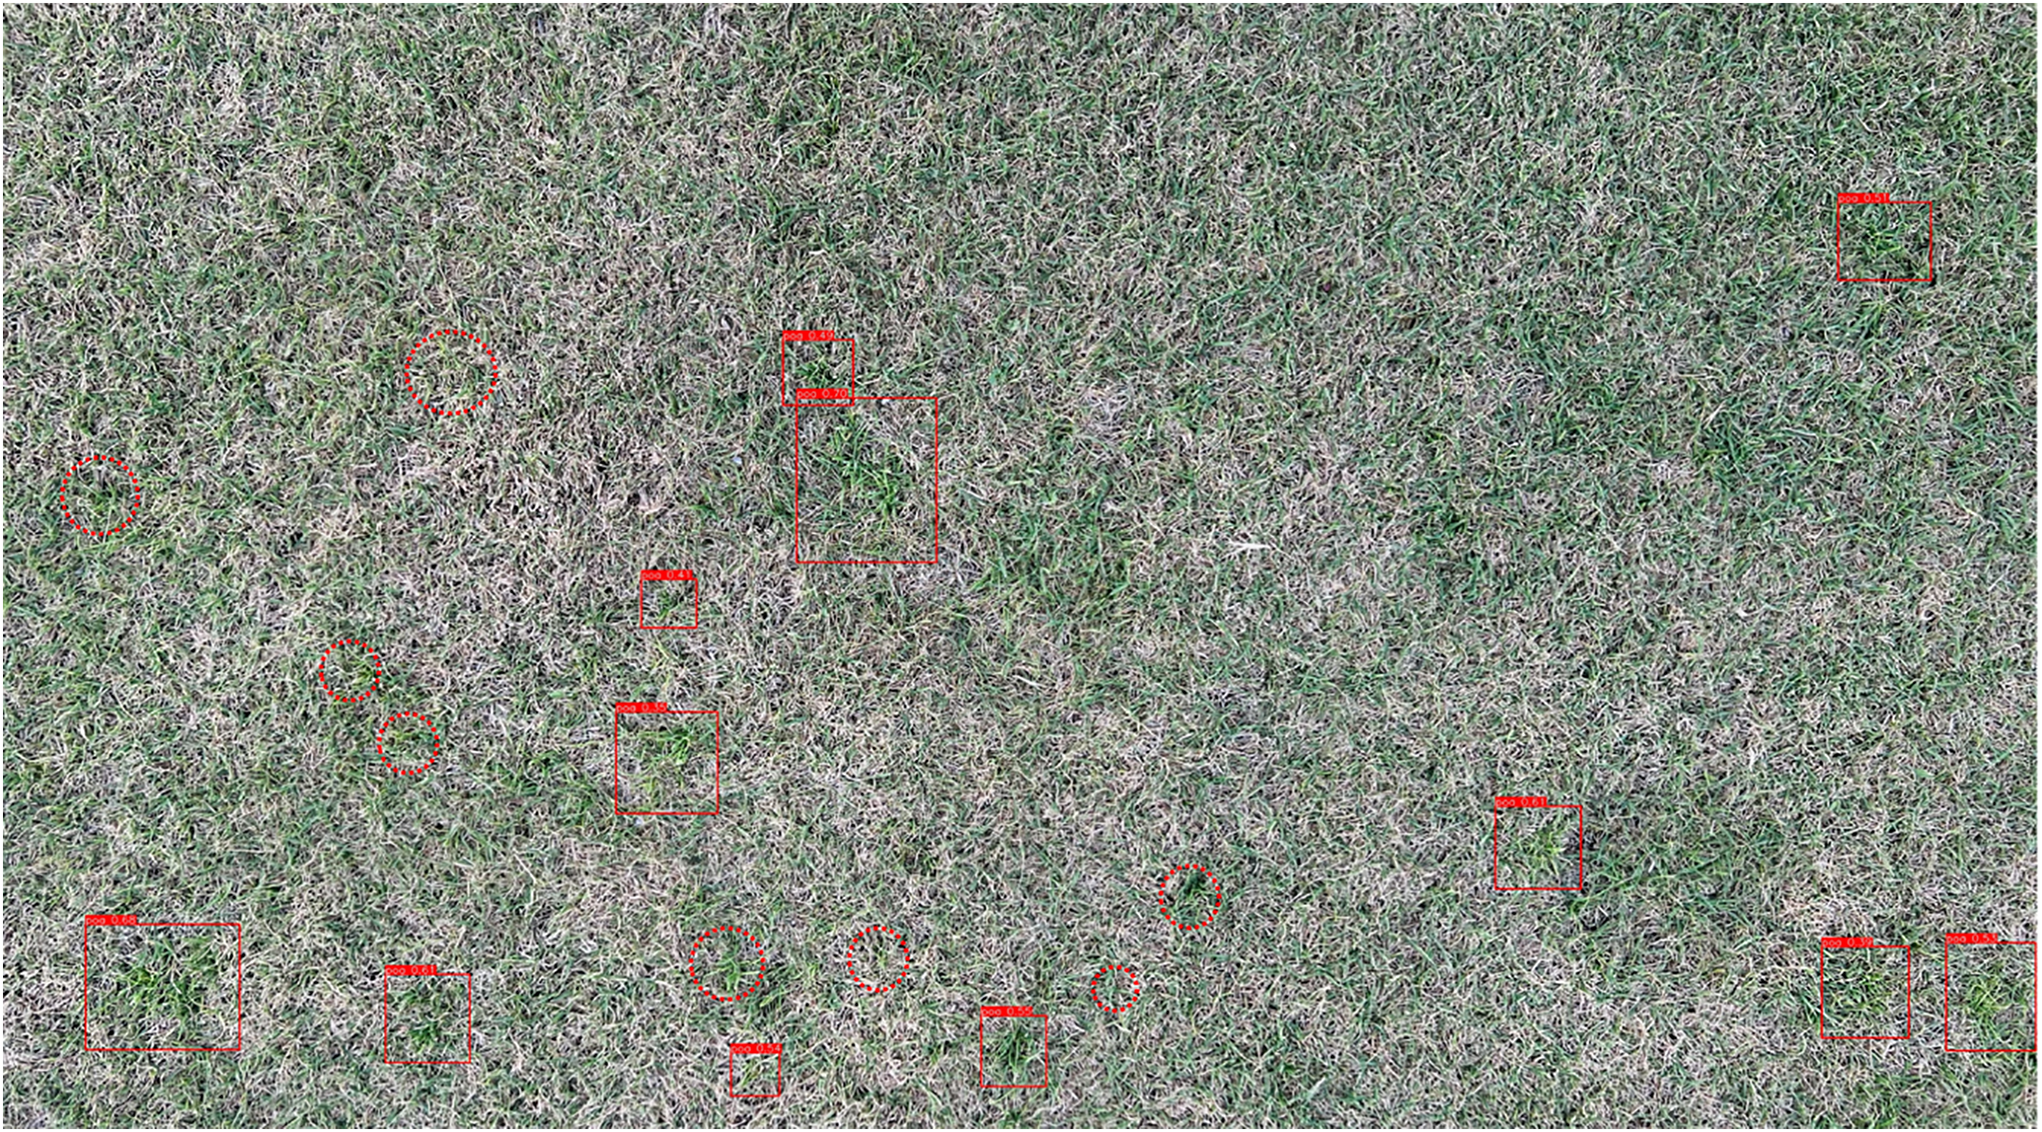
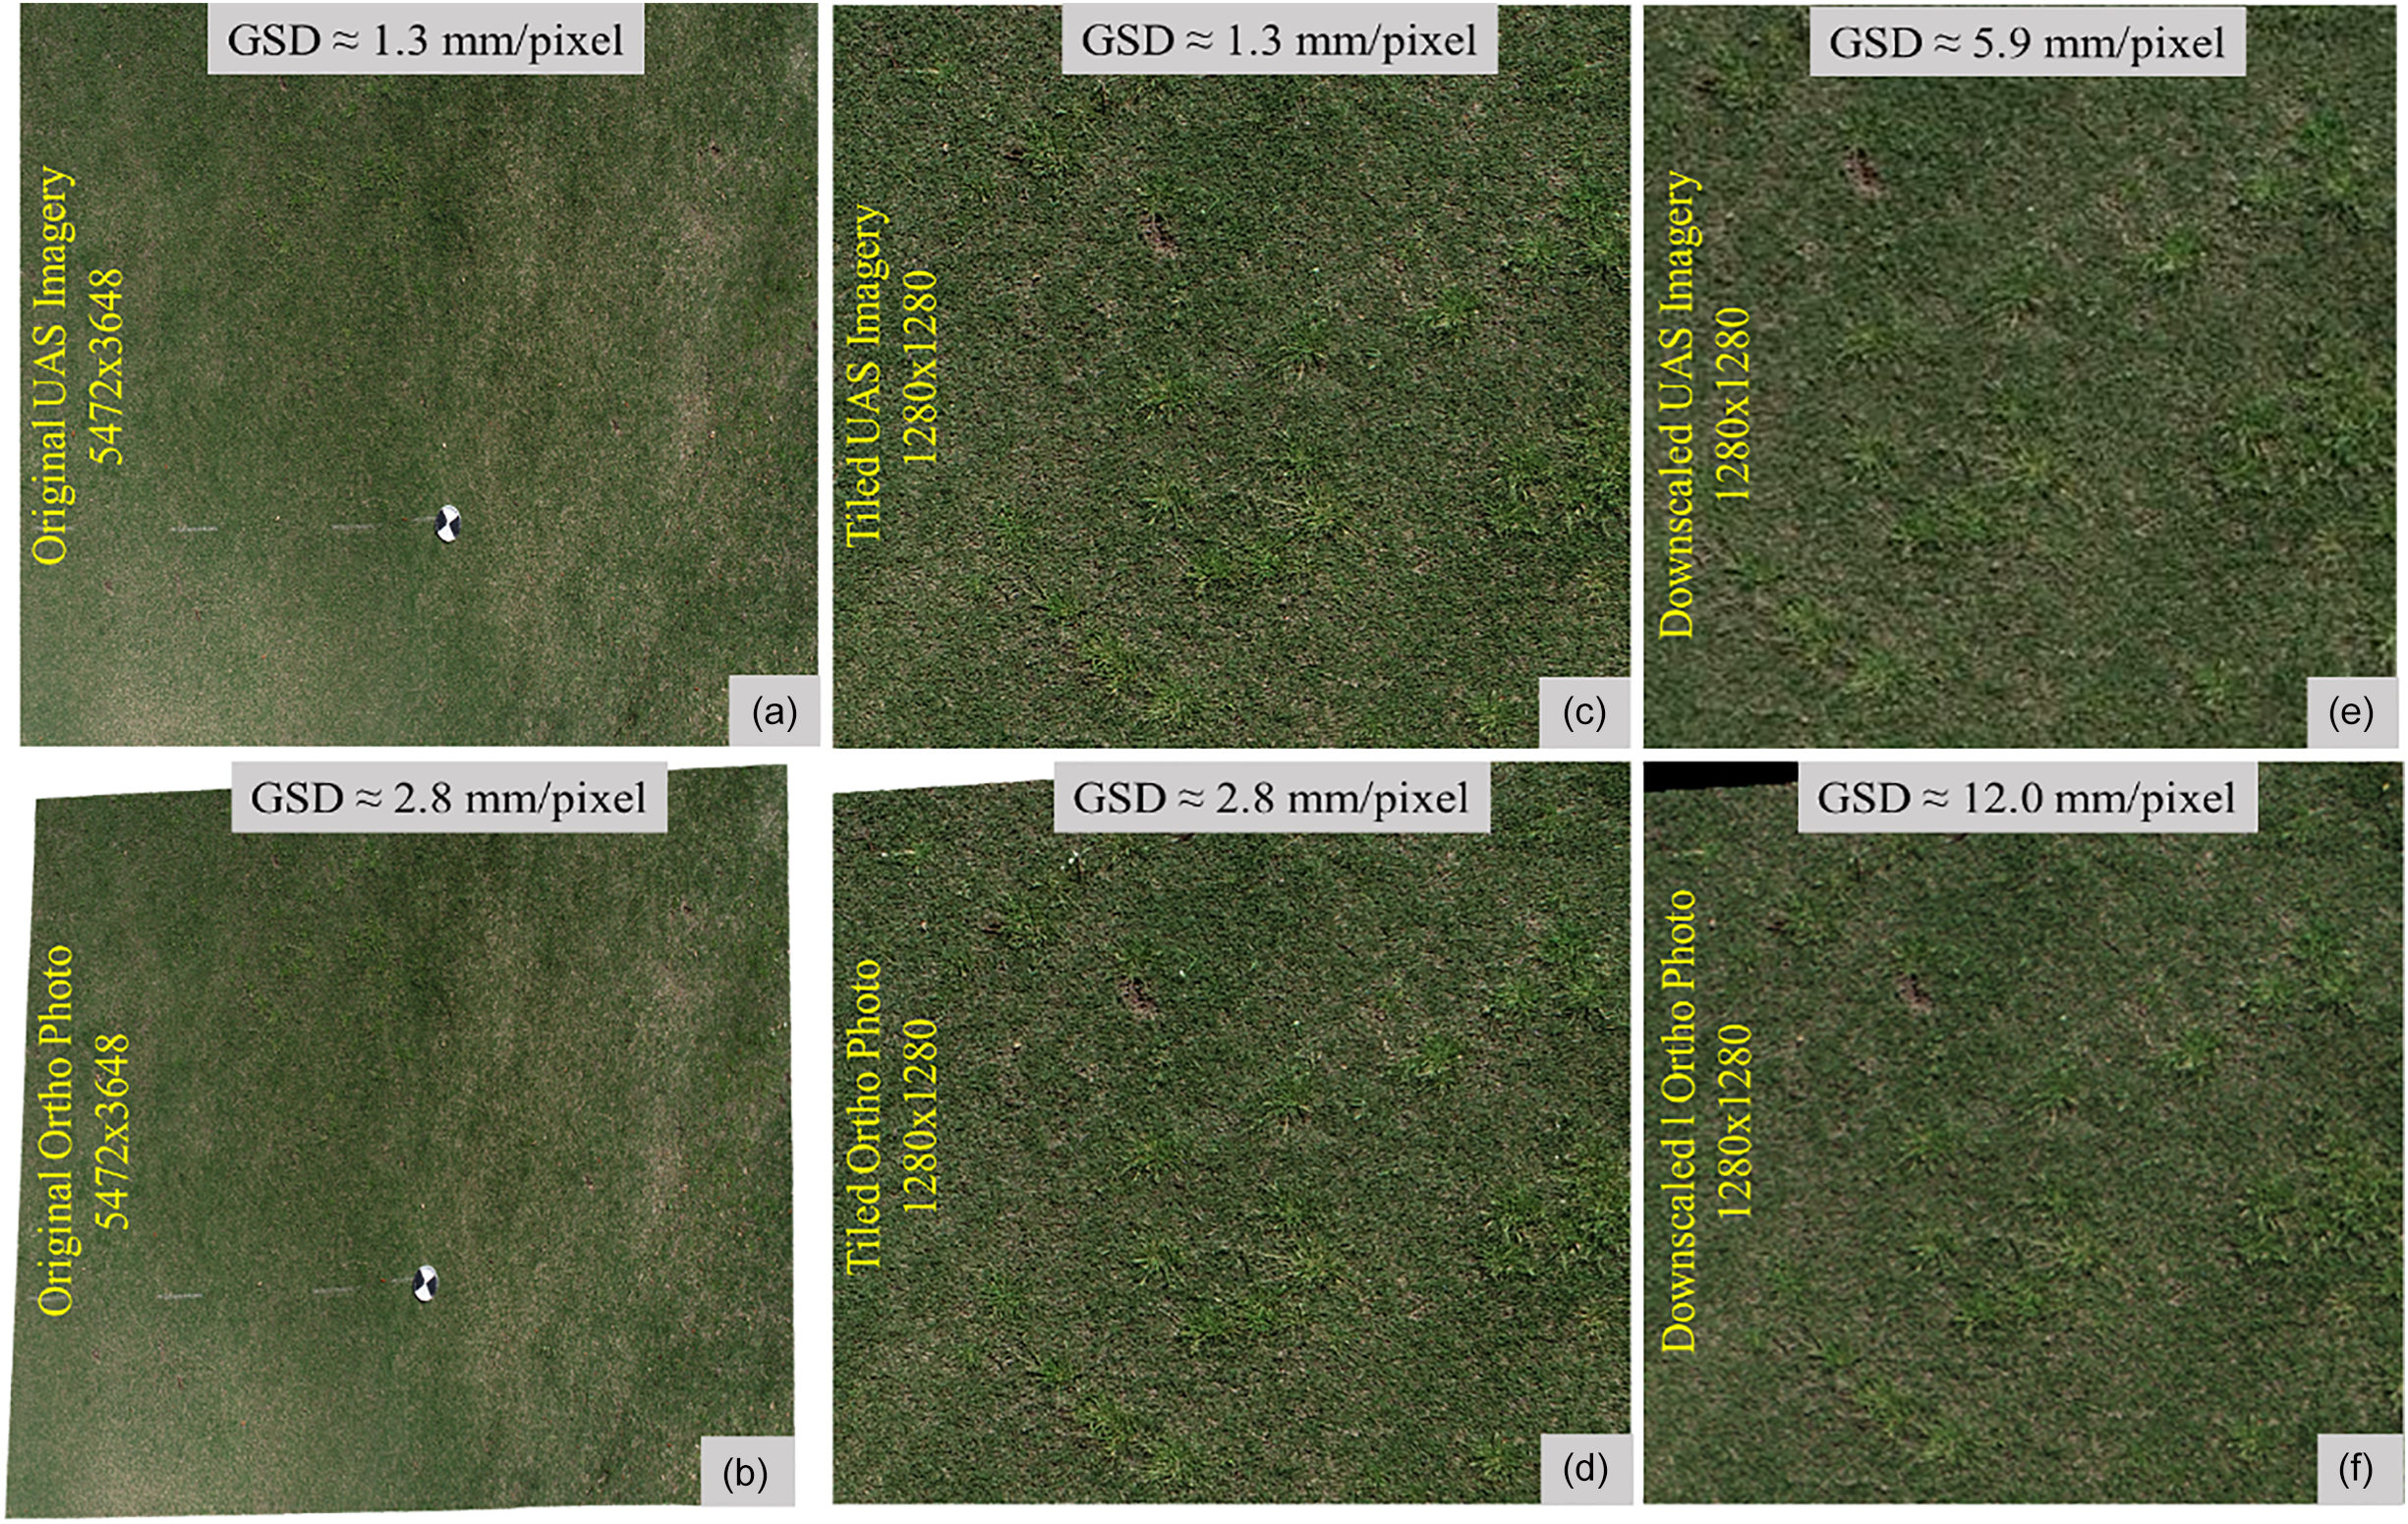
The model metrics from this research are still low, indicating room for improvement. The low spatial resolution of UAS imagery, the UAS’s broader field of view, large-scale variations in P. annua instances, and the background complexity likely contributed to the lower metric scores (Gurjar et al. Reference Gurjar, Sapkota, Torres, Ceperkovic, Kutugata, Kumar, Zhou, Martin and Bagavathiannan2025). Additionally, detecting P. annua at early growth stages and in freshly mown fields was challenging in autonomous flight mode images (Figure 7). These results are consistent with those of Zhang et al. (Reference Zhang, Maleski, Jespersen, Waltz, Rains and Schwartz2021), who reported reduced CNN model performance for weed detection in sod production fields using UAS imagery, attributing it to its lower spatial resolution. However, spatial resolution and P. annua detection at the early growth stage may be improved by splitting the images into sub-images according to the model’s preferred input size (Figure 8). This method allows for the preservation of spatial resolution during model training, thus mitigating computational resource consumption (Jiang et al. Reference Jiang, Ergu, Liu, Cai and Ma2022). Nevertheless, the primary objective was to employ original UAS-collected images for weed detection within turf systems, which led us to refrain from adopting the image-splitting approach.
Detection of Poa annua using YOLOv11n in a freshly mowed field (mowing height = 1.25 cm). Rectangular boxes indicate weeds correctly detected by the model, whereas circles denote weeds that were missed. This example illustrates the model’s limitations under freshly mowed conditions, where P. annua plants are partially camouflaged by the surrounding bermudagrass.

Figure 7 Long description
An aerial view of a grassy field. Rectangular boxes in red indicate weeds correctly detected by the model, while circles in red denote weeds that were missed. The field appears freshly mowed, with the grass height around 1.25 centimeters. The detected and missed weeds are scattered throughout the field, highlighting the model's limitations in identifying weeds under these conditions.
Example illustrating how decreasing spatial resolution reduces object detail: (A) Original unmanned aerial system (UAS) imagery; (B) original orthomosaic imagery; (C) image from A divided into 1,280 × 1,280 pixel tiles; (D) image from B divided into 1,280 × 1,280 pixel tiles; (E) the UAS imagery downscaled to 1,280 × 1,280 pixels; (F) the orthomosaic imagery downscaled to 1,280 × 1,280 pixels.

Weed Localization Accuracy Assessment
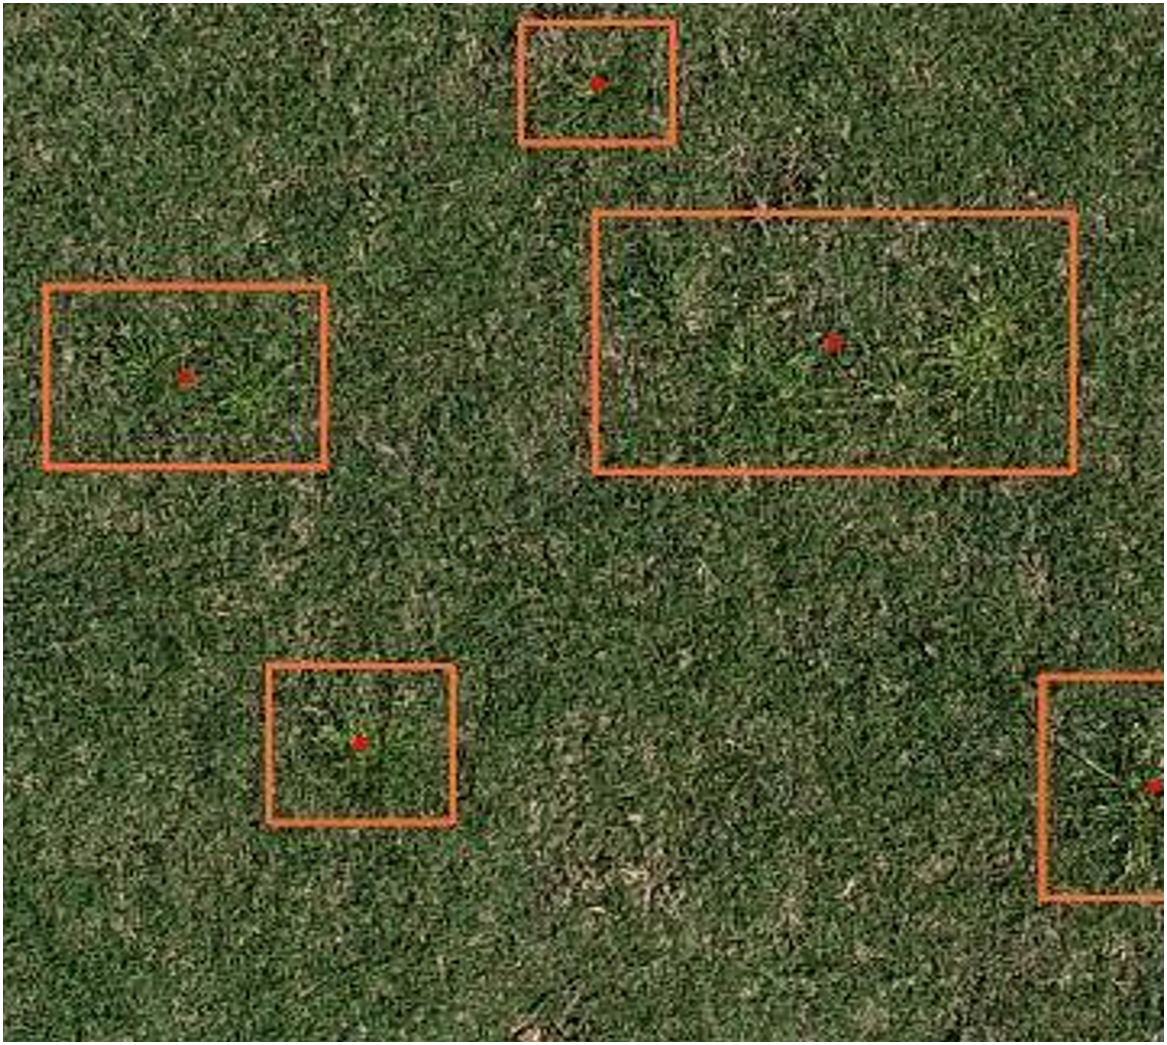
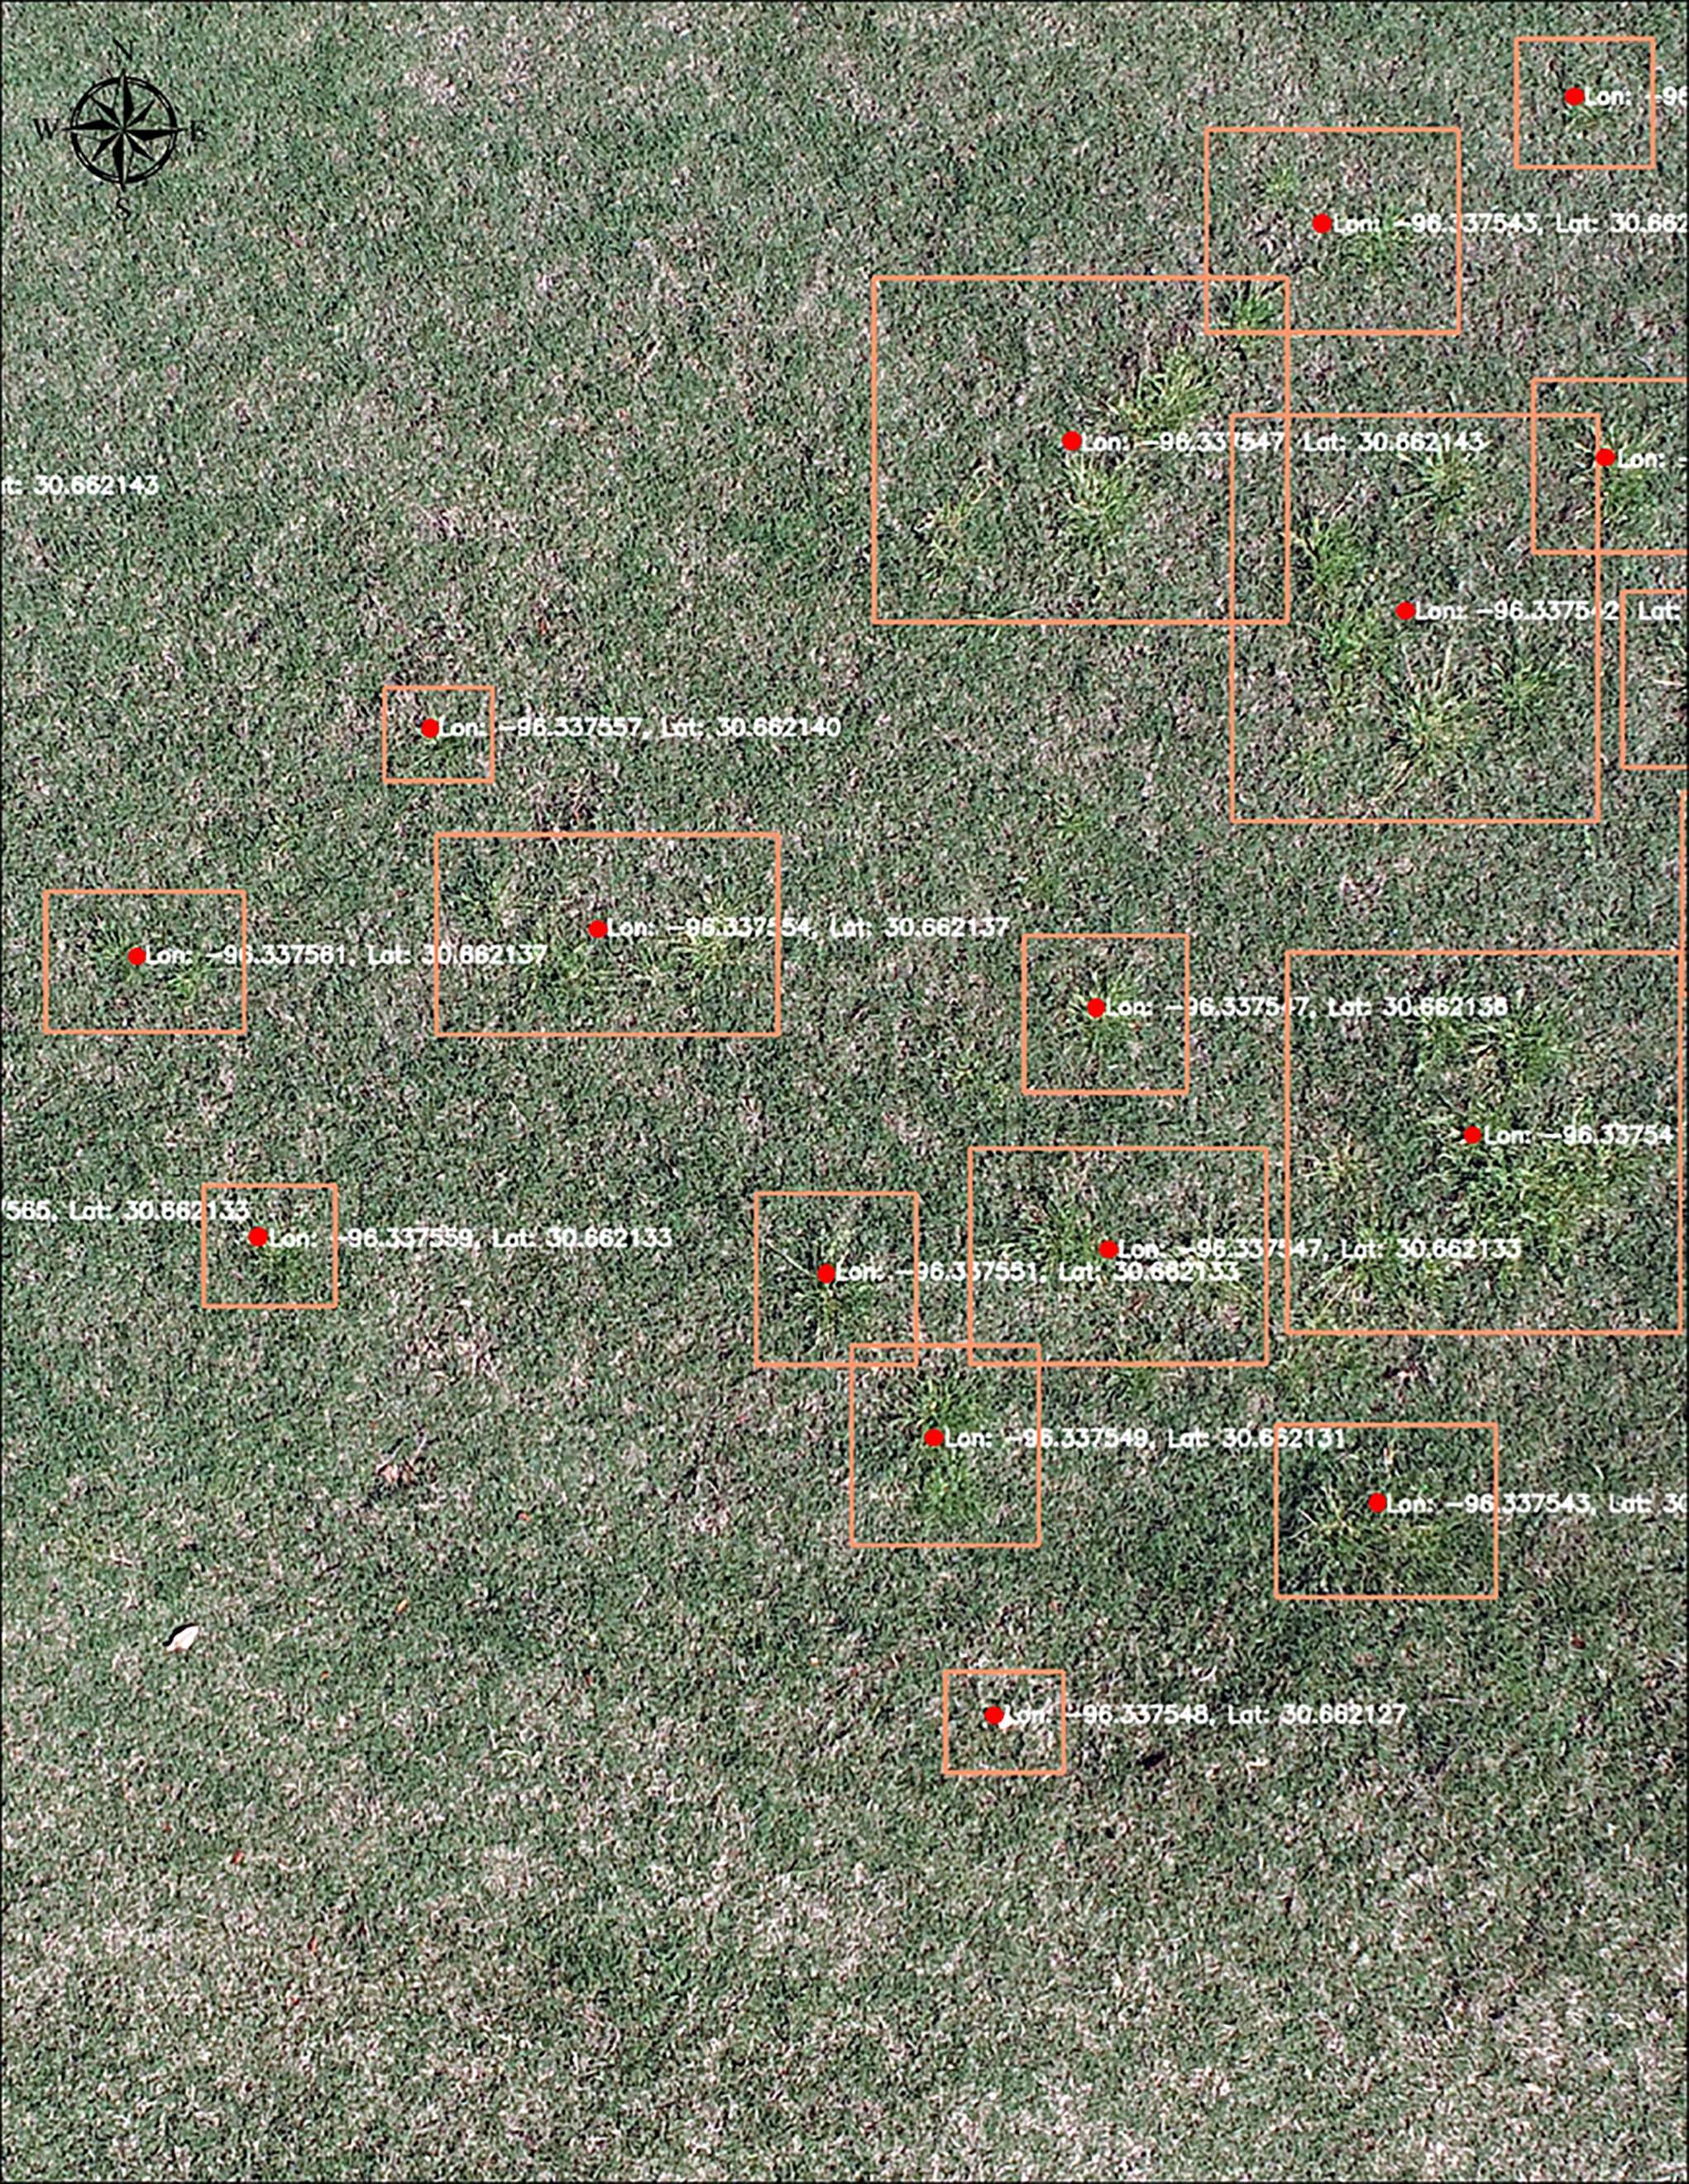
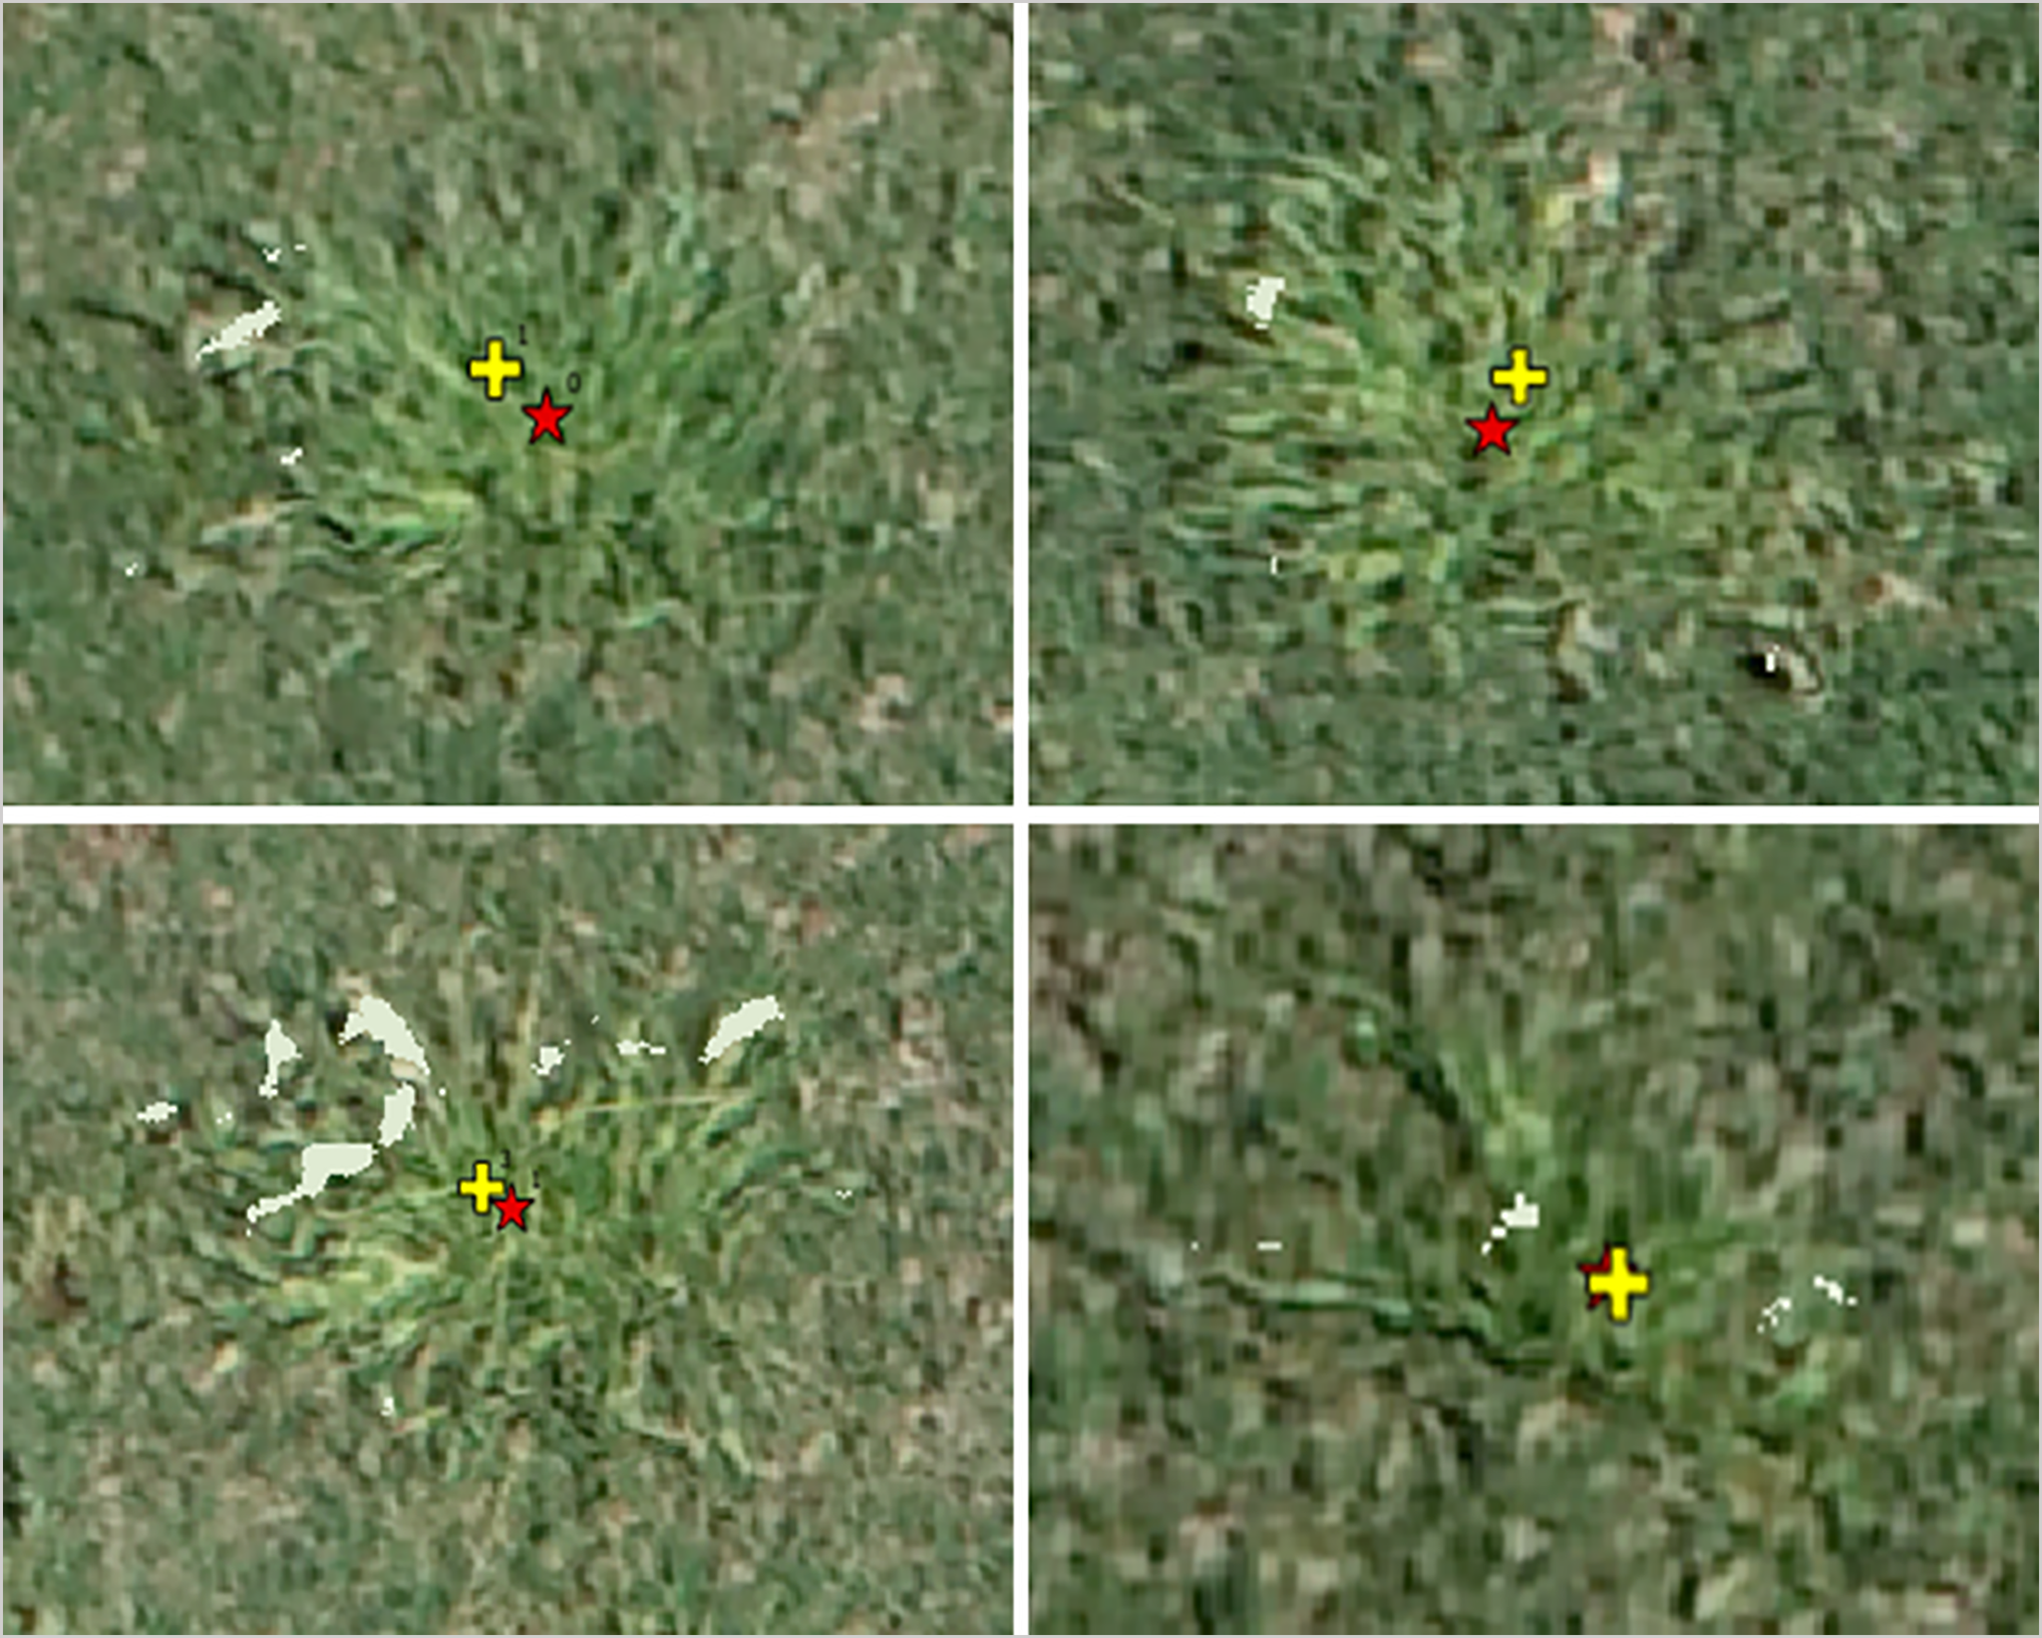
Positional error reflects the variance in estimating the center point of a weed between the model-predicted centroid and the manually marked centroid. This error is influenced by the geometry of the individual weed and the accuracy of orthophoto georeferencing (Gurjar et al. Reference Gurjar, Torres, Coleman, Straw and Bagavathiannan2026; Oh et al. Reference Oh, Chang, Ashapure, Jung, Dube, Maeda, Gonzalez and Landivar2020). For manual marking, the visually estimated center location for individual weeds was successfully pinpointed. The model-predicted weed centroid, on the other hand, was determined based on the center point of the bounding box; thus, the accuracy depends on how tightly the weed fits within the bounding box (Figure 9). The findings indicate that the RMSE between the manually marked and model-predicted coordinates was 0.4 cm (n = 119). The mean, standard deviation, and SE were 1.5 cm, 1.2 cm, and 0.1 cm, respectively (Figure 10). These results show that model-predicted coordinates have centimeter-level accuracy, which is operationally precise for herbicide treatments. In a similar study by Zhang et al. (Reference Zhang, Wang, Hu, Liu and Chen2020) focusing on weed localization in a wheat (Triticum aestivum L.) crop, the positional error ranged from 0 to 20 cm; the misalignment of pixel positions on the image plane during the transformation from image pixel coordinates to world coordinates likely caused these errors. Additionally, weed localization accuracy can be affected by the orthomosaic georeferencing accuracy. The RMSE of orthophotos was observed in the longitude and latitude directions of 0.823 cm and 0.678 cm, respectively. In this regard, Benassi et al. (Reference Benassi, Dall’Asta, Diotri, Forlani, Morra di Cella, Roncella and Santise2017) reported an RMSE of 2 to 3 cm for the orthomosaic image using eBEE-RTK.
Example of the accuracy of model-predicted Poa annua weed centroids, showing how tightly the weed(s) fit within the bounding box. The YOLO11n model was used to detect weeds in an orthophoto, with the original image captured using an unmanned aerial system at 5-m altitude in the autonomous flight mode.

Figure 9 Long description
A map displaying the accuracy of model-predicted Poa annua weed centroids. The map shows how tightly the weeds fit within the bounding boxes. The YOLO11n model was used to detect weeds in an orthophoto, with the original image captured using an unmanned aerial system at 5-m altitude in the autonomous flight mode. The map includes various bounding boxes with coordinates marking the detected weed centroids. The bounding boxes are outlined in orange, and the centroids are marked with red dots. The map provides a detailed view of the detected weeds within a grassy area.
Examples of displacement of the custom trained model-predicted Poa annua weed centroid (plus sign) from the manually marked weed center point (star sign). To visualize the difference between them, these weed centroids are overlaid on the orthophoto.

Optimization of Path Length for Spot Spraying
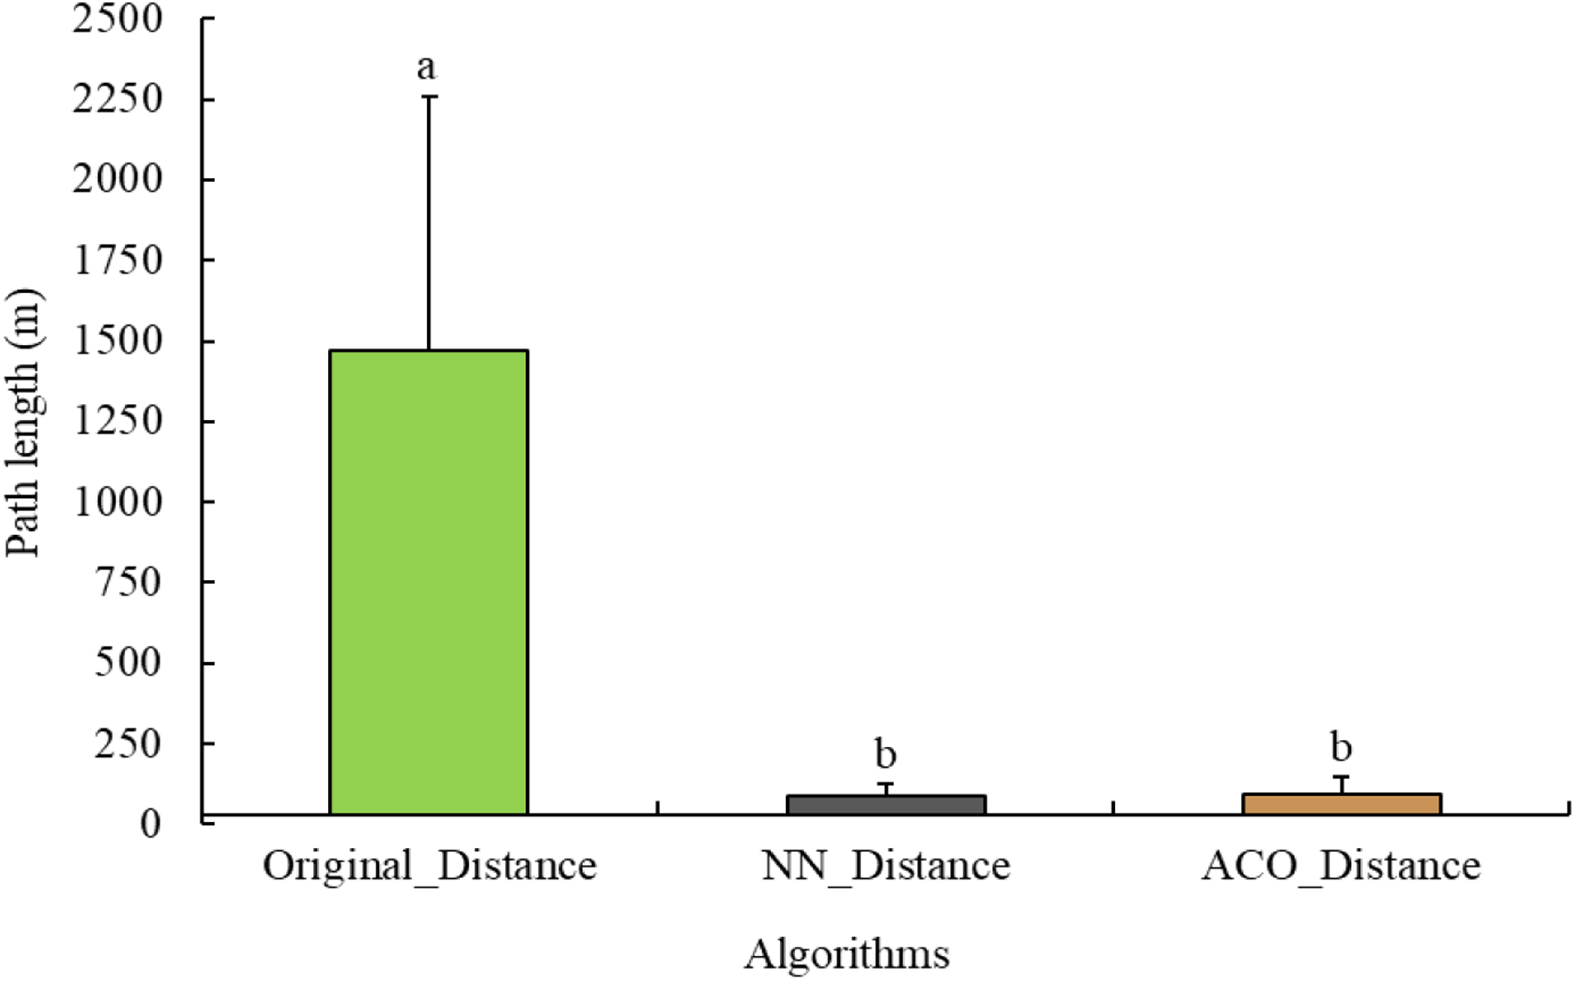
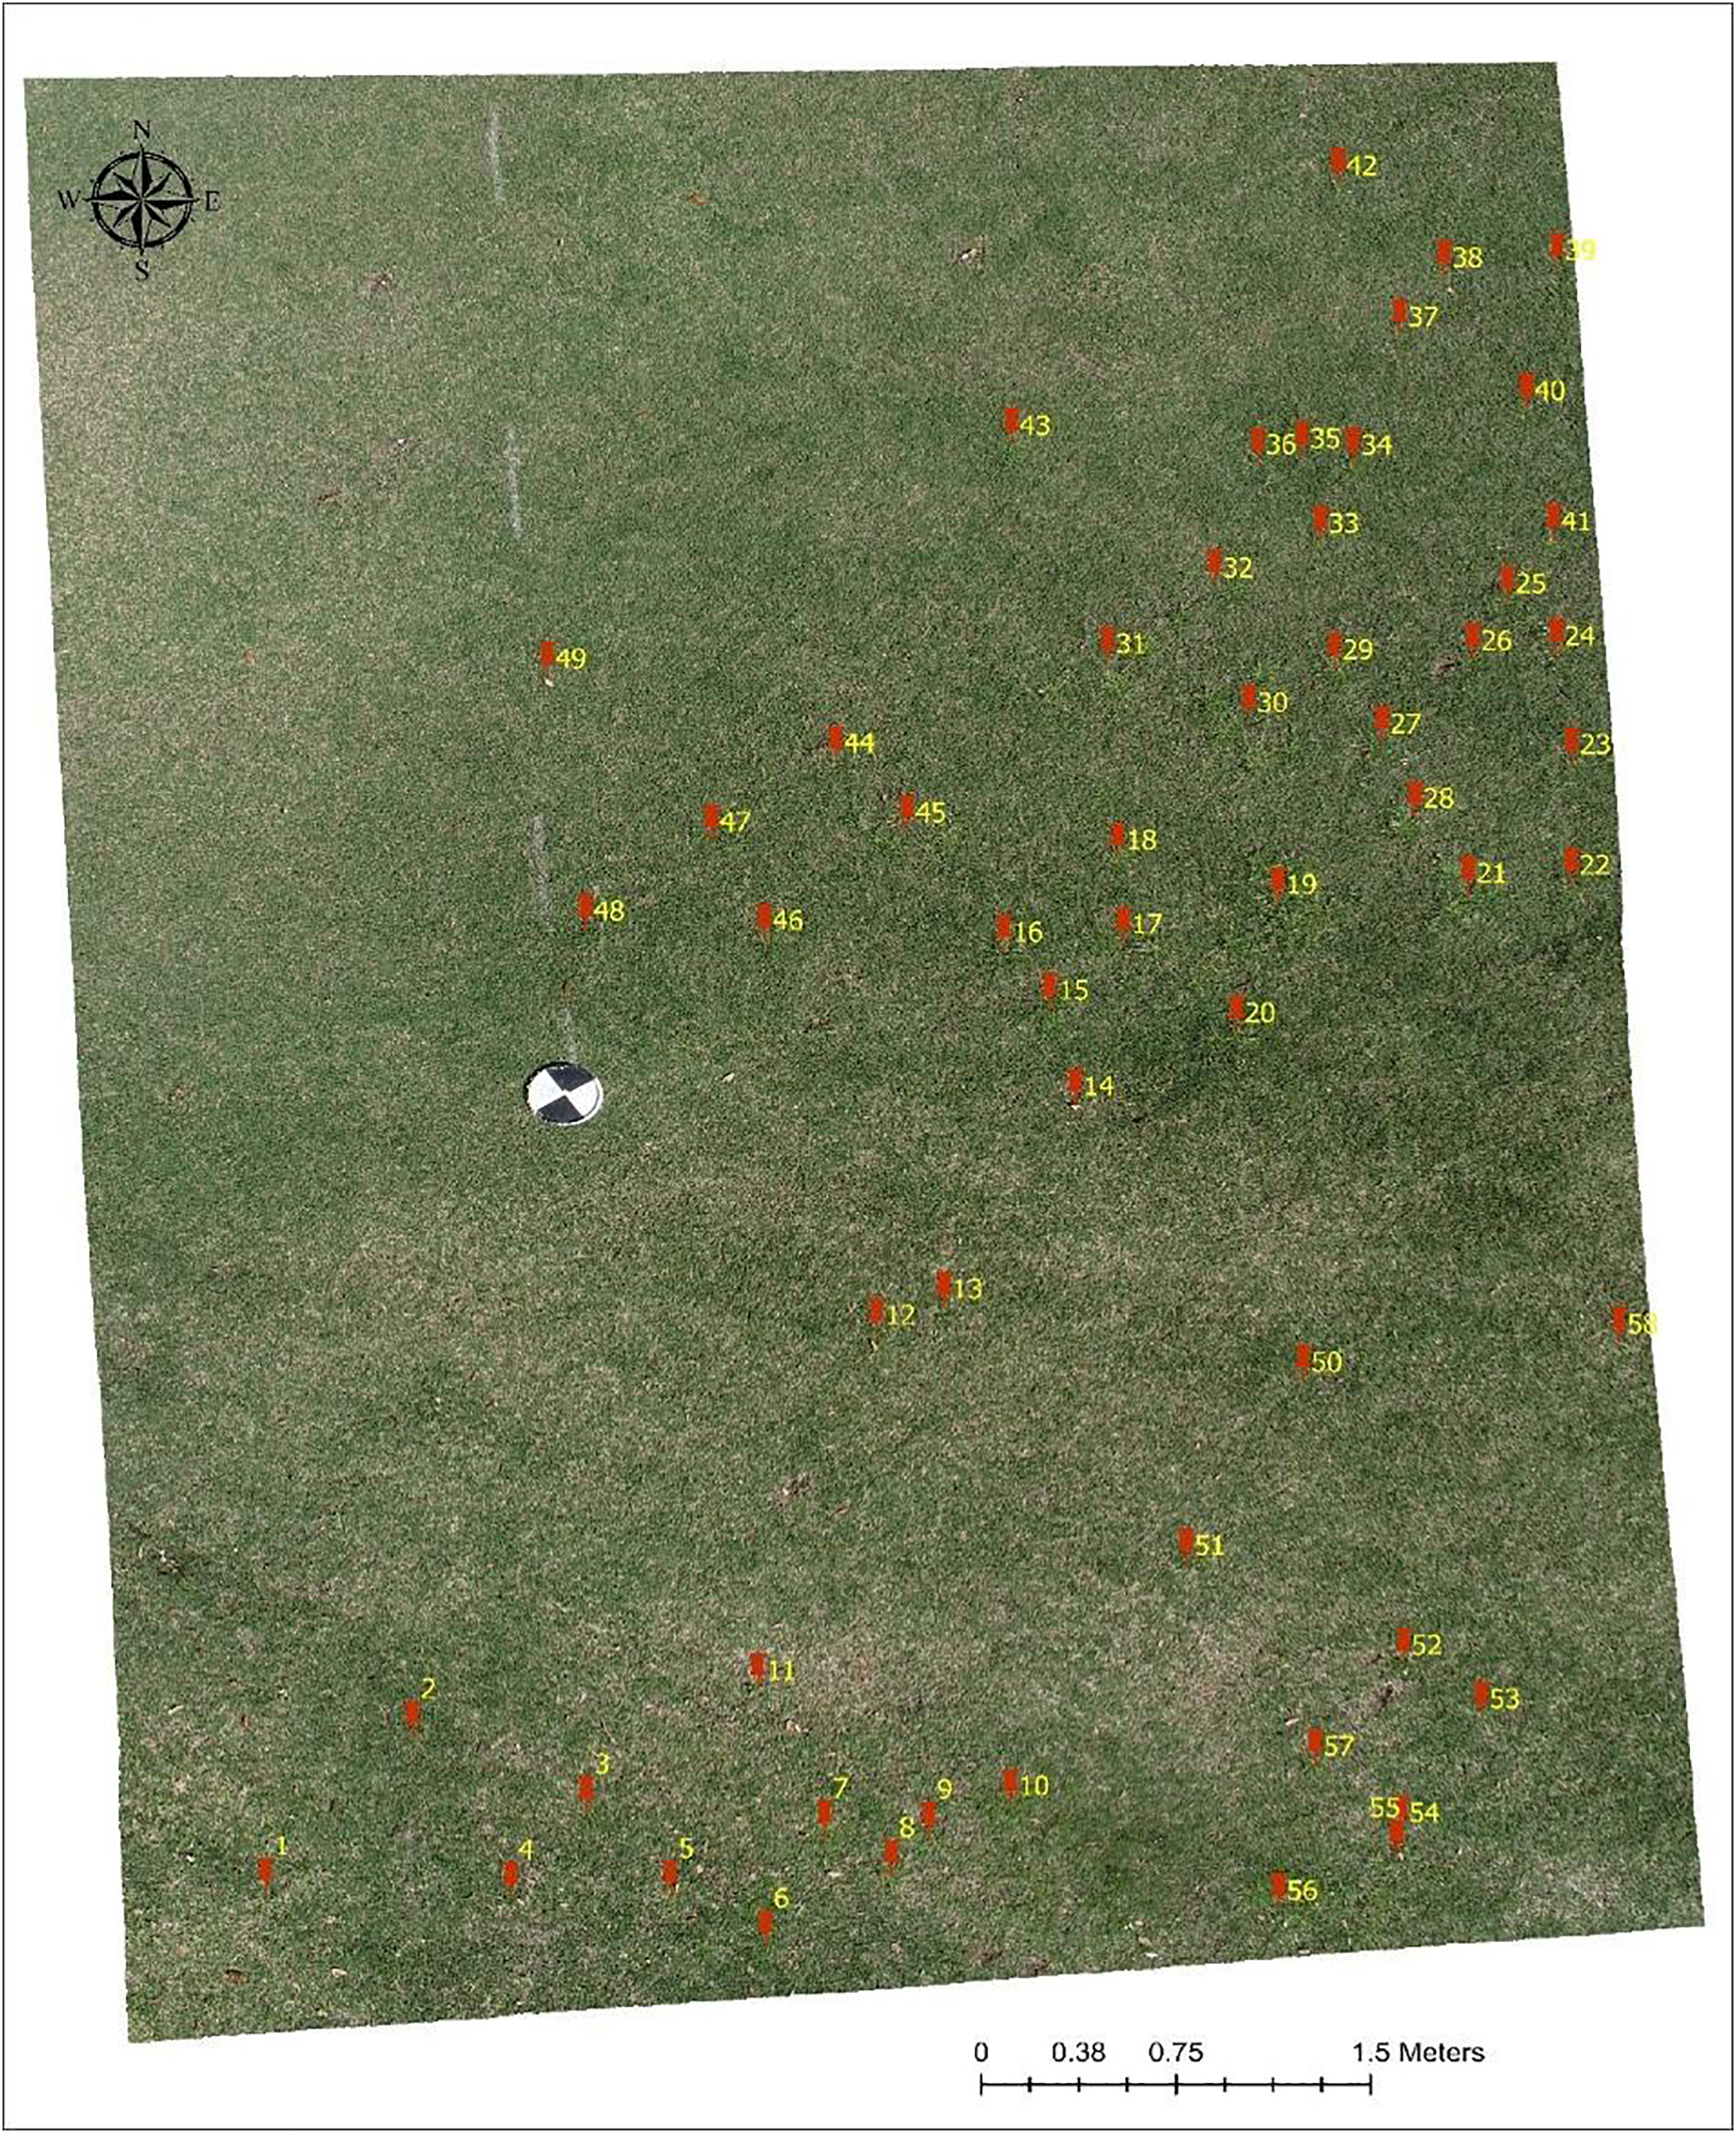
The NN and ACO algorithms provided a significant reduction in path length for spot spraying, reducing the path length by 37.7% and 36.7%, respectively, compared with the original distance (P = 0.0053) (Figure 11). Although the NN algorithm performed better than the ACO algorithm, the difference between them was not statistically significant (P = 0.999). These reductions in path length significantly enhance the effectiveness of UAS and robots, allowing them to autonomously execute tasks in a highly efficient manner (Alamgir and Von Luxburg Reference Alamgir and Von Luxburg2012). Additionally, the improved path efficiency translates to better battery performance, enabling UAS and robots to cover larger areas with the same battery capacity (Figure 12). The NN algorithm prioritizes the shortest distance to the next available neighboring points; it may not always yield the most optimal route from the starting point to the endpoint, but it yields a shorter route. Moreover, the NN algorithm does not always mimic human intuition in finding optimal paths (Wiener et al. Reference Wiener, Ehbauer and Mallot2007), but it exhibits promise in finding the shortest path length.
Path length compression among the three algorithms used: original coordinates, nearest neighbor (NN) algorithm, and ant colony optimization (ACO) algorithm. The whiskers represent the standard errors of the mean. Bars topped by different letters indicate significant differences based on Tukey’s honestly significant difference (HSD) test (α = 0.05).

Example of a path planning algorithm (PPA) (nearest neighbor [NN]) arranging weed coordinates based on the shortest distance to unvisited weeds. To visualize the coordinate arrangement, an orthophoto was used, with the coordinates overlaid on it.

This study represents a pioneering effort to explore the use of UAS imagery for detecting and localizing P. annua within bermudagrass turf systems. Despite a complex dataset with variable growth stages of P. annua and varying turfgrass conditions, the results demonstrate the potential of utilizing UAS imagery and ML models for weed detection in these systems. However, the weed recognition model exhibited suboptimal performance due to the intricate nature of the dataset, characterized by instances of spectral/textural similarity, as well as limitations in the model’s architecture, such as the need to downscale UAS images during model training. This downscaling likely led to the omission of small P. annua plants due to lower spatial resolution. Even with different model architectures (e.g., YOLO and RT-DETR), the models struggled to detect smaller weeds effectively. If UAS imagery is to be employed for weed detection in turfgrass systems, our findings strongly advocate either modifying the model architecture or splitting the original images into sub-images to preserve the spatial resolution of UAS imagery. Additionally, the GeoTransform function effectively transformed image coordinates into a world coordinate system with centimeter-level accuracy (mean = 1.5 cm); however, transformation accuracy depends on the accuracy of the orthophoto georeferencing. Moreover, the NN PPA arranges the weed coordinates based on the shortest distance from the nearest neighbor’s point, enabling operators to autonomously execute tasks in a highly time-efficient manner. The developed model has the potential to be used for site-specific herbicide applications in turf to manage individual P. annua plants using UAS, ground robots, or global navigation satellite system-guided boom sprayers. However, future efforts should focus on enhancing model performance by altering the model architecture and evaluating its robustness across different weed growth stages and various turf species backgrounds. Future research should also focus on developing methods for weed detection in turf when multiple weeds occur together and create occlusion.
Data availability
The dataset and model will be available publicly through the International Weed Recognition Consortium Website (https://www.weedrecognition.org/) upon publication.
Acknowledgments
BG acknowledges a graduate fellowship from the Nethaji-Subhash International Fellowship Program of the Indian Government.
Funding
This work was funded in part by PBI-Gordon Corporation.
Competing interests
The authors declare that no competing interests exist.


 Open access

