It is known that knee osteoarthritis is an extremely common cause of severe pain and disability in the community (15). There is evidence showing the effectiveness of both home-based and class-based exercise programs (10;14;15) in the treatment of knee osteoarthritis. There is some evidence that general practitioner (GP)-based patient education programs are not cost-effective (7) in treating patients with osteoarthritis. However, it is not known whether supplementing a home-based program with an additional class-based program is effective and/or cost-effective.
The following economic evaluation estimates the cost-effectiveness of an additional class-based exercise program on top of an existing home-based program. This cost-effectiveness analysis was undertaken in conjunction with the randomized controlled trial reported elsewhere (8). Costs were estimated from the perspective of the National Health Service (NHS) and effects were assessed in terms of health gain expressed as quality-adjusted life years (QALY).
METHODS
Sources of Data
Resource Use
The data on resource use for the economic analysis were obtained by from patients' medical records and patient questionnaires administered at baseline, 1 month, 6 months, and 12 months. The questionnaires were collected during attendance at outpatient appointments.
The cost of the intervention being evaluated in the trial was estimated from resource use data from the clinical trial applied to national pay scale figures (9). The resource use associated with giving the class-based intervention was estimated using average class size and duration. As both groups received input from senior 1 physiotherapists, the additional cost of providing the class-based program is the relevant cost for the economic analysis. These costs include the capital and overhead costs associated with the additional physiotherapist time.
Unit Costs
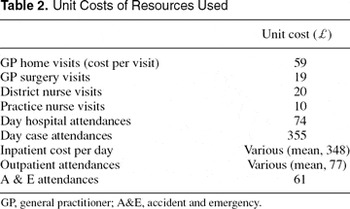
The unit cost data were obtained from several sources. The inpatient cost per day and outpatient cost per visit for attendances were both based on national estimates (2). Estimates were inflated to a 1999/2000 price base using the Health Service Cost index.
The cost of a GP visit was derived from published estimates (9). The unit cost estimate includes cost of training as well as direct care support staff and is inflated to a 1999/2000 price base.
Health States and Their Value
The EuroQol 5D (EQ-5D) instrument was used to measure patient health states and to ascribe values to those states (5). The EQ-5D questionnaire was given to patients (face to face) at baseline and at 1-month, 6-month, and 12-month follow-up. This instrument measures patient health status across five dimensions (mobility, self-care, usual activities, pain/discomfort, and anxiety/depression). Three possible responses (no problems, moderate problems, or severe problems) are given by the patient for each of this dimensions reflecting the patient's perception of their health state.
EQ-5D scores at baseline and follow-up were converted to a “utility” score based on a “tariff” derived from interviews with 3,395 members of the UK public (4). The two trial groups were compared in terms of QALYs over the 12-month period. This was achieved by plotting the EQ-5D utility at baseline and at each intermediate point and calculating the area under the curve to estimate QALYs gained (or lost) for each patient.
Methods of Analysis
Missing Data and Imputation
There is no formal test to verify the assumption that data are missing at random (MAR), and this assumption is often chosen as a starting point when data are missing (11). If there is concern that data are not MAR, it is possible in principle to run the multiple imputation procedure using a model that reflects hypothesized differences between individuals with complete data and individuals with incomplete observations. The results obtained from the two models under the MAR and not-MAR assumption can then be compared to obtain a measure of the sensitivity of the inference to the missing data process. In practice, to model a not-MAR process is not a trivial task, and it has been demonstrated that exploring the assumption of MAR relies on strong assumptions that are not themselves testable (3). Therefore, for this analysis, it was assumed that data were MAR.
Missing data were imputed using SOLAS (Statistical Solutions, Ltd.) using the Propensity score method (a nonparametric approach). Multiple imputation generates multiple data sets, each with different imputed values for missing values. This approach gives a reflection of the uncertainty surrounding the imputed value. Values were imputed for each of the dimensions of the EQ-5D (rather than total score) and for each missing item of resource use (rather than total cost).
Incremental Cost-Effectiveness Ratios and Net Monetary Benefits
Traditionally, cost-effectiveness analysis has involved the calculation of incremental cost-effectiveness ratios (ICERs), where mean differences in costs and effects under the treatment and control arms were presented with 95 percent confidence intervals. The ICER is calculated from the mean difference in cost and effect between the two treatment options. Algebraically, the ICER is represented as:

Where C0 and C1 are sample mean costs and E0 and E1 are sample mean effects for the two treatment groups (0 and 1) under consideration. The ICER statistics are calculated in this analysis and can be used to place study results in one of four quadrants of the cost-effectiveness plane; when comparing treatment A with treatment B, treatment A can be any of the following: more costly and more effective, more costly and less effective, less costly and more effective, or less costly and less effective. The position on the plane indicates the direction of the differential costs and effects of the alternative treatment options considered. However, interpretation of ICER statistics that cover more than one quadrant of the cost-effectiveness plane is troublesome (i.e., where there is uncertainty), and recent studies have advocated the net benefit approach to cost-effectiveness analysis (12;13) This approach can be performed for this study quite simply. From the five data sets generated through multiple imputation, the Net Monetary Benefit (NMB) was calculated for each group. For specific levels of a decision maker's maximum willingness to pay for a QALY, NMB of a strategy can be estimated using the following equation:

For instance, if treatment A has a mean cost of £100,000 and generates a mean of 5 QALYs, and a QALY is valued at £30,000, then the NMB associated with treatment A is £50,000 ((5×£30,000)−£100,000).
It is also possible to express NMB at the patient level by multiplying each patient's QALY score by the decision-maker's assumed maximum value and subtracting that patient's costs. The patient-level NMB is used in the derivation of the cost-effectiveness acceptability curves (CEACs), described below.
Clearly, the NMB is dependent on the value that is placed on the QALY, but results of the analyses can indicate how sensitive the results are to changes in this value. The uncertainty surrounding the NMB statistic can be used to identify the probability that a strategy is cost-effective using the CEAC (6). The CEAC is a graphic representation of the probability of an intervention being cost-effective over a range of monetary values for a decision maker's willingness to pay for an additional unit of health gain. The probability of an intervention being cost-effective will differ according to the valuation the decision maker places on a QALY. For this analysis, the values zero, £1,000, £10,000, £20,000, £30,000, £50,000, and £100,000 were used as a range of the decision maker's willingness to pay for a health gain of 1 QALY. The value zero is equivalent to a comparison of the groups in terms of total costs, as outcomes are effectively not considered (valued at zero).
Sensitivity Analysis
Although the form of stochastic analysis performed above addresses a large amount of uncertainty in the analysis, it is still appropriate to perform sensitivity to allow for variability and methodological uncertainty. In this instance, missing data were an issue, and to assess the impact of imputation on the results, sensitivity analysis was performed using data from individuals with complete data (complete case analysis)
RESULTS
Resource Use
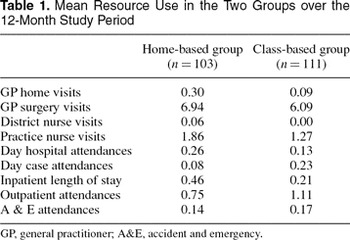
Mean levels of resource use are presented Table 1. These data include missing data values estimated using the multiple imputation method. For the majority of resource use variables above, the class-based program resulted in a reduction in resource use, which ultimately results in a difference in total cost between the two groups.

Unit Costs
Unit cost estimates used in the analysis can be found in Table 2. The sources for these estimates are detailed in the methods section.

Health Status
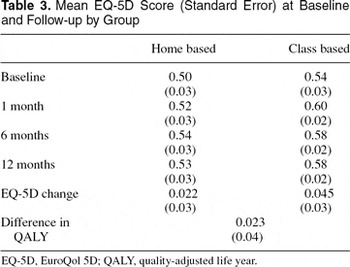
Table 3 presents the EQ-5D scores for each group at baseline and follow-up. The intervention group performed slightly better than the control group over the full period of the trial, although much of this gain was in the first month after the intervention commenced. However, scores in the treatment group were maintained (on average) throughout the trial follow-up. These results are reflected in the QALY scores described below.

QALYs
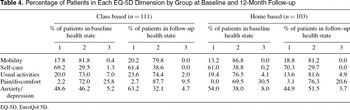
As with the resource use data, mean change in the number of QALYs is presented in Table 3. Both groups are slightly better off in that they report an increase in EQ-5D scores over the 12-month period. These differences are very small and do not approach conventional levels of statistical significance but indicate that the class-based group perform slightly better in that the gain in QALYs is greater in this group compared with the home-based group. Table 4 presents the baseline and follow-up EQ-5D scores for each of the two groups (on which the QALY scores are based). From the data presented in this table, it would appear that the improvement in the intervention group is due to small improvements in their mobility together with relatively large increases in the anxiety/depression levels.

Total Cost
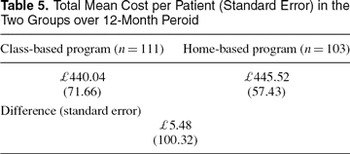
The difference in the mean total cost per patient in the two groups is presented below in Table 5. Again, the results do not approach conventional levels of statistical significance, but indicate that the supplementary class-based group is associated with a very slightly lower cost.

ICER
In this instance, the class group is associated with a slightly better QALY profile and a slightly lower cost. Specifically, the class group has a 0.023 QALY gain compared with the home-based group and a reduced cost of around £5 per patient. In this instance, there is a dominant case in favor of the class-based group, as it is both less expensive and results in improved patient outcomes. Calculation of the ICER in this instance is inappropriate.
However, there is a large degree of uncertainty around these results, and neither the improved patient outcomes nor the reduction in costs would approach traditional levels of statistical significance. Therefore, to deal adequately with uncertainty, the NMB approach was used and CEACs were generated. The results of these analyses are presented below.
NMBs and CEACs
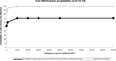
Clearly, the value of net monetary benefit is dependent on the value of a decision maker's willingness to pay (λ) for an additional QALY. The probability of an intervention being cost-effective will also depend on this value. Figure 1 shows the CEAC curve, where λ is varied between zero (where gains in QALYs are not valued at all) and £100,000. In the base case analysis, represented by the lower of the two lines, it can be seen that a zero value of λ gives a probability of the class-based program being cost-effective of just over 50 percent. In effect, this is saying that there is a probability of only just over 50 percent that the class group was cost-saving, as we have placed no value on QALY gains. However, the probability of the class being cost-effective increases as the value placed on λ increases (as the class is associated with an improved QALY profile). At λ=£30,000, an estimate frequently stated to be the borderline value for the NHS, the class-based program has a probability of over 70 percent of being cost-effective. Indeed, for all plausible values of λ, in the base case analysis, the class group is more likely to be cost-effective than the home-based group.

The cost-effectiveness acceptability curve for the two interventions. OA, osteoarthritis; QALY, quality-adjusted life year.
Sensitivity Analysis
Missing data could have an impact on the results. The majority of patients had some data missing, and a complete case analysis was performed to confirm or refute the results of the base case analysis on the imputed data.
Complete Case Analysis
This analysis is based on the sample of patients with complete cost and outcome data, n=74, with thirty patients in the home-based group and forty-four in the intervention group. At least some cost data were missing for ninety individuals, with at least some outcome data missing for eighty-three individuals. The point estimates in this instance show similar results to the imputed. The results of this analysis have been transformed into an NMB framework and appear in Figure 1. These results show the class-based group to have a higher probability of being cost-effective than the analysis using imputed data but would not alter the decision at any value of λ. The reduction in cost in this analysis was only marginally in favor of the intervention, and this analysis also demonstrated a more favorable QALY change of 0.12 compared with the control group.
CONCLUSION
There is little evidence in the published literature of the cost-effectiveness of patient exercise programs in the treatment of osteoarthritis. A full economic evaluation (7) of a primary-care–based education program for patients with osteoarthritis concluded that GP-based patient education programs were not cost-effective. However, the authors used a cost-minimization analysis as there were no significant differences between groups in the WOMAC score. This type of analysis has been criticized (1) as inappropriate when the trial was not designed to show equivalence. In addition, utility values were not assessed for the groups.
The analysis above shows that, for most reasonable values of a decision maker's willingness to pay for an additional QALY, the class-based program is likely to be cost-effective. This finding is due to both a small reduction in the costs and a slight improvement in the QALY score in the class-based group when compared with the home-based group. This outcome is achieved by a reduction in primary care contacts in the class-based group and little difference in hospital-based attendances. Based on the evidence from this trial, the provision of an additional class-based exercise program to supplement a home-based exercise program should be considered for patients with osteoarthritis of the knee.
CONTACT INFORMATION
Gerry Richardson, MSc (gar2@york.ac.uk), Research Fellow, Neil Hawkins, PhD (nsh2@york.ac.uk), Research Fellow, Centre for Health Economics, University of York, Heslington, York YO10 5DD, UK
Christopher James McCarthy, PhD (Christopher.j.mccarthy@manchester.ac.uk), Research Physiotherapist, Pauline Mary Mills, MSc (p.mills@mmu.ac.uk), Senior Lecturer, Department of Physiotherapy, Rachel Pullen, MCSP (rachel.pullen@man.ac.uk), Physiotherapist, Christopher Roberts, PhD (Chris.Roberts@manchester.ac.uk), Senior Lecturer in Medical Statistics, School of Medicine, Alan Silman, MD (Alan.Silman@manchester.ac.uk), Professor of Rheumatic Disease Epidemiology, School of Medicine, Jacqueline Ann Oldham, PhD (Jackie.oldham@manchester.ac.uk), Centre Director, Centre for Rehabilitation Science, University of Manchester, Oxford Road, Manchester M13 9PL, UK
This project was funded by the National Health Service (NHS) Health Technology Assessment Agency. The views and opinions expressed in this report do not necessarily reflect those of the NHS Executive.