Introduction
Various insects, but particularly larvae of certain Lepidoptera and Coleoptera, bore into the wood or feed on the cambial tissues of broad-leaved trees. The majority of these species are considered secondary pests, capable only of colonising trees weakened by other factors or trees which are already in decline. However, under certain conditions, some species appear able to attack and kill otherwise healthy trees. The conditions that allow these species to act as primary pests are not always clear; and, as a result, the true pest status of the insects, and the appropriate management response, can be difficult to ascertain.
One such species is the hornet clearwing moth, Sesia apiformis (Clerck) (Lepidoptera, Sesiidae), whose larvae feed beneath the bark at the base of the main stem, or below the bark of the main roots, of poplar trees and occasionally other broad-leaved tree species. The larvae are relatively large (15–25 mm) and live for 2–3 years, and they can cause considerable damage to the cambial layers and outer wood (Chrystal, Reference Chrystal1937; Vuola & Korpela, Reference Vuola and Korpela1976; Schwenke, Reference Schwenke1978). S. apiformis is widely distributed in southern parts of the UK and occurs throughout Europe and can be locally abundant (Vuola & Korpela, Reference Vuola and Korpela1976; Schwenke, Reference Schwenke1978; Heath & Emmet, Reference Heath and Emmet1985). However, compared with the UK where S. apiformis has generally been considered to be a secondary pest inhabiting large, old poplars, or trees stressed by other factors (Chrystal, Reference Chrystal1937; Speight, Reference Speight1986; Jobling, Reference Jobling1990), in central and eastern Europe and in parts of Russia, S. apiformis has been reported to be a much more serious pest, at times directly responsible for extensive poplar mortality (Šrot, Reference Šrot1963; Schnaiderowa, Reference Schnaiderowa1974; Kolomoets et al., Reference Kolomoets, Sinel-Nikova, Kovalenko and Danilkina1978; Schwenke, Reference Schwenke1978).
Support for the hypothesis that S. apiformis is mainly a secondary agent in tree decline was provided by a survey of poplar trees carried out in eastern England in 1999 (Arundell & Straw, Reference Arundell and Straw2001). During the late 1990s, many poplar trees in central parts of eastern England showed a rapid deterioration in condition culminating in crown dieback and, in some cases, tree death (Arundell & Straw, Reference Arundell and Straw2001). Many of the affected trees were also heavily infested with S. apiformis, and there was some thought at the time that the moth might have been responsible for the decline in tree health. However, although there was a correlation between crown dieback and moth infestation, up to 20% of poplars with crown dieback showed no signs of infestation, indicating that dieback could develop without moth attack. Furthermore, at several sites where S. apiformis had colonised recently, trees were already showing 40–50% crown dieback, i.e. the moth was colonising trees that were already in poor condition (Arundell & Straw, Reference Arundell and Straw2001).
The main factor responsible for the development of dieback in the poplar trees in east England appeared to be two successive periods of low rainfall during spring and early summer in 1995 and 1996, which were probably exacerbated by fluctuations in the water table associated with clay and gravel workings and related drainage operations in the core of the worst affected area (Arundell & Straw, Reference Arundell and Straw2001). The available evidence pointed to an impact of water shortage early in the growing season on poplar condition, which was followed by an increase in S. apiformis populations. However, questions remain as to whether S. apiformis could have a longer-term influence on tree health. If conditions allow the moth to establish, is it then inevitable that the presence of larvae will lead to a deterioration in tree condition and, eventually, to tree death? Alternatively, if growing conditions improve, can poplars recover despite infestation and damage to the stem? To answer these questions, all of the poplar trees included in the original survey in 1999 were re-assessed using the same methods in 2001, 2003 and 2005. These repeat surveys showed that most poplars can recover quite rapidly from crown dieback when growing conditions are favourable, even with active S. apiformis infestations in the stem.
Methods
Poplar survey in 1999
A total of 801 poplar trees were assessed in the original survey in 1999, the majority of which (601) were black poplar hybrids, P.×euramericana (Dode) Guinier (P. deltoides Marsh×P. nigra L.) (=P.×canadensis Mönch). These were the most widely planted poplars and consisted of a number of varieties, including ‘Robusta’, ‘Serotina’ and ‘Regenerata’. Also included in the survey were 111 Lombardy poplars (P. nigra var italica), 27 balsam poplars (P. trichocarpa Torr. & Gray), 40 grey poplars (P.×canescens Smith) and 12 white poplars (P. alba L.). The trees were assessed between mid-August and mid-September for crown dieback and S. apiformis infestation, and factors that might have influenced tree condition and moth activity, e.g. tree size (diameter at breast height, DBH, i.e. at 1.3 m), site and tree management, the species composition and density of understorey vegetation, and the type and context of planting (shelter belt, amenity planting, etc.) (Arundell & Straw, Reference Arundell and Straw2001). All trees were tagged with individually numbered aluminium labels so they could be re-located at a later date.
Trees assessed during the survey were located at 44 different sites located within the main area affected by dieback (Marston Vale, Bedford and Milton Keynes) and in the surrounding region, and were chosen to represent as wide a range as possible of tree condition, tree size, age and planting situation. Twenty trees were assessed at each site, chosen systematically from those that could be accessed, although at a few sites a smaller number of trees were available. Sites occurred in eight main areas at distances up to 44 km from Stewartby Lake Country Park at the centre of Marston Vale (National Grid Ref.: TL005425; Lat. 0°32'W, Long. 52°4'N).
Crown dieback was assessed visually and recorded as the percentage of the crown apparently missing because of dieback (=the percentage of the crown affected by dieback), as described by Innes (Reference Innes1990). This method compares the appearance of the tree with what it should have been if it was perfectly healthy, or compared with a healthy and fully foliated tree nearby. Healthy trees with a full canopy would generally score 5–10% crown dieback (there are nearly always some gaps and small dead branches), and a score of 20% crown dieback would also not be considered a problem. However, 40% crown dieback would be a cause for concern and 70–90% crown dieback would indicate a tree in very poor condition.
Infestation by S. apiformis was recorded as the total number of exit holes visible in the base of the stem and the number of new exit holes. These exit holes are produced when the adult moths emerge during the summer. S. apiformis overwinters as a fully grown larva in a cell excavated just below the bark and pupates in the spring. The adult moth emerges between mid-June and mid-July, occasionally in early August, through a hole chewed through the bark. The size and shape of these exit holes is characteristic. They are circular, about 8 mm in diameter, and are concentrated around the base of the trunk and root collar (Schwenke, Reference Schwenke1978; Heath & Emmet, Reference Heath and Emmet1985), and are unlikely to be confused with those of other wood-boring insects, e.g. goat moth (Cossus cossus L.) or large poplar longhorn beetle (Saperda carcharias L.). These other species were not encountered during the surveys.
New exit holes were identified by their fresh appearance, clean cut edges and an inner reddish brown colour, indicating that the bark had been chewed through recently. In many cases, the empty pupal case was found protruding half-exposed from the new hole or was lying on the ground close by. Old exit holes, in contrast, appeared worn and grey, and were becoming distorted as the bark grew and expanded. S. apiformis exit holes persist for many years before becoming gradually less distinct and finally occluded as a result of the stem increasing in diameter and the bark expanding and cracking. Consequently, the total number of exit holes accumulates with time and is an indication of the general level of moth infestation in the stem over a number of years. New holes, on the other hand, are formed by moths emerging during the previous 1–2 months (with perhaps a small proportion representing moths emerged the previous summer), and they provide a measure of current moth activity.
Repeat surveys in 2001, 2003 and 2005
All trees used in the original survey were re-located during August or early September 2001, 2003 and 2005; and, for those that were still standing and accessible, crown dieback, the number of S. apiformis exit holes (total holes and new holes), DBH and changes in the density and composition of the understorey vegetation were recorded. Assessments were made using the same protocols as the 1999 survey.
Four people (1–4) carried out the surveys. The 1999 survey was carried out by 1, the 2001 survey by 1 and 2, the 2003 survey by 2 and 3 and the 2005 survey by 2 and 4. The overlap in surveyors between years helped to ensure that assessments made in different years were comparable.
Meteorological data
Annual and mean monthly temperature and rainfall data for the period 1970–1999 were obtained for weather stations at Woburn Sands (Buckinghamshire), Moulton Park (Northampton) and Silsoe College (Bedford), the three stations closest to the survey area, as part of the interpretation of the initial survey data in 1999. Subsequent data for 2000–2005 were obtained from the Met Office (Exeter, UK) for Woburn Sands, Moulton Park and Clophill (Bedford), the latter as a substitute for Silsoe College, where the weather station ceased operating in 2000. Clophill is located 3 km north of Silsoe at a similar elevation.
Statistical analysis
Numbers of S. apiformis exit holes per tree (total holes and new holes) were log (N+1) transformed before analysis and mean numbers and standard errors obtained by back transformation. Variation in percentage crown dieback and DBH in 2005 in relation to moth infestation and previous dieback, and variation in the number of S. apiformis exit holes in relation to previous infestation, dieback, tree size, habitat and planting context were analysed using the general analysis of variance for linear mixed models (GLM) provided by the REML directive in GenStat® (Payne et al., Reference Payne, Murray, Harding, Baird, Soutar and Lane2002). This procedure produces a Wald statistic (W) for the fixed effects in the model, which is distributed approximately as χ2, rather than a variance ratio (F). Habitat and landscape categories were included as fixed effects, and site was included as a random effect nested within geographic area. Ten trees that were included in the original 1999 survey, and which appeared to be native black poplars (P. nigra var betulifolia (Pursh) Torr.), were not included in the current analysis, as their identity was later considered uncertain.
Differences in mean percentage crown dieback between trees that had no S. apiformis exit holes in 1999 and 2001, and which subsequently remained uninfested or developed holes, were compared using Mann-Whitney tests (two-tailed and corrected for tied ranks), as the distribution of dieback values within this subset of the data was skewed toward low values and departed significantly from normality.
A number of trees were lost over the study period, particularly amongst the black poplar hybrids. All analyses, tables and figures are based on the trees present throughout the study and assessed in all four surveys (i.e. 473 black poplar hybrids, 105 Lombardy poplars, 22 balsam poplars, 40 grey poplars, 12 white poplars).
Results
Differences in infestation and dieback between poplar species and varieties
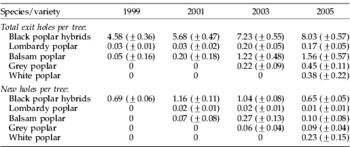
The highest numbers of S. apiformis exit holes were found in the black poplar hybrids, and the total number of exit holes in these trees almost doubled between 1999 and 2005 (table 1). Smaller numbers of exit holes were found in the Lombardy and balsam poplars, but numbers of exit holes also increased in these varieties. The grey and white poplars showed no signs of infestation in 1999 and 2001, but a small number of exit holes were found in the grey poplars in 2003 and the white poplars in 2005 (table 1).
Mean number of S. apiformis exit holes per tree, 1999–2005 (±maximum SE), for the different poplar species and varieties included in the surveys.

Between 8 and 21% of the exit holes found in the black poplar hybrids were classified as new holes. The numbers of new holes was highest in 2001 and decreased in 2003 and 2005 (table 1). In the Lombardy and balsam poplars, new exit holes were most frequent in 2001 or 2003. A high proportion of the exit holes in the grey and white poplars in 2003 and 2005 were new holes.
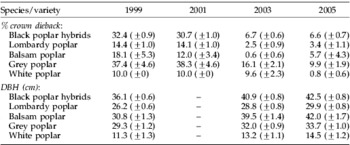
Despite the overall increase in the numbers of S. apiformis exit holes, the crown condition of the poplars improved with time, particularly between 2001 and 2003 (table 2). The improvement in crown condition was associated with the development of new shoots within the canopy and an increase in the total amount of foliage. Many of the new shoots on the black poplar hybrids developed from adventitious buds at the base of dead branches; and, as these shoots grew, they masked the previous dieback and filled in gaps within the canopy. By 2005, average crown dieback for all of the poplar species and varieties was less than 10%, indicating basically healthy trees. The poplars grew steadily throughout the study period, with mean DBH increasing by 14–36% between 1999 and 2005 (table 2).
Mean crown dieback and DBH (±SE) of the different poplar species and varieties, 1999–2005.

DBH was not recorded in 2001.
The mean numbers of exit holes per tree, mean crown dieback and mean DBH in tables 1 and 2 were calculated using those trees present through to 2005 and assessed in all four surveys. Means calculated using all of the trees available each year were very similar. This was because the majority of trees that were lost were either removed as part of planned management operations or became inaccessible because of road building or development and represented a relatively random subset of the total trees. As a result, the changes in sample size had little influence on the trends in infestation, crown dieback and DBH illustrated by the data.
Recovery from crown dieback in the black poplar hybrids
The improvement in the condition of the poplars occurred during a period that was generally favourable for growth. The total amount of rainfall falling during April, May and June during 1999 to 2005 (118–225 mm) was close to the long-term average for the region (149 mm), and there were no very dry years as occurred in 1995 and 1996.
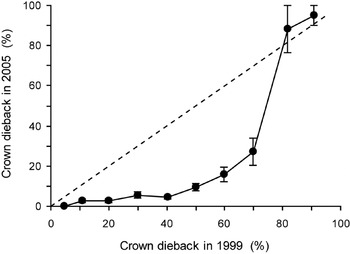
However, amongst the black poplar hybrids, there was considerable variation in recovery (fig. 1). Trees that had less than 70% crown dieback in 1999 generally improved by 2005, whereas trees with 75% or more crown dieback deteriorated further or died. By 2005, 81% of the trees that had shown 80–90% crown dieback in 1999 had died compared with 17% of trees showing 70–75% crown dieback and 0.7% of trees with less than 70% crown dieback.
Relationship between crown dieback in 2005 and crown dieback in 1999. Data points are means±SE. Dashed line indicates no change in crown condition.

Trees that had less than 70% crown dieback in 1999 also varied in the degree to which they recovered. Trees that showed only light or moderate (10–40%) dieback in 1999 recovered fully by 2005 (<10% dieback), but trees that had more severe symptoms in 1999 (50–70%) had not fully recovered and still showed 9–27% crown dieback in 2005 (fig. 1). However, the improvement in their condition was still marked.
Influence of S. apiformis on tree recovery
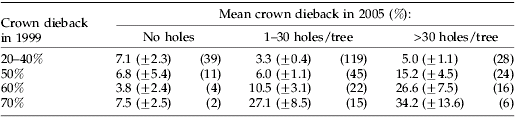
An influence of S. apiformis on tree recovery from dieback was most likely to be detected amongst the black poplar hybrids that showed 50–70% crown dieback in 1999 and which had not fully recovered by 2005. Amongst these trees, those that had more than 30 S. apiformis exit holes showed higher rates of dieback in 2005 than trees with 1–30 exit holes or no exit holes, suggesting a slower rate of recovery (table 3). If S. apiformis had no influence on tree condition, then trees with none or many exit holes would have been expected to have shown the same amount of crown dieback in 2005. However, the data need to be interpreted with caution. S. apiformis might have been responsible for the slower rate of recovery in trees with large numbers of exit holes; but, equally, these trees might have been inherently slower growing, and the moth may have colonised or developed more effectively in trees that were always going to be slower to recover.
Mean percentage crown dieback in 2005 (±SE) for black poplar hybrids that had either 20–40%, 50%, 60% or 70% crown dieback in 1999, and either no S. apiformis exit holes, 1–30 exit holes or >30 exit holes. Numbers in parentheses are the number of trees.
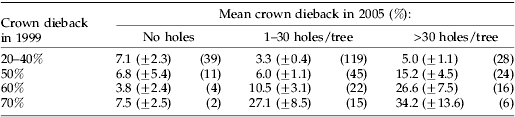
Furthermore, even though the mean crown dieback of trees with many moth exit holes was significantly higher than that shown by trees with no exit holes when all the data were pooled (no holes, 6.2±3.5%; 1–30 holes per tree, 12.0±2.3%; >30 holes per tree, 23.5±4.3%; REML, Wdf=2=13.0, p=0.002), the difference was not significant when site was included in the analysis (REML, Wdf=2=0.06, p=0.8) because of the similarity of infestation and condition of trees within sites and large differences between sites. Therefore, it is also possible that infestation and recovery were related to other site specific, and as yet unidentified, factors and not to each other.
Differences in tree size also confound the relationship between infestation and tree recovery. Within the sub-sample of trees that showed 50–70% crown dieback in 1999, those with many exit holes were larger, on average, than those with few or no holes. The mean DBH in 2005 of trees with more than 30 exit holes, 1–30 holes and no holes was 49.3 (±2.0), 44.6 (±1.5) and 37.8 (±2.7), respectively (REML: Wdf=2=9.0, p=0.011). Consequently, the apparent relationship between moth infestation and slower recovery might simply reflect a slow rate of recovery in larger trees that coincides with larger trees also being more attractive to S. apiformis or being more suitable for larval development and survival.
Survey data of the type collected in the study cannot identify which factors are the cause of variation in tree recovery and which factors are responses to that variation. Consequently, it is not possible to say whether the presence of S. apiformis delayed tree recovery or whether the moth was just more successful in trees that were recovering more slowly for other reasons. Whatever the cause and effect, it is important to note that the condition of trees with many S. apiformis exit holes still improved between 1999 and 2005, as long as the amount of dieback to start with was not too severe and, although there is some evidence that infestation might have delayed recovery, it certainly did not prevent it.
Condition of trees colonised by S. apiformis
A number of black poplar hybrids, Lombardy poplars and grey poplars that had no S. apiformis exit holes in 1999 and 2001 were found to have exit holes when re-assessed in 2003 and 2005. These trees appeared to have been colonised by S. apiformis during the study period, and they provide an opportunity to investigate whether colonisation by the moth was related to initial tree condition and subsequent performance.
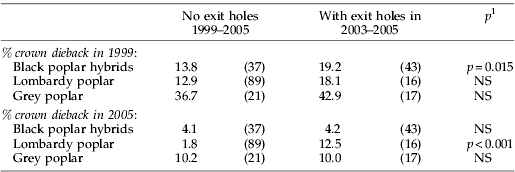
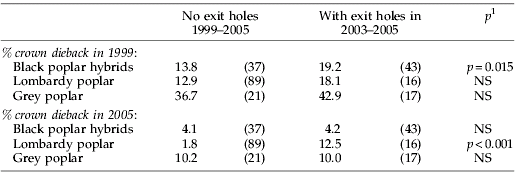
For each of the three types of poplars, trees in which exit holes appeared in 2003 and 2005 had a higher percentage crown dieback in 1999 compared with trees that remained uninfested (table 4). Differences in initial condition of trees with and without exit holes were small, but were significant for the black poplar hybrids (p=0.015) and provided some evidence that S. apiformis tended to colonise trees that were, on average, in worse condition.
Mean crown dieback of trees that showed no evidence of moth infestation during the study and trees that produced exit holes for the first time in 2003 and 2005. Numbers in parentheses are the number of trees.
1 Mann-Whitney test (two-tailed), corrected for tied ranks.
Despite the appearance of exit holes, black poplar hybrids and grey poplars colonised by S. apiformis during the study period continued to improve and showed, on average, a similar amount of crown dieback in 2005 as trees that remained free of attack (table 4). Colonisation by the moth was not associated with slower recovery. The numbers of exit holes appearing in the trees by 2005 was small (black poplar hybrids, 3.1±0.5 holes per tree; grey poplars, 1.4±0.2 holes per tree) and appear not to have had any effect on tree health.
In contrast, the Lombardy poplars colonised by S. apiformis during the study period improved only marginally and had significantly more crown dieback in 2005 than the Lombardy poplars that were not colonised (table 4). This might indicate that colonisation slowed the trees' recovery, but as in the black poplar hybrids and grey poplars, the numbers of exit holes appearing in the Lombardy poplars was very low (1.8±0.3 holes per tree) and were unlikely to have had a direct influence on tree condition. It is more probable that colonisation occurred on trees that were in poorer condition for other reasons.
Changes in S. apiformis infestation, 1999–2005
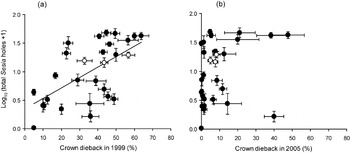
In 1999, for the black poplar hybrids, site means for the total number of S. apiformis exit holes per tree and mean percentage crown dieback were highly correlated (r2=0.38, p<0.001; Arundell & Straw, Reference Arundell and Straw2001). In 2005, site means for total exit holes per tree were correlated with the amount of dieback recorded in 1999 (r2=0.40, p<0.001) but not with crown dieback recorded in 2005 (r2=0.08, NS) (fig. 2). This situation, where total exit holes in 2005 were correlated with previous dieback but not current dieback, occurred because tree condition improved relatively quickly between 1999 and 2005, but total numbers of moth exit holes changed only slowly. As a result, variation in the total number of S. apiformis exit holes per tree in 2005 reflected tree condition in the past, some six years previously, but not current tree condition.
Correlations between the total number of S. apiformis exit holes per tree in 2005 and (a) crown dieback in 1999 and (b) crown dieback in 2005. Data points are site means±SE. Trend line in (a): y=0.018x+0.347 (r2=0.40, p<0.001). Open symbols indicate sites that had a high proportion of new exit holes in 1999 and which had only recently been colonised by S. apiformis.

Compared with the majority of sites where S. apiformis appeared to have been established for a number of years in 1999, a small number of sites had apparently been colonised by the moth much more recently. These sites were characterised by a high proportion of new exit holes and higher than average dieback (Arundell & Straw, Reference Arundell and Straw2001). By 2005, a higher number of moth exit holes had accumulated at these sites, the proportion of new holes had decreased, and the relationship between total holes per tree and percentage crown dieback in 1999 was similar to that for trees at other sites (fig. 2a).
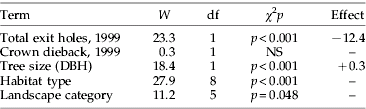
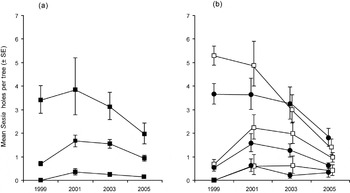
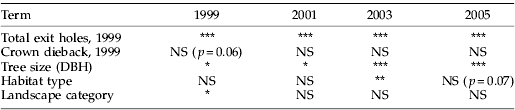
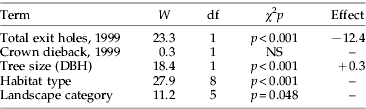
More generally, there was a higher than average increase in total exit holes per tree between 1999 and 2005 at sites that initially had low numbers of exit holes and less dieback, and smaller increases or no increase in total numbers of exit holes at sites that initially had higher rates of infestation and more severe dieback. This was evident when trees from all sites were pooled and the mean total holes per tree calculated for trees that had no exit holes, 1–30 exit holes and more than 30 exit holes in 1999 (fig. 3). The total number of exit holes in trees that started with more than 30 holes increased in 2001, but decreased during 2003 and 2005. In contrast, in trees that initially had few or no exit holes, the total number of holes increased steadily over the study period (fig. 3). The same trends in total holes per tree were shown by heavily and lightly infested trees irrespective of the amount of crown dieback recorded in 1999, indicating that subsequent increases or decreases in infestation were related primarily to initial infestation rate and not to tree condition. GLM analysis indicated a significant negative effect of initial numbers of moth exit holes on the change in total numbers of holes between 1999 and 2005 but no effect of the initial condition of the trees (table 5). Larger decreases in the total number of exit holes occurred in trees that started with 30 or more exit holes in 1999 (fig. 3). The analysis also indicated a small but significant positive effect of tree size on the change in total numbers of exit holes (i.e. less severe declines in larger trees) and significant effects of habitat (type of understorey vegetation) and landscape category (see below).
Total S. apiformis holes per tree (mean±SE) in 1999–2005 for trees with either no exit holes, 1–30 exit holes or more than 30 exit holes in 1999. (a) Trees showing 20–40% crown dieback in 1999; (b) trees showing 50% (—●—) and 60–70% (—□—) crown dieback in 1999. The numbers of trees on which the means are based are given in table 3.

Factors influencing the change in total S. apiformis exit holes per tree between 1999 and 2005; results from General Linear Mixed Model analysis (REML). Site was included in the model as a random effect nested within geographic area.
For the three classes of initial infestation (0 exit holes, 1–30 holes, >30 holes), there was no significant difference in mean total holes per tree between trees that had either 20–40%, 50% or 60–70% crown dieback in 1999 (fig. 3), indicating that initial dieback did not affect subsequent changes in the total numbers of exit holes. (Note that differences in mean infestation between trees with 40%, 50% and 60–70% dieback etc., illustrated by the correlation between infestation and dieback (fig. 2), occurs because different dieback categories contain different numbers of trees with zero, light or heavy infestation.) Mean total holes per tree in trees that had 0–15% dieback in 1999 were also similar to those of trees with 20–70% dieback, but these data are not illustrated because this group contained few trees with more than 30 exit holes, and the mean and SE values for these trees were much more variable.
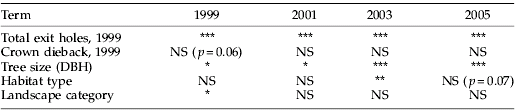
Changes in the numbers of new S. apiformis exit holes per tree indicated a relatively high rate of moth activity in trees with more than 30 exit holes during 1999 and 2001, followed by a decline in the numbers of moths emerging in 2003 and 2005 (fig. 4). In contrast, moth activity in trees that started with fewer than 30 exit holes or no exit holes increased up to 2001, remained relatively high in 2003 and then declined in 2005 (fig. 4). As was the case with total holes per tree, trends in the numbers of new holes over time were similar for lightly, heavily and uninfested trees irrespective of the amount of crown dieback the trees had shown in 1999. GLM analysis indicated a significant and positive relationship between the number of new exit holes and the total exit holes per tree (table 6). Trees with a high total number of exit holes in 1999 still produced more new holes in subsequent years, even though the numbers of new holes decreased more rapidly in these trees than in trees that had a smaller total number of holes (fig. 4). The analysis also indicated a significant, positive relationship between the number of new holes and tree size, which was stronger in the later surveys, but no relationship with crown dieback (table 6).
Mean number of new S. apiformis holes per tree (±SE) in 1999–2005 for trees that had no exit holes in 1999 or a total of 1–30 exit holes or more than 30 exit holes in 1999. (a) Trees showing 20–40% crown dieback in 1999; (b) trees showing 50% (—●—) and 60–70% (—□—) crown dieback in 1999.

The influence of different factors on the numbers of new S. apiformis exit holes per tree in 1999, 2001, 2003 and 2005; results from General Linear Mixed Model analysis (REML). Site was included in the model as a random effect nested within geographic area.
* p⩽0.05
** p⩽0.01
*** p⩽0.001.
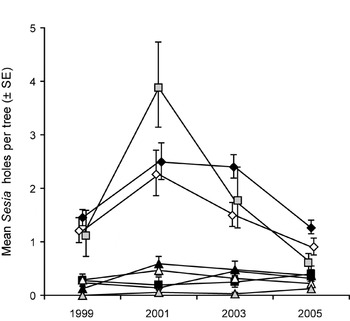
The sites at which the poplars were assessed were located in eight distinct geographical areas. S. apiformis populations were particularly high in 1999 in the Stewartby area of Marston Vale near Bedford, at Rothersthorpe near Northampton and at Buckden near St Neots (fig. 5). The total numbers of S. apiformis exit holes and numbers of new holes in these heavily infested areas increased up to 2001, and then decreased in 2003 and 2005, following the trends observed for individual trees with large numbers of exit holes (figs 3 and 4). In the other areas, S. apiformis occurred at much lower densities and the numbers of exit holes remained low throughout the study period (fig. 5). This was despite considerable (20–50%) dieback at some of the sites within these areas.
Trends in the number of new S. apiformis holes per tree (mean ± SE) 1999–2005 at sites in different geographic areas (—◆—, Marston vale;  , Milton Keynes; —♦—, Rothersthorpe; —■—, Grafham;
 , Buckden; —▲—, Godmanchester; —△—, Bar Hill;
 , Desborough).

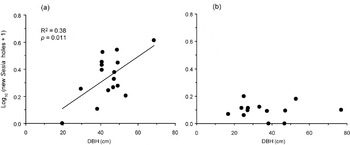
The trends in infestation in different geographical areas illustrate the localised nature of the increase and decline in the S. apiformis population and that the moth population did not spread out into other areas from sites where it occurred at high density. Within the areas where S. apiformis was abundant, there was a positive relationship between moth activity in 2005 (the numbers of new exit holes) and tree size (fig. 6a), suggesting that higher moth numbers were persisting for longer on larger trees. In contrast, in areas where S. apiformis occurred at low density, no such relationship was evident (fig. 6b).
Relationships between the number of new S. apiformis exit holes per tree in 2005 and tree size (DBH). (a) Sites in areas with high S. apiformis populations (Marston Vale, Rothersthorpe, Buckden); (b) sites in areas with low S. apiformis populations (Milton Keynes, Grafham, Godmanchester, Bar Hill, Desborough). Data points are site means.

S. apiformis infestation and habitat type
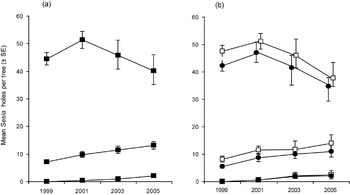
During the original survey in 1999, it was found that trees with many S. apiformis exit holes were more frequent where the understorey vegetation around the trees was dense, particularly where it consisted of scrub and tall weeds, bramble (Rubus fruticosus L. agg.) or rough grass (Arundell & Straw, Reference Arundell and Straw2001). In contrast, few exit holes tended to occur in trees growing in open woodland or situations where trees were widely spaced and surrounded by bare soil or very short vegetation such as mown grass. The same patterns were seen in the later surveys (fig. 7). Numbers of new holes showed similar patterns to the total number of holes.
S. apiformis infestation in relation to the type and density of understorey vegetation, (unadjusted means±SE) (■, 1999;  , 2001;
 , 2003; □, 2005).

Some of the variation in infestation between habitat types was related to differences between sites, but habitat still had a significant effect on changes in the total number of holes per tree, and on the number of new holes, even when site and area were taken into account (tables 5 and 6). Significantly larger decreases in total numbers of exit holes occurred between 1999 and 2005 in trees growing in open woodland (fig. 7) and to a lesser extent in areas of open scrub and short mown grass. Numbers of new holes were also significantly lower in these habitats in 2003 (table 6).
The landscape context of the poplar planting also had a significant, albeit small, effect on the numbers of new holes in 1999 and on changes in the total numbers of S. apiformis exit holes between 1999 and 2005 (tables 5 and 6), but this is more difficult to interpret. There was a relatively greater decrease in total holes per tree in landscape plots, plantations and hedgerows compared with a relative increase in numbers of holes in amenity plantings, but the cause of this variation is unclear and it was not evident in the later surveys.
Discussion
Infestation with S. apiformis was most prevalent amongst the black poplar hybrids. At the most heavily infested sites, all black poplar hybrids were attacked and some trees had 80–160 exit holes in the base. In contrast, very few exit holes were found on the other poplar species and varieties. The maximum numbers of holes found on single trees of Lombardy, balsam, grey and white poplar were five, four, four and three, respectively. These small numbers of exit holes were unlikely to have posed a threat to the health of the trees.
Even though many of the black poplar hybrids were heavily infested, the vast majority were still alive in 2005, six years after the initial survey, and their condition had improved. Several years of favourable growing conditions allowed new shoots to develop and replace the branches that had died up to 1999. Therefore, the presence of S. apiformis did not prevent tree recovery, and there was little evidence that infestation affected the rate of recovery. Some of the most heavily infested trees had not recovered fully from dieback by 2005, and although this suggested that infestation might have influenced the rate of recovery, it could also just reflect better larval survival and development in inherently slower growing trees.
Apart from three black poplar hybrids that were in reasonable condition in 1999 but died later, the only trees to die or deteriorate further during the study were those with 70% or more crown dieback in 1999. Consequently, there appeared to be a threshold of about 70–75% crown dieback at or above which the poplar trees were unable to recover. S. apiformis, other insects and fungal pathogens may have contributed to the speed at which these trees declined and died, but under the prevailing conditions it appears that death of these trees was inevitable. Thresholds for recovery or failure of trees after damage have only rarely been reported. Cedervind & Långstrom (2003) recorded a higher threshold for survival, of about 90% of canopy remaining, for Scots pine (Pinus sylvestris L.) following defoliation by pine looper moth and subsequent attack by bark-beetles. The higher threshold for survival in this study may indicate that a tree's capacity to recover from defoliation, without damage to other tissues, is perhaps greater than its capacity to recover from dieback and branch death.
Extensive tunnelling by S. apiformis in the base of small poplar trees (and by S. bembiciformis Hübner in small willows and sallows) has been associated with breakage at ground level and stem collapse (Chrystal, Reference Chrystal1937; Bouchet, Reference Bouchet1962; Schwenke, Reference Schwenke1978). During the present study, only one black poplar hybrid that was not already in poor condition blew down because of strong winds. However, few of the trees included in the study would have been considered small (8–15 cm DBH, 21 trees), and most of these were lightly infested. The majority of trees were relatively large (25–115 cm DBH, 560 trees) and were unlikely to have been rendered more susceptible to wind snap by S. apiformis tunnelling beneath the bark low down on the stem.
Increase in S. apiformis populations 1999–2001
The increase in S. apiformis populations in central east England occurred at the same time and within the same general area where dieback was reported in the poplar trees. Dieback of twigs and branches, particularly in the upper canopy, is a common symptom of water stress (Peace, Reference Peace1962; Tattar, Reference Tattar1978; Phillips & Burdekin, Reference Phillips and Burdekin1992), and the timing of its development in the poplar trees is consistent with a period of drought in 1995 and 1996 (Arundell & Straw, Reference Arundell and Straw2001). Poplars are particularly water demanding (Binns, Reference Binns1980; Jobling, Reference Jobling1990); and, therefore, it is perhaps not surprising that the appearance of dieback in poplar and an increase in S. apiformis populations occurred in what is one of the warmest and driest parts of the UK (Arundell & Straw, Reference Arundell and Straw2001).
It is well known that water stress predisposes trees to attack by insects and pathogens, and that outbreaks of herbivorous insects on trees (and other plants) are often associated with periods of drought (Larsson & Tenow, Reference Larsson and Tenow1984; White, Reference White1984, Reference White1993; Mattson & Haack, Reference Mattson, Haack, Barbosa and Schultze1987; Larsson, Reference Larsson1989; Koricheva et al., Reference Koricheva, Larsson and Haukioja1998; Huberty & Denno, Reference Huberty and Denno2004). Drought is a precursor of dieback and fungal infection in ash (Kozlowski & Pallardy, Reference Kozlowski and Pallardy1997); and drought combined with defoliation, which allows buprestid beetles (Agrillus spp.) to attack beneath the bark of oaks, is a main predisposing factor leading to oak decline (Gibbs & Greig, Reference Gibbs and Greig1997; Thomas et al., Reference Thomas, Blank and Hartmann2002). There are no direct reports of drought increasing the susceptibility of poplars to insect attack, but several authors stress the importance of planting poplars on good sites and maintaining vigorous growth to prevent infestations by S. apiformis, and that severe infestations occur particularly on sub-optimal sites (Escherich, Reference Escherich1931; Schnaiderowa, Reference Schnaiderowa1974; Schwenke, Reference Schwenke1978). The implication is that trees under stress are more prone to attack.
Water stress increases the nutritional quality of plant tissues for herbivorous insects, especially the availability of nitrogen; alters the concentrations and composition of secondary defensive chemicals; and leads to changes in tissue water content, which may improve the physical environment for insect growth (White, Reference White1984, Reference White1993; Mattson & Haack, Reference Mattson, Haack, Barbosa and Schultze1987; Kozlowski et al., Reference Kozlowski, Kramer and Pallardy1991; Huberty & Denno, Reference Huberty and Denno2004). Periods of drought are also often associated with higher temperatures and weather conditions that may have a direct effect on insects, such as increasing rates of development and improving adult survival and host-location during the flight period (Mattson & Haack, Reference Mattson, Haack, Barbosa and Schultze1987).
Changes in the nutritional quality, secondary chemistry and physical properties of host-plants generally have greatest impact on early larval stages of herbivorous insects. Early larval instars are more sensitive to host-plant quality than older instars, and mortality during early instars is often very high (White, Reference White1984, Reference White1993; West, Reference West1985; Koricheva et al., Reference Koricheva, Larsson and Haukioja1998). In S. apiformis, mortality during the first instar, between egg hatch and establishment under the bark, appears to be particularly high. Adult females of S. apiformis live for several weeks and each lays up to 1200–2500 eggs, deposited freely around the base of poplar trees or in crevices in the bark (Šrot, Reference Šrot1969; Schwenke, Reference Schwenke1978; Heath & Emmet, Reference Heath and Emmet1985). This is a much higher number of eggs than the number normally laid by female moths the size of S. apiformis (South, Reference South1961; Heath & Emmet, Reference Heath and Emmet1985). After hatching from the eggs, the first instar S. apiformis larvae bore through the bark of the stem, but only 5–6% of eggs result in established larvae (Šrot, Reference Šrot1969). Typically, very few S. apiformis adults emerge from individual poplar trees each year. Coleman & Boyle (Reference Coleman and Boyle2000) found that less than four S. apiformis adults emerged per year from most trees; and similar numbers of new emergence holes appeared in many of the trees in the present study, especially by 2005 (fig. 5). The low numbers of adults, compared with the high fecundity of individual females, points to high mortality during the larval stages; and it would appear that most of this mortality occurs during the early larval stages before or at establishment. Changes in the nutritional quality, defensive chemistry and water content of the bark and sapwood are likely to have their greatest influence on larval success or failure at this time.
It is not known exactly how the nutritional quality, chemical defences and physical properties of bark, cambium and sapwood of poplars might change during conditions of drought and how this might affect S. apiformis. Most studies on the response of insects to water stress in trees have looked at foliage-feeding species or bark beetles attacking conifers (Mattson & Haack, Reference Mattson, Haack, Barbosa and Schultze1987; Larsson, Reference Larsson1989; Koricheva et al., Reference Koricheva, Larsson and Haukioja1998; Huberty & Denno, Reference Huberty and Denno2004). However, some of the changes that occur in the foliage of drought-stressed trees also occur in the roots and are likely to benefit cambium- and sapwood-feeding insects. Water stress in black oak (Quercus velutina L.) and sugar maple (Acer saccharum L.) results in the accumulation of soluble sugars, amino acids and certain phenolics in the root tissues and a decrease in starch (Parker, Reference Parker1970; Parker & Patton, Reference Parker and Patton1975; Wargo, Reference Wargo and Kile1984). These physiological changes have been shown to facilitate the invasion of roots by Armillaria mellea (Vahl.) Quél. and other fungi (Wargo, Reference Wargo1972, Reference Wargo and Kile1984). However, changes in the water content of bark and sapwood and cell turgor might be equally or more important. Hanks et al. (Reference Hanks, Paine and Millar1991) demonstrated that establishment of first instar larvae of Phoracantha semipunctata (Fab.), a longhorn beetle that bores into the stems of eucalyptus, was only successful on water-stressed trees or on drying logs, where the moisture content of the bark was reduced. If the moisture content was too high, then the larvae effectively drowned as they attempted to penetrate the bark, and this prevented establishment on well-watered and vigorous trees.
Decline in S. apiformis populations 2003–2005
The decline in S. apiformis populations later in the study period occurred at the same time that tree condition improved, as growing conditions returned to normal, and was related presumably to a reversal in the conditions that initially allowed an increase in numbers. A build-up in pathogen and natural enemy populations might also have contributed to the decline in S. apiformis, but the temporal and general spatial coincidence of the rise and fall in S. apiformis populations, with the appearance of dieback in the poplars, suggests a more direct link with the changing condition of the trees.
Moth activity in the most heavily infested trees, as measured by the numbers of new exit holes, was highest in 1999 and 2001 and declined in 2003 and 2005 (fig. 4). In contrast, the numbers of new holes in lightly infested trees peaked in 2001 and began to decline mainly in 2005 (fig. 4). Overall, the number of emerging moths peaked 5–7 years after the drought of 1995–1996, and the subsequent fall in moth activity occurred at about the same time, or just after, the main improvement in tree condition between 2001 and 2003 (table 2). The rise and fall in population numbers, following closely the changes in tree condition, are consistent with S. apiformis being a secondary pest dependent on weakened trees for successful establishment and development.
However, if changes in tree condition were responsible for the increase and decrease in S. apiformis populations, it seems strange that in the latter part of the study, changes in the total numbers of exit holes and numbers of new holes were related to how heavily individual trees were infested, but not to the amount of dieback the trees displayed in 1999 (figs 3 and 4, tables 5 and 6) or subsequently. It had been expected that S. apiformis would have persisted in higher numbers for longer in trees that were initially in worse condition, and would have decreased more rapidly in trees that showed less dieback and which had recovered fully by 2005. This should have been reflected in a significant positive effect of dieback on changes in numbers of exit holes.
The discrepancy between the overall correlation between moth numbers and improvement in tree condition, and the lack of a significant influence of dieback on changes on moth numbers in individual trees, arises because of the lagged response of adult emergence compared with changes in larval numbers in the stem and the extended period of time required for dieback in the canopy to be replaced. Because of the long development period in S. apiformis, the peak numbers of new holes in 1999–2001 actually reflect increased larval establishment and early larval growth during 1997–1999. Similarly, the decrease in numbers of exit holes between 2001 and 2003 relates to a decline in establishment and larval numbers in 1999–2001, i.e. before the amount of dieback in the canopy was visibly reduced. It appears, therefore, that the numbers of S. apiformis larvae responded to a change in the trees that occurred much earlier than that indicated by the trees' visible recovery from dieback, suggesting that the internal water relations of the majority of trees returned to normal relatively quickly after the 1995–1996 drought. This is more in keeping with the general observation that trees restore their internal water balance rapidly once soil moisture returns to normal (Kozlowski et al., Reference Kozlowski, Kramer and Pallardy1991; Kozlowski & Pallardy, Reference Kozlowski and Pallardy1997). The response of the moth population to this change was not evident immediately, but only after lower numbers of adult moths emerged 2–3 years later. The restoration of normal functions within the trees was also not obvious because, although shoot growth must have recovered quite quickly, it took several years for the new growth to mask the dead branches in the canopy, especially on trees where dieback was particularly severe.
The lack of a relationship between the amount of visible dieback and changes in the numbers of S. apiformis exit holes (figs 3 and 4, tables 5 and 6) indicates that the internal state of all of the trees with less than 70–75% dieback returned to normal relatively quickly, irrespective of the actual amount of dieback visible in the canopy; and it was to this internal change that the moth population responded. With all trees restored internally in equal measure, variation in the change in total numbers of exit holes, and the numbers of new exit holes, was related primarily to whether trees had become either heavily or lightly infested. Moth activity declined more quickly between 2001 and 2005 on trees that were heavily infested than on trees that were lightly infested, and on lightly infested trees the peak in moth emergence occurred later and the numbers of new exit holes only really declined in 2005 (fig. 4). Increases in the number of exit holes on lightly infested trees occurred mainly at sites where moth populations were already high, and it appears to have been a spill-over effect from heavily infested trees growing nearby.
The earlier and larger decrease in moth numbers in larger trees might reflect a more thorough depletion of larval food resources or a greater build-up in pathogen and natural enemy populations. Depletion of food resources is difficult to envisage, unless this occurred without impairing the internal functioning of the tree, as the outward appearance of even heavily infested trees (with up to 120–160 exit holes) improved over time. On the other hand, the greater decline in moth activity in heavily infested trees, and at sites where high populations developed, might simply reflect that populations at these sites had increased the most and had further to fall to return to endemic population levels.
Acknowledgements
We thank John Arundell for help with the surveys in 1999 and 2001, and Jane Poole and Geoff Morgan for statistical advice. We are grateful to Rai Darke (Milton Keynes Park Trust), Andrew Lingard (Stewartby Country Park), Phillip Harper (Burton Latimer Estates), Paul Simpson (Moat House Hotels) and the Highways Agency for assistance and permission to access sites.