


Nomenclature
- ANN
-
artificial neural network
- bps
-
blinks per second
- EEG
-
electroencephalography
- HWD
-
head-worn display
- NASA-TLX
-
NASA task load index
- PFD
-
primary flight display
- PSD
-
power spectral density
- RLD
-
relative layout design
- SUS
-
system usability scale
- SVM
-
support vector machine
- SWAT
-
subjective workload assessment technique
1.0 Introduction
Pilots need to continuously interact with the cockpit display interface while performing flight tasks [Reference Carroll and Dahlstrom1–Reference Wang, Guo, Zhong, Zeng, Zhang and Wang3]. This interaction enables them to access information about the aircraft’s flight status and surrounding situations, facilitating effective aircraft manoeuvering [Reference Yu, Jin, Zhao and Zhang4, Reference Wei, Zhuang, Wanyan and Wang5]. The primary flight display (PFD) is a crucial component of cockpit human-computer interaction. Its primary function is to transmit flight information and display the aircraft’s flight status in real time [Reference Li, Zakarija, Yu and McCarty6]. The PFD interface provides pilots with the most critical information for safe flight. The main elements of the interface include the airspeed indicator, altitude indicator, attitude indicator, heading indicator and other similar instruments, which provide pilots with real-time flight information such as airspeed, altitude, pitch and roll angle and heading [Reference Chaparro, Miranda and Grubb7, Reference Lanoix, Rawal and Doyon-Poulin8]. The PFD interface enables the pilot to obtain accurate information and to perform the requisite operations in an efficient manner, thereby facilitating the completion of the flight task [Reference Tan, Wang and Sun9, Reference Wei, Zhuang, Wanyan, Liu and Zhuang10, Reference Li, Zhang, Le Minh, Cao and Wang19].
Pilots’ work efficiency and performance are significantly influenced by a multitude of factors, such as their psychological and physiological states [Reference Taheri Gorji, Wilson, VanBree, Hoffmann, Petros and Tavakolian11], the extent and quality of their training and experience [Reference Haslbeck, Kirchner, Schubert and Bengler12], environmental conditions [Reference Zhou, Ding, Chen, Shi, Ao, Xu and Li13], the design and layout of the cockpit display interfaces [Reference Li, Zhang, Le Minh, Cao and Wang19], as well as the complexity of the tasks. Among these factors, the cockpit display interface design has a direct impact on pilots’ information acquisition and processing, which ultimately affects their driving operations [Reference Li, Yu, Greaves and Braithwaite14–Reference Wu, Li and Xue16]. Therefore, the design and layout of the PFD interface are crucial to the pilot’s efficiency and understanding of the flight status. It is one of the important factors that affect the pilot’s efficient execution of the task. Good interface design can help the pilot quickly and accurately obtain key information, improving the accuracy and responsiveness of the flight decision [Reference Nagasawa and Li17–Reference Li, Zhang, Le Minh, Cao and Wang19].
The optimal design of cockpit display interfaces has become an important scientific issue due to the rapid development of aviation technology and the increasing complexity of flight missions. This is crucial to ensure pilots’ safe flight and mission performance optimisation. Li et al. [Reference Li, Horn, Sun, Zhang and Braithwaite20] utilised an improved visualisation design to optimise the cockpit PFD interface. This was achieved by highlighting parameters through green borders or associating them with relevant flight mode changes. Şenol [Reference Şenol21] proposed the relative layout design (RLD) optimisation model for conventional cockpit interfaces. The RLD model optimises the position of indicators on the interface, improving display interface usability and contributing to pilot-aircraft interaction and flight safety. Zhang et al. [Reference Zhang, Cheng, Xue and Chen22] conducted an experimental study on the scale intervals, horizontal and vertical distances of different scale bands of the head-worn display (HWD). They obtained an optimised layout of the scale bands of the HMD interface with better task performance.
The optimisation of cockpit display interfaces can be achieved by applying the principles of human-computer interaction. The principles of human-computer interaction primarily include usability, user experience, information presentation and feedback [Reference Valverde23–Reference Pan26]. These principles aim to enhance system ease of use and user satisfaction. There also are a few studies conducted in the past on the optimisation and design of human-computer interaction interface factors. Shen et al. [Reference Shen, Zhang, Li, Hou, Liu and Hu27] conducted a study on the impact of color combination, luminance contrast and icon area ratio on the visual search of graphical symbols. The study evaluated the significance of each factor on the visual search of graphical symbols by measuring the accuracy and response time of the icon search task. Rettenmaier et al. [Reference Rettenmaier, Schulze and Bengler28] conducted two experiments to investigate the readability of different content types (text and symbols) and colours at varying distances. The results showed that, at a fixed distance, text must be larger than symbols to maintain readability. Yang et al. [Reference Yang, Zhang, Wang and Jia29] introduced the artificial neural network (ANN) and support vector machine (SVM) algorithm models into the study of the optimal design of automotive T-panels. The models were used to identify design features of automotive panels and detect system usability, establishing a relationship between the design features of the vehicle panels and the system usability. Dou et al. [Reference Dou, Xu, Chen, Xue and Li30] proposed an extended analysis and optimisation method for interface elements to solve the contradiction between content colour and driver visual fatigue in augmented reality heads-up display interfaces. They constructed a content colour selection model for two conditions and described the distance from the selected colour to the optimal interval to better balance the driver’s cognitive load and situational awareness.
The key to the design of human-machine interfaces lies in the achievement of seamless interaction, which is aimed at reducing the cognitive load on the user and enhancing their perception and operational abilities [Reference Chao31–Reference Yin, Zheng, Li and Wang33]. Therefore, when designing PFD interfaces, it is necessary to consider enhancing pilots’ comfort during flight and reducing cognitive load. The specific design process can be informed by the principles of human-machine interface design, which mainly focus on the visual information such as interface layout, colour, graphics and text [Reference Hao and Chung34–Reference Qi, Yan, Wei and Du37]. The interface layout should be logical and straightforward, the use of colour should optimize visual impact and the manner of conveying information in the interface, such as symbols, text and colour, should be intuitive, accessible and conducive to learning.
However, although some progress has been made in previous research, the complexity of the factors affecting pilot cognitive ergonomics and the lack of clarity on how interface design factors affect the visual cognitive effects of pilots have posed a challenge to the optimisation of PFD interface design. In this study, two design factors of the cockpit PFD interface are optimised. The aircraft symbol optimisation aims to reflect the aircraft attitude more clearly and intuitively to improve the pilot’s cognitive efficiency and reduce cognitive load. The font size of the displayed information is optimised to improve the readability and legibility of the flight data, thus reducing the pilot’s cognitive load when accessing critical information.
In this study, an experimental evaluation method was used to verify the ergonomics of the optimised PFD interface and compare it to the original interface before optimisation. An experiment was conducted to obtain participants’ subjective feedback, task performance, and physiological indicators to evaluate the ergonomics of the PFD interface before and after optimisation and the pilot’s workload, and to determine whether the optimised interface has the potential to improve pilot efficiency and reduce erroneous decisions, and whether it has a significant improvement in pilots’ perception and understanding.
2.0 Method
2.1 Participants
Based on the logic of participant selection in Ref. [Reference Faul, Erdfelder, Lang and Buchner38], 11 male flight cadets were recruited as participants for the study. Their average age was 24.3 years (SD = 3.0), and they all had extensive experience with simulated cockpit flights. They were required to be in good health, with no history of neurological disorders or genetic conditions, and have normal colour vision (without colour blindness or deficiency) and visual acuity (or corrected visual acuity) of 1.0 or above. In addition, all participants were very familiar with the composition of the cockpit PFD interface and were proficient in using it to determine flight status and various flight parameters.
2.2 Materials
In this study, all the designed PFD interfaces were employed as experimental material. There were six designs, including the original, which primarily varied in graphical symbols and font sizes of the displayed information. These five optimised interfaces were designed based on airworthiness regulations and human-machine interface design principles [Reference Taheri Gorji, Wilson, VanBree, Hoffmann, Petros and Tavakolian11, Reference Haslbeck, Kirchner, Schubert and Bengler12]. Modifications to the shapes and colours symbol, and increased font sizes aimed to more clearly and intuitively reflect the aircraft’s flight status and flight instrument data. Figure 1 displays all the stimulus interface materials used in the test.
Experimental Material: PFD Interface.

2.3 Apparatus and environment
PsychoPy software was used to control the trial flow and present interface stimuli in this experiment. PsychoPy is a widely used open-source software for experimental design and data collection in psychology and neuroscience. It enables the full flow of this experiment to be designed, controlling the random appearance of all dynamic stimulus interfaces and cognitive questions. Furthermore, it allows the recording of the participants’ reaction time and accuracy for each interface cognition.
The SMI ETG eye-tracker and ANT Neuro electroencephalograph (EEG) were used to record the eye-movement and electroencephalographic activities of the participants during the experimental task, which allowed for analysis of the cognitive processes and allocation of attention during the trial. The physical drawings of the SMI ETG eye-tracker and ANT Neuro EEG used in the experiment are shown in Fig. 2.
The SMI ETG eye-tracker and ANT Neuro EEG, photographed by the authors.

To ensure the stability of the experimental environment and the comfort of the participants, this experiment was set up in a quiet, spacious laboratory. Participants were seated in a comfortable chair facing a computer screen for the interface cognition experiment. The screen used was a 14-inch LCD monitor with a resolution of 1920x1080 pixels and the viewing distance was 60 cm. In addition, the lighting intensity in the laboratory was controlled to ensure adequate brightness and uniformity. The average brightness of the screen and the room were maintained at approximately 500 lux and 300 lux, respectively, to provide a consistent visual experience for the participants.
2.4 Task and procedure
This experiment is an interface evaluation test based on a multi-factorial design with the aim of evaluating the cockpit PFD interface and selecting the optimal interface design from five optimised designs proposed in Section 2.2. The independent variables are different cockpit PFD interface designs and different cognitive tasks for displaying the interface, while the dependent variables are the performance, psychological feelings and physiological data of the participants when performing the tasks.
The experimental task required the participants to observe the cockpit PFD interface displayed on the computer and to complete a cognitive task for each stimulus interface to judge the flight status of the aircraft and each flight parameter. To better simulate the real flight and to make the test results reliable and valid, the cockpit PFD interfaces presented to the participants were dynamic stimulus interfaces with changes in flight instruments. The cognitive flow of a PFD interface is shown in Fig. 3.
Cognitive task trials for a single PFD interface design: A description of the flow.

In this experiment, several dynamic stimulus interfaces were prepared as experimental materials for the cognitive task and these stimulus materials were presented randomly to the participants during the experiment. Prior to the presentation of the dynamic stimulus interface, participants were required to determine the cognitive task to be completed. All cognitive tasks set for this experiment are shown in Table 1. For each dynamic stimulus interface, participants were required to randomly complete one cognitive task. Following a one-second interval, the interface stimulus was then displayed. Participants were able to recognize the dynamic stimulus interface in accordance with the cognitive task corresponding to the test questions and answer options. They were then required to press the A, B, C or D key to answer the questions. To ensure consistency among all participants, each cognitive task was paired with a set of fixed options. The correct answers to these questions were predetermined based on the specific content of different dynamic PFD interface materials and the questions themselves. Following the response to the question, there was a one-second blank screen before participants proceeded to the subsequent dynamic stimulus interface for recognition.
Interface cognition tasks and testing issues

Once the answer had been entered, a one-second blank screen was presented before the next dynamic stimulus interface of the recognition commenced. Following the response to the question, a one-second interval was observed before participants proceeded to the subsequent dynamic stimulus interface for recognition. After completing the cognitive tasks for all dynamic stimulus interfaces within the current interface design, participants were required to complete two subjective scales: the NASA-TLX and the SUS. These scales were used to subjectively evaluate the current interface design in terms of workload and usability, respectively (see Section 2.5.2 for a detailed description). Finally, a three-minute break was taken and then the cognitive test of the next interface design was carried out until the cognition of all the designed interfaces had been completed.
When performing flight tasks, pilots need to constantly monitor the flight attitude, airspeed, altitude, vertical speed and other key information, to help them maintain proper flight state, ensure flight safety and avoid risks [Reference Dattel, Babin and Wang39–Reference Friedrich and Vollrath41]. A total of six interface cognitive tasks were devised based on the key display information of the PFD interface in the experiment. These tasks were accompanied by corresponding test questions, as shown in Table 1. Furthermore, changes in interface symbols primarily affect a pilot’s cognition of three types of flight information: flight state, pitch angle and roll direction, while changes in interface font sizes primarily affect a pilot’s cognition of flight state, airspeed, altitude and heading. Therefore, when designing the cognitive tasks corresponding to the different stimulus interfaces, the participants were asked to recognise the flight state, pitch angle and roll direction of the interface under the different interface symbols and to recognise the flight state, airspeed, altitude and heading of the interface under the different interface font sizes.
2.5 Data recording and analysis
2.5.1 Task performance
Task performance assessment is an objective yet direct measure of cognitive load that evaluates a subject’s level of cognitive load through the quality of their task completion [Reference Melnicuk, Thompson, Jennings and Birrell42]. In general, the lower the cognitive load of a task, the higher the level of task performance and the less time spent [Reference Xiao, Miao and Huang43].
In this experiment, reaction time and accuracy are used as performance evaluation indices to assess the ergonomics of the interface. Participants with faster reaction times and higher accuracy in recognising the interface have a lower cognitive load, indicating better ergonomic design.
2.5.2 Subjective evaluation
The assessment of the interface requires participants to recall their subjective experiences during the experimental task and evaluate the level of cognitive load in terms of mental effort, task difficulty and time pressure. The cognitive load level of the task is then assessed in terms of mental effort, task difficulty and time pressure. The most commonly used subjective assessment scales at present include the NASA Task Load Index (NASA-TLX), the System Usability Scale (SUS), the Likert scale, the Subjective Workload Assessment Technique (SWAT) scale, and others [Reference Zhang, Qu, Xue, Zhao, Li and Tao44–Reference Luzzani, Buraioli, Demarchi and Guglieri46]. The experiment evaluated the optimisation effect of the cockpit PFD interface using SUS and NASA-TLX scale as subjective assessment tools. Participants completed the scales based on their subjective feelings after each cognitive task of the interface design.
The System Usability Scale (SUS).

The NASA-TLX scale is a widely used subjective workload assessment tool designed to evaluate perceived workload in human-machine interaction tasks. As a multi-dimensional questionnaire, this scale evaluates subjective workload from six perspectives: mental demand, physical demand, temporal demand, performance, effort and frustration [Reference Prati, Villani, Grandi, Peruzzini and Sabattini47]. In this experiment, the NASA-TLX scale completed by participants was used to evaluate their workload during cognitive tasks for each interface design. The total score of the scale was obtained by summing the six individual ratings, each ranging from 0 to 20, with higher scores indicating higher subjective workload.
The SUS is commonly used to assess the usability of various products and systems. It consists of 10 items, each rated on a 5-point Likert scale ranging from 1 (strongly disagree) to 5 (strongly agree). In this experiment, the SUS scale used was an improved version of the original SUS [Reference Brooke48] to better suit the specific requirements of the study and to more accurately assess the usability of each interface design (see Fig. 4). Additionally, the SUS has a predefined procedure for calculating the total SUS score as follows [Reference Lewis49]: First, the scores of the 10 items are transformed. For odd-numbered items, subtract 1 from the score; for even-numbered items, subtract the score from 5. Then, sum all the transformed scores to get a total score. Finally, multiply this total score by 2.5 to obtain the overall SUS score. This calculation process can be expressed by the following formula:
 \begin{align}SU{S_{score}} = 2.5\left( {\sum\limits_{i \in \{ 1,3,5,7,9\} } {({x_i} - 1)} + \sum\limits_{i \in \{ 2,4,6,8,10\} } {(5 - {x_i})} } \right),\end{align}
where
 ${x_i}$
represents the score for the i-th item. After this transformation, the total SUS score ranges from 0 to 100, with higher scores indicating better system usability.
2.5.3 Objective evaluation
Objective assessment is used to evaluate the cognitive load level through the changes of human physiological indices [Reference Luzzani, Buraioli, Demarchi and Guglieri46, Reference Vanneste, Raes, Morton, Bombeke, Van Acker, Larmuseau, Depaepe and Van den Noortgate50]. Previous studies have demonstrated that physiological indicators such as electroencephalography (EEG) and eye-tracking indicators vary with cognitive load levels, and by collecting and analyzing data on these indices, cognitive load levels can be inferred [Reference He, Donmez, Liu and Plataniotis51, Reference Ayoub, Avetisian, Yang and Zhou52]. The experiment collected EEG and eye movement physiological indicators to assess the cognitive load of subjects during the interface recognition test task. The optimal design for each interface was selected by comparing the measurement results.
EEG signals can be divided into five frequency bands, namely alpha, beta, theta, delta and gamma bands [Reference Liu, Yu, Ye, Li, Zhang, Zhou, Hu and Zeng53, Reference Khanam, Hossain and Ahmad54]. When EEG frequency domain characteristics are analyzed, the activities of alpha and theta bands are usually selected to analyze the brain activity patterns of subjects [Reference McDonnell, Simmons, Erickson, Lohani, Cooper and Strayer55]. In this experiment, the parietal alpha band power spectral density (PSD) and the frontal theta band power spectral density in the frequency domain characteristics of the EEG signal were selected as evaluation indices, and in general, the parietal alpha band PSD decreases with the increase of brain load, while the frontal theta band PSD increases with the increase of brain load. By analyzing the parietal alpha band PSD and the frontal theta band PSD, we can compare the brain load of participants exposed to different interface designs.
Regarding the eye movement indicators, some scholars have found that the indicators related to the pilot’s cognitive load mainly include: pupil diameter, number of gaze points, gaze duration, blink rate [Reference Haslbeck and Zhang56–Reference Sáiz-Manzanares, Marticorena-Sánchez, Martin Anton, González-Díez and Carbonero Martín58]. Since the random cognitive tasks are explained in advance before cognizing the interface in the experiment, and the subjects already know which instrument they need to cognize in the interface, the eye movement indicators such as gaze duration and number of gaze points are not of much reference value to the results, and they cannot effectively differentiate the subjects’ cognitive load under different interfaces and cognitive tasks, so we choose blink rate and pupil diameter to analyze the subjects’ cognitive load, and then we choose the physiological eye movement indicators. Therefore, blink rate and pupil diameter were chosen to analyze the cognitive load of subjects under different interfaces and cognitive tasks. In general, the blink rate is inversely proportional to the workload, and the blink rate decreases with the increase of physiological load such as visual load, and the increase of load may also cause physiological and emotional responses such as arousal and excitement, which leads to the increase of pupil diameter [Reference Biondi, Saberi, Graf, Cort, Pillai and Balasingam59, Reference Blundell, Collins, Sears, Plioutsias, Huddlestone, Harris, Harrison, Kershaw, Harrison and Lamb60].
3.0 Result
3.1 Task performance
After excluding invalid data with extreme outliers in reaction time and accuracy, the average values of reaction time and accuracy for all participants on different cognitive tasks in interface with different symbols and font sizes are presented in Fig. 5.
The differences in reaction time and accuracy across cognitive tasks among six interface designs with different aircraft symbols and font sizes.

From the results, it could be seen that the original interface had the best task performance in the cognitive task of flight state with the least reaction time and the highest accuracy rate, while the interface with symbol 1 had the best task performance in the cognitive task of roll direction. In addition, the interface with symbol 1 had higher accuracy than the other three interfaces in the cognitive task of pitch angle, but the interface with symbol 3 had the least reaction time among the four interfaces (Table 3).
The cognitive accuracy of each task was basically at a high level across all three interface designs with different font size. The original interface had the highest accuracy in airspeed and altitude cognition task, and the interface with a 20% font enlargement had the highest accuracy in cognition of heading angle, while the interface with a 50% font enlargement had the highest accuracy in flight state cognition. Apart from the airspeed cognitive task with a 20% font enlargement, the reaction time of the participants was shorter when using the enlarged interface compared to the original. Furthermore, most cognitive tasks had a shorter reaction time with a 50% font enlargement of the interface (Table 4).
3.2 Subjective evaluation
For the NASA-TLX and SUS scales, Table 2 shows the mean values of the total scores for all valid participants under different interface designs. To highlight the optimal interface design, we used the following annotation method: bold values in the NASA-TLX scores indicate the lowest score, representing the design with the least cognitive load; bold values in the SUS scores indicate the highest score, representing the design with the highest user satisfaction.
According to the table, the interface with symbol 3 had the lowest total scores on the NASA-TLX and highest scores on the SUS among the PFD interface with different aircraft symbols. Among the interface designs with different font sizes, the table shows that font enlargement led to lower total scores on the NASA-TLX and the SUS compared to the original interface. The interface with a 20% font enlargement received the lowest NASA-TLX total score, while the original interface design received the highest SUS scale score.
Scale score results

The differences in blink rate and pupil diameter across cognitive tasks among six PFD interface with different aircraft symbols and font sizes.

3.3 Eye movement features
Figure 6 shows the average values of blink rate and pupil diameter for all participants after excluding invalid data in different interface designs and different cognitive tasks.
Mean values of effective feature metrics were calculated for the interface with different aircraft symbols and cognitive tasks
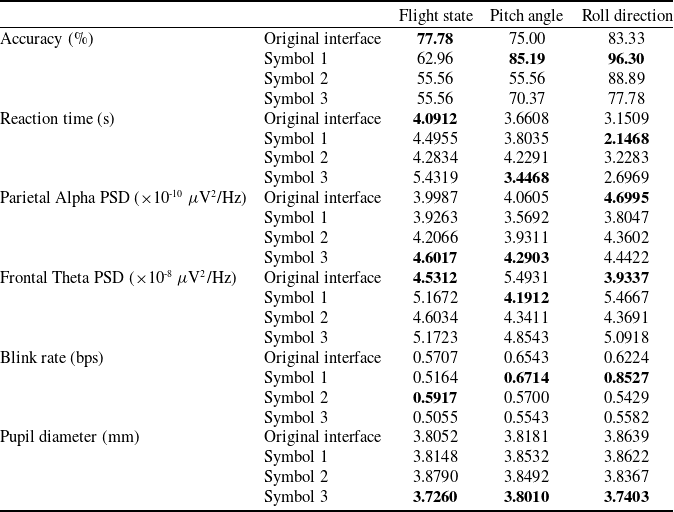
*bold text indicates that these evaluation metrics performed relatively better when participants read the corresponding interface.
Mean values of effective feature metrics were calculated for the interface with different font sizes and cognitive tasks

*bold text indicates that these evaluation metrics performed relatively better when participants read the corresponding interface.
Based on the result, it was found that when recognizing the flight state corresponding to the PFD interface, the average blink rate and average pupil diameter of participants were the largest in the interface with symbol 2 and the smallest in the interface with symbol 3. When participants recognized the pitch angle of the interface, their average blink rate and average pupil diameter was the with symbol 1, indicating that the participants had a lower cognitive load in the interface design with symbol 1. This was evidenced by the fact that the average blink rate and average pupil diameter of the original interface were the largest, indicating that the participants had a lower cognitive load under the interface design with symbol 1. The rolling direction of the interface with symbol 1 was most easily recognized, with the highest average blink rate and average pupil diameter. However, the average pupil diameter with symbol 1 did not differ significantly from the original interface, indicating that the participants had an easier time and a lower cognitive load in recognizing the rolling direction of the interface design with symbol 1 (Table 3).
The results show that the average blink rate and average pupil diameter of participants were higher in the original interface compared to the interface with increased font sizes when identifying the cognitive task corresponding flight state. When identifying the airspeed of the interface, the average blink rate of all valid participants was highest after the font size was increased by 20%, and the average pupil diameter was largest in the original interface. When considering the height of the interface, both the average blink rate and average pupil diameter were highest in the original interface. Meanwhile, when considering the heading of the interface, the average blink rate was highest in the interface with 50% increase in font size. The study found that the average pupil diameter was smallest in the interface with 50% increase in font size and decreased as the font size increased. This suggests that larger font size may lead to a relatively lower cognitive load for the heading cognition task (Table 4).
3.4 EEG frequency features
Figure 7 shows the frequency domain characteristics of the EEG signals of all participants during different cognitive tasks under different interface designs. Some invalid data were excluded due to poor electrode contact.
The differences in parietal alpha PSD and pupil diameter across cognitive tasks among six PFD interface with different aircraft symbols and font sizes.

From the results, it was found that the average power spectral density of the parietal Alpha band was higher in the interface with original symbol and symbol 3 than another two symbols in most of cognitive tasks about the different aircraft symbols, while the average power spectral density of the frontal Theta band was lower in the interface with original symbol and symbol 2 (see Table 3).
In all cognitive tasks of the interface designs with different font sizes, the average power spectral density of the parietal alpha band was higher in the interface with 50% increase in font size than in the other two interfaces. Additionally, the average power spectral density of the parietal alpha band increased with font enlargement, except for the cognition of the flight state in the interface with 20% increase in font size. In contrast, the changes in the average power spectral density of the frontal theta band exhibited minimal variability across cognitive tasks and interface designs, with no discernible pattern (see Table 4).
4.0 Discussion
Due to individual differences and the random sequence of cognitive tasks, each participant may exhibit differences in cognitive performance, cognitive load, and attention levels when faced with different interface designs. Moreover, based on the experimental results, it was found that there were some differences in the performance of each feature indicator for different cognitive tasks in the same interface. Therefore, it is not possible to determine which PFD interface design is superior, with lower cognitive load, or better cognitive effects based solely on average values.
In this section, we conducted a comprehensive assessment by combining the number of participants occupying the proportion of all valid participants in the change trend of each assessment index under different interface designs. As accuracy increased, reaction time decreased, parietal Alpha PSD increased, frontal Theta PSD decreased, blink rate increased, and pupil diameter decreased, participants’ task performance improved and cognitive load reduced. This allowed us to select the interface design that performed relatively better among all interface designs with different aircraft symbols and font sizes (see Tables 5 and 6). In Tables 5 and 6, bold text indicates that the number of participants showing improved performance in these metrics for a particular interface design exceeds 50% of the total participants, signifying that this interface design is superior.
Percentage changes in evaluation index trends for different aircraft symbols

Percentage changes in evaluation index trends for different font sizes

4.1 Discussion of the interface with different aircraft symbols
Combining Tables 2, 3 and 5, it can be observed that among the PFD interfaces with different symbols, the interface with symbol 1 exhibits better cognitive performance in tasks related to recognizing roll direction, while the original interface shows relatively lower cognitive load, and its cognitive performance is comparable to that of symbol 1. In tasks related to recognizing pitch angle, although the interface with symbol 2 has lower cognitive load compared to other interface designs, its cognitive performance is poorer and more prone to misleading information. The cognitive effects of the interfaces with other three symbols are similar. In tasks related to recognizing flight state, the cognitive performance and cognitive load of the original interface are generally better than those of the other three symbols, indicating relatively superior cognitive effects.
Therefore, among the various interface designs with different aircraft symbol, the original interface is the most conducive to aircraft flight, as it ensures both cognitive effect and cognitive load are not excessive.
4.2 Discussion of the interface with different font sizes
Combining Tables 2, 4 and 6, it was found that most participants performed better with the interface with 50% font size enlargement compared to the original interface design and the interface with 20% font size enlargement. The interface with 50% font enlargement achieved greater improvements in accuracy, reaction time, and brain load reduction. The trend of improved cognitive performance and reduced cognitive load was particularly evident in the flight state and heading cognition tasks. However, the performance of the interface in airspeed and altitude cognition tasks is inferior to that of the original interface and the interface with a 20% font size enlargement. This issue may be caused by oversized fonts, which can negatively impact the aesthetics and integrity of the data displayed on the airspeed and altitude indicators, leading to relatively poor readability and a poor cognitive effect.
Therefore, through optimizing the font size of the original PFD interface, we can appropriately increase the font size while ensuring the harmony and practicality of the displayed information, to maintain the readability of the PFD interface. This will increase the search efficiency and accuracy of the information displayed on the PFD interface, resulting in a PFD interface that reduces the cognitive load of pilots and ensures flight safety.
4.3 Limitation
In this study, we conducted interface cognition experiments on a computer, investigating the preliminary effects of interface symbols and font sizes on pilot visual cognition through various objective and subjective physiological indicators. We conducted initial screening to optimize the interface design and identify relatively superior designs.
However, compared to dynamically experiencing various cockpit PFD interfaces in a simulated cockpit, this study has limitations. Experimental outcomes may differ from those obtained in dynamic experiments conducted in a simulated cockpit, where participants experience greater immersion. Task performance and workload may vary accordingly, leading to potentially different impacts of different cockpit PFD interface designs on participants compared to the current static experiment. This is a limitation of our current research. In future studies, we plan to integrate selected optimized interfaces into simulated cockpits and conduct dynamic experiments. We will employ visual cognition or attention assessment models to gain deeper insights into how these design factors affect pilot visual cognition and task performance.
5.0 Conclusion
This study is oriented to the optimization design of the cockpit main flight display interface. It optimizes the symbols reflecting the aircraft’s flight status and the interface font size, resulting in three optimized symbol interface designs and two optimized font interface designs. In addition, the ergonomics of the PFD interfaces before and after optimization are verified through interface cognition experiments. The results indicate that only the interface with original symbol design can reduce the cognitive load while ensuring task performance, which is more conducive to pilots’ perception and comprehension of the aircraft’s flight status. As for the interface design with increased font size, it can be observed that the cognitive performance is enhanced with increased font size, while the cognitive load is relatively lower. Furthermore, the ergonomics of the interface with increased font size is superior to that of the original PFD interface design.
This study provides experimental support and optimization suggestions for the optimal design of cockpit PFD interfaces. When optimizing PFD interface design, it is advisable to select symbols that are prominently shaped yet harmonious with the overall interface, colored to distinguish from the background without appearing abrupt. Additionally, the font size should be moderate, balancing readability without overwhelming or impairing pilot cognition.
However, this study also has certain limitations, such as incomplete coverage of design factors and a relatively limited number of participants. Conducting static experiments on a computer may not fully capture the dynamics observed in simulated cockpit experiments. Future studies can further explore the effects of various design factors on pilots’ visual cognition, such as color, layout, etc. In addition, these design factors can be combined and optimized to enhance the visual comfort and cognitive effects of the PFD interface, thereby further promoting the improvement and optimization of the cockpit PFD interface. This aims to design cockpit display interfaces that are more compatible with the cognitive characteristics of pilots, thereby enhancing their cognitive efficiency and flight safety.
Acknowledgments
This paper was financially supported by the Joint Fund of National Natural Science Foundation of China and Civil Aviation Administration of China (No. U2033202, U1333119); the National Natural Science Foundation of China (No.52172387); the Fundamental Research Funds for the Central Universities (ILA22032-1A); and the Aeronautical Science Foundation of China (2022Z071052001); and the Postgraduate Research & Practice Innovation Program of NUAA (xcxjh20230729).



