INTRODUCTION
Savannas, defined as spatial mosaics of herbaceous and woody plant-dominated patches, form 15–25% of the world's terrestrial vegetation (Asner et al. Reference ASNER, ELMORE, OLANDER, MARTIN and HARRIS2004). Most savannas are intermingled with gallery forests, characterized by dense tree cover and competition for light, along waterways (Natta Reference NATTA2000). Savanna is highly flammable and tree species adapt to the environment through large investment in carbohydrate reserves (Hoffmann et al. Reference HOFFMANN, ORTHEN and FRANCO2004), root biomass (Hoffmann & Franco Reference HOFFMANN and FRANCO2003) and bark (Hoffmann et al. Reference HOFFMANN, GEIGER, GOTSCH, ROSSATTO, SILVA, LAU, HARIDASAN and FRANCO2012b) which contribute to the slow growth of savanna species and their apparent inability to recruit in forest. In gallery forest, gullies provide soils with greater water availability and closed canopies limit grassy fuel loads (Hoffmann et al. Reference HOFFMANN, ADASME, HARIDASAN, CARVALHO, GEIGER, PEREIRA, GOTSCH and FRANCO2009), increase relative humidity and decrease temperature and wind speed (Cochrane Reference COCHRANE2003) that protect gallery forest from fire within a flammable savanna matrix (Murphy & Bowman Reference MURPHY and BOWMAN2012). Savanna and gallery forest could therefore be regarded as stable ecosystems maintained by fire and vegetation in protected areas of tropical Africa. The combination of slow growth and shade intolerance may prevent savanna species to establish in gallery forest (Hoffmann et al. Reference HOFFMANN, GEIGER, GOTSCH, ROSSATTO, SILVA, LAU, HARIDASAN and FRANCO2012b) while sensitivity to fire (Gignoux et al. Reference GIGNOUX, LAHOREAU, JULLIARD and BAROT2009, Hoffmann et al. Reference HOFFMANN, ORTHEN and FRANCO2004), water stress (Hoffmann et al. Reference HOFFMANN, ORTHEN and FRANCO2004) and nutrient limitation (Bowman & Panton Reference BOWMAN and PANTON1993) may hinder the ingression of forest species in savanna. If those results prove valid, sharp spatial boundaries are expected between gallery forest and savanna (Schröder et al. Reference SCHRÖDER, PERSSON and DE ROOS2005). Boundaries often span just a few metres, accompanied by extremely abrupt changes in tree cover, light availability, temperature, grass abundance and fire activity (Bowman Reference BOWMAN2000, Hoffmann et al. Reference HOFFMANN, ADASME, HARIDASAN, CARVALHO, GEIGER, PEREIRA, GOTSCH and FRANCO2009). The abrupt changes in the distribution of tree species at gallery forest–savanna boundaries have received much less attention than the importance of environmental factors controlling savanna–forest transitions. Geiger et al. (Reference GEIGER, GOTSCH, DAMASCO, HARIDASAN, FRANCO and HOFFMANN2011) found few adult forest species expanding in fire-suppressed savanna despite the high diversity of forest trees but savanna trees were absent in forest. Superimposing change in environmental conditions with changes in species occurrence and abundance will provide new insights into species’ ability to adapt in harsh environments and initiate the dynamics of gallery forest–savanna boundaries. Identifying thresholds between where a species is present (or abundant) and absent (or rare) and determining environmental factors associated with these thresholds is a critical step for understanding the dynamics of species distribution (Fortin et al. Reference FORTIN, KEITT, MAURER, TAPER, KAUFMAN and BLACKBURN2005).
There is still little consensus regarding the relative contribution of climate, fire, hydrology, herbivory and soil properties in mediating the balance between forest and savanna (Geiger et al. Reference GEIGER, GOTSCH, DAMASCO, HARIDASAN, FRANCO and HOFFMANN2011, Good & Caylor Reference GOOD and CAYLOR2011, Hirota et al. Reference HIROTA, NOBRE, OYAMA and BUSTAMANTE2010). At large spatial scales, climate, especially rainfall, is the overwhelming driver of forest distribution. However, at some landscape and regional scales, this relationship breaks down and edaphic and topographic factors are clearly important in controlling the distribution of savanna and forest (Murphy & Bowman Reference MURPHY and BOWMAN2012).
Because tree species traits to cope with biotic and environmental constraints in savanna seem to be inefficient in gallery forest and vice versa, the hypothesis that the differences in species traits would result in non-overlapping distributions of savanna and gallery-forest species across savanna–forest boundaries appears to be plausible. Also, we predicted that non-overlapping distribution of gallery-forest and savanna species may result in abrupt changes in both the occurrence frequency and relative abundance of tree species along the gallery forest–savanna gradient. These expectations were tested by collecting data on tree abundance in the Biosphere Reserve of Pendjari, a tropical landscape protected from anthropogenic disturbance. This spatial scale allowed the test of the hypothesis that the gallery forest–savanna gradient expresses variation in the physical properties of soil, fire occurrence and erosion.
STUDY SITE
Data were collected in the Biosphere Reserve of Pendjari located in the savanna zone of the Republic of Benin in the district of Atacora (10°30′–11°30′N, 0°50′–2°00′E). It covers an area of 4661 km2 and is composed of the National Park of Pendjari (2660 km2), the hunting zone of Pendjari (1750 km2) and the hunting zone of Konkombri (251 km2). The Biosphere Reserve of Pendjari is ecologically interesting because it has not been managed for timber production and its spatial structure is largely the outcome of natural processes. Here, the vegetation is annually burned by the managers to provide fodder to bovid species in the dry season (PAG2 2005). The Pendjari is the only important river in the reserve that carries water throughout the year. It runs through the National Park of Pendjari and the Pendjari hunting zone. Other small streams dry out in the dry season including the Magou, Bori and Yapiti in the hunting zone of Pendjari and the Podiega in the National Park (Delvingt et al. Reference DELVINGT, HEYMANS and SINSIN1989). Gallery forest along these rivers contrasts with tree and shrub savannas that dominate the vegetation on the reserve (Sokpon et al. Reference SOKPON, AFFOUKOU, AMAHOWE, GANDJI, GNONLONFIN and SOSSOU2008). Four soil types were recorded in the protected area: rock outcrops, ferruginous soil, clayey soil and silty soil, the last two of which were found in flooded zones. The park is located in the Sudanian zone with one rainy season (April/May to October) and one dry season (November to March). The total annual rainfall averages 1000 mm with 60% falling between July and September. During the rainy season, large parts of the park are flooded. The mean annual daily temperature is 27 °C. In addition, the relative humidity varies between 17% and 99% during the year.
METHODS
Sampling design and data collection
Data were collected in the dry season after the annual vegetation fire along 40 transects perpendicular to the riverbed, which is considered the source of the spatial gradient. Transects were 3 km long and starting points were chosen to avoid the crossing of consecutive transects on the same bank. A minimum distance of 1 km separated consecutive transects. Thirteen plots of 1500 m2 (30 × 50 m) were established on each transect, and the plot length was perpendicular to the transect. Since it was anticipated that vegetation change would be more rapid in the zone immediately adjacent to the river than at a greater distance from it, the plots were located at 20, 70, 120, 170, 220, 300, 400, 500, 750, 1000, 1500, 2000 and 3000 m from the riverbed and were described by geographical coordinates and vegetation type (i.e. gallery forest, woodland, tree savanna, shrub savanna and outcrop savanna). In each plot, the diameter of the trees and shrubs whose diameter at breast height (dbh) was greater than 10 cm was measured and recorded. This minimum dbh ensures that the trees or shrubs are vigorous enough to resist fire and keep their top alive, which allows for species identification in the field and botanical collection for species confirmation at the National Herbarium of Benin following Akoegninou et al. (Reference AKOEGNINOU, VAN DER BURG, VAN DER MAESEN, ADJAKIDJE, ESSOU, SINSIN and YEDOMONHAN2006). Soil physical properties were assessed in the field and identified as clayey, ferruginous, rock outcrop or silty. Erosion and fire occurrence were recorded in binary as 0 (absence) or 1 (occurrence). Evidence of fire occurrence was based on the last burning before the field work (1–3 mo before data collection). All of these site factors known to determine tree species distribution were measured to analyse their relationship with the spatial gradient.
A total of 145 plots among the 520 sampled sites were removed from the data analysis due to their location on roads or outside the protected area, or due to the absence of trees and shrubs of > 10 cm dbh. Finally, tree and shrub species densities were measured from 375 sampling stations covering a total sample area of 56.25 ha.
Data analysis
Overlap between the distribution of gallery-forest and savanna species was estimated by investigating the co-occurrence and the distribution patterns of species. Co-occurrence patterns were assessed by computing the frequency of plots where each species pair is jointly recorded. The results were presented using a corrgram (an advanced graphical tool) and were only computed for the 19 species that occurred at more than 35 sites, in order to reduce the number of variables in the figure. Given that species distribution can have an influence on co-occurrence patterns, a scatter plot of the occurrence of each species according to its mean density was graphed in order to classify species as gregarious, common or rare; these calculations were performed on all 68 species recorded.
To identify abrupt changes in the distribution of tree species along the gallery forest–savanna gradient, Thresholds Indicator Taxa ANalysis (TITAN) was used on the dataset, following Baker & King (Reference BAKER and KING2010). Tree species abundances were log-transformed (y = log10(x + 1)) to reduce the influence of highly variable species on indicator score calculations, which was particularly important for species with low occurrence frequencies. Twenty-two species with an occurrence frequency of less than five were removed. Midpoints between locations of consecutive plots were used as candidate change points (xi) to iteratively split plots into two groups. For each species, indicator value (IndVal) scores were calculated from samples grouped below and above each value of xi (see Dufrêne & Legendre Reference DUFRÊNE and LEGENDRE1997 for details on IndVal calculations). The IndVal score estimates the association of each species to each group. IndVal is scaled from 0–100% with a value of 100% indicating that the species was collected in every sample within a group and not in any other group. IndVals were compared above and below each xi and the greater score was retained. Once the maximum IndVal was identified across all xi, the observed change point xcp was made the corresponding value of x. Based on this, each species was assigned to either negative or positive response groups with respect to x. Negatively responding species are species that decline in density as the distance to the river increases. On the other hand, species showing positive response increase in density as the distance to the river increases. The previous operations were repeated with each of the 250 random permutations of x to estimate the frequency of obtaining a random IndVal higher than the observed maximum IndVal (p), as well as the mean and standard deviation of random IndVals. To identify ecological community thresholds from multiple species and change points, the observed IndVals were standardized as z scores using the mean and standard deviation of permutated IndVals (Baker & King Reference BAKER and KING2010). Rather than raw IndVal magnitudes, which would favour the most widely distributed or abundant species, standardization facilitates cross-species comparison by emphasizing the change in IndVals across candidate splits given a specific pattern of abundance and occurrence. Rare or infrequently occurring species with smaller IndVal magnitudes can have a very strong z score if their response to environmental change is dramatic (Baker & King Reference BAKER and KING2010). The z scores of individuals were summed by response-group assignment for each candidate change point xi. Standardized responses of species increasing in density at the change point (z+) are distinguished from those species decreasing in density (z-) and those species showing no response. Evidence for community-level thresholds among species increasing in density and those decreasing in density is assessed separately by tabulating and summing all z- and z+ scores for each value of x. The value(s) of x resulting in the largest cumulative z scores for negative [sum(z-)] and positive [sum(z+)] responses correspond to the maximum aggregate change in the frequency and abundance of their respective species. Large values of sum(z) scores occur when many species have strong responses at a similar value on the environmental gradient, whereas weak or variable responses result in lower sum(z) values without a distinctive maximum (Baker & King Reference BAKER and KING2010). All previous steps were repeated with 500 bootstrap replicates of 375 plots. Bootstrap was used to estimate empirical confidence limits for sum(z-), sum(z+) and species change points. Purity was calculated for each species as the proportion of bootstrap replicates whose group assignment matches the observed assignment, and reliability was computed as the proportion of replicates whose maximum IndVal p were less than 0.05 and 0.01 (Baker & King Reference BAKER and KING2010). The mean and the 5th, 10th, 50th, 90th and 95th quantiles of gallery-forest and fire-free-zone widths were computed to compare community-level thresholds to vegetation type and fire occurrence.
Accuracy of the gallery forest–savanna gradient as well as the contribution of soil physical properties, fire and erosion to predict the distribution of tree species at gallery forest–savanna boundaries were assessed by performing fuzzy set ordination (FSO). FSO estimates the relative distance to the river for each plot, based on its vegetation composition (Roberts Reference ROBERTS1986). A dissimilarity matrix was calculated using the Bray–Curtis dissimilarity. FSO results were tested by correlating the estimated relative distance to the river with the true distance. Through linear regression, soil physical properties, fire and erosion were tested for their contribution to the variability along the FSO, expressed as the scatter of the residuals. Positive residuals are plots that appear to be at a greater distance to the river than the true value, and negative residuals are plots that appear to be closer to the river than reality. The summary of the regression was first computed to obtain the signs and coefficients, and then Analysis of Variance (ANOVA) was carried out to check for sequential significance. The ecological effect of each factor was then expressed as a percentage of the range of residuals.
All analyses were carried out using the software package R (version 2.13.1). The corrgram was produced in the lattice package following R codes supplied by Zuur et al. (Reference ZUUR, IENO and ELPHICK2010). Threshold analysis was performed with the custom package TITAN, built by Baker & King (Reference BAKER and KING2010). Finally, the FSO, linear regression and ANOVA were computed using the LabDSV and FSO packages for the R system.
RESULTS
Species co-occurrence and distribution patterns
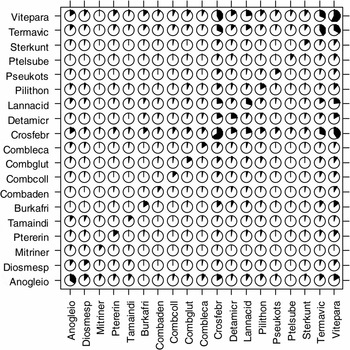
Frequencies of joint presence calculated for the 19 species that occurred at more than 35 plots revealed that most species pairs co-occurred in fewer than 20% of plots (Figure 1). Only a few savanna species (Crossopteryx febrifuga, Lannea acida, Terminalia avicennioides and Vitellaria paradoxa) made exception to this trend, showing co-occurrence frequencies ranging from 22–43%. On the other hand, some subgroups of savanna species (Burkea africana, Combretum adenogonium, Detarium microcarpum and Pteleopsis suberosa) and gallery-forest species (Diospyros mespiliformis, Mitragyna inermis and Tamarindus indica) rarely co-occurred at the same site.
Corrgram showing the frequency with which pairs of tree species occurred in the same plot along the gallery forest–savanna gradient in the Biosphere Reserve of Pendjari. Only the 19 species that occurred at more than 35 sites are shown in alphabetical order of species code according to their habitat. From left to right on the x-axis and bottom to top on the y-axis, the first five species are more abundant in gallery forest while the remaining are savanna trees. The amount that a circle has been filled corresponds to the proportion of joint presence observations of species pair. The diagonal running from the bottom left to the top right where species pairs are couple of the same species represents the percentage of plots where each species was observed. Eight-letter acronyms represent the different tree species. The species codes are the first four letters of the genus and species. See Appendix 1 for full names.

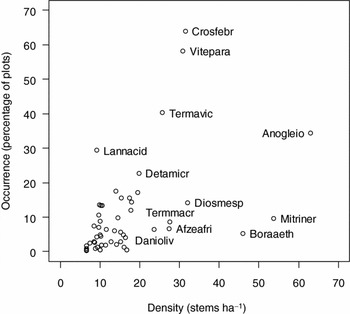
In Figure 1, the diagonal from the bottom left to top right represents the percentage of sites where a species occurred. Most of the species occurred in less than 20% of the sites except for Detarium microcarpum (22.7%), Lannea acida (29.3%), Anogeissus leiocarpa (34.4%), Terminalia avicennioides (40.3%), Vitellaria paradoxa (58.1%) and Crossopteryx febrifuga (64%). These common species also had high densities (Figure 2). Among them, Anogeissus leiocarpa, showing the highest density with fair occurrence, was found in gregarious stands. In contrast, some species had low occurrence combined with high density. Among these, Mitragyna inermis was multi-stemmed while Terminalia macroptera, Diospyros mespiliformis, Afzelia africana, Daniellia oliveri and Borassus aethiopum had clumped distribution. Other species occurred at low density in very few plots. This was the case of shrub species that rarely reached 10 cm in dbh, especially Acacia macrostachya, Combretum micranthum, Feretia apodanthera, Gardenia spp., Guiera senegalensis, Securidaca longepedunculata and Ximenia americana. Trees species fulfilling the condition of low occurrence combined with low density were rare species that included Andira inermis var. rooseveltii, Bombax costatum, Clausena anisata, Ficus vallis-choudae, Markhamia tomentosa, Millettia thonningii, Oncoba spinosa, Ozoroa insignis and Prosopis africana.
Abundance and occurrence patterns in the distribution of tree species along the gallery forest–savanna gradient in the Biosphere Reserve of Pendjari. The x-axis refers to the abundance expressed as mean stem density of each species in the plots where it was recorded. The y-axis refers to the percentage of plots in which each species was observed over the 375 sampled stations. Eight-letter acronyms represent the different tree species. The species codes are the first four letters of the genus and species. For example, Mitragyna inermis (Mitriner) was established at high density but in restricted sites with low occurrence, while Crossopteryx febrifuga (Crosfebr) was established at median density, but was the most common species occurring in more than 60% of the plots. For the complete list and species codes see Appendix 1.

Ecological community thresholds and indicator species
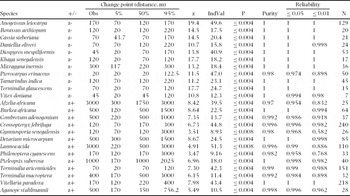
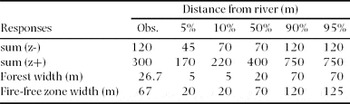
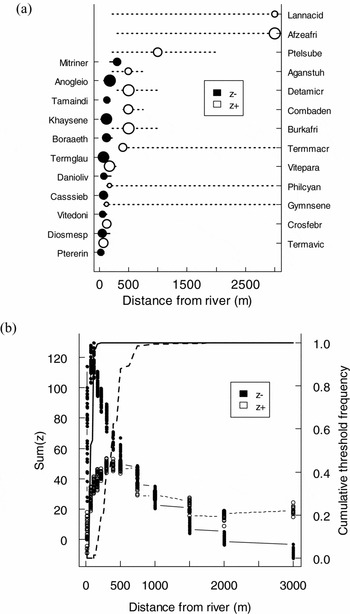
The threshold analysis categorized the 46 species as increasing or decreasing in density along the gallery forest–savanna gradient, while the diagnostic indices helped distinguish the relative information content in species-specific distributions. As the distance to the river increased, 24 species declined in density. Forty-two per cent of these species were both reliable (i.e. mean reliability over 500 dataset iterations ≥ 0.95 for P ≤ 0.05 and P ≤ 0.01) and pure indicators (mean purity over 500 iterations ≥ 0.95), including Anogeissus leiocarpa, Borassus aethiopum, Cassia sieberiana, Daniellia oliveri, Diospyros mespiliformis, Khaya senegalensis, Mitragyna inermis, Tamarindus indica, Terminalia glaucescens and Vitex doniana (Table 1). Most of the species decreasing in density (z-) declined sharply at 45–120 m to the river, resulting in a distinct peak in sum(z-) at 120 m (Figure 3a, b; Tables 1 and 2). The strong synchrony of change in many species at small distances to the river was consistent with an ecological community threshold. This threshold was beyond the width of the gallery forest and stretched over the shrub and tree savannas. Species driving this trend included Anogeissus leiocarpa, Borassus aethiopum, Cassia sieberiana, Daniellia oliveri, Khaya senegalensis, Mitragyna inermis, Tamarindus indica and Terminalia glaucescens. The observed change point of these species ranged from 70–300 m while the width of the gallery forest varied between 5–70 m (Tables 1 and 2). The observed community threshold for gallery-forest species was also greater than the mean width of the fire-free zone. However, their empirical confidence limits overlapped, meaning that the difference was not significant.
Species-specific results from the Threshold Indicator Taxa Analysis (TITAN) of tree community response to the distance from the river gradient (m) in the Biosphere Reserve of Pendjari. The observed (Obs.) distance change point is shown for each species. Lower (5%), middle (50%) and upper (95%) values correspond to change point quantiles for 500 bootstrap replicates. z represents the standardized TITAN indicator score and IndVal is the unstandardized indicator score (scaled from 0–100%, with 100 = perfect indicator). P is the probability of getting an equal or larger IndVal based on 250 random permutations of the data, purity is the proportion of correct assignments as a negative (z–) or positive (z+) threshold indicator among 500 bootstrap replicates, and reliability is the proportion of 500 bootstrap replicates in which P ≤ 0.05 and P ≤ 0.01. N is the frequency of species occurrence among 375 sites. Only the species that met significance criteria for P (≤ 0.05), purity (≥ 0.95) and reliability (≥ 0.95 and ≥ 0.50 for 0.05 and 0.01, respectively) are included in this table.

TITAN community-level thresholds estimated from tree species responses to the distance from the river gradient (m) in the Biosphere Reserve of Pendjari. TITAN observed change points (Obs.) and bootstrap 5th, 10th, 50th, 90th and 95th quantiles of change points (median among 500 simulation iterations) correspond to the value of the distance resulting in the largest sum of the indicator value (IndVal) z scores among all negative (z–) and positive (z+) species, respectively (see Figure 3b). The mean and the 5th, 10th, 50th, 90th, and 95th quantiles of the width of forest gallery and fire-free zone are added to compare the community-level thresholds to vegetation type and fire occurrence.

Species-specific (a) and community-level (b) results from the Threshold Indicator Taxa Analysis (TITAN) of tree community response to the distance from the river gradient in the Biosphere Reserve of Pendjari (n = 375). Pure (≥ 0.95) indicator species are plotted in increasing order with respect to the distance where their occurrence frequency and relative abundance abruptly change. Black-filled symbols correspond to species that decreased in abundance and frequency (z-) at greater distance from the river, whereas unfilled corresponds to species that increased in abundance and frequency (z+) along the gallery forest-savanna gradient. Symbols are sized in proportion to z scores. Horizontal lines overlapping each symbol represent 5th and 95th percentiles among 500 bootstrap replicates. The species codes are the first four letters of the genus and species. Species codes are explained in Appendix 1. TITAN sum (z-) and sum (z+) values correspond to all candidate change points (distance i) along the spatial gradient. Black and dash vertical lines represent the cumulative frequency distribution of change points (thresholds) among 500 bootstrap replicates for sum (z-) and sum (z+), respectively.

Contrary to gallery-forest species, 22 species increased in density at farther distances from the river. Only 32% of these species were both reliable (i.e. mean reliability over 500 dataset iterations ≥ 0.95 for P ≤ 0.05 and P ≤ 0.01) and pure indicators (mean purity over 500 iterations ≥ 0.95), including Burkea africana, Crossopteryx febrifuga, Detarium microcarpum, Pteleopsis suberosa, Terminalia avicennioides and Vitellaria paradoxa (Table 1). Species increasing in density (z+) were widely distributed along the spatial gradient, spanning most of the range of values and approximating a linear distribution of observed species change points with increasing distance from the river (Figure 3b). The asynchronous distribution of their change points means that the corresponding maximum of their sum(z+) gave a relatively weak (poorly defined) peak at 300 m from the river (Figure 3b). Further, savanna species exhibited relatively wide bootstrap frequency distributions representing substantial uncertainty about the existence of a threshold because of gradual increases in frequency and abundance (Figure 3a). For instance, savanna species such as Afzelia africana, Gymnosporia senegalensis, Lannea acida, Philenoptera cyanescens, Pteleopsis suberosa and Terminalia macroptera had bootstrap distributions greater than 1800 m (Table 1).
The distribution of most of the change points for savanna species only marginally overlapped with the majority of gallery-forest species. In both groups, the species with higher overall frequencies tended to have higher raw IndVals, but not necessarily higher z scores (Table 1). Rather, gallery-forest species had higher z scores, confirming that their response to environmental change is strong.
Spatial gradient and nested effects of site factors
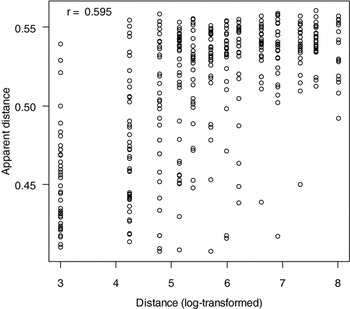
The relationship between log-transformed distance and ‘apparent distance’ was very close, with a correlation of 0.595 (Figure 4). This means that on average, the distance of a sample from the river can be predicted by its floristic composition fairly well. Therefore, the site factors that correlated with the distance from the river exerted a significant influence on the vegetation composition. The scattered points that do not lie on the diagonal suggest, however, that other factors considerably modify the influence of the distance to the river. In other words, some plots supported vegetation typical of a distance other than that at which they occurred.
Fuzzy set ordination of sample plots along a gallery forest–savanna gradient in the Biosphere Reserve of Pendjari. The x-axis is a logarithm of the direct gradient of distance and the y-axis is considered the apparent distance, which expresses the typical distance of the plot according to its vegetation composition. The coefficient r refers to the correlation between the original values of distance of plots from river (log transformed) and the fuzzy set apparent distance values.

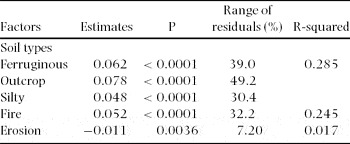
Outcrop, ferruginous and silty soils were positively and significantly associated with residuals (Table 3). The coefficients for the effects of outcrop, ferruginous and silty soils on the distance residuals were respectively +0.078, +0.062 and +0.048. These results suggest the following succession of soil physical properties when moving from the gallery forest to the savanna: clayey soil, silty soil, ferruginous soil and outcrop. Likewise, the burned sites appeared to be at a greater distance from the river than reality, with the effect on distance residuals being +0.052 (Table 3). This is about 32% compared with the range of the residuals, confirming that at further distances from the river, vegetation was more prone to fire. In contrast to fire occurrence, erosion was negatively and significantly associated with the residuals (Table 3). Its effect on distance was only −0.011 and covered 7% of the range of the residuals.
Contribution of soil types, fire and erosion to the variability in the fuzzy set ordination of sample plots along a gallery forest–savanna gradient in the Biosphere Reserve of Pendjari. Estimates express the sign and coefficient of linear regression between site factors and the residuals of the fuzzy set ordination. The sequential significance (P) is shown as well as the range of residuals that corresponds to the ecological effect of each factor. R-squared is the percentage of variability of residuals of the fuzzy set ordination that each factor explains.

FSO showed a primary gradient of the distance to the river, with local effects of vegetation fire and soil physical properties exhibiting importance on the distance.
DISCUSSION
Gallery-forest and savanna dynamics are likely to be strongly controlled by demographic processes (Murphy & Bowman Reference MURPHY and BOWMAN2012). A snapshot study on the distribution of tree species along a gallery forest–savanna gradient offers the opportunity to describe the patterns that could drive boundary shifts. The findings support the hypothesis that the differences in species traits result in non-overlapping distributions of savanna and gallery-forest species across savanna–forest boundaries. It was uncommon to jointly record gallery-forest and savanna species at the same site. This result is in line with several earlier studies, where the floristic composition of forests has been found to differ from the surrounding savanna tree community (Hoffmann et al. Reference HOFFMANN, ADASME, HARIDASAN, CARVALHO, GEIGER, PEREIRA, GOTSCH and FRANCO2009, Nangendo et al. Reference NANGENDO, TER STEEGE and BONGERS2006, Ratnam et al. Reference RATNAM, BOND, FENSHAM, HOFFMANN, ARCHIBALD, LEHMANN, ANDERSON, HIGGINS and SANKARAN2011). Unexpectedly, low co-occurrence frequencies were observed among species that belong to the same habitat. This could be due to the biology of the species studied, most of which have highly clumped distributions or are rare. It highlights the limitations of the use of species occurrence as a proxy for unmeasured abiotic conditions and species interactions. The main issue of this approach is that non co-occurring species pairs could be interpreted either as the result of competitive exclusion or occupation of different environmental niches (Gilpin & Diamond Reference GILPIN and DIAMOND1982). However, it does not distort the findings that are confirmed by the species-specific results from the threshold indicator taxa analysis. Indeed, threshold analysis showed a clear pattern of similar distribution of species belonging to the same habitat and non-overlapping distributions of savanna and gallery-forest species. Estimation of species-specific change points is arguably the key output from TITAN because this information is precisely what many aggregate community metrics obscure (Baker & King Reference BAKER and KING2010). The scarcity of common species along the gallery forest-savanna gradient corroborate that in ecological communities, a few species are exceptionally abundant, whereas most are rare (Magurran & Henderson Reference MAGURRAN and HENDERSON2003). Because trees and shrubs must reach a minimum dbh of 10 cm to be recorded, the classification of species as rare should be treated with caution to distinguish species that rarely reach 10 cm in diameter (shrubs) from rarely observed species. Most of the shrub species recorded during this study are common in the Biosphere Reserve of Pendjari (Akoegninou et al. Reference AKOEGNINOU, VAN DER BURG, VAN DER MAESEN, ADJAKIDJE, ESSOU, SINSIN and YEDOMONHAN2006) but have few individuals with dbh greater than 10 cm. So, shrub species showed the same occurrence and abundance patterns with rare tree species.
These non-overlapping distributions of gallery-forest and savanna species result in abrupt changes in both the occurrence frequency and relative abundance of tree species along the gallery forest–savanna gradient. Only gallery-forest species had a community threshold while savanna species gradually increased in density. Because samples were compared between savanna and gallery forest, species recorded in this study are indicators of woody community composition (Bakker Reference BAKKER2008, Zacharias & Roff Reference ZACHARIAS and ROFF2001). Interestingly, threshold in the distribution of gallery-forest species extended beyond their habitat and coincide with fire-free zone in savanna. This result may partially be an artefact of the analysis because the spacing of the plots sets a minimum threshold at 45 m from the stream which is wider than most forest. However, it does not distort the findings given that the observed threshold of 120 m is three times the minimum value. The coincidence between the observed community thresholds for gallery-forest species and the width of the fire-free zone is compatible with the tendency of fire to control the boundaries of gallery forest and savanna (Bond Reference BOND2008, Hoffmann et al. Reference HOFFMANN, GEIGER, GOTSCH, ROSSATTO, SILVA, LAU, HARIDASAN and FRANCO2012b, Staver et al. Reference STAVER, ARCHIBALD and LEVIN2011). The existence of fire-free zone that enables gallery-forest species to establish in savanna points out the multitude of factors that influence flammability. Near gallery forest, persistent flooding that lasts from the end of the rainy season to the middle of the dry season may prevent early management fires burning the moist grass layer. Grazers can render a savanna non-flammable by consuming fine fuels (Holdo et al. Reference HOLDO, HOLT and FRYXELL2009, Midgley et al. Reference MIDGLEY, LAWES and CHAMAILLE-JAMMES2010). Isolated trees can also reduce flammability (Holdo Reference HOLDO2005, Stevens & Beckage Reference STEVENS and BECKAGE2009), and mosaics of non-flammable vegetation patches may prevent fire spread even though the majority of a landscape is flammable (Collin et al. Reference COLLIN, BERNARDIN and SERO-GUILLAUME2011).
The distributions of tree species at savanna–forest boundary have been well described from fire-exclusion experiments conducted in mesic savanna of tropical Africa (Hennenberg et al. Reference HENNENBERG, GOETZE, KOUAME, ORTHMANN and POREMBSKI2005, Swaine et al. Reference SWAINE, HAWTHORNE and ORGLE1992), Australia (Banfai & Bowman Reference BANFAI and BOWMAN2007, Russell-Smith et al. Reference RUSSELL-SMITH, STANTON, WHITEHEAD and EDWARDS2004) and Brazil (Geiger et al. Reference GEIGER, GOTSCH, DAMASCO, HARIDASAN, FRANCO and HOFFMANN2011), which demonstrate that fire exclusion is followed by the invasion of trees and the establishment of forest. There are, however, exceptions to this generalization, with some fire-exclusion experiments failing to produce shifts from savanna to forest after several decades, pointing to additional limiting factors (Bond et al. Reference BOND, MIDGLEY and WOODWARD2003, Higgins et al. Reference HIGGINS, BOND, FEBRUARY, BRONN, EUSTON-BROWN, ENSLIN, GOVENDER, RADEMAN, O'REGAN, POTGIETER, SCHEITER, SOWRY, TROLLOPE and TROLLOPE2007). In annually burned areas, forest species are excluded from the savanna at the seedling stage (Gignoux et al. Reference GIGNOUX, LAHOREAU, JULLIARD and BAROT2009). However, our findings suggest the establishment of some gallery-forest tree species (Anogeissus leiocarpa, Cassia sieberiana, Daniellia oliveri, Khaya senegalensis and Tamarindus indica) in savanna despite frequent fires.
Fuzzy set ordination supports the hypothesis that the gallery forest–savanna gradient expresses variation in the physical properties of soil, fire occurrence and erosion. Indeed, these environmental factors exerted a significant influence on the vegetation composition. The correlation between the distance of a sample from the river and its floristic composition provides statistical support that the use of spatial gradient is relevant in vegetation surveys at a forest–savanna boundary (Braithwaite & Mallik Reference BRAITHWAITE and MALLIK2012, Geiger et al. Reference GEIGER, GOTSCH, DAMASCO, HARIDASAN, FRANCO and HOFFMANN2011). The negative effect of erosion on distance was expected, since the erosion resulted from increasing intensity of run-off from the uplands towards the rivers. The positive effect of fire on distance confirms the higher flammability of savanna. In the transition between savanna and gallery forest, multiple factors contribute to the decline in flammability as tree cover increases. Compared with open habitats, the forest understorey is characterized by the lack of C4 grasses (Ratnam et al. Reference RATNAM, BOND, FENSHAM, HOFFMANN, ARCHIBALD, LEHMANN, ANDERSON, HIGGINS and SANKARAN2011), as well as a cooler, more humid and less windy microclimate (Ray et al. Reference RAY, NEPSTAD and MOUTINHO2005). Although all of these variables contribute to the low flammability of forest, Hoffmann et al. (Reference HOFFMANN, JACONIS, MCKINLEY, GEIGER, GOTSCH and FRANCO2012a) found the loss of grasses to cause greater reductions in fire intensity, flame length and rate of spread than did changes in microclimate.
The positive effect of the physical properties of soil on distance (outcrop, ferruginous and silty) show the variation in edaphic conditions such as soil depth (Furley Reference FURLEY1999), texture (Askew et al. Reference ASKEW, MOFFATT, MONTGOMERY and SEARL1970), parent material (Ash Reference ASH1988) and drainage (Lloyd et al. Reference LLOYD, BIRD, VELLEN, MIRANDA, VEENENDAAL, DJAGBLETEY, MIRANDA, COOK and FARQUHAR2008) between gallery forest and savanna. Among edaphic factors, nutrient availability has probably received the most attention in the literature, largely driven by the widespread observation that forests are often associated with nutrient-rich soils (Ash Reference ASH1988, Bond Reference BOND2008, Bowman Reference BOWMAN2000) and savannas with deeply weathered, ancient soils (Kellman Reference KELLMAN1984). All in all, gallery forest exists within a highly flammable savanna matrix and is restricted to topographic settings protected from fire with greater water availability (Bowman Reference BOWMAN2000). So, individual gallery-forest trees established in savanna may have to adapt to water shortage, new soil conditions and vegetation fire.
While savanna must be burned to provide fodder in the dry season, gallery forest should not be allowed to become too narrow, since this would mean losing the species dependent on the gallery forest. Therefore, it is important to examine how annual burning damages seedlings, and which management strategy can achieve the best possible result. To enhance the role of gallery forest in biodiversity conservation, a band of 120 m (the identified community threshold distance for gallery-forest species) on each side of the river should be burned earlier than the surrounding savanna to avoid late burning, which is more destructive to seedlings. Gallery forest and savanna mosaics are prevalent in many African phytochoria, particularly in the Sudanian zone (White Reference WHITE1983). The observations made in this study and their management implications are, therefore, relevant to many areas in Africa and in much of the tropical world where such landscapes occur.
Our findings deconstruct the spatial processes that occur at the boundary between gallery forest and savanna. Overall, there is no overlap in the distribution of gallery-forest and savanna species, resulting in abrupt transition between habitats. However, some gallery-forest species take advantage of the fire-free zone and establish in savanna. Therefore, the spatial effects leading to the existence of a fire-free zone and the establishment of gallery-forest tree species in annually burnt savanna are important to the understanding of savanna–forest dynamics and deserve further study.
ACKNOWLEDGEMENTS
This work was funded by LOEWE – Biodiversity and Climate Research Centre (BiK-F). We are grateful to Aristide Adomou for taxonomic identification of species. We would like to thank two anonymous referees for advice and constructive comments on earlier drafts of this paper.
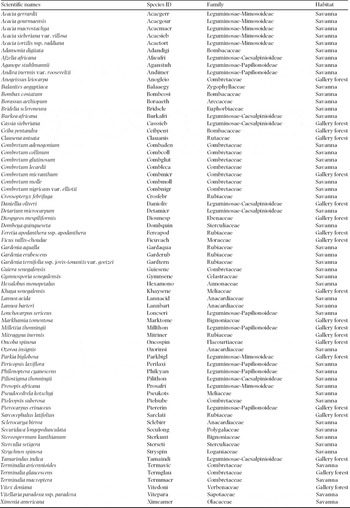
Full names of species recorded at gallery forest–savanna boundaries in the Biosphere Reserve of Pendjari, Benin. Species nomenclature follows the Flora of Benin (Akoegninou et al. Reference AKOEGNINOU, VAN DER BURG, VAN DER MAESEN, ADJAKIDJE, ESSOU, SINSIN and YEDOMONHAN2006).