1. Introduction
Lower-hybrid current drive (LHCD) is a radiofrequency (RF) actuator used to efficiently drive current in tokamaks (Fisch Reference Fisch1987). The lower-hybrid current drives via electron Landau damping of slow waves on fast electrons with $v_{e} \geqslant 3 v_{the}$ , in the lower-hybrid (LH) limit, $\varOmega _i \ll \omega \ll \varOmega _e$
 , where $\omega$
 is the wave frequency, $\varOmega _s = q_s B / m_s$
 is the cyclotron frequency of species $s$
 with electric charge qs and mass ms in magnetic field B and $v_{the} = \sqrt {2T_e/m_e}$
 is the electron thermal velocity for electron temperature Te (Bonoli Reference Bonoli1985). This drives current by direct parallel momentum injection and distortion of the perpendicular distribution such that the parallel resistivity is reduced in the direction of the plasma current (Fisch Reference Fisch1978; Fisch & Boozer Reference Fisch and Boozer1980).
Despite a long history of experimental demonstrations (Porkolab et al. Reference Porkolab, Schuss, Lloyd, Takase, Texter, Bonoli, Fiore, Gandy, Gwinn and Lipschultz1984; Bartiromo et al. Reference Bartiromo, Hesse, Söldner, Burhenn, Fussmann, Leuterer, Murmann, Eckhartt, Eberhagen and Giuliana1986; Moriyama et al. Reference Moriyama, Nakamura, Nagao, Nakamura, Hiraki and Itoh1990; Jacquinot Reference Jacquinot1991; Ide et al. Reference Ide, Imai, Ushigusa, Naito, Ikeda, Nemoto and Sato1992; Bernabei et al. Reference Bernabei, Daughney, Efthimion, Hooke, Hosea, Jobes, Martin, Mazzucato, Meservey and Motley1995; Peysson & Tore Supra Team Reference Peysson2001; Wilson et al. Reference Wilson, Parker, Bitter, Bonoli, Fiore, Harvey, Hill, Hubbard, Hughes and Ince-Cushman2009; Cesario et al. Reference Cesario, Amicucci, Castaldo, Marinucci, Panaccione, Santini, Tudisco, Apicella, Calabro and Cianfarani2010; Wallace et al. Reference Wallace, Hubbard, Bonoli, Faust, Harvey, Hughes, LaBombard, Meneghini, Parker and Schmidt2011; Liu et al. Reference Liu, Ding, Li, Wan, Shan, Wang, Liu, Zhao, Li and Li2015), LHCD has remained difficult to predict (Bonoli Reference Bonoli2014). Difficulty predicting LHCD is attributed to the existence of a ‘spectral gap’, whereby LH waves tend to damp despite being launched with a parallel phase velocity, $v_{{\rm ph}\parallel } \sim 6\unicode{x2013}8 v_{{\rm the0}}$ , much larger than their linear damping condition of $v_{{\rm ph}\parallel } \sim 3 v_{{\rm the0}}$
 . A number of mechanisms that upshift the parallel refractive index $N_\parallel = k_\parallel c/ \omega = c/v_{{\rm ph},\parallel }$
 , where $k_\parallel$
 is the parallel component of the wave vector $\boldsymbol {k}$
 and c is the speed of light in vacuum, closing the spectral gap have been proposed. These mechanisms include: toroidally induced increases in the parallel wavenumber and wave scattering from turbulence (Bonoli & Ott Reference Bonoli and Ott1981, Reference Bonoli and Ott1982; Decker et al. Reference Decker, Peysson, Artaud, Nilsson, Ekedahl, Goniche, Hillairet and Mazon2014; Peysson et al. Reference Peysson, Decker, Nilsson, Artaud, Ekedahl, Goniche, Hillairet, Ding, Li and Bonoli2016; Biswas et al. Reference Biswas, Baek, Bonoli, Shiraiwa, Wallace and White2020, Reference Biswas, Shiraiwa, Baek, Bonoli, Ram and White2021), parametric wave interactions (Cesario et al. Reference Cesario, Cardinali, Castaldo, Paoletti and Mazon2004; Decker et al. Reference Decker, Peysson, Artaud, Nilsson, Ekedahl, Goniche, Hillairet and Mazon2014; Peysson et al. Reference Peysson, Decker, Nilsson, Artaud, Ekedahl, Goniche, Hillairet, Ding, Li and Bonoli2016) and diffractional broadening of the wave spectrum (Pereverzev Reference Pereverzev1992; Wright et al. Reference Wright, Bonoli, Schmidt, Philips, Valeo, Harvey and Brambilla2009, Reference Wright, Lee, Valeo, Bonoli, Philips, Jaeger and Harvey2010; Shiraiwa et al. Reference Shiraiwa, Ko, Parker, Schmidt, Scott, Greenwald, Hubbard, Hughes, Ma and Podpaly2011a; Wright et al. Reference Wright, Bader, Berry, Bonoli, Harvey, Jaeger, Lee, Schmidt, D'Azevedo and Faust2014). Which $N_\parallel$
 upshift mechanism is dominant in a given situation can profoundly affect wave damping and current drive efficiency. Therefore, it is important to understand if and when each of these different mechanisms is important.
Lower-hybrid current drive is typically simulated using raytracing. Raytracing is derived by applying the Wentzel–Kramers–Brillouin (WKB) method, assuming that $kL \gg 1$ , where L is the plasma gradient scale length, to the plasma wave equation yielding the ray equations. To calculate non-Maxwellian plasma response and current drive, raytracing simulations are coupled to a Fokker–Planck simulation by formulating a quasilinear diffusion coefficient using the method described in Bonoli & Englade (Reference Bonoli and Englade1986). However, raytracing neglects the effects of diffraction and the $kL \gg 1$
 limit breaks down near cutoffs and ray caustics. Solving the wave equation directly using a ‘full-wave’ simulation preserves the effects of diffraction and interference as well as accurately capturing the behaviour of the wave at cutoffs and caustics, and comparison of raytracing with full-wave simulations can allow us to determine if raytracing is accurate despite not including these effects. In this work, we implemented the first fully self-consistent full-wave/FP model that allows us to calculate the LHCD and compare with results obtained with a raytracing/FP model in Alcator C-Mod. Previous LHCD modelling work has included non-Maxwellian effects (Peysson et al. Reference Peysson, Sébelin, Litaudon, Moreau, Miellou, Shoucri and Shkarofsky1998; Wright et al. Reference Wright, Lee, Valeo, Bonoli, Philips, Jaeger and Harvey2010, Reference Wright, Bader, Berry, Bonoli, Harvey, Jaeger, Lee, Schmidt, D'Azevedo and Faust2014; Shiraiwa et al. Reference Shiraiwa, Ko, Parker, Schmidt, Scott, Greenwald, Hubbard, Hughes, Ma and Podpaly2011a; Meneghini Reference Meneghini2012), however, these simulations were not performed fully self-consistently. They required ad hoc numerical rescaling of the quasilinear diffusion coefficient to ensure the correct RF power was deposited in the FP calculation or employed an approximate method for calculating the non-Maxwellian dielectric tensor. We will describe the construction of our fully self-consistent non-Maxwellian full-wave/FP LHCD model and its application to modelling a set of Alcator C-Mod experiments.
2. The non-Maxwellian TORLH/CQL3D model
In order to perform non-Maxwellian simulations of LHCD using a full-wave simulation code it is necessary to iterate calculations of wave propagation and damping obtained using the plasma Helmholtz equation in the LH limit and a Fokker–Planck equation solver such as CQL3D (Harvey & McCoy Reference Harvey and McCoy1992; Petrov & Harvey Reference Petrov and Harvey2016). This iteration solves the system


where $\boldsymbol {E}$ is the wave electric field, $f$
 is the electron distribution function, $\hat {b} = \boldsymbol {B}_0/|B_0|$
 is the background magnetic field vector, $C(f)$
 is the collision operator, $Q(f,E_\parallel )$
 is the divergence of the quasilinear flux and $\it{\boldsymbol{\epsilon }}(f)$
 is the plasma dielectric tensor with components


where $S,D,R,L$ are the cold plasma dielectric components from Stix (Reference Stix1992), $\omega _{{\rm ps}}=q_s^2 n_s / m_s \epsilon _0$
 is the plasma frequency for species $s$
 , $\zeta _s = \omega /k_\parallel v_{{\rm ths}}$
 and ${Z}$
 is the plasma dispersion function (Fried & Conte Reference Fried and Conte1961). The non-Maxwellian imaginary correction to $\epsilon _\parallel (f)$
 here is $\textrm {Im}[\chi _{{\rm zz}} (f)]$
 , discussed further in § 2.2 and Appendix A. TORLH calculates an $E$
 -field for a single toroidal mode $n_\phi$
 by solving Helmholtz's equation (2.1) discretized with a semi-spectral representation

where $n_\phi$ is the toroidal mode number, $m$
 is the poloidal mode number and $\boldsymbol {E}^{(m)}(\psi )$
 is represented by a cubic Hermite interpolating polynomial finite element. The TORLH discretization is global along flux surfaces and precisely defines the parallel $k$
 vector

where $n_\tau$ is a metric coefficient that functions as a generalized minor radius. These properties of the TORLH discretization allow hot plasma effects, like Landau damping, to be resolved without approximations required by fully finite element discretizations (Shiraiwa et al. Reference Shiraiwa, Ko, Parker, Schmidt, Scott, Greenwald, Hubbard, Hughes, Ma and Podpaly2011a). Our choice of discretization produces a block tridiagonal system of equations solved using a custom parallel block cyclic reduction solver (Lee & Wright Reference Lee and Wright2014).
After the field solve, TORLH performs a post-processing step to obtain the quasilinear diffusion coefficient $D_{{\rm ql},\parallel }(E_\parallel )$ , the component of the quasilinear term $Q(f,E_\parallel )$
 dependent on the parallel electric field. The CQL3D quasilinear term may be written (Petrov & Harvey Reference Petrov and Harvey2016)

Here, $u$ is the momentum per rest mass, $p/\gamma m$
 , $\vartheta$
 is the velocity-space pitch angle and ${B}_0$
 , ${C}_0$
 , ${E}_0$
 and ${F}_0$
 are bounce averaged quasilinear diffusion coefficients. We may relate the local ${B}$
 to the $D_{{\rm ql},\parallel }$
 from Kennel & Engelmann (Reference Kennel and Engelmann1966) using the relativistic form found in Lerche (Reference Lerche1968) and Chapter 17 of Stix (Reference Stix1992)

We then perform a normalized zero-orbit-width bounce average of ${B}$ to obtain ${B}_0$


where the integration element ${\rm d}l$ is directed along the magnetic field line and $v_{\parallel,0}$
 is the parallel velocity at the outboard midplane, and $\mathcal {J}$
 is the Jacobian of the magnetic coordinate system. With ${B}_0$
 we can obtain ${C}_0$
 , ${E}_0$
 and ${F}_0$


Using the quasilinear diffusion computed by TORLH, CQL3D solves (2.2) to evolve the distribution for some amount of time. The evolved non-Maxwellian distribution function is passed back to a pre-processing routine that calculates a lookup table with values of the imaginary component of $\epsilon _\parallel$ , $\textrm {Im}[\chi _{{\rm zz}}]$
 (the only component of the dielectric which meaningfully varies from the Maxwellian) and then TORLH is rerun using the updated non-Maxwellian dielectric. This process is repeated until power deposition profiles stop evolving and the driven current has risen to a steady state value, indicating the system has converged. Convergence is typically obtained after ${\sim }$
 20–50 iterations between TORLH and CQL3D.
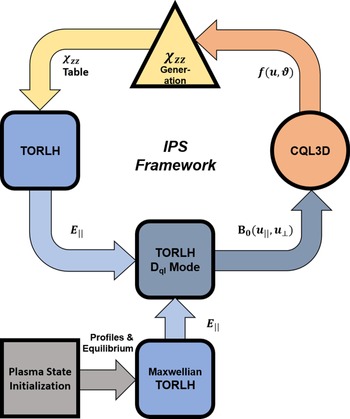
To facilitate simulation of multiple current drive scenarios using the TORLH/CQL3D iteration, shown in figure 1, it was necessary to develop an automated framework for performing simulations. We created a set of Python and FORTRAN wrappers for the Integrated Plasma Simulator (IPS) (Elwasif et al. Reference Elwasif, Bernholdt, Shet, Foley, Bramley, Batchelor and Berry2010). The IPS enabled the TORLH/CQL3D iterations to be performed at large scale with checkpointing and restart capabilities. Using the IPS, we successfully performed large scale TORLH/CQL3D simulations with ${\sim }$ 10 000 cores on Cori at the National Energy Research Scientific Computing Center (NERSC) that could be iterated for up to 48 h. However, initial simulations using the version of TORLH and the set-up from Wright et al. (Reference Wright, Bader, Berry, Bonoli, Harvey, Jaeger, Lee, Schmidt, D'Azevedo and Faust2014) were not power conserving. In order to obtain physically and numerically self-consistent results, we needed to not only implement the improved TORLH boundary condition and field solver convergence criteria from Frank et al. (Reference Frank, Wright, Hutchinson and Bonoli2022), but we also had to implement significant improvements in the non-Maxwellian components of TORLH including: reformulation of the quasilinear diffusion coefficient, construction of a $\textrm {Im}[\chi _{{\rm zz}}]$
 lookup table and the lookup table interpolation in TORLH. In the following sections we will describe the key modifications to the non-Maxwellian components of TORLH and develop convergence requirements for them.
Flowchart showing an IPS driven iteration. The IPS creates a ‘plasma state’ containing magnetic equilibrium and plasma profile information then initializes a Maxwellian TORLH simulation from that plasma state. TORLH and CQL3D are then iterated using the IPS framework supplemented by Python and FORTRAN wrappers that manage input files.

2.1. Quasilinear diffusion coefficient formulation
The quasilinear diffusion coefficient, $D_{{\rm ql}}$ , formulation in TORLH was completely rewritten during the course of this work in order to implement a form that was power conserving. The TORLH diffusion coefficient is derived from the parallel component of the RF quasilinear diffusion coefficient in Kennel & Engelmann (Reference Kennel and Engelmann1966)

This diffusion coefficient parameterizes electron Landau damping by the LH wave. Using (2.7) to rewrite $D_{{\rm ql},\parallel }$ in terms of the CQL3D quasilinear diffusion coefficients and applying the TORLH discretization (2.4) yields

where $[E]$ is the electric field normalization in TORLH of $1\ {\rm V}\ {\rm m}^{-1}$
 and truncated Bessel function expression ${\rm J}_{0,n} = {\rm J}_0(k_\perp ^{(m_n)} v_\perp /\varOmega )$
 (TORLH does not have a well defined $k_\perp$
 for a given $m,n_\phi$
 , so the $k_\perp$
 in this expression is obtained from the local slow-wave dispersion relation. This is an approximation is fairly accurate as the fast wave is strongly evanescent in most LHCD scenarios). In this work, we have only used a single toroidal mode due to the computational intensity of TORLH electric field solves, and the $n_\phi$
 sum will be suppressed in later equations. To efficiently discretize this problem in velocity space we take advantage of the properties of the $\delta$
 function. The $\delta$
 function prescribes that, for a given $m$
 number, the quasilinear diffusion coefficient has a uniquely defined $v_\parallel$
 location in velocity space. Therefore, at a given value of $m$
 and $u_\perp$
 the $u_\parallel$
 velocity-space location is known. This allows us to rewrite (2.11) in terms of a discretized delta function

Here, we have used a rectangular discrete $\delta$ function where $\Delta u_{{\rm mesh}}$
 is the velocity-space mesh spacing. It is possible to use more complicated form factors for the discrete $\delta$
 , but these have been found to have a minimal impact on the $D_{{\rm ql}}$
 formulation in the past (Lee et al. Reference Lee, Wright, Bertelli, Jaeger, Valeo, Harvey and Bonoli2017b). For numerical simplicity, a uniform velocity-space mesh in $u_\perp$
 and $u_\parallel$
 is used and the $u_\parallel = \gamma v_{{\rm ph}\parallel }$
 corresponding to a given $m$
 number is interpolated to the nearest neighbour point on the $u_\parallel$
 mesh.
The $D_{{\rm ql}}$ formulation here is effectively unchanged from that shown in Wright et al. (Reference Wright, Bader, Berry, Bonoli, Harvey, Jaeger, Lee, Schmidt, D'Azevedo and Faust2014), but a key numerical improvement to the $D_{{\rm ql}}$
 formulation has been made. Previously, a sum over all spectral modes, including evanescent wave modes, was performed in TORLH. However, evanescent wave modes are disallowed in the resonant Kennel–Engelmann $D_{{\rm ql}}$
 formulation because waves with $\textrm {Im}[k_\parallel ] \neq 0$
 are incompatible with the contour integration used to obtain the resonant limit (Kennel & Engelmann Reference Kennel and Engelmann1966). Inclusion of evanescent wave modes in the $D_{{\rm ql}}$
 double mode sum introduces components of $D_{{\rm ql}}$
 at excessively high parallel momenta. This causes interaction with high-energy electrons leading to the formation of sharp structures in the FP solution. These sharp structures in phase space caused numerical instabilities in both TORLH and CQL3D that could in some cases cause the simulations to fail. To avoid this, we check if the wave is evanescent using the following equation derived from the electromagnetic dispersion relation (Bonoli Reference Bonoli1985):

For a given mode, if (2.13) is less than zero it is excluded from the double mode sum in (2.12) (doing this calculation efficiently required a rewrite of the quasilinear diffusion coefficient formulation routine in TORLH to modify its parallelization). Ideally, we would solve the dispersion relation with fixed $N_\perp$ and $\omega$
 for $N_\parallel$
 to determine if the mode had $\textrm {Im}[k_\parallel ]\neq 0$
 , but this is not possible in the TORLH basis. We must settle for calculating when $N_\perp$
 becomes imaginary with fixed $N_\parallel$
 and $\omega$
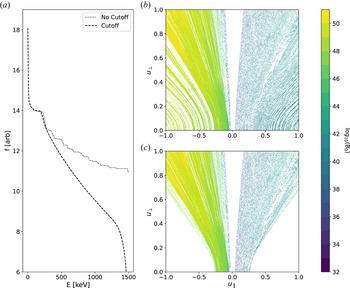
 . The results of this procedure, highlighted in figure 2, show that it very successfully removes high-energy noise from $D_{{\rm ql}}$
 and CQL3D electron distribution functions.
Plots demonstrating the evanescent cutoff noise reduction method. (a) The CQL3D electron distribution function produced by $D_{\textit {ql}}$ vs electron energy with (dashed) and without (dotted) the evanescence cutoff. Contours of ${B}_0$
 vs parallel and perpendicular momentum per rest mass (b) without the cutoff applied and (c) with the cutoff applied.

To self-consistently obtain the desired power, the normalized TORLH electric fields in the $D_{{\rm ql}}$ formulation must be scaled to the launched power in the experiment $P_{{\rm target}}$
 . To do this, the launched power with the normalized field values in TORLH is obtained from the integrated Poynting flux at the antenna

where ${R}^\textrm {curl}$ is the numerical curl operator in TORLH (Brambilla Reference Brambilla1996), $R_0$
 is the major radius and $l_0 = c/\omega$
 is the TORLH length normalization. In the limit of only Landau damping, as in the simulations here, one can alternatively use the power deposited by Landau damping to scale $D_{{\rm ql}}$


where $\tilde {\chi }_{{\rm zz}}$ is the Fourier transform of the imaginary component of the parallel dielectric

Using the power calculated in TORLH we may rescale the quasilinear diffusion coefficient

For linear field response, $P_{{\rm RF}} \propto {B} \propto |E|^2$ making this rescaling physically self-consistent. No further rescaling is necessary, and precise agreement should be obtained between $P_{{\rm target}}$
 and the power calculated in CQL3D using the quasilinear diffusion coefficient.
A key feature of the quasilinear diffusion coefficients calculated by TORLH is their non-positive definiteness. The holes in the diffusion coefficients shown in figure 2 are the result of small non-positive definite components of the $D_{{\rm ql}}$ that are set to zero after output from TORLH. Non-positive definite quasilinear diffusion is numerically unstable and physically incorrect, but is not unique to TORLH and is a weakness of spectral $D_{{\rm ql}}$
 reconstruction in many full-wave RF solvers (Jaeger et al. Reference Jaeger, Berry, Ahern, Barrett, Batchelor, Carter, D'Azevedo, Moore, Harvey and Myra2006; Lee et al. Reference Lee, Smithe, Wright and Bonoli2017a,Reference Lee, Wright, Bertelli, Jaeger, Valeo, Harvey and Bonolib). The root cause of the non-positive definiteness is from the inconsistency introduced by the use of a resonant, homogeneous, local diffusion coefficient, but a non-local spectral electric field basis and toroidal geometry. This inconsistency leads to improper consideration of parallel magnetic field inhomogeneity ($\boldsymbol {B}\boldsymbol {\cdot }\boldsymbol {\nabla }\boldsymbol {B} \neq 0$
 ) during the bounce average (2.8) and also the excessive interaction with evanescent wave modes discussed previously. As this non-positive definiteness occurs throughout the literature (Jaeger et al. Reference Jaeger, Berry, Ahern, Barrett, Batchelor, Carter, D'Azevedo, Moore, Harvey and Myra2006; Lee et al. Reference Lee, Smithe, Wright and Bonoli2017a,Reference Lee, Wright, Bertelli, Jaeger, Valeo, Harvey and Bonolib), a number of techniques to handle it have been developed: the negative components of ${B}_0$
 may be set to zero (this is done automatically in CQL3D when given a non-positive definite $D_{{\rm ql}}$
 ), an advanced positive definite spectral formulation may be used (Kaufman Reference Kaufman1972; Lee et al. Reference Lee, Smithe, Wright and Bonoli2017a), or a a particle tracking velocity kick formulation of ${B}_0$
 can be performed (R.W. Harvey, personal communication 2020; Shiraiwa et al. Reference Shiraiwa, Ko, Parker, Schmidt, Scott, Greenwald, Hubbard, Hughes, Ma and Podpaly2011a). Advanced spectral formulations or particle tracking, however, are $\mathcal {O}(10^6)$
 more computationally expensive than the traditional spectral $D_{{\rm ql}}$
 reconstruction technique described here or the W-dot method from Jaeger et al. (Reference Jaeger, Berry, Ahern, Barrett, Batchelor, Carter, D'Azevedo, Moore, Harvey and Myra2006). Positive definite $D_{{\rm ql}}$
 formulations also have unfavourable performance scaling with problem size quickly becoming more expensive than the electric field solve. While more sophisticated $D_{{\rm ql}}$
 formulation techniques may be applicable in less computationally expensive simulations of ion cyclotron heating (Lee et al. Reference Lee, Smithe, Wright and Bonoli2017a), their applicability to spectral LHCD calculations is limited. However, preliminary investigations of positive definite calculations have indicated that they successfully remove interaction with evanescent modes, and ensure a positive definite $D_{{\rm ql}}$
 for LH waves (Frank et al. Reference Frank, Bonoli, Batchelor, Wright and Hutchinson2019).
Previously, 200–400 parallel velocity grid points were used in iterated simulations of TORLH and CQL3D (Wright et al. Reference Wright, Bader, Berry, Bonoli, Harvey, Jaeger, Lee, Schmidt, D'Azevedo and Faust2014; Yang et al. Reference Yang, Bonoli, Wright, Ding, Parker, Shiraiwa and Li2014). However, after the rewrite of the $D_{{\rm ql}}$ formulation performed in this work, the velocity-space convergence requirements of the $D_{{\rm ql}}$
 were reanalysed. To do this, we performed both standalone Maxwellian validation and iterated simulations with CQL3D. For brevity, we will focus on the standalone validation here. For a given distribution function the RF power density $\mathcal {P}_{{\rm RF}}$
 , calculated from power dissipation by integrated Landau damping on a flux surface $\boldsymbol {J}_p \boldsymbol {\cdot } \boldsymbol {E}$
 (integrated in $\psi$
 in (2.15)), may be related the second moment of the quasilinear diffusion term

Using the CQL3D quasilinear diffusion term (2.6), integrating by parts and substituting a relativistic Maxwellian

yields

A comparison of the RF power density profiles obtained from (2.18) allows us to evaluate the convergence of the quasilinear diffusion coefficient formulation in velocity space. As the velocity-space grid resolution is increased the agreement between the two $\mathcal {P}_{{\rm RF}}$ calculations should improve. Convergence of $D_{{\rm ql}}$
 typically occurs when ${\sim }500$
 to $1000$
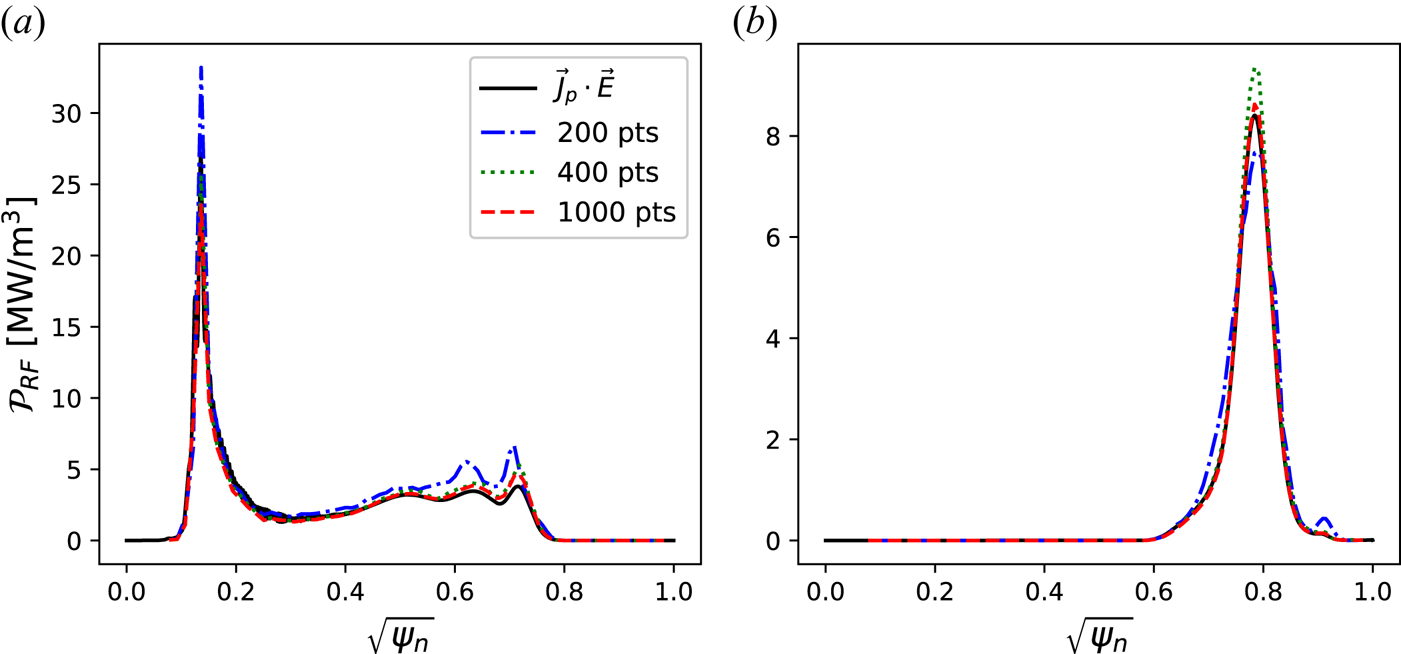
 parallel velocity grid points are used. An example of such a convergence scan can be found in figure 3. In more strongly damped, high $N_\parallel$
 , problems the resolution requirement for $D_{{\rm ql}}$
 tends to be larger as power is concentrated in a smaller region of velocity space. When the $D_{{\rm ql}}$
 is under-resolved, power deposition is over-predicted as poorly defined $D_{{\rm ql}}$
 edges cause excess power to be diffused into the distribution function. In these convergence scans we also studied the impact of the evanescent mode cutoff on power deposition profiles. We found adding or removing the evanescent mode cutoff to have no meaningful effect on the power deposition profiles obtained by integrating the quasilinear term. This is perhaps unsurprising as waves which are cut off according to (2.13) have very short evanescence lengths and should not have the opportunity to deposit significant amounts of power in the plasma (the impact of the cutoff was also examined using spot checks on non-Maxwellian simulations. It was found in the simulations performed in § 3 when the last iterate was re-run without the cutoff there was a 2 % increase in the damped power and 6 % increase in the driven current). Usually, a higher resolution than that which is required for convergence of the Maxwellian problem is used for integrated non-Maxwellian simulations as edge effects will be exacerbated when a Landau plateau begins to form. Throughout this work, we use $1000$
 points in the parallel velocity-space grid as convergence scans showed it consistently provided good convergence for both the non-Maxwellian and Maxwellian problems.
Plots of RF power density $\mathcal {P}_{{\rm RF}}$ vs square-root poloidal flux $\sqrt {\psi _N}$
 demonstrating velocity-space convergence of $D_{{\rm ql}}$
 . With increasing numbers of points in parallel velocity space, $\mathcal {N}_{u\parallel }$
 , convergence improves. Note, for both plots here $\mathcal {N}_{u\parallel }=2\mathcal {N}_{u\perp }$
 . In (a) waves are weakly damped in an $N_\parallel =-1.6$
 simulation, and in (b) waves are strongly single-pass damped in an $N_\parallel =-5.0$
 simulation.

Finally, unlike older versions of TORLH and TORIC (Wright et al. Reference Wright, Lee, Valeo, Bonoli, Philips, Jaeger and Harvey2010, Reference Wright, Bader, Berry, Bonoli, Harvey, Jaeger, Lee, Schmidt, D'Azevedo and Faust2014; Lee et al. Reference Lee, Wright, Bertelli, Jaeger, Valeo, Harvey and Bonoli2017b), the ${B}_0$ calculated in TORLH here was passed to CQL3D directly. Exact flux surface matching between the two codes was enforced and a number of intermediate velocity-space interpolations which were present in previous work have been removed. This change markedly improved agreement between the $\mathcal {P}_{{\rm RF}}$
 profiles in CQL3D calculated using the quasilinear diffusion and TORLH calculated using $\boldsymbol {J}_p \boldsymbol {\cdot } \boldsymbol {E}$
 in integrated simulations.
2.2. The ${\rm {Im}}[\chi _{{\rm zz}}]$ lookup table construction

In order to perform non-Maxwellian simulations of LHCD using TORLH it is necessary to calculate the non-Maxwellian dielectric response. In the case of LH waves this process is straightforward as only the imaginary parallel component of the dielectric $\textrm {Im}[\epsilon _\parallel ] = \textrm {Im}[\chi _{{\rm zz},e}]$ , which governs Landau damping, undergoes substantial changes (for plateau distributions resulting from Landau damping in the LH limit). However, calculating $\textrm {Im}[\chi _{{\rm zz},e}]$
 accurately using realistic fully relativistic distribution functions from CQL3D would be too slow to perform during the dielectric construction in TORLH simulations. Instead, a look up table, similar to those used for complicated dielectrics in AORSA and TORIC (Berry et al. Reference Berry, Jaeger, Phillips, Lau, Bertelli and Green2016; Bertelli et al. Reference Bertelli, Valeo, Green, Gorelenkova, Phillips, Podestà, Lee, Wright and Jaeger2017), is constructed which provides values of $\textrm {Im}[\chi _{{\rm zz},e}]$
 on a fixed parallel refractive index $N_\parallel$
 , radial location $\psi$
 and flux surface angle $\theta$
 grid. Then, $\textrm {Im}[\chi _{{\rm zz},e}]$
 may be rapidly interpolated from the lookup table to avoid computational and memory bottlenecks during the dielectric construction step in TORLH.
The derivation of $\textrm {Im}[\chi _{{\rm zz},e}]$ in terms of $N_\parallel$
 , $\psi$
 and $\theta$
 for a CQL3D distribution function is performed in Wright et al. (Reference Wright, Lee, Valeo, Bonoli, Philips, Jaeger and Harvey2010) and reviewed in Appendix A. However, an overlooked aspect of implementing this $\textrm {Im}[\chi _{{\rm zz}}]$
 formulation was the method by which the derivatives of the CQL3D distribution were taken. Originally, derivatives of the CQL3D distribution were taken using an uncentred first-order upwind difference. However, verification tests of TORLH performed during this work revealed, when a $\textrm {Im}[\chi _{{\rm zz},e}]$
 produced from a Maxwellian distribution with these derivatives was used in TORLH, poor agreement was obtained with the same simulations using analytic expressions for the Maxwellian $\textrm {Im}[\chi _{{\rm zz},e}]$
 .
Initially, discrepancies in the Maxwellian regression tests were attributed to the relativistic correction to $\textrm {Im}[\chi _{{\rm zz}}]$ s derived numerically from CQL3D distribution functions (the canonical analytic Maxwellian $\textrm {Im}[\chi _{{\rm zz},e}]$
 in TORLH using the ${Z}$
 function is non-relativistic), but iterated simulations of TORLH and CQL3D also demonstrated poor agreement between TORLH and CQL3D damped powers. The root cause of the disagreement was found to be a small problem with the derivative method used. In rapidly varying functions, like a plasma distribution function at large $u_\parallel$
 , it is insufficient to use un-centred differences. Re-centring of the grid at the derivatives’ locations is important to obtaining accurate results. This is evident in CQL3D where great care is taken to properly recentre differences (R.W. Harvey, personal communication 2020). To demonstrate this we introduce analytic Maxwellian


and a one-dimensional Landau plateau distribution function obtained by solving the Fokker–Planck equation with quasilinear RF diffusion for the Trubinkov collision operator (Trubnikov Reference Trubnikov1965; Fisch Reference Fisch1978; Karney & Fisch Reference Karney and Fisch1979)


for

For this choice of a $D(w)$ , (2.22) has closed form solution (not previously noted in the literature)

where $C_1$ is an arbitrary normalization constant and constants


Both of these equations (2.21b) and (2.24) have well-defined analytic derivatives (2.21a) and (2.22), except at points on the edges of $D(w)$ where the (2.24) derivatives are undefined. If we ensure our numerical grid does not intersect with the edges of $D(w)$
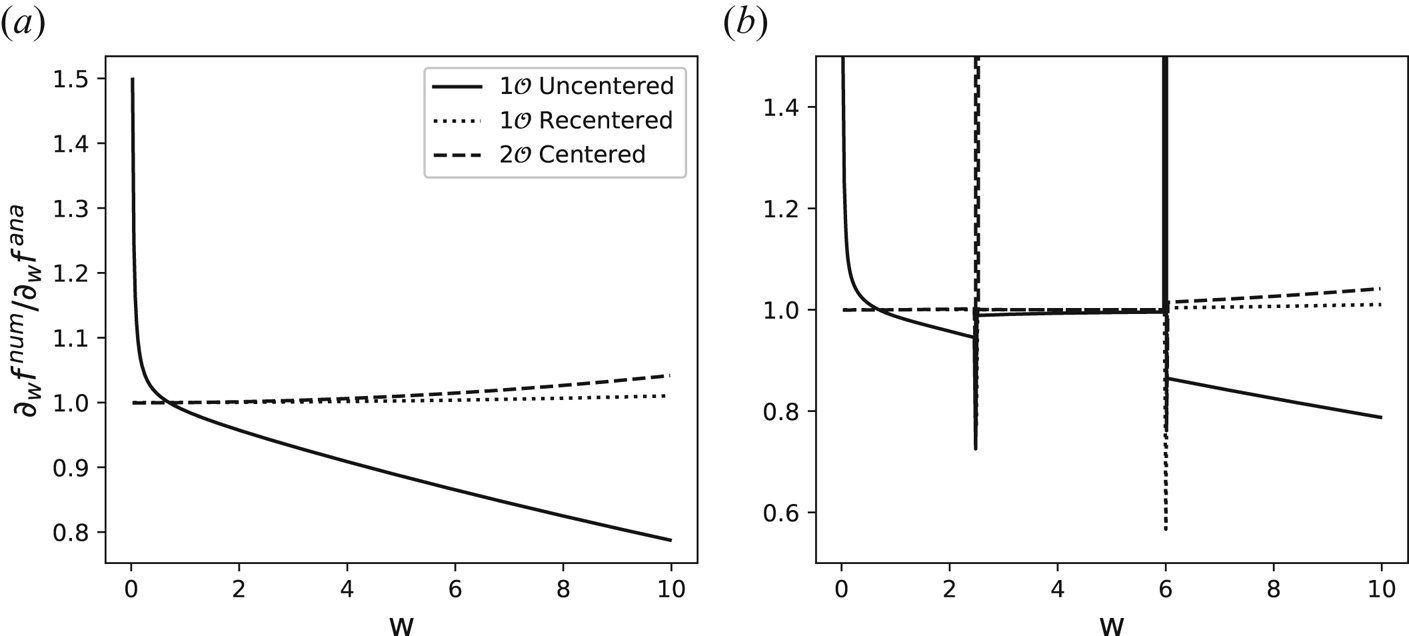
 , we can use these equations to precisely evaluate the effectiveness of finite differencing methods. We show a comparison of finite difference methods: first-order uncentred upwind, first-order upwind with grid re-centring and second-order central differences in figure 4. Without re-centring, first-order differences perform extremely poorly, explaining the difficulties experienced with the original $\textrm {Im}[\chi _{{\rm zz},e}]$
 calculation. However, when re-centring is applied, first-order upwind differences offer comparable performance to second-order central differences, but unlike higher-order differences, cannot produce the wrong derivative sign. Recentred first-order upwind differences are used in CQL3D, and iterated simulation tests produced the most robust agreement between TORLH and CQL3D when first-order upwind differences were also used in the $\textrm {Im}[\chi _{{\rm zz},e}]$
 calculation (even when compared with third- and fourth-order accurate differencing schemes). Presumably, this was the result of increased internal self-consistency. The correction to the derivatives in the $\textrm {Im}[\chi _{{\rm zz},e}]$
 calculation immediately improved the agreement between the damped power calculations in TORLH and CQL3D and this correction was key to enabling the work in the following sections.
The ratio of the analytic and numerical derivatives taken using a first-order upwind forward difference (solid), a re-centred first-order upwind forward difference (dotted) and a second-order central difference (dashed), for (a) the Maxwellian distribution from (2.21) and (b) the non-Maxwellian distribution function from (2.24).

3. Quasi-steady state simulation
The first tokamak discharge modelled here is Alcator C-Mod shot #1060728011. In this discharge LHCD was produced with the Alcator C-Mod LH1 antenna at 4.6 GHz with $60^{\circ }$ phasing corresponding to a launched $N_\parallel = -1.6$
 (Shiraiwa et al. Reference Shiraiwa, Meneghini, Parker, Wallace, Wilson, Faust, Lau, Mumgaard, Scott and Wukitch2011b). Approximately 800 kW of LHCD power was coupled to a plasma with $T_{e0} = 2.3$
 keV, $\bar {n}_e = 5 \times 10^{19}\ {\rm m}^{-3}$
 producing a near non-inductive plasma operating at ${\rm I}_p = 540$
 kA with a loop voltage of $-0.2$
 V. This discharge has been modelled extensively in the past using both raytracing (Schmidt Reference Schmidt2011) and full-wave simulations (Wright et al. Reference Wright, Bonoli, Schmidt, Philips, Valeo, Harvey and Brambilla2009, Reference Wright, Lee, Valeo, Bonoli, Philips, Jaeger and Harvey2010, Reference Wright, Bader, Berry, Bonoli, Harvey, Jaeger, Lee, Schmidt, D'Azevedo and Faust2014; Meneghini Reference Meneghini2012). Furthermore, this shot is very similar to the shot #1101104011 that has also been subject to much analysis in the literature (Mumgaard Reference Mumgaard2015; Biswas et al. Reference Biswas, Baek, Bonoli, Shiraiwa, Wallace and White2020; Baek et al. Reference Baek, Biswas, Wallace, Bonoli, Ding, Li, Li, Wang, Wang and Wu2021; Biswas et al. Reference Biswas, Shiraiwa, Baek, Bonoli, Ram and White2021).
Here, we return to shot #1060728011 using an overhauled TORLH and improved methodology to re-evaluate previous results. As in Frank et al. (Reference Frank, Wright, Hutchinson and Bonoli2022), we have used the IPS (Elwasif et al. Reference Elwasif, Bernholdt, Shet, Foley, Bramley, Batchelor and Berry2010) to create matched raytracing simulations with plasma state files from the full-wave simulation to evaluate the importance of full-wave effects. The GENRAY raytracing simulations here used the same source codes as those in Frank et al. (Reference Frank, Wright, Hutchinson and Bonoli2022) in which the dispersion relation is based on the TORLH dielectric and includes hot plasma corrections to the $\epsilon _\parallel$ component of the dielectric tensor. The GENRAY simulation of this shot used 400 rays, all with $N_\parallel = -1.6$
 , spread evenly over four grills placed at ${\pm }30^{\circ }$
 and ${\pm }10^{\circ }$
 from the outboard midplane. The raytracing simulation results were coupled to a CQL3D simulation that used 60 flux surfaces equi-spaced from $\sqrt {\phi _n} = 0.05$
 to 0.95, where $\phi _n$
 is the normalized toroidal flux. The distribution function in the CQL3D simulation was evolved for $\sim$
 125 ms over 35 timesteps. Timestep size was progressively increased from $1 \mathrm {\mu }{\rm s}$
 to 10 ms during the simulation for numerical stability (while the time advance of the FP equation in CQL3D is implicit, the updates to the quasilinear diffusion coefficient when CQL3D is coupled with GENRAY are explicit and can become numerically unstable if long timesteps are used initially). In the GENRAY/CQL3D simulation in this case 780 kW of the 800 kW launched power was damped in the plasma.
The TORLH simulations of this discharge were performed using 2047 poloidal modes and 4800 radial finite elements and were run on 255 nodes and 8160 cores on the Cori supercomputer at NERSC. The TORLH resolution settings here follow the requirements detailed in Frank et al. (Reference Frank, Wright, Hutchinson and Bonoli2022), however, higher finite element resolution was needed to combat spectral pollution, which could occur when strong radial discontinuities in the dielectric function for a fixed poloidal mode $m$ appeared due to Landau plateau formation. The boundary condition was matched to the raytracing simulations using the improved boundary condition in Frank et al. (Reference Frank, Wright, Hutchinson and Bonoli2022), and an $N_\parallel = -1.6$
 was launched. The CQL3D simulations coupled to full-wave simulations used 96 flux surfaces equi-spaced over $\sqrt {\phi _n} = 0.05$
 to 0.95. The larger number of flux surfaces in the FP calculation relative to the raytracing/FP simulations was another measure taken to improve numerical stability of the non-Maxwellian TORLH simulations. The TORLH/CQL3D simulations used a ramped timestepping scheme similar to the raytracing/CQL3D simulations to improve numerical stability as TORLH and CQL3D are iterated explicitly within the IPS, as described in § 2. A total of 40 iterations between TORLH and CQL3D were performed here for a total FP time of ${\sim }90$
 ms. The TORLH and CQL3D simulation was well converged, TORLH power matched CQL3D power with discrepancies of ${\lesssim }10\,\%$
 without the use of numerical rescaling factors (the TORLH power target was 800 kW and the total damped power in CQL3D was 719 kW).
Comparisons of the $\mathcal {P}_{{\rm RF}}$ profiles from TORLH/CQL3D and GENRAY/CQL3D simulations, shown in figure 5, demonstrate that excellent power deposition agreement was obtained in the non-Maxwellian simulations, much like in the Maxwellian simulations of this discharge performed in Frank et al. (Reference Frank, Wright, Hutchinson and Bonoli2022). Power deposition profiles at the final iteration calculated by CQL3D from integration of the quasilinear diffusion term for both GENRAY and TORLH simulations closely agreed with one another and agreed with the integrated $\boldsymbol {J}_p\boldsymbol {\cdot }\boldsymbol {E}$
 calculated by the TORLH field solver. Despite excellent $\mathcal {P}_{{\rm RF}}$
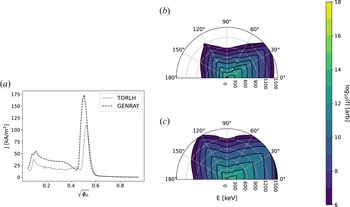
 agreement, TORLH/CQL3D simulations had lower current drive efficiency than GENRAY/CQL3D simulations. Current profiles in both simulations closely matched the power deposition profiles, but the TORLH/CQL3D simulations drove 288 kA of current with 719 kW of input power compared with the GENRAY/CQL3D simulations which drove 455 kA of current with 800 kW of input power. The shortfall in the TORLH/CQL3D current drive efficiency, which is only ${\sim }70$
 % of the GENRAY/CQL3D value, appears to be the result of holes in the quasilinear diffusion coefficient introduced by the non-positive definite nature of the coefficient, discussed in § 2.1. These holes limit the power which can be diffused to higher-energy electrons. The discontinuities from the holes in the quasilinear diffusion coefficient cause a sharp drop in the distribution about the hole. This seems to largely be a two-dimensional effect as the holes do not substantially affect the RF power deposition or current drive profiles, and the power deposition profile is known to be driven primarily by the one-dimensional distribution function behaviour (Bonoli & Englade Reference Bonoli and Englade1986; Shiraiwa et al. Reference Shiraiwa, Ko, Parker, Schmidt, Scott, Greenwald, Hubbard, Hughes, Ma and Podpaly2011a; Meneghini Reference Meneghini2012). However, the quasilinear diffusion holes substantially reduce the net driven current which is sensitive to changes to the two-dimensional distribution (Fisch & Boozer Reference Fisch and Boozer1980). This is demonstrated in figure 6, where it is shown that, despite having very similar current drive profiles, GENRAY/CQL3D simulations drive more current than TORLH/CQL3D simulations, and power is more effectively diffused to higher-energy electrons in GENRAY/CQL3D simulations. We found processing the quasilinear diffusion coefficient produced by TORLH with a biharmonic in-painting algorithm (Chui & Mhaskar Reference Chui and Mhaskar2010; Lasiecka, Damelin & Hoang Reference Lasiecka, Damelin and Hoang2018) to remove the holes from non-positive definiteness increased the current drive efficiency substantially. However, in-painting also spoiled the power calculation's self-consistency and led to an unstable iteration between TORLH and CQL3D that could not be used.
The RF power density $\mathcal {P}_{{\rm RF}}$ vs square-root poloidal flux $\sqrt {\psi _N}$
 at the final iteration of a TORLH/CQL3D (blue) and a GENRAY/CQL3D (orange) simulation of Alcator C-Mod shot #1060728011. Lines corresponding to the RF power density from integration of the CQL3D quasilinear diffusion term are solid and lines corresponding to RF power density obtained from integration of the TORLH $\boldsymbol {J}_p\boldsymbol {\cdot }\boldsymbol {E}$
 are dashed.

(a) The RF driven current density $J$ vs normalized square-root toroidal flux $\sqrt {\phi _n}$
 in a TORLH/CQL3D simulation (dashed) and a GENRAY/CQL3D simulation (dashed). Contours of the electron distribution function $f$
 at $\sqrt {\phi _n}\sim 0.5$
 vs $E$
 in keV, and velocity-space pitch angle $\vartheta$
 , for (b) a TORLH/CQL3D simulation and (c) a GENRAY/CQL3D simulation. Both panels (b,c) use the same contour levels to more effectively show the differences in RF diffusion of power to electrons with high energies.

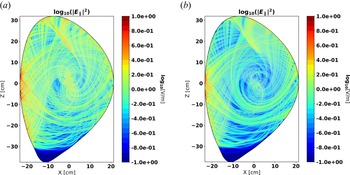
Unlike previous non-Maxwellian simulations of this discharge in Wright et al. (Reference Wright, Bader, Berry, Bonoli, Harvey, Jaeger, Lee, Schmidt, D'Azevedo and Faust2014) there was not as drastic a drop in the non-Maxwellian core electric fields at the first and the last iterations of the TORLH/CQL3D simulation, as shown in figure 7. The drop observed by Wright et al. (Reference Wright, Bader, Berry, Bonoli, Harvey, Jaeger, Lee, Schmidt, D'Azevedo and Faust2014) was due to the physically inconsistent nature of their calculations and an error in the $\chi _{{\rm zz}}$ table interpolation that led to wave damping being over-predicted. Despite having increased field amplitudes in our simulation, constructive interference does not seem to cause substantial differences in the power deposition profiles vs GENRAY. This has a simple explanation; the damped power's dependence on the slope of the distribution, $\propto \exp (-\zeta ^2)$
 for a Maxwellian distribution or $\propto \partial f / \partial v_\parallel$
 for a non-Maxwellian distribution, is a much stronger driver of power deposition location in $\psi$
 than the damped power's dependence on field intensity $\propto |E_\parallel |^2$
 . Thus, the power deposition profile should only be weakly affected by interference in most cases. Our result here demonstrates that the GENRAY simulations of weakly damped LHCD, which have been found to differ from experiment (Schmidt Reference Schmidt2011; Wright et al. Reference Wright, Bader, Berry, Bonoli, Harvey, Jaeger, Lee, Schmidt, D'Azevedo and Faust2014; Mumgaard Reference Mumgaard2015), accurately reproduce the power deposition profiles calculated with full-wave simulations. This indicates that the discrepancy between raytracing/FP results and experimentally measured current profiles is not due to full-wave effects such as diffraction or interference. Much like raytracing/FP, full-wave/FP simulations cannot accurately replicate the experimentally measured ohmic-like LHCD profiles which are peaked on axis.
The logarithmic contours of the normalized TORLH electric field (launched field in TORLH is normalized to $1\ {\rm V}\ {\rm m}^{-1}$ ) in simulations of Alcator C-Mod shot #1060728011 for Maxwellian damping (a), and non-Maxwellian damping (b).

4. Modulation scan simulations
The next set of Alcator C-Mod discharges modelled here were the LHCD modulation experiments performed by Schmidt et al. (Reference Schmidt, Bonoli, Meneghini, Parker, Porkolab, Shiraiwa, Wallace, Wright, Harvey and Wilson2011). In these experiments, 400 kW of LHCD was modulated with a 50 % duty cycle and a pulse time of 12.5 ms, in discharges that were primarily ohmic ($V_{{\rm loop}} = 1.0$ V) at high density $\bar {n} = 9.0 \times 10^{19}\ {\rm m}^{-3}$
 , with $T_{e0} \sim 2.2$
 keV. Three different launcher phasings $60^\circ$
 , $90^\circ$
 and $120^\circ$
 , corresponding to $N_\parallel = -1.6$
 , $-2.3$
 and $-3.1$
 , respectively, were used in these experiments. The GENRAY/CQL3D modelling was performed in the original analysis in Schmidt et al. (Reference Schmidt, Bonoli, Meneghini, Parker, Porkolab, Shiraiwa, Wallace, Wright, Harvey and Wilson2011) and Schmidt (Reference Schmidt2011) and compared with inverted experimental hard X-ray measurements, with mixed results. Qualitative agreement with experiment was obtained when $N_\parallel = -2.3$
 and $-3.1$
 , but agreement with experiment was very poor when $N_\parallel = -1.6$
 .
We repeated the analysis of these discharges with GENRAY/CQL3D and matched TORLH/CQL3D simulations using the IPS. The GENRAY simulations used 200 rays spread over 4 launch points to mimic the Alcator C-Mod LH1 launcher, the same custom dielectric described in § 3, and used a single fixed $N_\parallel$ value (except when otherwise noted). CQL3D in the GENRAY/CQL3D simulations used 48 equi-spaced flux surfaces and took 50, 0.25 ms timesteps for a total FP time of 12.5 ms (equivalent to the LHCD pulse time in the modulation experiments). The TORLH simulations used 2047 poloidal modes and 6000 radial finite elements and were run using 8160 cores and 255 nodes on Cori at NERSC in iterated simulations that lasted $\sim$
 36 h. The larger finite element number than the simulations in § 3 eliminated spectral pollution which occurred in the edge of the $N_\parallel = -2.3$
 and $-3.1$
 simulations. The CQL3D settings in the TORLH/CQL3D integrated simulations were the same as those in § 3, but CQL3D was iterated with TORLH only 25 times in order to achieve a FP time of $12.55$
 ms. All the simulations here used 400 kW of launched power like the experiments. The integrated $\boldsymbol {J}_p\boldsymbol {\cdot }\boldsymbol {E}$
 and power profiles obtained in CQL3D from integration of the quasilinear diffusion term closely agreed in all cases. Furthermore, the integrated power in all CQL3D simulations was within 2 % of the 400 kW target, meaning the degree of self-consistency achieved in these simulations was higher than any previous full-wave FP modelling study (Jaeger et al. Reference Jaeger, Berry, Ahern, Barrett, Batchelor, Carter, D'Azevedo, Moore, Harvey and Myra2006; Shiraiwa et al. Reference Shiraiwa, Ko, Parker, Schmidt, Scott, Greenwald, Hubbard, Hughes, Ma and Podpaly2011a; Wright et al. Reference Wright, Bader, Berry, Bonoli, Harvey, Jaeger, Lee, Schmidt, D'Azevedo and Faust2014; Lee et al. Reference Lee, Smithe, Wright and Bonoli2017a,Reference Lee, Wright, Bertelli, Jaeger, Valeo, Harvey and Bonolib; Bertelli et al. Reference Bertelli, Valeo, Green, Gorelenkova, Phillips, Podestà, Lee, Wright and Jaeger2017).
The RF power deposition profiles obtained from these simulations, shown in figure 8, found once again that GENRAY/CQL3D accurately reproduced the power deposition profiles calculated using TORLH/CQL3D. However, in the $N_\parallel = -3.1$ case GENRAY/CQL3D initially predicted a narrower power deposition peak. To obtain a close RF power deposition profile match with TORLH/CQL3D we had to broaden the launched GENRAY spectrum. This difference almost certainly was due to the influence of diffraction in the TORLH simulation, as diffraction is expected to broaden the spectrum symmetrically (Pereverzev Reference Pereverzev1992). A scan of $\Delta N_\parallel$
 values from 0.1 to 0.6 was performed and a GENRAY launcher spectrum with $\Delta N_\parallel = 0.4$
 was found to be the best match to the TORLH results. A comparison of the unbroadened and broadened damping is found in figure 9. The spectral broadening needed to account for diffraction is substantially less than the spectral width of the LH1 launcher in C-Mod where $\Delta N_\parallel = 1.0$
 (Shiraiwa et al. Reference Shiraiwa, Meneghini, Parker, Wallace, Wilson, Faust, Lau, Mumgaard, Scott and Wukitch2011b), indicating that the effects of diffractional broadening are relatively small. Furthermore, in the more weakly damped $N_\parallel = -2.3$
 and $-3.1$
 cases no spectral broadening in GENRAY was needed to obtain good agreement with TORLH. This indicates that the geometric upshift effect (Bonoli & Ott Reference Bonoli and Ott1981, Reference Bonoli and Ott1982), included in both simulations, is the dominant gap closure mechanism. Diffraction is only a small correction and relatively unimportant that can impart only modest broadening on the wave spectrum. Importantly, our results agreed well with the GENRAY/CQL3D results in Schmidt et al. (Reference Schmidt, Bonoli, Meneghini, Parker, Porkolab, Shiraiwa, Wallace, Wright, Harvey and Wilson2011), and neither the TORLH/CQL3D or GENRAY/CQL3D simulations agreed with experimental measurements in the weak damping, $N_\parallel = -1.6$
 , case where ohmic-like profiles were measured (Schmidt et al. Reference Schmidt, Bonoli, Meneghini, Parker, Porkolab, Shiraiwa, Wallace, Wright, Harvey and Wilson2011).
The RF power density $\mathcal {P}_{{\rm RF}}$ vs square-root toroidal flux $\sqrt {\phi }$
 calculated by CQL3D coupled with GENRAY (dotted) or TORLH (dashed) for 3 different Alcator C-Mod discharges using different LHCD launch phasings.

The RF power density $\mathcal {P}_{{\rm RF}}$ vs square-root toroidal flux $\sqrt {\phi }$
 calculated by CQL3D coupled with GENRAY (blue) or TORLH (orange) for two different values of GENRAY spectral broadness $\Delta N_\parallel = 0$
 (solid) and $\Delta N_\parallel = 0.4$
 (dashed).

Finally, current drive calculations were performed in each case. As in § 3, we observed GENRAY/CQL3D predicted total driven currents fairly close to experiments, but the TORLH/CQL3D simulations systematically under-predicted the current drive as a result of the holes present in the quasilinear diffusion coefficient. Current drive profiles in both the GENRAY/CQL3D and TORLH/CQL3D simulations closely followed the power deposition profiles, however, the TORLH/CQL3D current drive efficiency was again roughly ${\sim }70\,\%$ the value obtained in by the GENRAY/CQL3D simulations.
5. Conclusion and discussion
We performed the first fully self-consistent TORLH/CQL3D simulations of LHCD and demonstrated that full-wave effects, such as diffraction and interference, only weakly affect LH wave power deposition and current drive profiles. Diffractional broadening was quantified and found to be much smaller than the spectral broadening from finite launch spectrum width. In fact, diffraction was only noticeable in situations where the wave was damped in 2–3 passes and in weaker damping the LH spectral gap closure was completely dominated by the geometric upshift effect. Thus, it was determined full-wave effects cannot account for the differences between simulations of LHCD by raytracing/FP models and experiments, and despite breakdowns in the raytracing approximation that can occur at cutoffs and caustics, raytracing/FP simulations robustly reproduced full-wave/FP results. The primary discrepancy between raytracing and full-wave simulations, the reduced current drive efficiency observed in full-wave simulation, may be explained by systemic error introduced from the non-positive definiteness of the full-wave quasilinear diffusion coefficient. This presents an obvious topic for future work, but as positive definite formulations of the quasilinear diffusion coefficient are ${>}\mathcal {O}(10^6)$ more expensive than the standard formulation of $D_{{\rm ql}}$
 used here (Lee et al. Reference Lee, Smithe, Wright and Bonoli2017a), they were deemed too computationally demanding for implementation in the LHCD problem. Another complication of implementing such a form of the quasilinear diffusion is that it may be necessary to perform a correction for the parallel magnetic field inhomogeneity to $\textrm {Im}[\chi _{{\rm zz}}]$
 to ensure self-consistency (if the inhomogeneous correction is physically relevant outside of ensuring $D_{{\rm ql}}$
 positive definiteness). However, if positive definite forms of $D_{{\rm ql}}$
 could be implemented they would have the added benefit of self-consistently including evanescent modes we have removed in the simulations here as they do not model resonant damping with a delta function.
Our TORLH/CQL3D results are the first full-wave LHCD simulations to demonstrate both precise RF power deposition and integrated power agreement between the full-wave electric field and the FP simulation results without the use of numerical power rescaling factors. To do this many of the non-Maxwellian components in the TORLH/CQL3D simulations were rewritten with a focus on improving self-consistency. We implemented noise reduction and fixed errors in the quasilinear diffusion coefficient formulation, improved the $\textrm {Im}[\chi _{{\rm zz}}]$ formulation in TORLH to use $f$
 derivatives matched to those in CQL3D, implemented a robust iteration framework using the IPS and improved TORLH's performance so that it could be run at higher resolution to suppress spectral pollution. This allowed us to perform the very large, 8000$+$
 cores for 36$+$
 h, simulations here. In total, this study used ${\sim }100$
 million total CPU hours over 4 years on NERSC.
In summary, full-wave effect influences on LHCD power and current deposition profiles appear to be small. Our simulations indicate raytracing/FP simulations accurately reproduce LH wave propagation and damping in the core of tokamaks, but in some cases with stronger damping there may be a small correction related to diffraction that will usually be smaller than other corrections, such as finite launcher spectrum width. If the LHCD is moderately damped, and a launcher with a very small spectral width is used or very accurate simulations are required, an effective way to account for diffractional broadening might be the use of a higher-order accurate WKB method such as beamtracing that captures diffraction (Bertelli et al. Reference Bertelli, Maj, Poli, Harvey, Wright, Bonoli, Phillips, Smirnov, Valeo and Wilson2012; Poli et al. Reference Poli, Bock, Lochbrunner, Maj, Reich, Snicker, Stegmeir, Volpe, Bertelli and Bilato2018; Hugon, Bizarro & Rodrigues Reference Hugon, Bizarro and Rodrigues2020).
Acknowledgements
The authors would like to thank D.B. Batchelor for his help with the IPS.
Editor Cary Forest thanks the referees for their advice in evaluating this article.
Funding
This work was supported by Scientific Discovery Through Advanced Computing (SCIDAC) Contract No. DE-SC0018090 and Department of Energy grant: DE-FG02- 91ER54109. This research used resources of the National Energy Research Scientific Computing Center, a DOE Office of Science User Facility supported by the Office of Science of the U.S. Department of Energy under Contract No. DE-AC02-05CH11231 using NERSC award FES-ERCAP0020035.
Declaration of interests
The authors report no conflict of interest.
Appendix A. The $\textrm {Im}[\chi _{{\rm zz}}]$ formulation from CQL3D plasma distributions

To begin our derivation of a non-Maxwellian $\textrm {Im}[\chi _{{\rm zz},e}]$ appropriate for use in TORLH we take the $n=0$
 $zz$
 components of the relativistic hot plasma dielectric for a general distribution function from Stix (Reference Stix1992)

where relativistic momentum $\boldsymbol {p}=\gamma m_0 \boldsymbol {v}$ and we have denoted quantities which use the rest mass, $m_0$
 , with subscript $0$
 and quantities that utilize the relativistic mass $\gamma m_0$
 without a subscript, i.e. $\varOmega = \varOmega _o/\gamma$
 . Integrating in $p_\parallel$
 and taking the imaginary component from the residue of the pole in the resonant denominator yields

We want to create a lookup table in TORLH that is a function of radial location $\psi$ , flux surface angle $\theta$
 and $N_\parallel$
 using derivatives of the CQL3D distribution function at the outboard midplane $F_0(\psi,u,\vartheta )$
 . We transform (A2) into a more convenient form in terms of CQL3D and TORLH variables with the following relations:


where $\boldsymbol {u}_n$ is the normalized momentum per rest mass, and $\sigma _\pm = \textrm {Sign}(\omega /k_\parallel )$
 . Using these equations we may rewrite (A2) in terms of our normalized table variables


Finally, we must rewrite the derivative of the distribution function $\partial f / \partial p_\parallel$ in terms of the distribution function at the outboard midplane that is output by CQL3D this requires that we relate $f(p_\parallel,p_\perp,\theta,\psi )$
 to $F_0(u,\vartheta _0(\vartheta,\theta ),\psi )$
 , where $\vartheta$
 is the velocity-space pitch angle. These quantities may be related by applying conservation of momentum and magnetic moment yielding equation

With this our derivation of $\chi _{{\rm zz}}$ is complete. To construct the lookup table a grid in $\theta$
 and $N_\parallel$
 must be specified (the $\psi$
 grid is set automatically based on the CQL3D flux surface locations), and an integration grid in $u_\perp$
 must also be specified. Then, $\chi _{{\rm zz}}$
 is calculated from the CQL3D distribution function at each grid point. In order to find $\partial f/ \partial p_\parallel$
 the nearest neighbour point on the CQL3D grid point corresponding to the Landau resonance location at a given $u_\perp$
 and $u_\parallel$
 is used (no noticeable improvement in self-consistency was observed with more complicated interpolations).