I. INTRODUCTION
The existence of numerous grain boundaries (GBs) in nanocrystalline (NC) materials with respect to their conventional coarse-grained (CG) counterparts leads to a variation (mostly an improvement) of their mechanical, chemical, and physical properties. Reference Gleiter1–Reference Gleiter4 However, NC materials, because of considerable energy stored in GBs, become thermodynamically unstable with increases in temperature. This allows the stored energy to be released by grain growth. The microstructural evolution with temperature irreversibly degrades the unique mechanical, chemical, and physical properties that only the NC materials have. Hence, an understanding of the thermal stability of a typical NC material is essential for its practical application, particularly in an environment under high temperatures.
In the past decades, the thermal stability of NC Ni electrodeposits (EDs), due to their ease of fabrication and promising applications in recording heads and soft magnetic disk components, micro-electromechnical systems (MEMS), parts acquired for repairing nuclear steam generator tubes, Reference Clark, Wood and Erb5–Reference Palumbo, Gonzalez, Brennenstuhl, Erb, Shmayda and Lichtenberger7 etc., has been studied. Normal growth of NC Ni grains occurred quickly at approximately 290 °C but was significantly retarded in the presence of a small amount of impurities and/or solute atoms. Reference Klement, Erb, El-Sherik and Aust8–Reference Cziraki, Tonkovics, Gerocs, Fogarassy, Groma, Tothkadar, Tarnoczi and Bakonyi18 The retardation of grain growth has been proposed to be the result of GB segregation of the impurities and/or solid solute elements, which normally reduce the GB energy from a thermodynamic point of view and/or allow the GB mobility to be more difficult from a kinetic point of view due to a solute drag effect. Reference Weissmüller19–Reference Michels, Krill, Ehrhardt, Birringer and Wu22 Moreover, based on the thermodynamic calculations by Kirchheim, Reference Kirchheim23 the GB energy of some NC materials can be decreased further by an in situ precipitation of solute-rich particles if the precipitation occurs spontaneously. Such a typical example is that the precipitates of Ni3P greatly retarded the growth of Ni nanograins through the Zener drag effect. Reference Mehta, Smith and Erb12,Reference Rohrer24 Attention has also been paid to the effect of ex situ inert particles on the thermal stability of NC matrix. For example, daSilva et al. Reference daSilva, Klement and Hibbard25 have reported that the thermal stability of the NC Co matrix was not influenced by the addition of approximately 3.1 wt% B4C particles with a mean size in the micrometer range (i.e., the particle size ranged from some hundred nm to 8 μm). Based on our current knowledge, publications about the effect of ex situ particles on the thermal stability of the NC matrix have been still lacking, especially when the particles are in the nm range.
In this work, the thermal stability up to 400 °C of NC Ni EDs with the addition of CeO2 nanoparticles has been compared to that of pure NC Ni EDs. The result will be useful not only for better understanding the effect of second inert particles on the growth of nanograins but also in providing reference data for exploring the feasibility of practical application of NC metals with dispersions of nanoparticles as precursor materials for chemical heat treatment (e.g., nitriding, Reference Zhao, Peng, Wang and Wang26 chromizing, Reference Zhang, Peng, Zhao and Wang27,Reference Peng, Yan, Zheng and Wang28 and aluminizing Reference Xu, Peng and Wang29−Reference Zheng, Peng and Wang31 ). Although the treatment temperatures (normally >600 °C) were substantially decreased by the application of these NC precursors than that of their conventional CG counterparts (normally >900 °C), grain growth would occur under the temperatures leading to an unacceptable decrease in the growth kinetics of the chemically treated layer.
II. EXPERIMENTAL
Ni with dispersions of CeO2 nanoparticles was available by means of electrodeposition using a pulse reversal current power supply from a CeO2-particle-loaded nickel sulfate bath containing 150 g/L NiSO4·6H2O, 15 g/L H3BO3, 15 g/L NH4Cl, 0.1 g/L C12H25NaSO4, and 1 g/L saccharin. Two CeO2-free NC Ni EDs were also prepared for comparison. One was electrodeposited using the same electrodeposition parameters and the same bath but without the addition of CeO2. The pulse reverse plating parameters are the same as those used in our previous work. Reference Zheng, Peng and Wang32,Reference Zheng, Peng and Wang33 The other was deposited from the same CeO2-free bath but using a pulse power. Reference Zheng, Peng and Wang33 The NC Ni EDs with and without the CeO2 dispersions were prepared on pure copper (>99.5%) plate coupons of 20 × 20 × 0.5 mm and nickel (99.9%) plate coupons of 15 × 10 × 2 mm. The EDs peeled off from the copper plate were rinsed using distilled water and ultrasonically cleaned in acetone for calorimetric measurements.
Differential scanning calorimetry (DSC) measurements were conducted on a NETZSCH STA 449C instrument (NETZSCH, Selb, Germany). Approximately 10 mg of the three above mentioned NC EDs with or without CeO2 was placed in an alumina pan with a diameter of 7 mm and a height of 4 mm in the DSC chamber. The chamber was first pumped down to a vacuum of approximately 10−2 Pa and then filled with ultrahigh purity argon (99.999%). This process was repeated for more than 3 times to dilute residual air in the chamber so that to minimize the effect of air on this study. Afterward, it was heated up to a set temperature (400 °C in this work) with a continuous flow of argon (approximately 30 mL/min) at a desired heating rate. After cooling down to room temperature at a rate of 20 °C/min, a second DSC scan with the same heating rate provided the baseline for the data analysis.
Temperature-dependent evolution of the microstructures of the EDs with and without CeO2 was characterized using FEI Tecnai™ G2 20 transmission electron microscopy (TEM; FEI Company, Hillsboro, Oregon) and Philips XL-30FEG scanning electron microscopy (SEM; FEI Company). For TEM investigation, samples were ion-milling thinned to transparency. The samples for SEM observation were prepared using the following method: the samples were sealed in a quartz tube with an inside pressure of approximately 10−2 Pa and immediately quenched into water to room temperature when the quartz tube was heated to the desired temperature in a furnace, then polished and electrolytically etched in a solution of 10 mL HNO3 + 90 mL CH3CH2OH at room temperature (approximately 25 °C).
III. RESULTS AND DISCUSSION
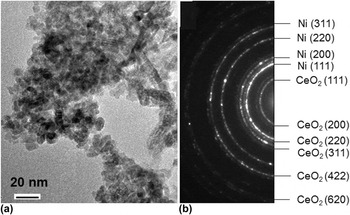
The size of the CeO2 particles used in this work was in a nanoscale region with a mean value of approximately 7 nm, as seen from a TEM bright-field image given in Fig. 1(a). The CeO2 nanoparticles, after loaded into the bath, were incorporated into the electrodeposited Ni matrix. This result could be also evidenced from a TEM selected area electron diffraction pattern of Fig. 1(b) (a typical TEM bright-field image will be provided later), where the rings of CeO2 could be clearly distinguished from those of Ni. According to the measurement of a few hundred Ni grains in the TEM bright-field images, the mean size of the Ni grains with dispersions of CeO2 particles was 28 ± 10 nm. The energy dispersive spectroscopy (EDS) analysis indicated that the content of the CeO2 nanoparticles in the Ni EDs was approximately 4.0 wt%. The “pure” NC Ni EDs were available from the CeO2-free bath. The grain size of Ni could be controlled by slightly changing the pulse power deposition parameters. For better understating the effect of CeO2 co-deposition on the thermal stability of the NC Ni, two Ni EDs were presented here. One, fabricated with the same electrodeposition parameters as CeO2-containing NC Ni, had a mean grain size of 34 ± 12 nm, which was slightly larger than that of the CeO2-containing NC Ni. The other one had a mean grain size of 18 ± 7 nm, which was slightly smaller than that of the CeO2-containing NC Ni.
(a) TEM bright-field image of CeO2 nanoparticles and (b) selected area electron diffraction pattern of as-deposited NC Ni with CeO2, showing CeO2 rings in it.

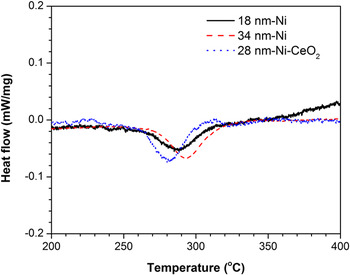
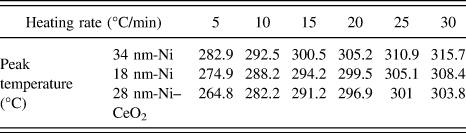
DSC curves of CeO2-free and -containing NC Ni EDs at a heating rate of 10 °C/min are given in Fig. 2. An exothermic peak with different onset (T o) and peak (T p) temperatures can be seen in each of these curves. The DSC curves of pure Ni are consistent with the result of NC Ni EDs reported by Cziraki et al. Reference Cziraki, Tonkovics, Gerocs, Fogarassy, Groma, Tothkadar, Tarnoczi and Bakonyi18 but do not correspond with the observations by Klement et al., Reference Klement, Erb, El-Sherik and Aust8 i.e., there were two peaks, a broad low-temperature exotherm associated with abnormal grain growth and a sharper and more pronounced high-temperature exotherm associated with normal grain growth. The low-temperature exotherm is missing in the studies from this work and that of Cziraki et al., Reference Cziraki, Tonkovics, Gerocs, Fogarassy, Groma, Tothkadar, Tarnoczi and Bakonyi18 which is still unclear but might be from the effects of the impurities in the EDs (e.g., different amounts of sulfur), and the different initial grain sizes of NC Ni and their distribution that retarded the abnormal grain growth with respect to the study from Klement et al. Reference Klement, Erb, El-Sherik and Aust8 The value of T p was 292.5 °C for the 34 nm-grained Ni and 288.2 °C for the 18 nm-grained Ni, suggesting that the exothermic reaction might be slightly advanced with decreases in the grain size. However, although being 10 nm larger than the 18 nm-grained Ni, 28 nm-grained Ni with CeO2 exhibited a lower peak temperature of 282.2 °C, indicating that the co-deposition of CeO2 affected the exothermic reaction of the NC Ni EDs. For various heating rates, the DSC curves of the three samples with and without CeO2 showed the same variation trend in T p, as summarized in Table I. Although T p increases with the heating rate, the lowest T p was observed all the time for the NC Ni EDs with CeO2 at each heating rate. Based on the dependence of T p on the scan rates, the activation energy (E a) for the occurrence of the exothermic peak can be calculated using the Kissinger equation [Eq. (1)], Reference Kissinger34
 $$\ln \left( {{B \over {\mathop {{T_{\rm{p}}}}\nolimits^2 }}} \right) = - {{{E_{\rm{a}}}} \over {R{T_{\rm{p}}}}} + c\quad ,$$
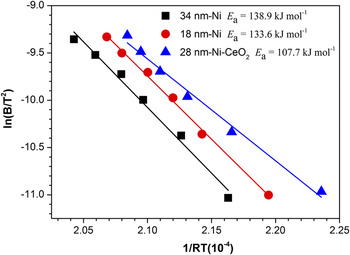
where B is the heating rate, R is the gas constant, and c is a constant. The values of ln(B/T 2) measured for the three EDs linearly decrease with 1/(RT), as shown in Fig. 3. By calculating the line slope, the value of E a is obtained. It is 138.8 and 133.6 kJ/mol for the pure 34 nm- and 18 nm-grained Ni, respectively. Although being larger than the 18 nm grains, the 28 nm-grained Ni with CeO2 in reverse exhibited the lowest E a of 107.7 kJ/mol. This strongly demonstrates that the co-deposition of CeO2 causes a process (which gives rise to the exothermic peak) to be relatively easily activated in the NC Ni EDs. By integrating the area of the peak in the DSC curves, the exothermic energy (ΔH r) from a decrease in the total area of the GBs due to grain growth of the NC Ni grains can be calculated. Insignificant changes in ΔH r are observed among the three NC Ni EDs. That is, it is 9.1 ± 0.5 J/g, 9.5 ± 0.8 J/g, and 8.8 ± 0.9 J/g for the 34 nm-grained Ni, 18 nm-grained Ni, and 28 nm-grained Ni with CeO2, respectively. This indicates that the grain growth of NC Ni EDs with and without CeO2 cannot be distinguished by the values of ΔH r in this study.
DSC curves of as-deposited NC Ni with and without CeO2 at a heating rate of 10 °C/min.

Exothermic peak temperatures at various heating rates for the differently-grained NC Ni with and without CeO2.

Kissinger’s plot of ln(B/T 2) versus 1/(RT) for grain growth of as-deposited NC Ni with and without CeO2.

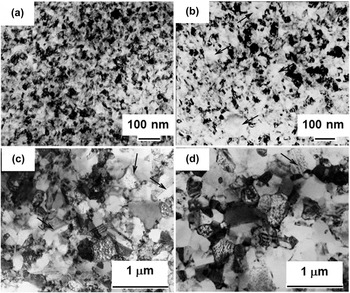
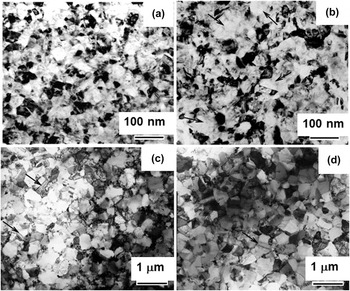
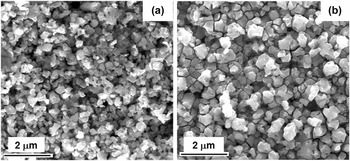
To better understand the structural evolution of the NC Ni EDs with and without CeO2 during the DSC scan, these samples at the temperatures at or close to T o, T p, and T e (the peak end temperature) were investigated using TEM. Compared with those in the as-deposited state [Fig. 4(a)], the CeO2-dispersed Ni EDs at T o (235 °C) exhibited a bimodal structure, i.e., most nanograins exhibited insignificant change in size but some apparently became larger (over 100 nm, as some indicated by arrows) [Fig. 4(b)]. The increase in the size of some Ni NC grains has been correlated with their abnormal growth, Reference Klement, Erb, El-Sherik and Aust8–Reference Hibbard, Erb, Aust, Klement and Palumbo10 which occurs due to the coalescence of nanograins in orientation in close proximity to each other. Reference Klement, Erb, El-Sherik and Aust8 The abnormal grain growth somewhat aggravated with the temperature up to 250 °C (the shoulder area of the peak in Fig. 2) and around T p (290 °C) no bimodal structure was seen but all the Ni grains grew to a submicron size of 293 ± 54 nm [Fig. 4(c)], suggesting that the abnormal grain growth was dominant before T p. Afterward, the normal grain growth occurred, reaching a mean size of 320 ± 118 nm around T e (345 °C) as shown in Fig. 4(d). A similar “abnormal to normal” grain growth of NC Ni without CeO2 was also observed when correspondingly heating from T o to T e, as one example of the structural evolution of the averagely 34 nm-grained Ni shown in Fig. 5(a)–5(d). But around T e (345 °C) the Ni grains were in the size of 419 ± 148 nm as shown in Fig. 5(d), about approximately 100 nm larger than the Ni grains dispersed with the CeO2. In addition, the noticeable grain growth of Ni at temperatures around and over 290 °C caused the formation of twins in the Ni grains regardless of CeO2, as some indicated with arrows in Figs. 4(c), 4(d), 5(c), and 5(d). Figure 6 shows the SEM observation of the samples of the 34 nm-grained CeO2-free and 28 nm-grained CeO2-containing Ni immediately quenched into water to room temperature after heating to 345 °C in vacuum (approximately 10−2 Pa). The mean grain size of the CeO2-containing Ni was 329 ± 103 nm [Fig. 6(a)], considerably smaller than that of the CeO2-free Ni (476 ± 164 nm) [Fig. 6(b)]. Both the TEM and SEM comparison results indicate that the growth kinetics of the NC grains is significantly retarded by the presence of CeO2.
Evolution of bright-filed TEM images of the electrodeposited Ni NC grains with CeO2 dispersion (a) at room temperature (as-deposited), and after heating up to (b) 235, (c) 290, and (d) 345 °C at a rate of 10 °C/min, arrows show some abnormal grains in (b) and twins in (c) and (d).

Evolution of bright-filed TEM images of the electrodeposited Ni NC grains (mean size 34 nm) without CeO2 dispersion (a) at room temperature (as-deposited), and after heating up to (b) 235, (c) 290, and (d) 345 °C at a rate of 10 °C/min, arrows show some abnormal grains in (b) and twins in (c) and (d).

SEM images of (a) 28 nm-Ni-CeO2 and (b) 34 nm-Ni EDs after linearly heating to 345 °C with a rate of 10 °C/min, and subsequently water quenching to room temperature.

Therefore, the co-deposition of CeO2 nanoparticles was seen to have dual effects on the thermal stability of the NC Ni EDs. That is, it slightly decreased the temperature for the growth of NC Ni matrix grains but significantly increased the resistance to further growth of the grains at a higher temperature (the value of which depends on the heating rate and is close to 345 °C at the rate of 10 °C/min).
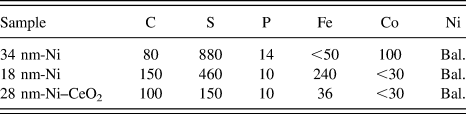
It is known that impurities, mainly sulfur, could affect the NC grain growth significantly. Reference Klement, Erb, El-Sherik and Aust8,Reference Hibbard, Aust and Erb35,Reference Hibbard36 Therefore, to better understand the effect of co-electrodeposition of CeO2 nanoparticles on the NC Ni grain growth, chemical compositions of these three EDs were analyzed by inductively coupled plasma atomic emission spectroscopy (ICP-AES). As can be seen from Table II, the sulfur contents of the 18 nm-grained Ni (460 ppmw) and the 28 nm-grained Ni with CeO2 (150 ppmw) are about half and one sixth of that of the 34 nm-grained Ni (880 ppmw). This indicated that the co-deposition of CeO2 nanoparticles dramatically decreased the impurity of sulfur in the Ni ED. Similar results were seen elsewhere. Reference Zhao, Dong, Chen, Ma, Wang, Wang, Yang and Shao37–Reference Zhang, Li, Liu, Liu and Yan39 One reason for the decrease in the sulfur content in the CeO2-containing Ni ED with respect to the CeO2-free counterparts is that, based on the adsorption energies of atomic sulfur on Ni (approximately 100 kcal/mol Reference Choi, Compson, Lin and Liu40,Reference Rodriguez and Hrbek41 ) and CeO2 (approximately 50 kcal/mol Reference Chen, Choi, Liu and Lin42 ), the co-deposited CeO2 particles would act as “inert” rather than “active” sites for the adsorption of sulfur-containing additive of saccharin in the bath during electrodeposition processing. Reference Zheng, Peng and Wang33,Reference Zhao, Dong, Chen, Ma, Wang, Wang, Yang and Shao37–Reference Zhang, Li, Liu, Liu and Yan39,Reference El-Sherik and Erb43–Reference Brenner45 In addition, the co-deposited CeO2 particles are normally dispersed at or along the GBs where the sulfur prefers to reside as reported by Klement and Hibbard. Reference Klement, Erb, El-Sherik and Aust8,Reference Hibbard, Aust and Erb35,Reference Hibbard36 This might be another reason that sulfur content decreases with CeO2 co-deposition. Subsequently, a lower sulfur content would decrease the onset temperature for the grain growth of NC Ni, which is consistent with the DSC results (Figs. 2 and 3 and Table I) and the observations from other researchers. Reference Klement, Erb, El-Sherik and Aust8,Reference Hibbard, Aust and Erb35,Reference Hibbard36
Chemical composition (ppmw) of the three differently-grained NC Ni with and without CeO2.

Another possible reason for the acceleration of grain growth of NC Ni might be due to the effect of the co-electrodeposited CeO2 nanoparticles on the relative value of the driving force (F 1) for grain-growth process and the drag force (F 2) for the GB movement. Normally, F 1 is associated with the GB energy by the well-known Gibbs-Thomson equation [Eq. (2)], Reference Shewmon46
 $${F_1} = {{8\Omega \gamma } \over D}\quad ,$$
where Ω is the atomic volume, γ is the GB energy, and D is the grain size of the Ni matrix (with a diameter D). The co-electrodeposited CeO2 particles normally are incoherent with the Ni matrix and their dispersion increases the area of the Ni GBs, leading to an increase in F 1. Thus, the initiation of the NC Ni grains is promoted by the presence of the CeO2 particles, if their dispersion does not significantly increase F 2, which can be expressed by Eq. (3), Reference Rollett, Humphreys, Rohrer and Hatherly47 assuming that the CeO2 particles were spherical in shape and the grain size is much larger than the particle spacing,
 $${F_2} = {{Df\lambda } \over {4{r^2}}}\quad ,$$
where λ is the energy of Ni/CeO2 incoherent interface, f is the volume fraction of CeO2 particles, and r is the particle size.
Although the sulfur content was much lower in the 28 nm-grained Ni with CeO2 than the pure Ni EDs (Table II) indicating an acceleration of grain growth, Reference Klement, Erb, El-Sherik and Aust8,Reference Hibbard, Aust and Erb35,Reference Hibbard36 the grain size of the Ni EDs with CeO2 was observed at 345 °C (Fig. 6) to be noticeably smaller than that without CeO2. This might be explained by the increase in drag effect of CeO2. That is, the grain growth with increases in temperature tends to increase F 2 but decrease F 1. After reaching a critical grain size of Ni, the F 2 would be dominated when compared to F 1 as well as the drag effect of sulfur, which retarded the grain growth considerably at higher temperatures.
The results of the dual effects of the co-electrodeposition of approximately 4 wt% 7 nm-sized CeO2 particles on the thermal stability of the NC Ni matrix are inconsistent with the observations of insignificant effect of the co-electrodeposition of approximately 3.1 wt% microsized B4C particles on the thermal stability of the NC Co matrix reported by daSilva et al. Reference daSilva, Klement and Hibbard25 One possible reason for the difference might be the different effects of the co-electrodeposition of CeO2 nanoparticles and B4C microparticles on the impurity content (mainly sulfur) in NC Ni and Co matrices, respectively. Another possible reason might be that the B4C particles in the NC metal matrix were in the micron size range. This leads to a dramatic decrease in the number as well as the distribution uniformity of the B4C particles, with respect to the CeO2 particles in the nanorange, in the NC metals. Reference Chen and Gao48 Therefore, the ceramic microparticles might not be as effective as their nanoparticles in affecting the thermal stability of the NC metal matrix. The size effect of second inert ceramic particles on the thermal stability of a NC matrix is another topic deserved to be further investigated.
IV. CONCLUSIONS
The co-electrodeposition of CeO2 nanoparticles, although helps decrease the onset temperature of the growth of the NC Ni grains, noticeably retards the grain-growth kinetics. The retardation effect on the NC grain growth becomes more significant as the grain size increases with grain growth.
ACKNOWLEDGMENTS
The work is supported by National Natural Science Foundation of China (NSFC, project Grant No. 51271189).