I. INTRODUCTION
Increasing interest toward smart homes and internet of things (IoT) has emerged the recent years. Transceiver providing different services to communicate and control different sensors for home automation becoming more and more attractive. Services such as ZigBee, wireless local area network (WLAN), and Bluetooth are popular and share the frequency bands up to 5.8 GHz. Covering also the K u band, additional standards such as digital video broadcasting - satellite can be provided. Combining for example WLAN and DVB-S exceeds in a multimedia entertainment for satellite television and videos on demand.
To make such transceiver cost-effective and therefore accessible for the broad population demands for a highly scaled complementary metal-oxide semiconductor (CMOS) technology suitable for mass production. Designing compact analog circuits in such a technology benefits from a future implementation of a complete transceiver on a system on chip (SoC). A SoC combines the advantages of fully integrated high-performance digital signal processing with compact analog circuits. Additionally to the radio frequency (RF)-building blocks, a SoC provides the opportunity to efficiently integrate the baseband and built-in-self-calibration circuitry on the chip [Reference Fritsche, Tretter, Carta and Ellinger1, Reference Ponton, Palestri, Esseni, Selmi, Tiebout and Parvais2].
Despite these advantages highly scaled field effect transistor (FET) in bulk CMOS technology are known for their low intrinsic gain, their low breakdown voltage, their leakage currents, and their high flicker noise. The available technology is optimized for digital low-power design and does not support analog design components in term of RF transistor devices and models, metal insulator metal (MIM) capacitors and inductors [Reference Fritsche, Tretter, Carta and Ellinger1, Reference Ponton, Palestri, Esseni, Selmi, Tiebout and Parvais2]. To optimize the low-noise amplifier (LNA) for high voltage gain is challenging and can be only obtained at the expense of DC power consumption and high NF. To compensate the increase in NF, the width of the transistor can be adapted and which in turn affects the bandwidth. Another possibility to increase the voltage gain is the approach of a multi-stage topology consisting of several common source or cascode stages [Reference Fritsche, Tretter, Carta and Ellinger1, Reference Antonopoulos, Papathanasiou, Bucher and Papathanasiou3].
Many different approaches of broadband LNA in scaled CMOS can be found, most commonly they consist of common gate stages, sometimes with noise canceling [Reference Blaakmeer, Klumperink, Leenaerts and Nauta4] or common source and cascode topologies with feedback. The feedback can be implemented as inductive source degeneration [Reference Egels, Gaubert, Pannier and Bourdel5] or with resistive negative feedback [Reference Bevilacqua, Camponeschi, Tiebout, Gerosa and Neviani6, Reference Tsai, Hsu, Hsueh, Jou, Chen and Song7]. Other promising architectures are distributed LNAs [Reference Machiels, Reynaert and Steyaert8, Reference Chirala, Guan, Huynh and Nguyen9]. However, one disadvantage of these architectures are, that the bandwidth defines the chip area and the power consumption and makes this not suitable for ultra compact and wideband LNAs.
The work in [Reference Joram, Wagner, Sobotta and Ellinger10] combines the idea of feedback and multi-stage topology with differential amplifiers. The differential design rejects power supply and substrate noise and minimize second-order distortion, which is a key parameter for direct conversion receivers [Reference Blaakmeer, Klumperink, Leenaerts and Nauta4]. However, differential designs need an additional balun to be connected to the antenna, which itself reduces the gain. The LNA in [Reference Joram, Wagner, Sobotta and Ellinger10] is designed in a 180 nm BiCMOS technology and shows promising results. In this work, a similar topology is optimized and implemented in the 28 nm CMOS process.
In the following sections, two ultra compact LNAs with different peaking elements are designed and both versions are compared by measurement results. In Section II, the circuit is introduced and the FETs are dimensioned using the g m/I D-based method suitable for highly scaled low-power bulk CMOS technologies. The RF transistors are sized for a tradeoff between noise, gain, and bandwidth. To guarantee the application of the LNA in multi-band operation inductive peaking of the loads is required. The Section II-C investigates three possibilities for the realization of these components and their advantages and disadvantages. Finally, the implementation of the two versions is described and measured in Section III.
II. DESIGN CONSIDERATIONS
A) Overview
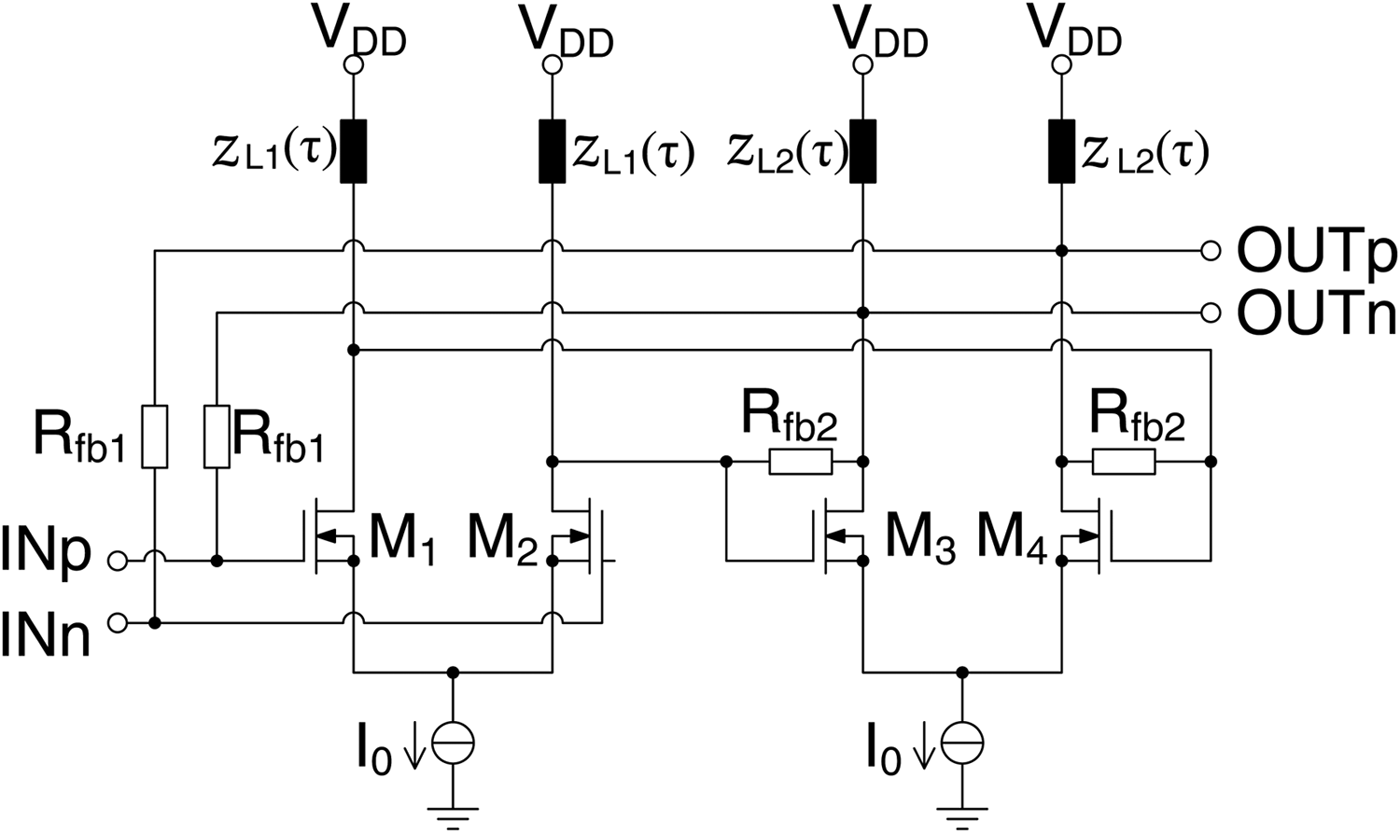
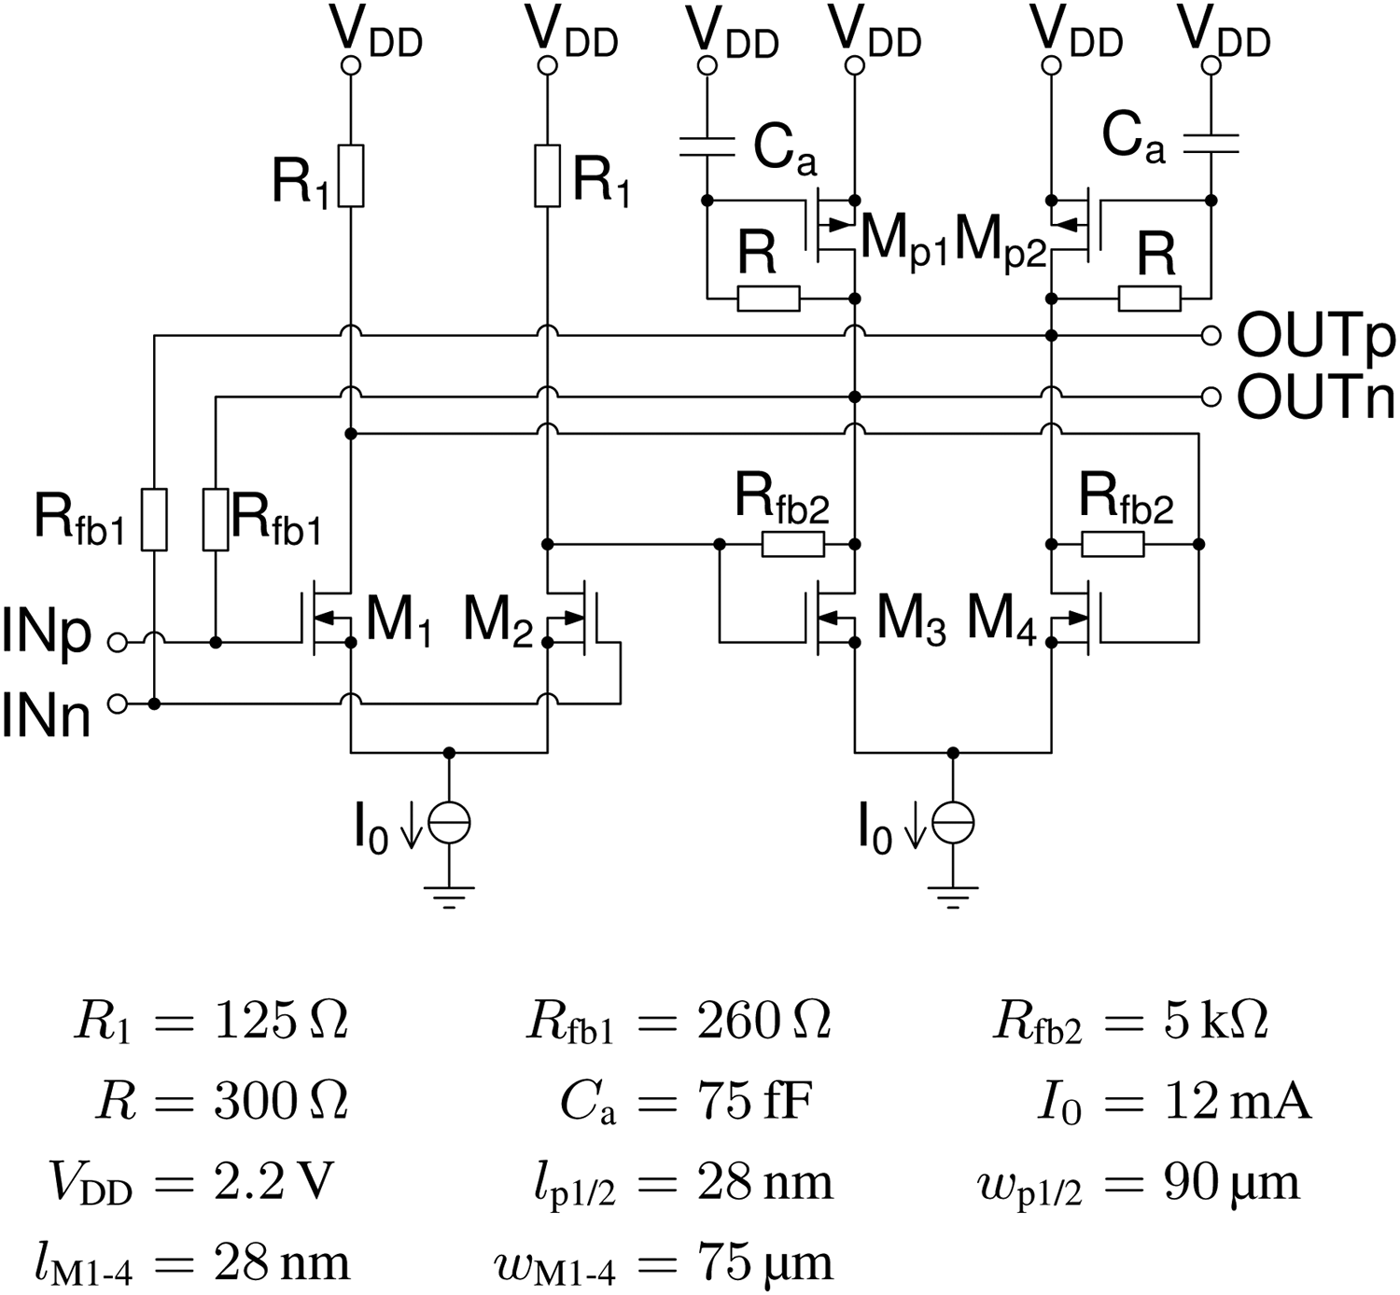
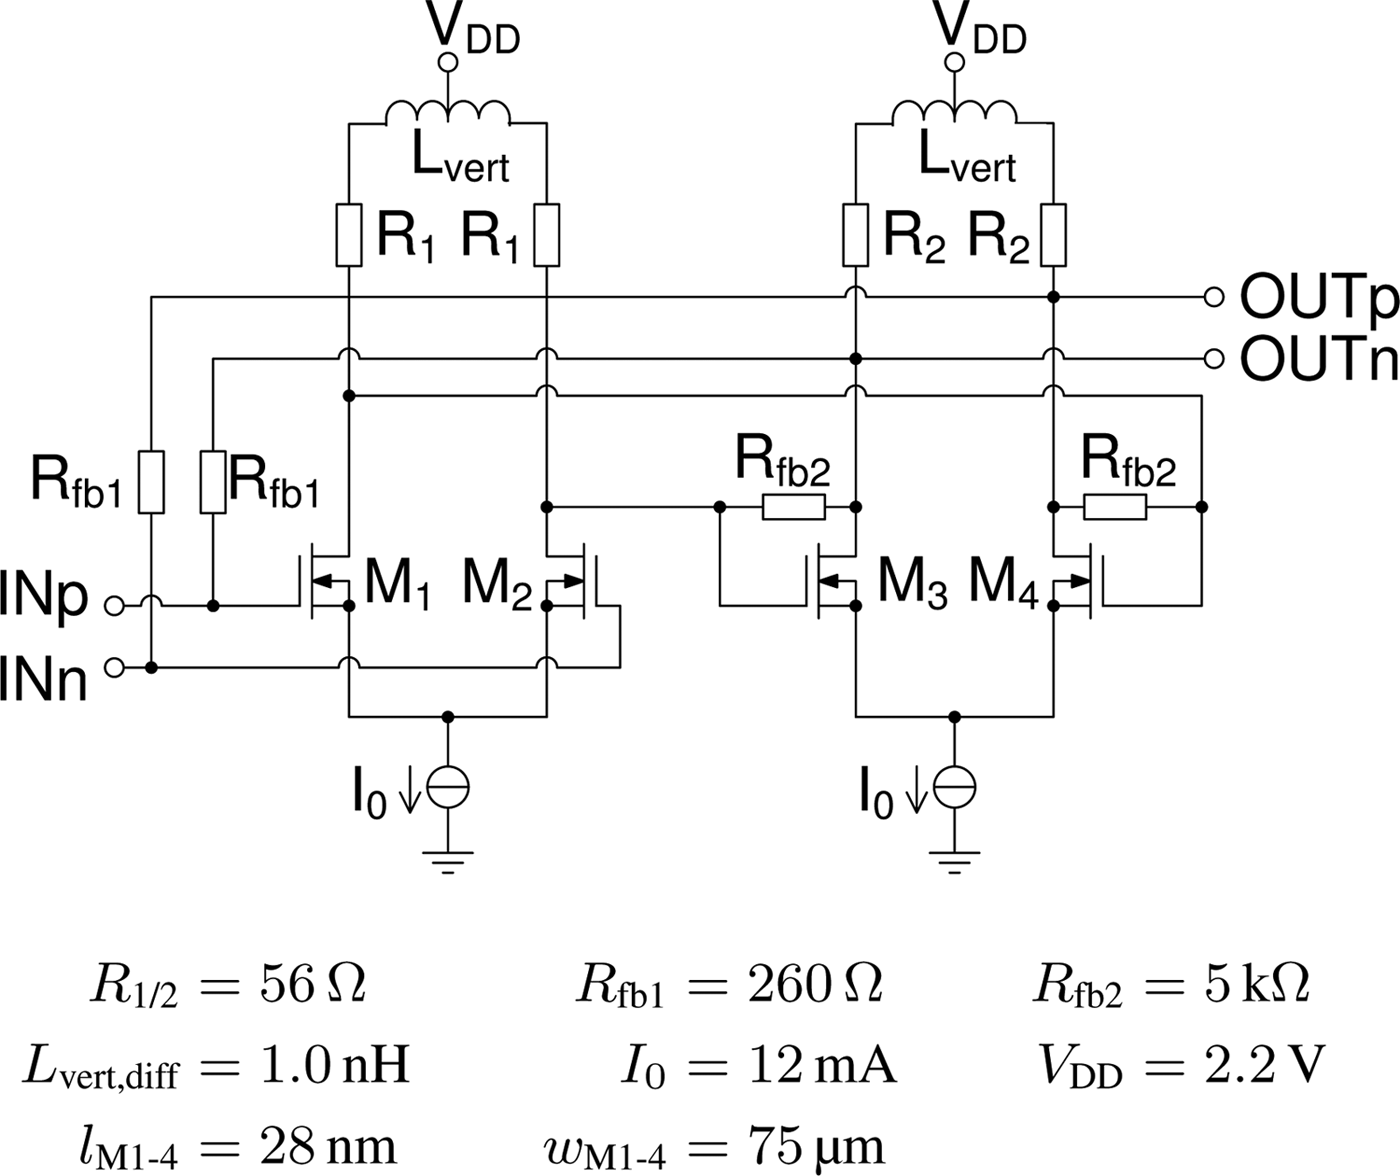
The design goals for the LNA are a high bandwidth to cover multiple frequency bands up to the K u of maximum 18 GHz, a moderate voltage gain and NF, and a compact layout. The basic schematic representation of the proposed LNA with feedback is shown in Fig. 1. Since the variety of components of the schematic only includes resistors and transistors, the size of the layout is expected to be low and mainly linked by the impedances z L1(τ). The circuit consists of two cascaded differential amplifiers and two feedback loops. One feedback loop describes an overall feedback, which influences input and output impedances, as well as the gain. The other feedback loop only includes the second differential amplifier stage and can be used for fine tuning. Negative feedback improves bandwidth, lowers temperature variations, and ripples on the gain curve. These advantages come at the cost of voltage gain.
Schematic representation of the LNA.
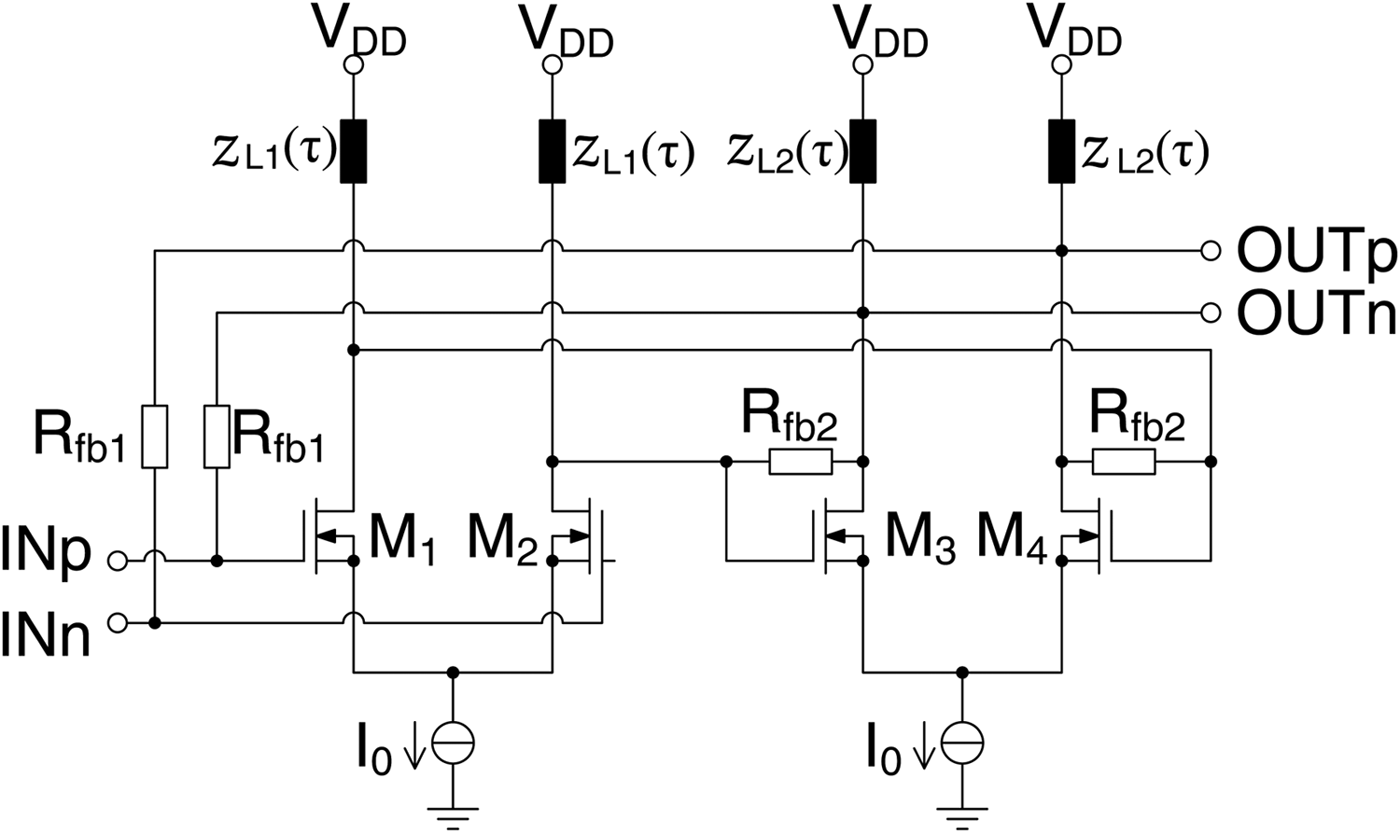
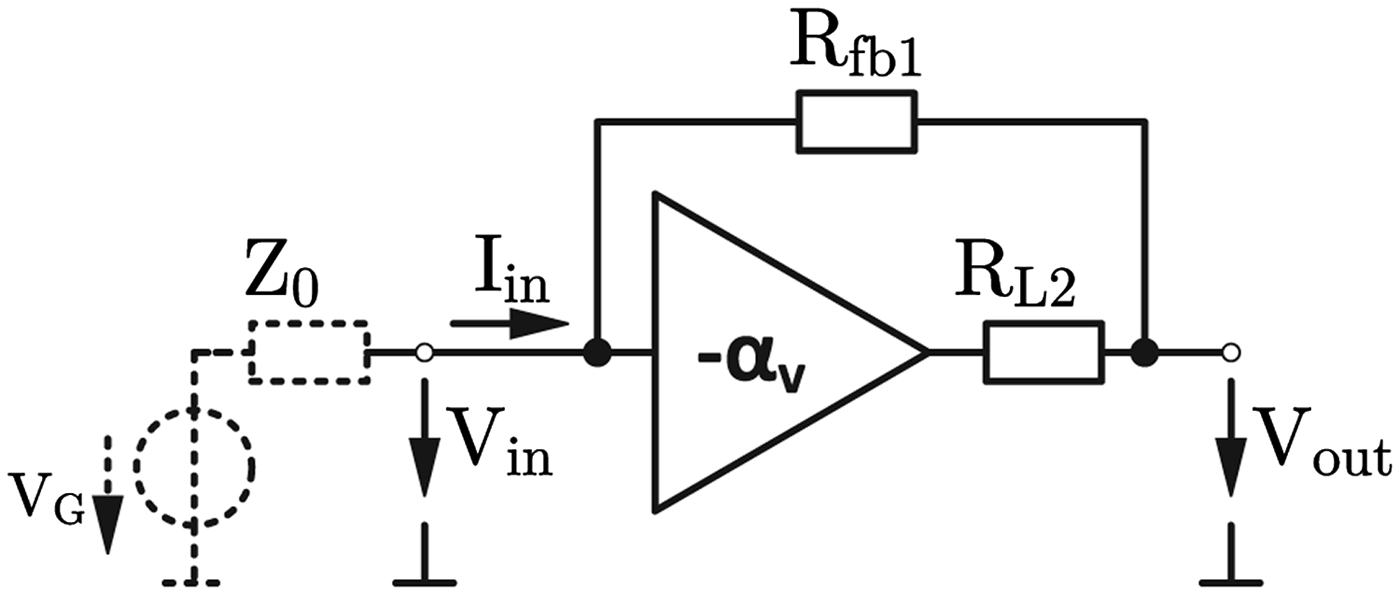
This circuit is designed with a broadband input power matching to the differential system impedance of 100 Ω. According to this requirement and with the simplified model in Fig. 2 the feedback resistors R fb1 will be dimensioned.
Simplified model of the LNA [Reference Joram, Wagner, Sobotta and Ellinger10].
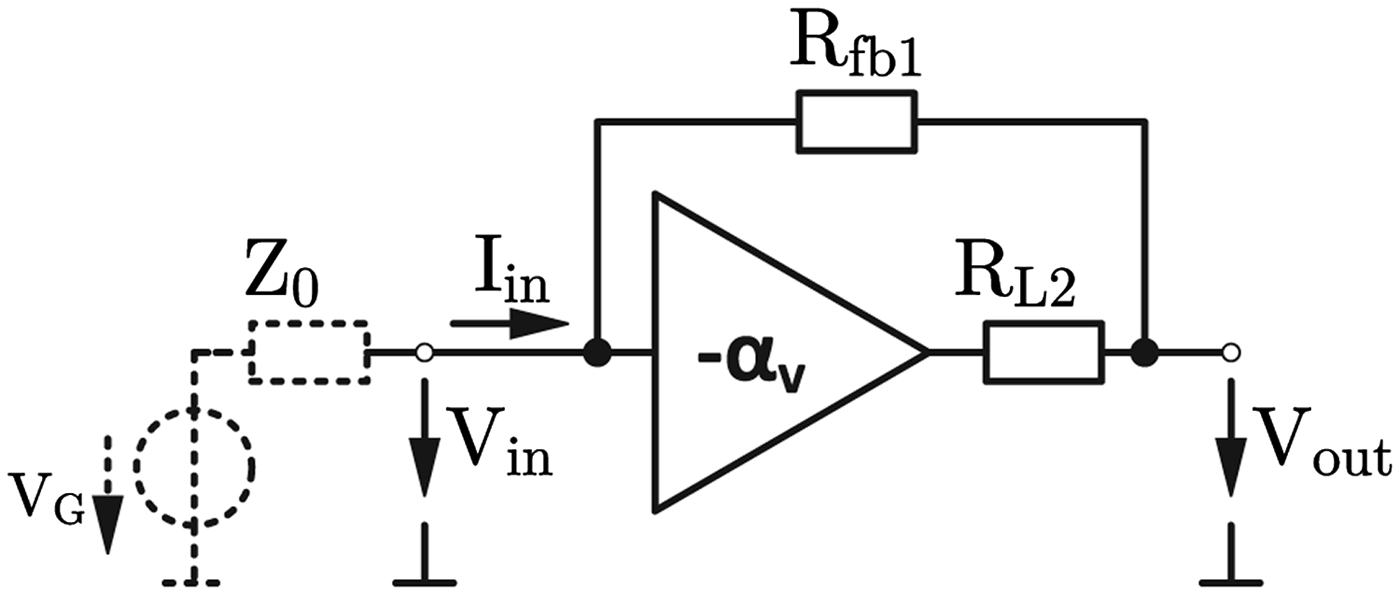
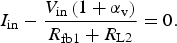
The sum of all currents at the input node is zero and yields
 $$I_{\rm in} - \displaystyle{{V_{\rm in} \left( {1 + \alpha _{\rm v}} \right)} \over {R_{\rm fb1} + R_{\rm L2}}} = 0.$$
The input impedance should be equal to the system impedance Z 0 and together with (1), R fb1 can be calculated to
 $$R_{\rm in} = \displaystyle{{V_{\rm in}} \over {I_{\rm in}}} = \displaystyle{{R_{\rm fb1} + R_{\rm L2}} \over {1 + \alpha _{\rm v}}} \mathop = \limits^! Z_0 \quad {\rm and}$$
 $$R_{\rm fb1} = Z_{\rm 0} \left({1 + \alpha_{\rm v}}\right) - R_{\rm L2} $$
Both differential pairs reveal an open-loop gain of 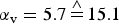 $\alpha _{\rm v} = 5.7\mathop = \limits^ \wedge 15.1$ dB. The open loop-gain depends on the tail current I 0 and the loads R L2. The value for the tail current will be discussed in the next section and R L2 is set to 70 Ω for a compromise between gain, moderate losses and a low output resistance for the implementation as buffer. With these values and (3), R fb1 can be calculated to 265 Ω. Due to finetuning of the circuit, the feedback resistor is implemented with 260 Ω.
The following paragraphs investigate the dimensioning of the active devices and detailed considerations of possible load implementations of the differential amplifiers.
B) Active device sizing
One of the first steps to dimension FET is the decision for a DC operation region and thereby an inversion level. The IV-diagram of long channel transistors has defined regions with sharp transition between weak, moderate, and strong inversion. However in this highly scaled technology, categorizing the IV-behavior according to the inversion level is a challenge. The transitions between the different regions are smooth and without a break. The expected behavior of the transistor like a voltage controlled current source in strong inversion does not occur. In every region the transistor react more or less like a voltage controlled resistor. Also the well-known current equations of the transistor are only an approach.
To overcome these issues, a suitable method to characterize the transistor behavior and to find a suitable operation region is described in [Reference Silveira, Flandre and Jespers11, Reference Foty, Bucher and Binkley12]. This method also fits to short channel devices and is called the g m/I D method. According to this approach, the FET M1 − M4 of Fig. 1 are dimensioned.
In these works, the characterization of the transistor is based on the transconductance efficiency as a central parameter. The transconductance efficiency is defined as g m/ID and describes which value of g m can be reached by minimum current.
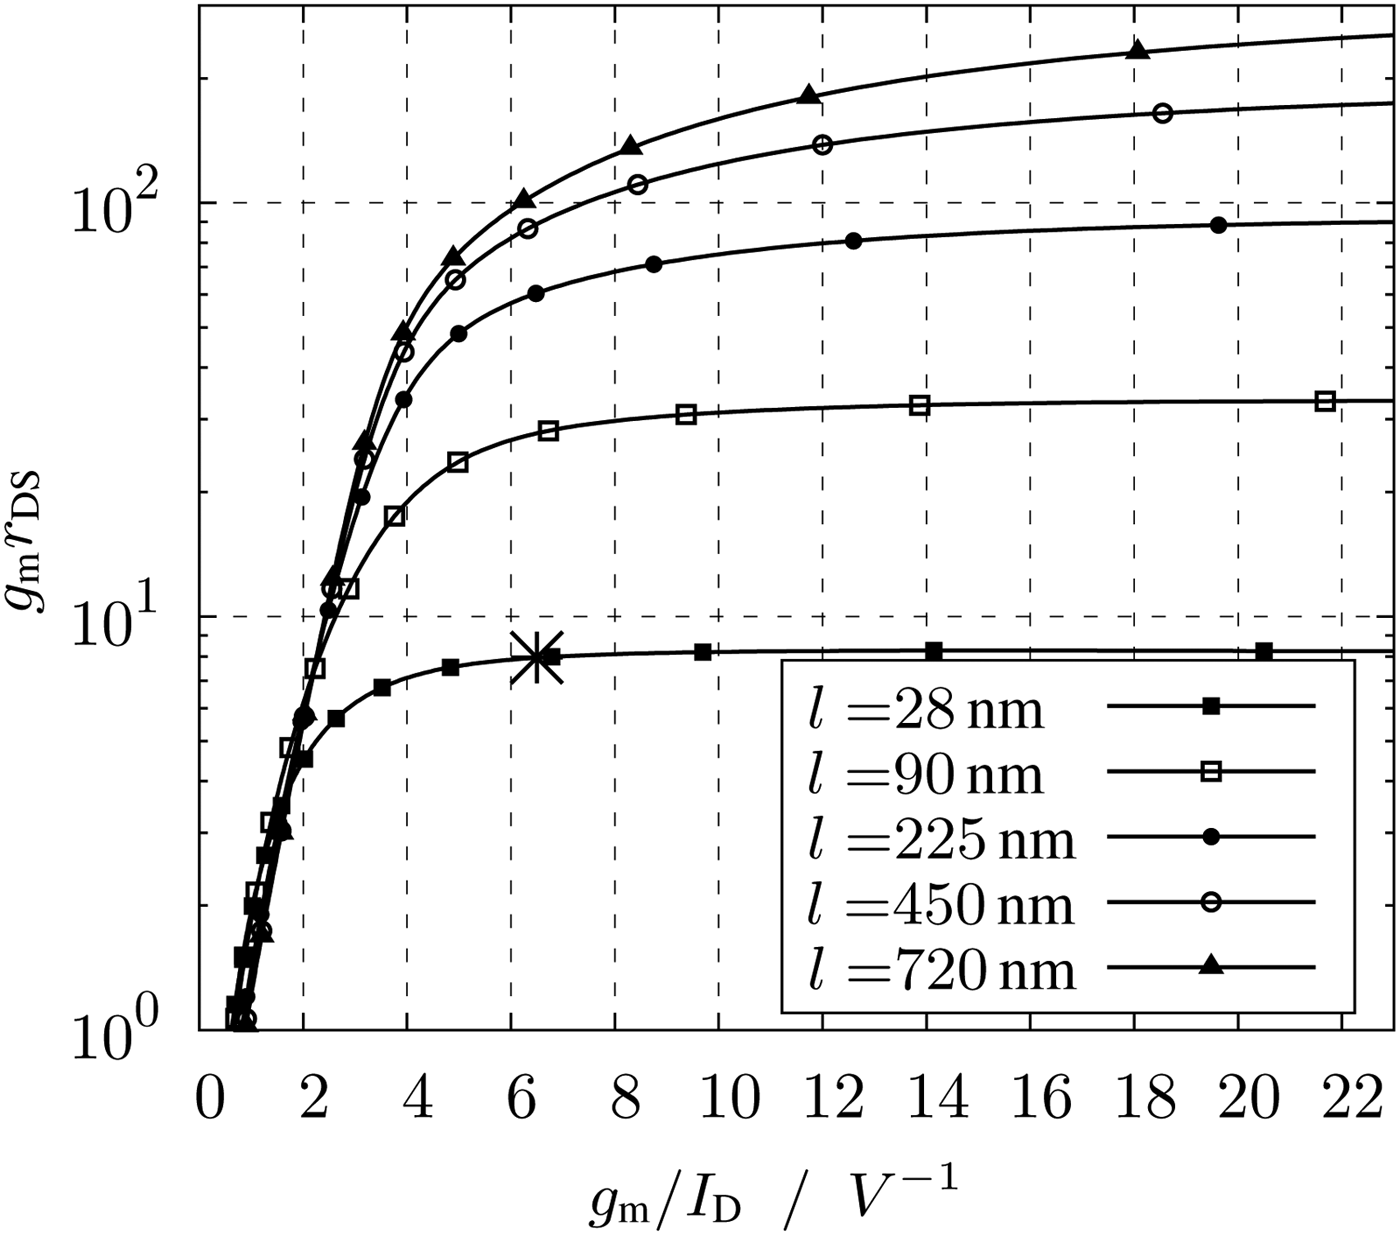
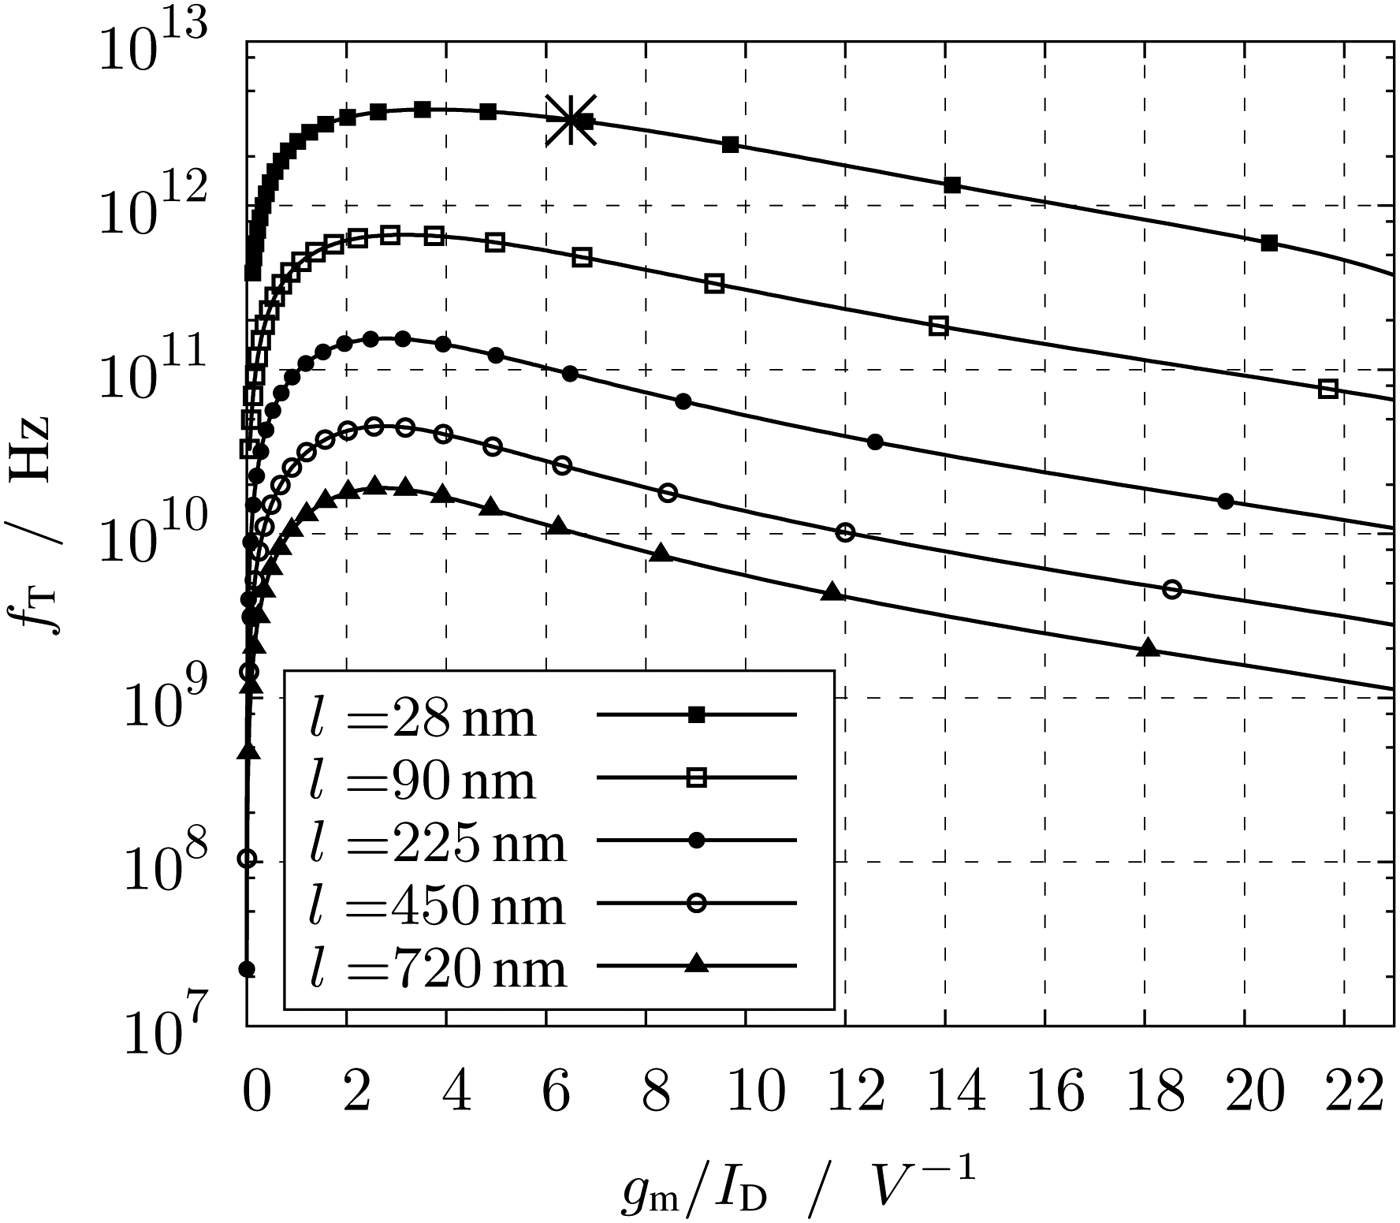
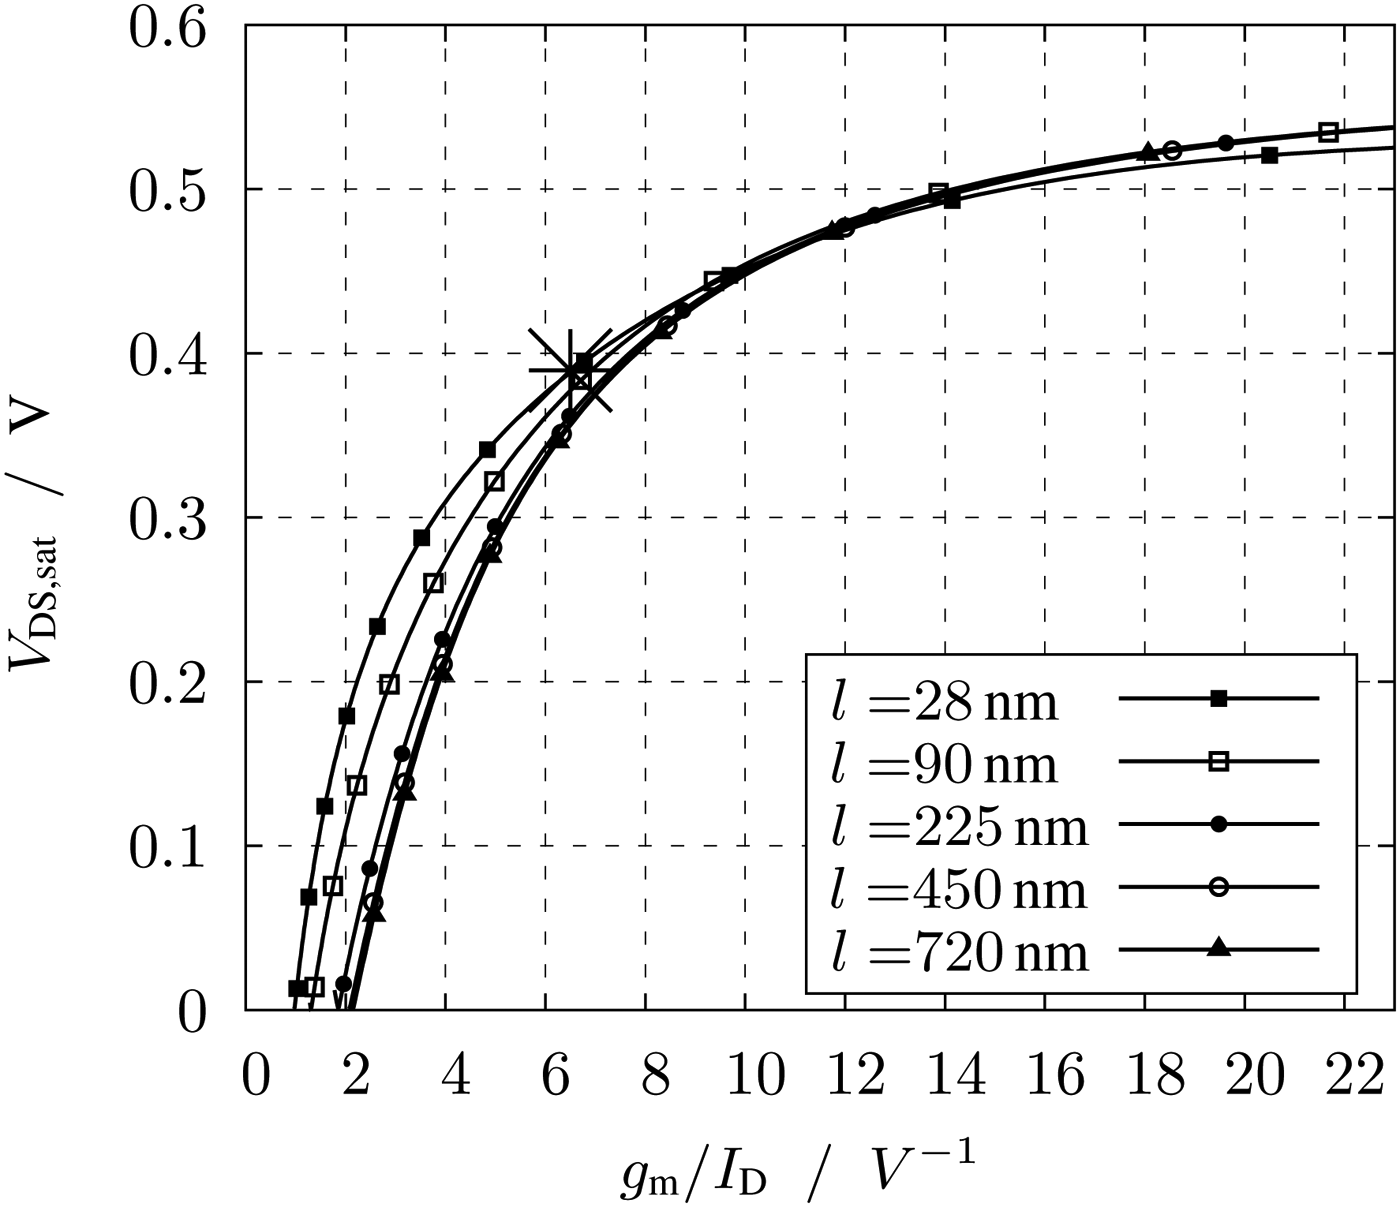
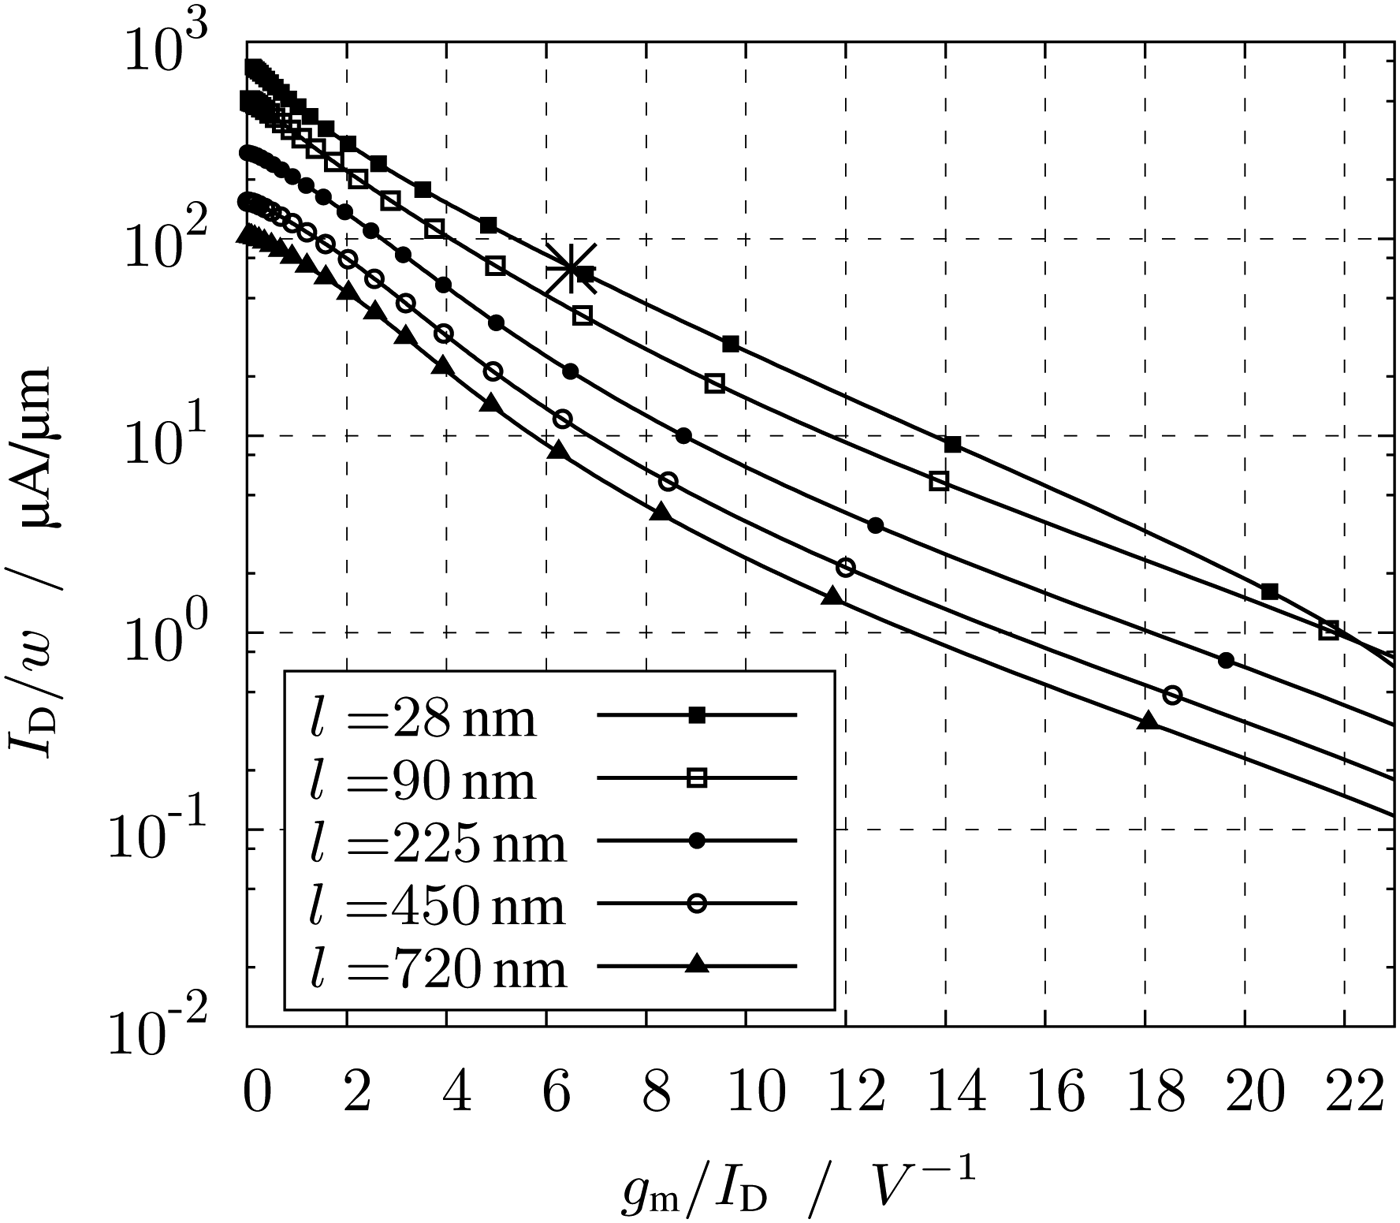
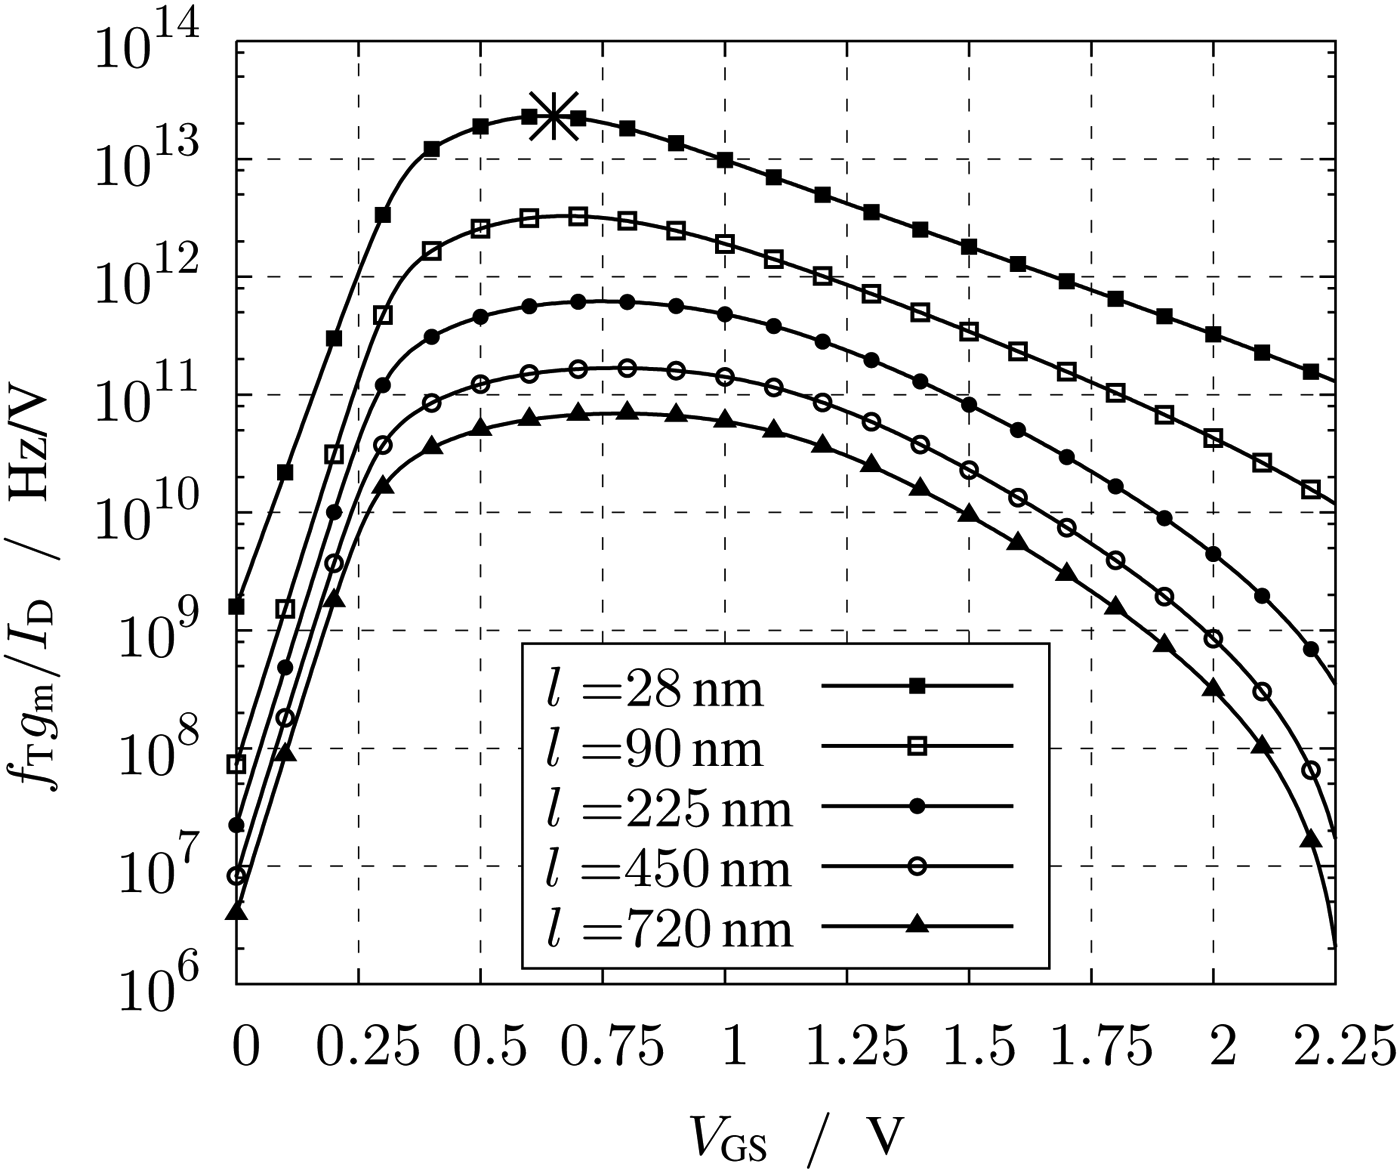
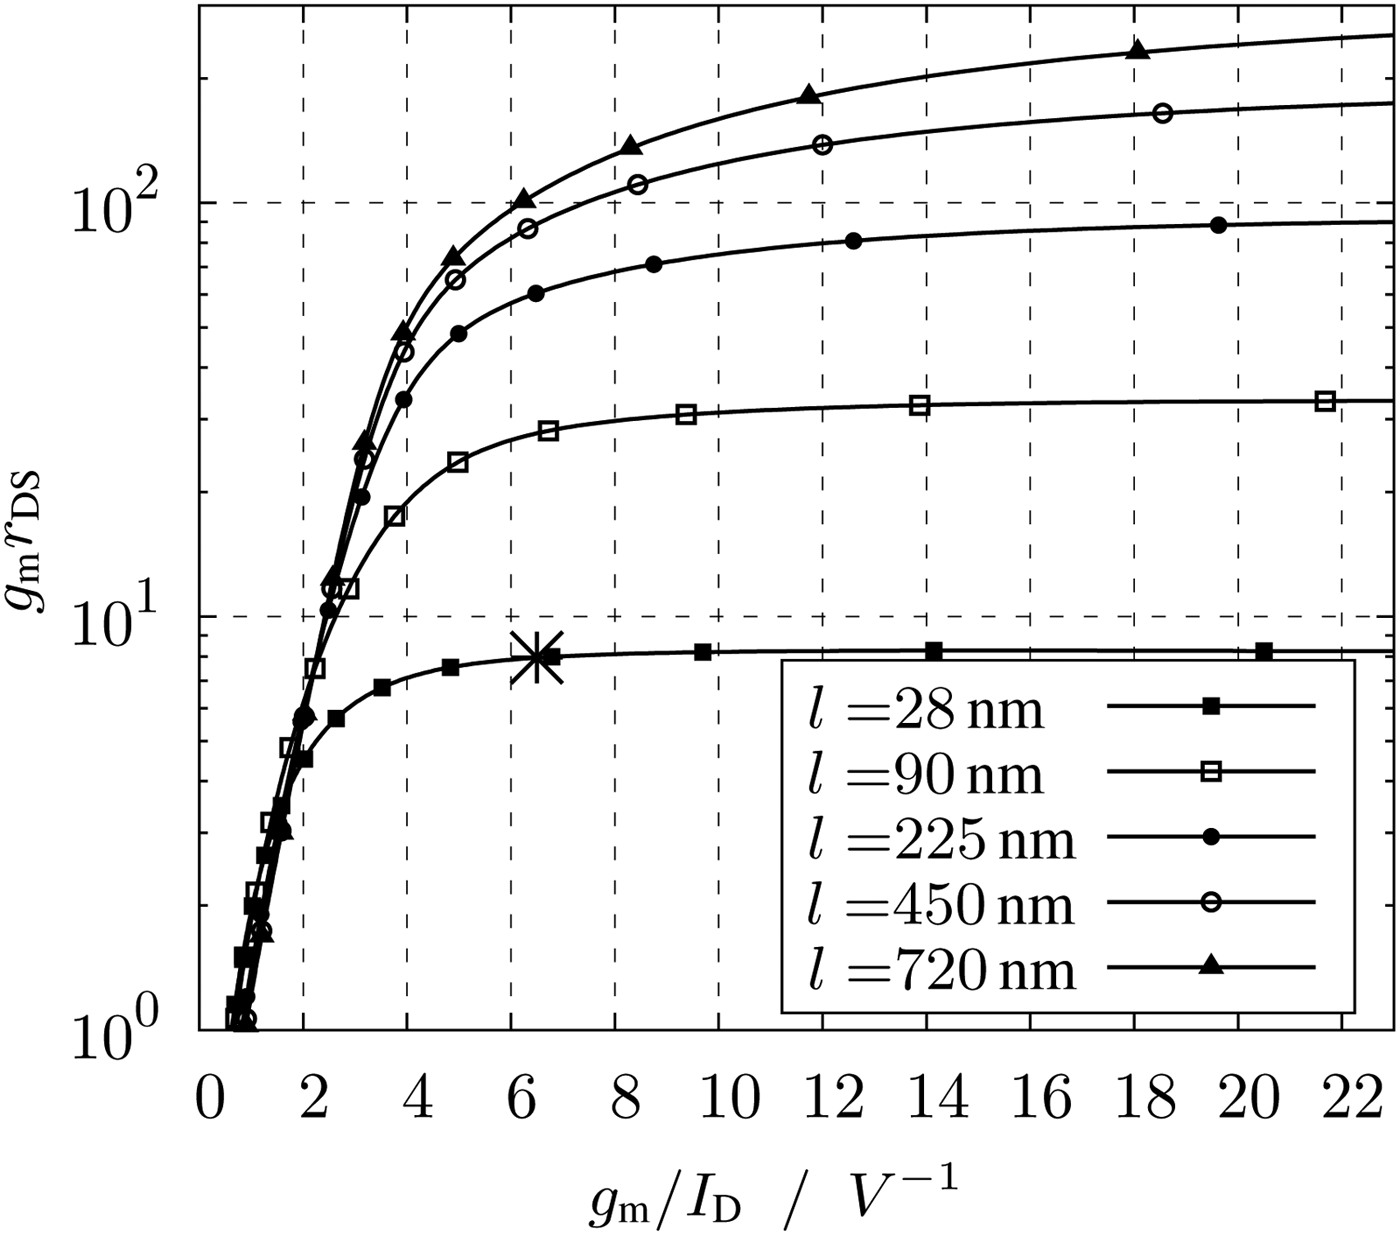
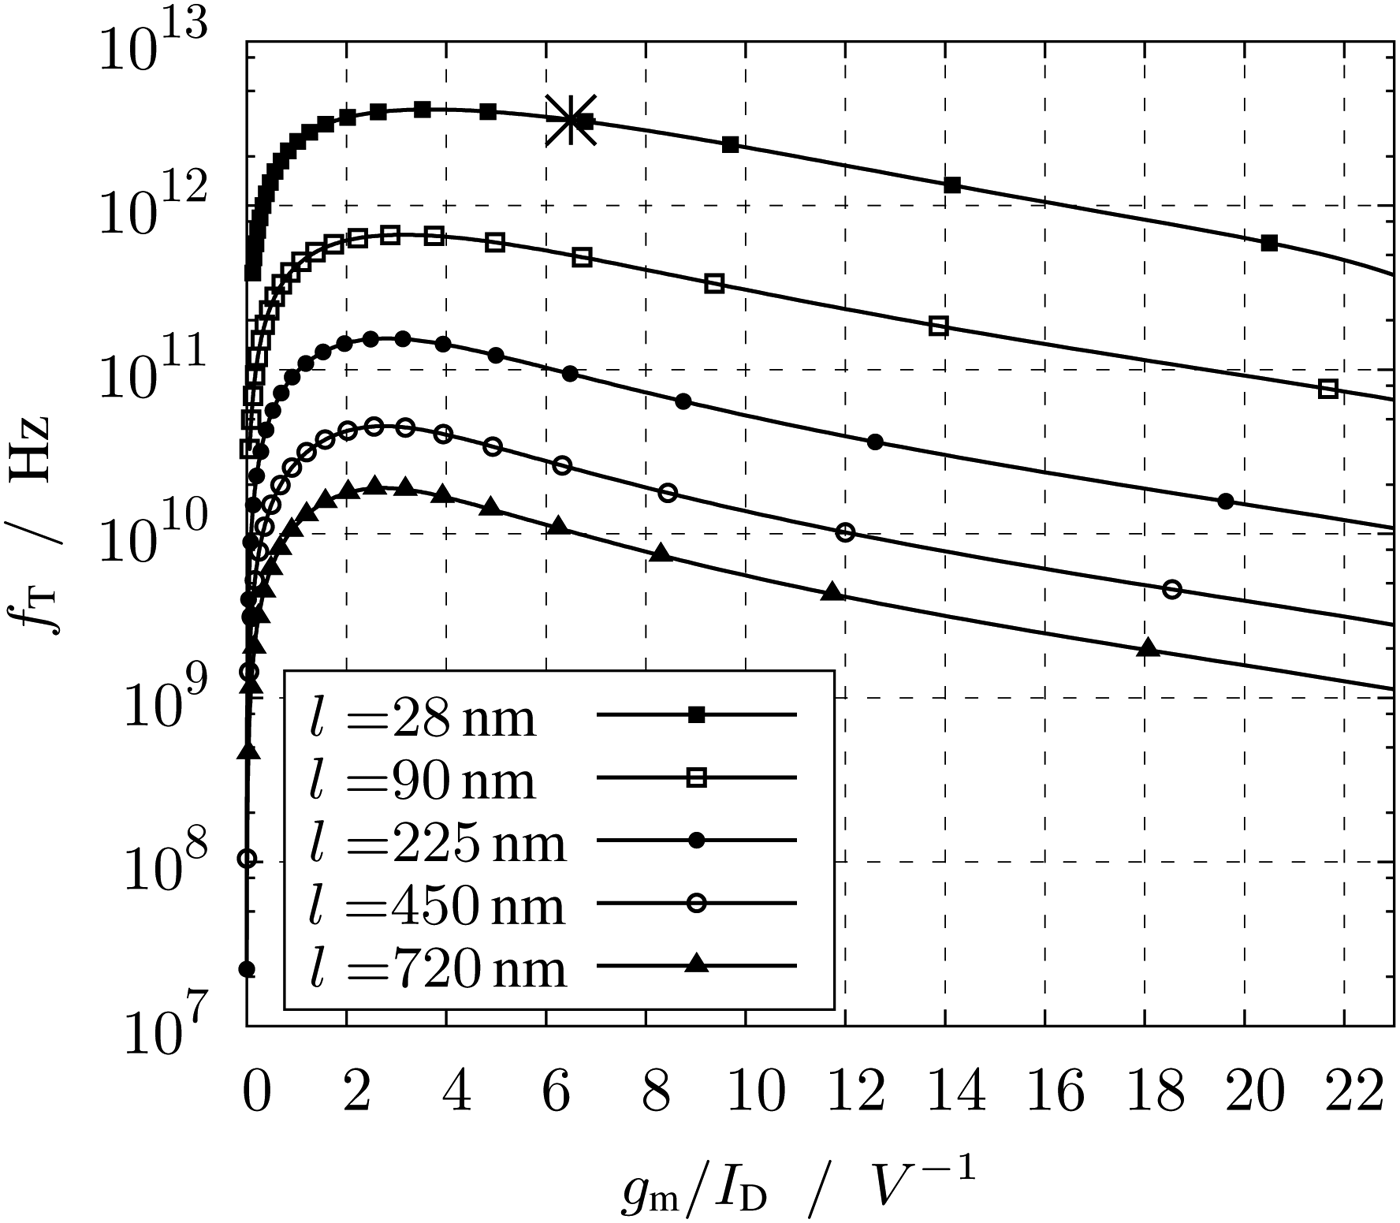
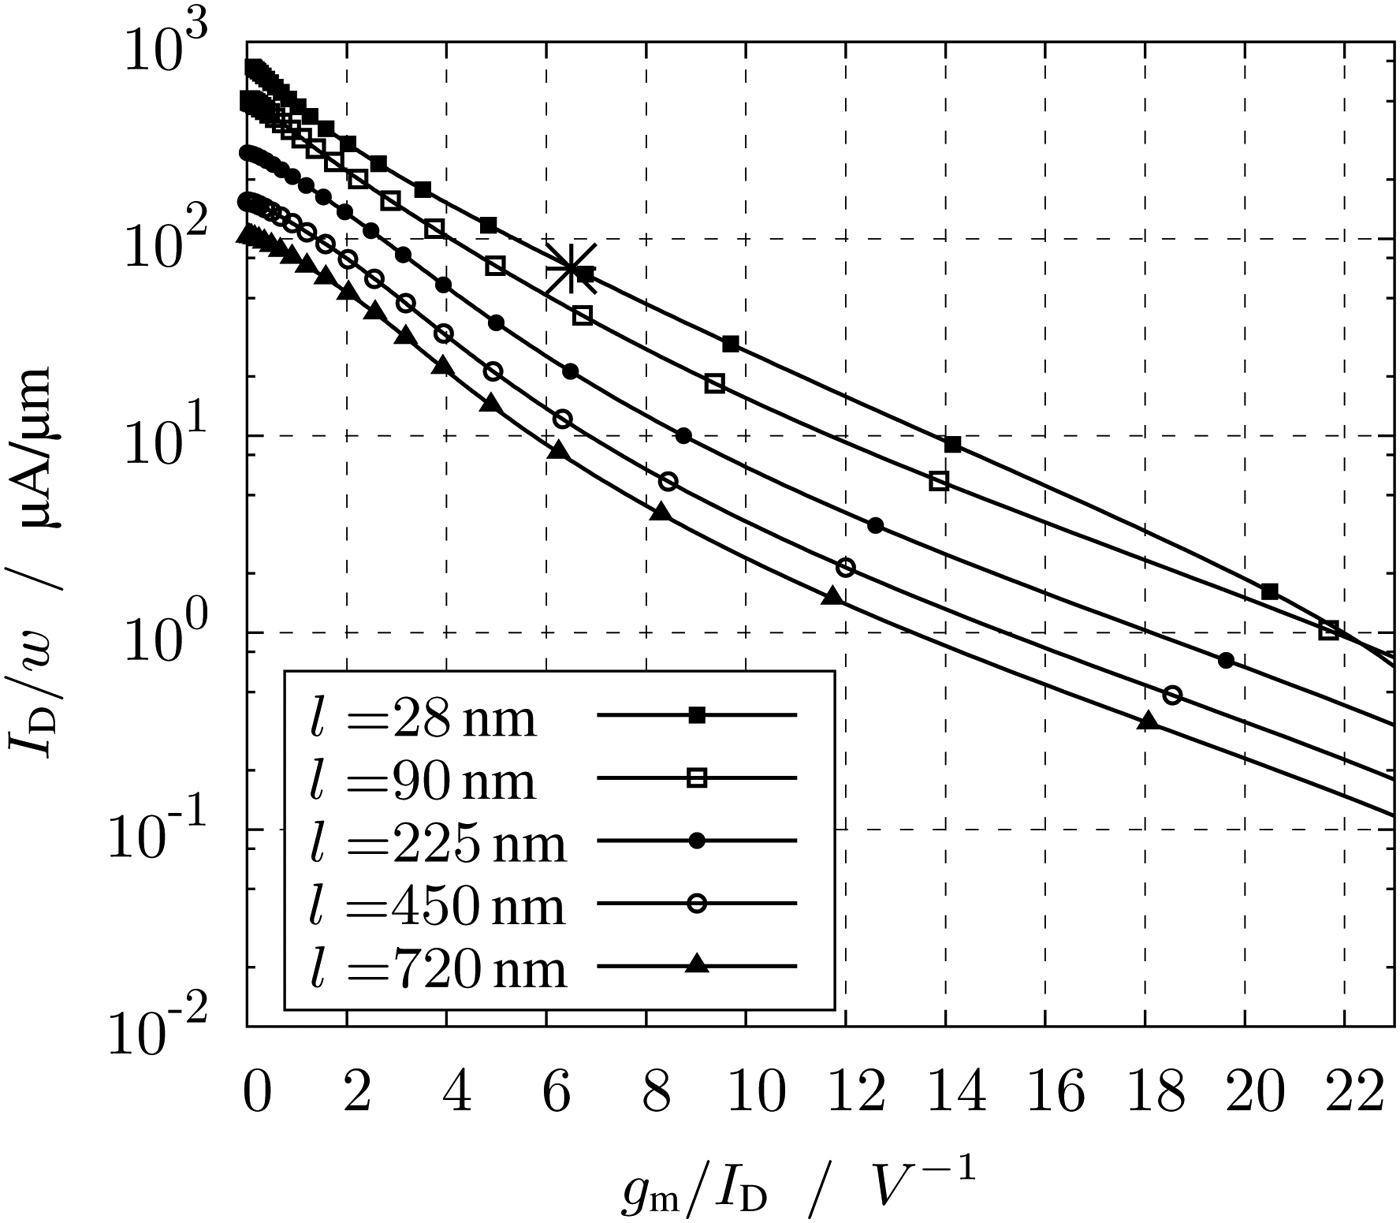
Important plots for the characterization of the transistors according to the g m/I D method are Figs 3–6. The plots of Figs 3 and 4 show the intrinsic gain and the transit frequency versus the transconductance efficiency. These plots are necessary to determine the suitable transconductance efficiency. To set the correct transconductance efficiency in the circuit, the required V GS can be read in Fig. 7. By a known transconductance efficiency and current, the width of the transistor can be read off the plot Fig. 6. The saturation voltage V DS,sat of Fig. 5 shows by a given g m/I D the minimum V DS.
Intrinsic gain g m/r DS versus transconductance efficiency g m/I D.
Transit frequency f T versus transconductance efficiency g m/I D.
Saturation voltage V D, sat versus transconductance efficiency g m/I D.

Current per width I D/w versus transconductance efficiency g m/I D.
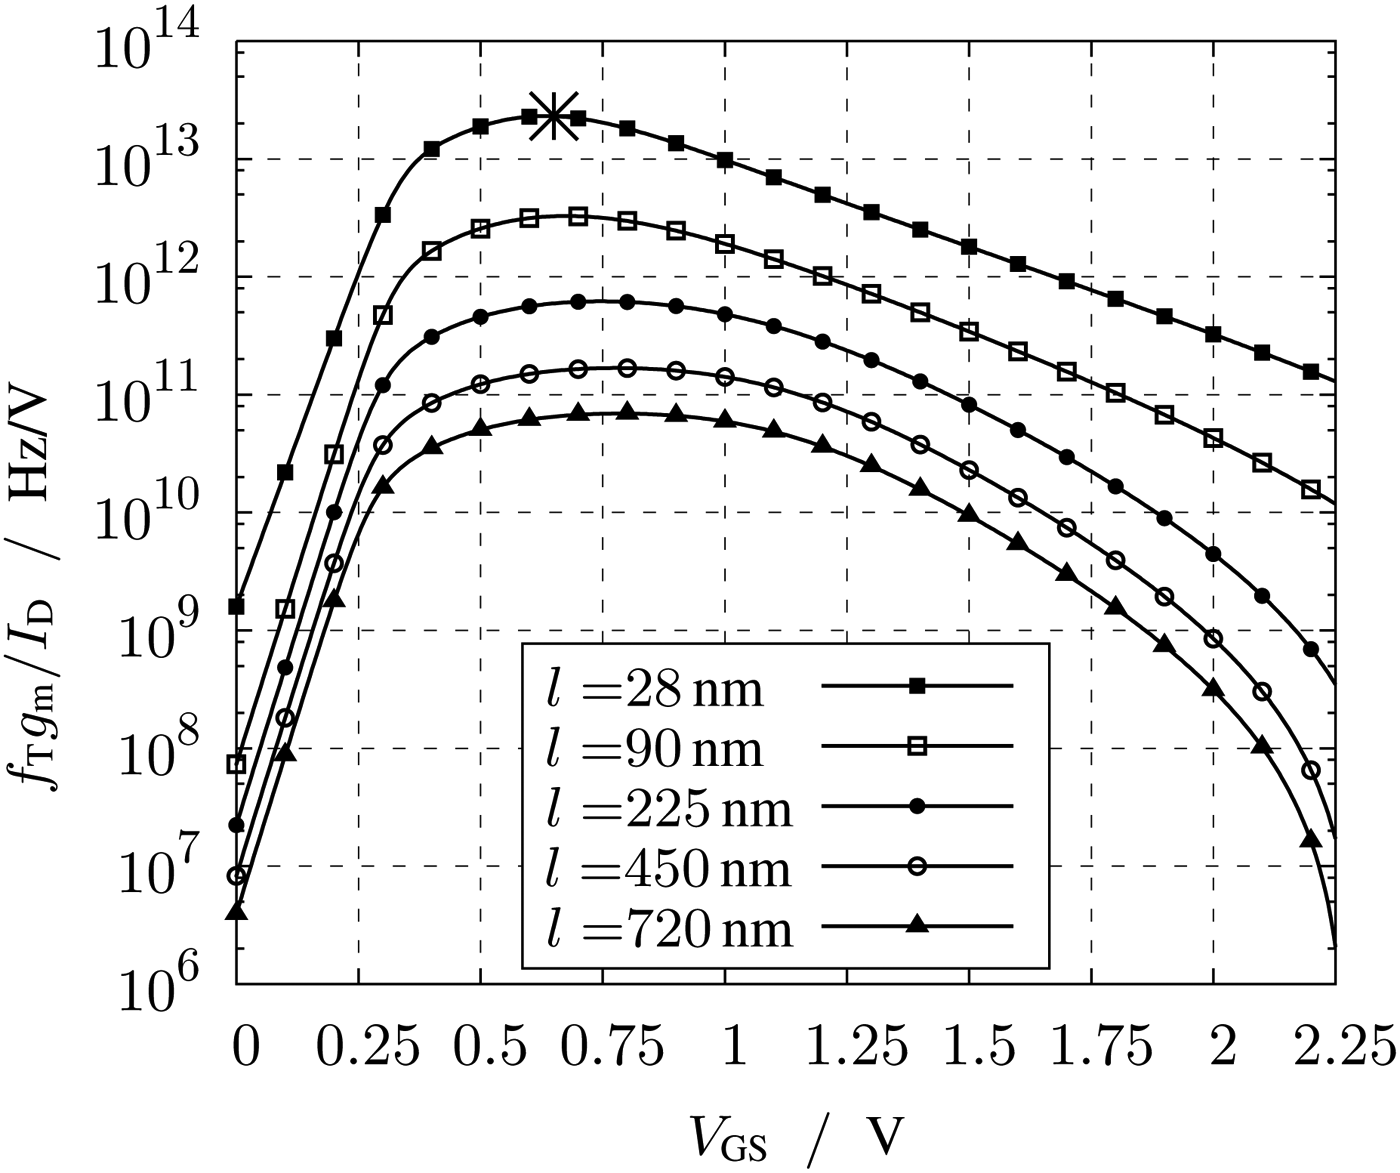
Product of transconductance efficiency and transit frequency.
The value of the transconductance efficiency depends on the optimization goals of the circuit. For low-power circuits with large voltage swing, the transconductance efficiency has to be high. A high g m/I D means a high g m by minimum current. For high g m/I D the intrinsic gain according to Fig. 3 is high, too. The intrinsic gain g mr DS influences the voltage gain and due to the low r DS of highly scaled transistors this is an important parameter. Dimensioning a circuit with high g m/I D defines an inversion level of the transistor to the weak inversion. The drawback of this operation region is a low transit frequency f T and thereby a low bandwidth. Typical curves of f T are shown in Fig. 4.
To optimize the circuit for a high f T, the transistor must be in strong inversion. In strong inversion, not only the intrinsic gain decreases, but also the power consumption increases.
Operating in moderate inversion is optimal when the transit frequency, the intrinsic gain and the power consumption are valued equally. This inversion mode match to the requirements of this LNA, which requires a high f T to ensure a high bandwidth and a moderate voltage gain and power consumption.
The inversion level can be set by V GS. For low V GS and thereby working in low inversion the g m/I D is high and f T is low. A high V GS means operating in high inversion and a low g m/I D as well as high f T.
To find the optimal value of V GS in moderate inversion, the product of the transit frequency and the transconductance efficiency is defined and plotted in Fig. 7. Interestingly the product of both peaks at V GS of 650 mV. This value determines the g m/I D = 6.5V−1 of the circuit. The circuit of the LNA is designed for this V GS. Besides this setting V GS, includes no information. In the following paragraphs, the behavior of the transistors is described by just g m/I D. In each plot, the implemented g m/I D of the LNA is marked by a star.
The big advantage of the description by g m/I D is the width independence due to the normalization of the parameters. Only the length is set as parameter in the following plots (Figs 3, 4 and 5). The choice of length and thereby if a short channel device is implemented means to get a high f T, whereby a long-channel device defines a high intrinsic gain. For this design the minimal length of 28 nm is chosen to benefit from the high bandwidth of the technology.
In Fig. 3 the intrinsic gain is shown. At a g m/I D of 6.5 V−1 the intrinsic gain of short channel devices has almost reached its maximum. The high dependence of the intrinsic gain to the length can be recognized in the plot. For higher channel lengths r DS increases and for the lengths of the plotted parameter set the intrinsic gain is multiplied by the factor of more than 10.
However, this positive behavior differs from the curves of Fig. 4, where the transit frequency versus g m/I D is depicted. At the g m/I D of 6.5 V−1, the maximum value of f T has slightly fallen, but is still very high. Here the reached value gains from the low transistor length.
The V DS,sat plot of Fig. 5 states how the minimum voltage across the transistor must be to operate in saturation. The values should be considered carefully, because like mentioned before the IV-diagram of short channel devices is not sharply defined. It is more like a a gradual increase. For this circuit the V DS is set to 500 mV. This value includes enough margin to V DS,sat = 380 mV. With a V DD of 2.2 V the current source I 0 and the loads should also obtain enough voltage headroom.
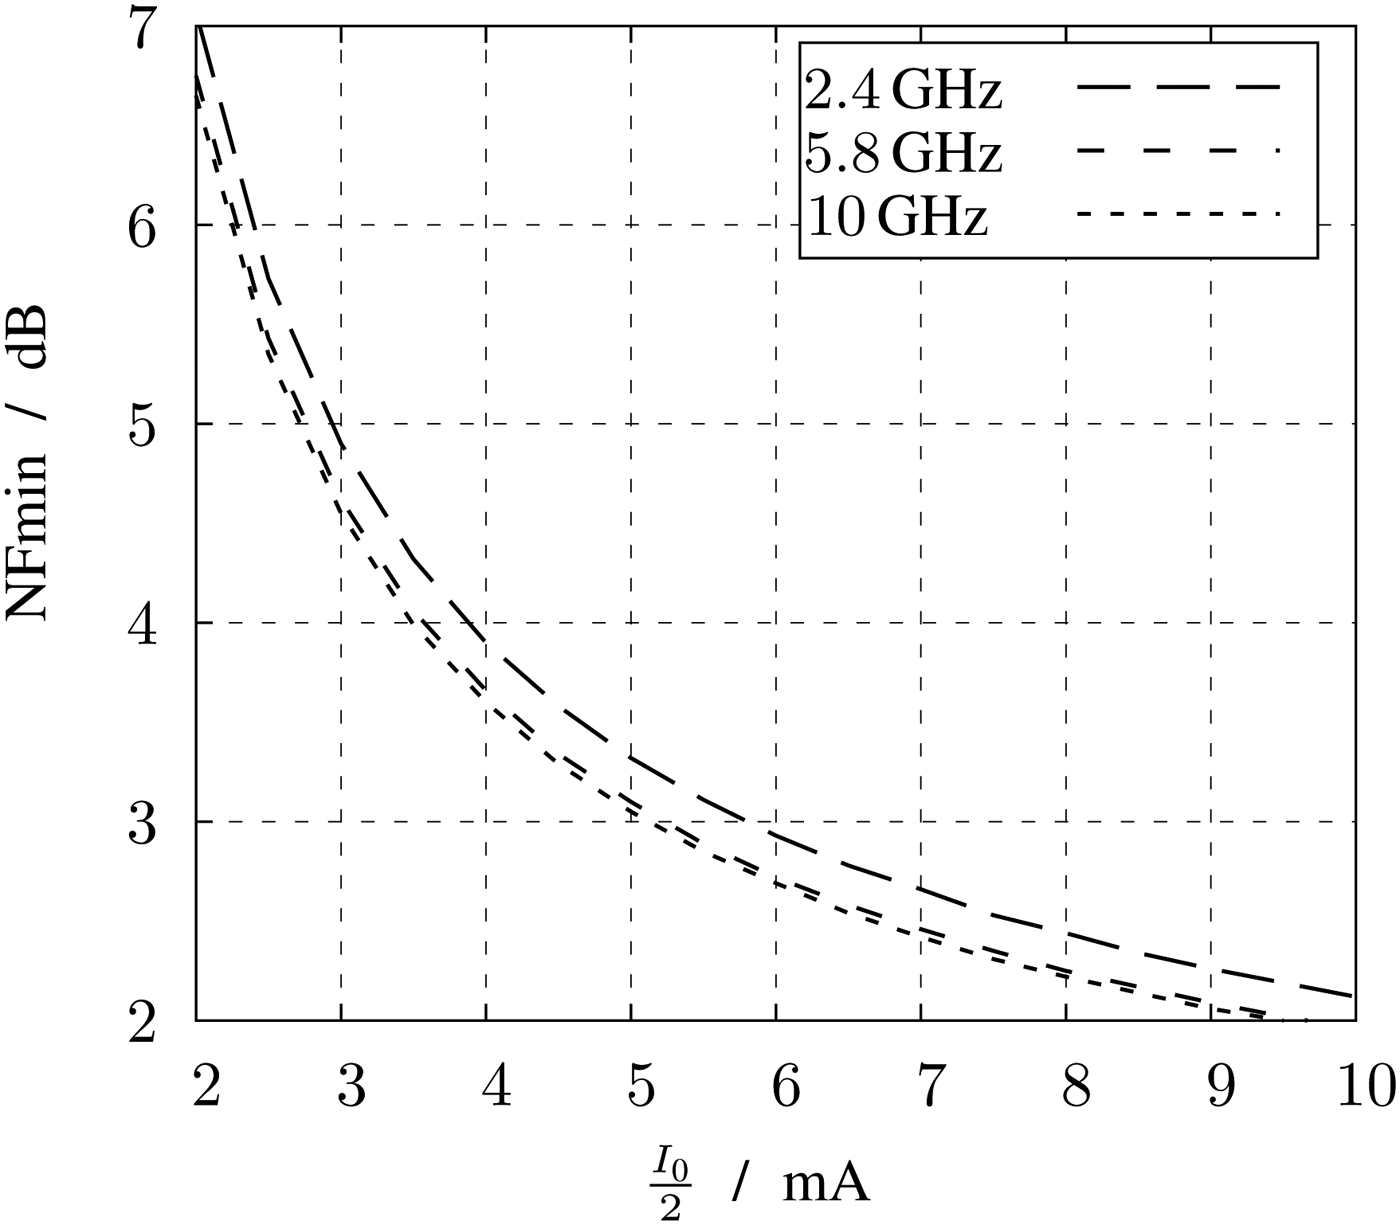
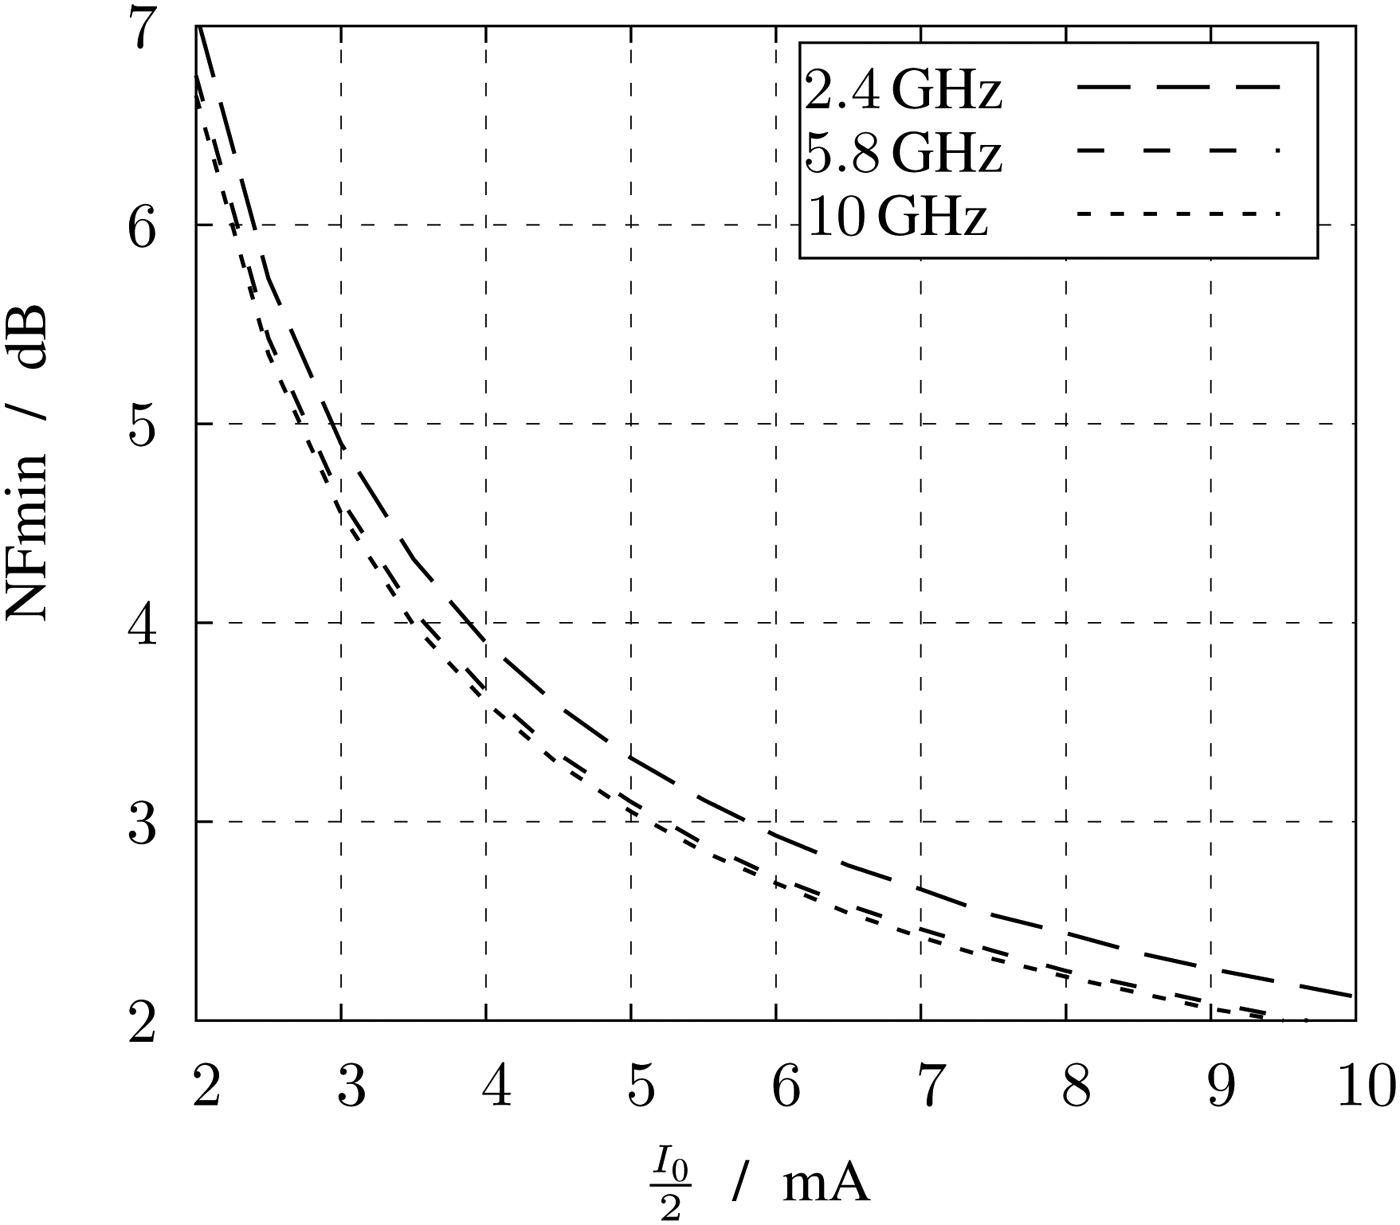
To finalize the dimension the width can be determined by a given current and the current per width. The plot of the current per width versus g m/I D is shown in Fig. 6. With a g m/I D of 6.5 V−1, at minimum length and according to Fig. 6, the current per width of the transistor can be read to 80 µA/µm. To determine the optimum current, simulations of the LNA with ideal pure resistive loads of 70 Ω are carried out. In Fig. 8 the minimum noise figure for different tail currents and with constant current per width of 80 µA/µm is shown for different frequencies. For low currents the minimum noise figure achieves maximum values. By spending around 6 mA the minimum noise figure is below 3 dB. To reduce the noise figure by further 1 to 2 dB, the current has to be doubled. For a tradeoff between current consumption and low noise, the current I D is set to 6 mA. With this current and a current per width of 80 µA/µm, the width can be calculated to 75 µm.
Minimum noise figure versus current at constant I D/w.
C) Bandwidth enhancement
This section describes bandwidth extensions such as peaking, which are necessary to meet the requirements of a bandwidth higher than 20 GHz. Generally for peaking, the loads are replaced by an inductor in series with a resistor.
Over frequency the voltage gain without bandwidth enhancement degrades. To avoid too much losses, an increased magnitude of the load impedance counteracts this decline. At a frequency of 15 GHz the voltage gain is reduced by 20%. A series connection of the load resistor of 70 Ω and an inductance of 0.5 nH reveal an increased magnitude of the impedance of 20% compared with a pure resitive load and compensates the losses.
 $$ 0.8\left \vert {(R_{1 \vert 2} + j\omega L)} \right \vert = R_{1 \vert 2} \quad {\rm for}\quad f = 15\,{\rm GHz} $$
In this design, the peaking inductor is optimized for a high inductance value per area to obtain the advantage of a small chip area. The quality factor and thereby the equivalent resistance can be neglected for the simple reason that there the already existing series resistor can be lowered by the parasitic resistance of the inductor. However, the inductor has to be designed to carry 6 mA, which is about half of the tail current.
One other important issue for the implementation of the inductors are the local density requirements of the technology. Due to the fact, that the technology is optimized for digital design there are no exceptions for the local density of inductors. The layers with low local metal density have to be filled to fulfill the density rules. But filling degrades the RF performance of the inductor and the results are not suitable anymore for the design.
Here three possibilities to implement the peaking element are described: a planar inductor, an active inductor, and a vertical inductor.
1) PLANAR INDUCTOR
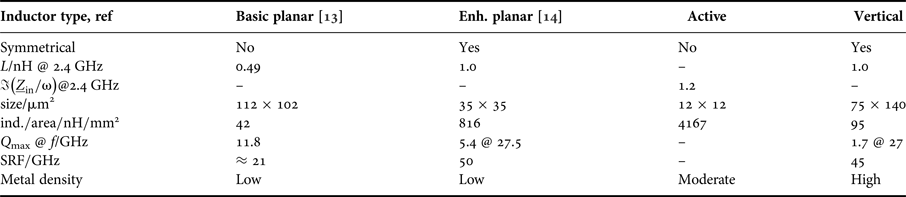
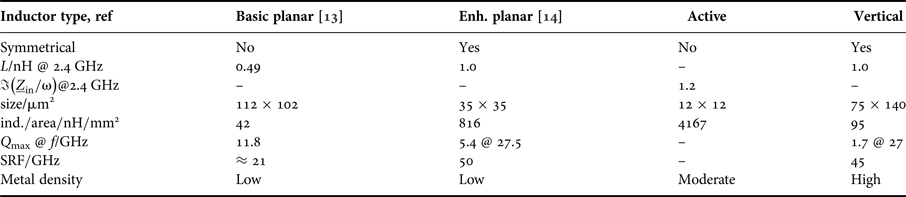
Generally planar inductors are associated to be bulky and consume a lot of area. Unfortunately their size does not scale in technology. Indeed the quality factor of these inductors is pretty high, but the inductance per area is very low. In Table 1, the parameters of an ordinary planar inductor, fabricated in a 65 nm technology, are shown as specified in [Reference Molavi, Mirabbasi and Djahanshah13]. The inductance per area of only 42 nH/mm2 makes this inductor not suitable for a size-optimized design.
Comparison of inductive components.
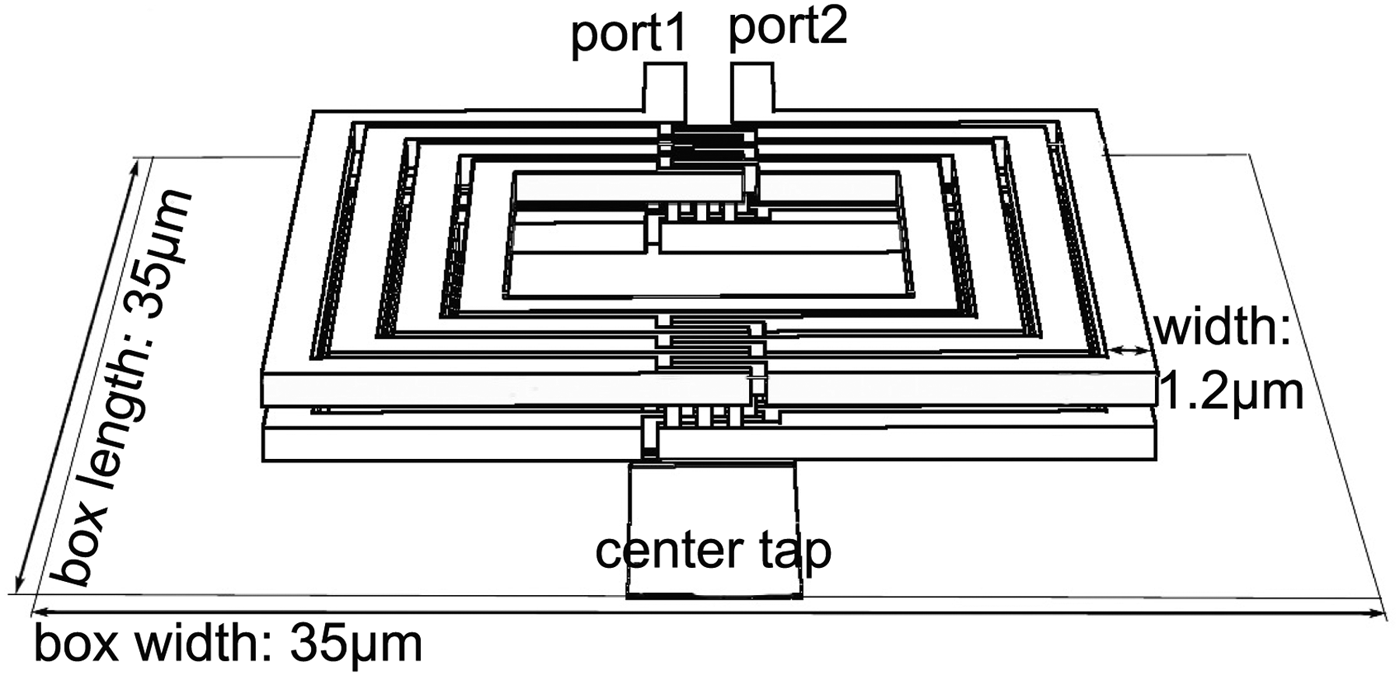
One idea to reduce the size of planar inductors fed by differential signals is to design symmetrical inductors. The setup of such a symmetrical inductor is depicted in Fig. 9, the differential signal inputs are port 1 and port 2 and by the center tap the DC voltage is connected. If a circuit like this LNA is designed for differential signals, the area of one symmetrical inductor is lower compared with the design of two single inductors.
Setup of a enhanced symmetrical planar inductor.
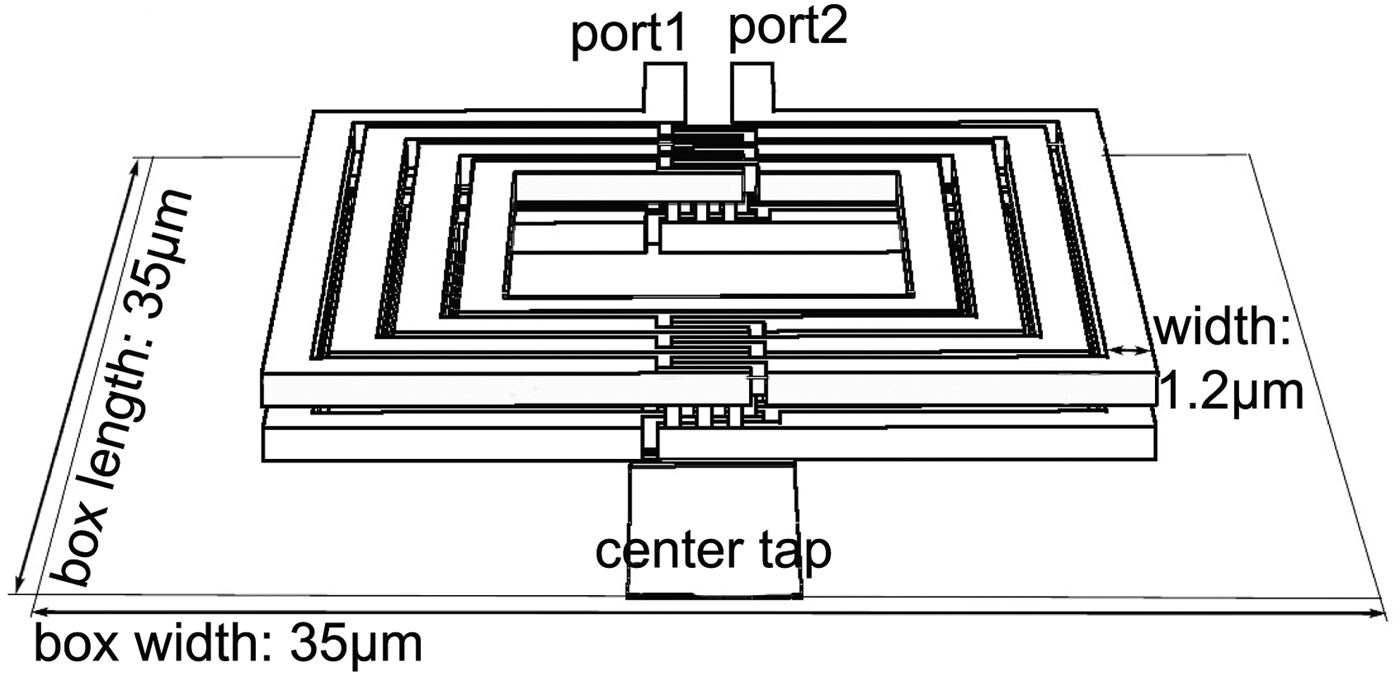
Another possibility to reduce the size is to run the lateral windings through two metal layers. Often the metal stack provides several top metals with high current density and hence they are a good choice for inductors. Figure 9 shows the setup of such an enhanced symmetrical inductor. It can be seen that the turn starts at the differential input on the upper metal and at the center tap, there is a contact to the lower metal to finish the turn on this metal.
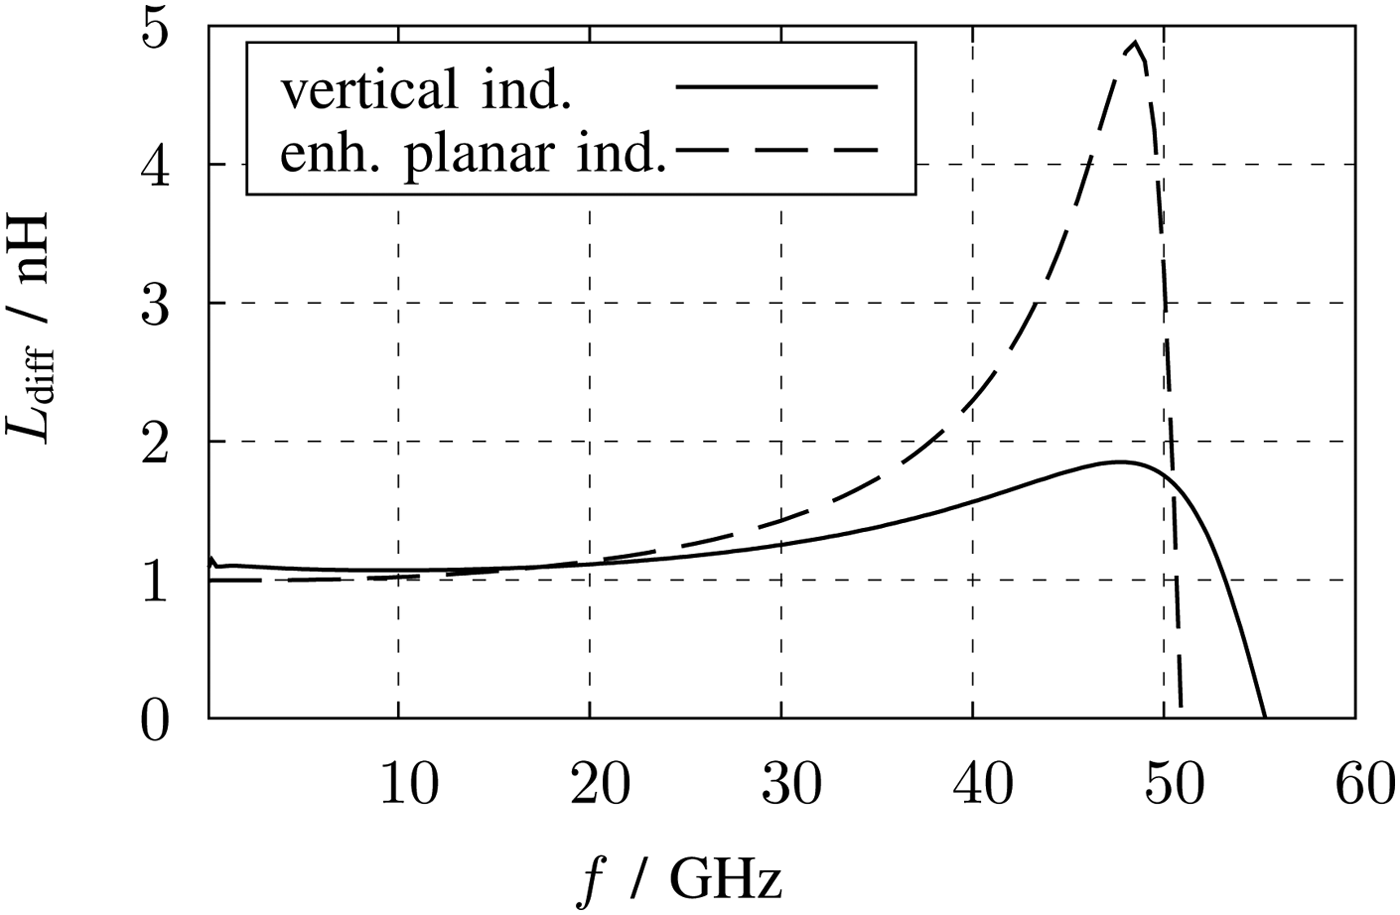
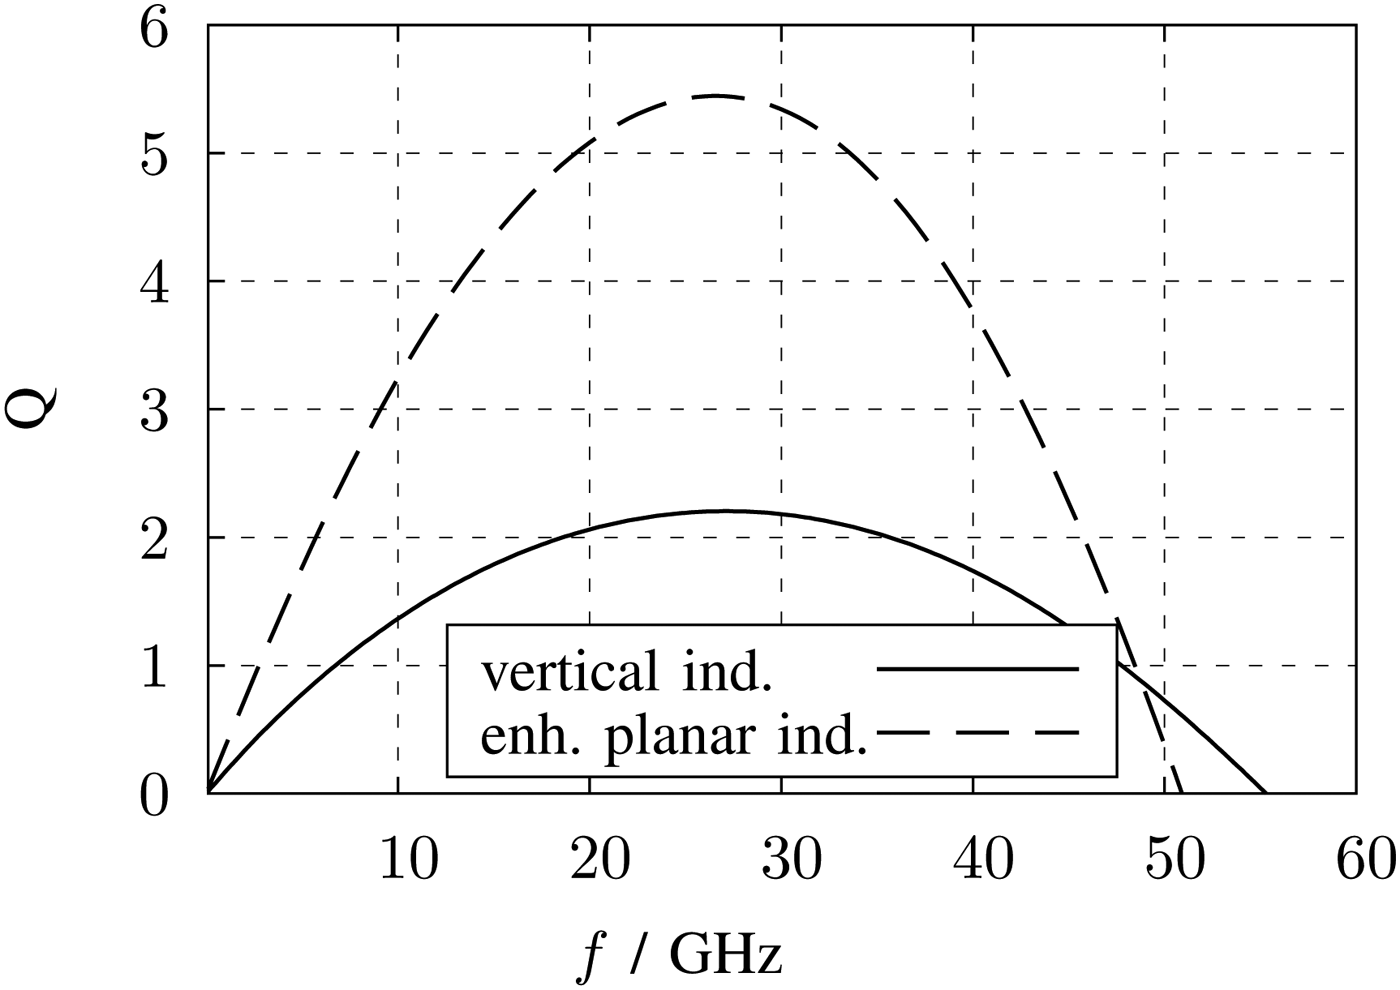
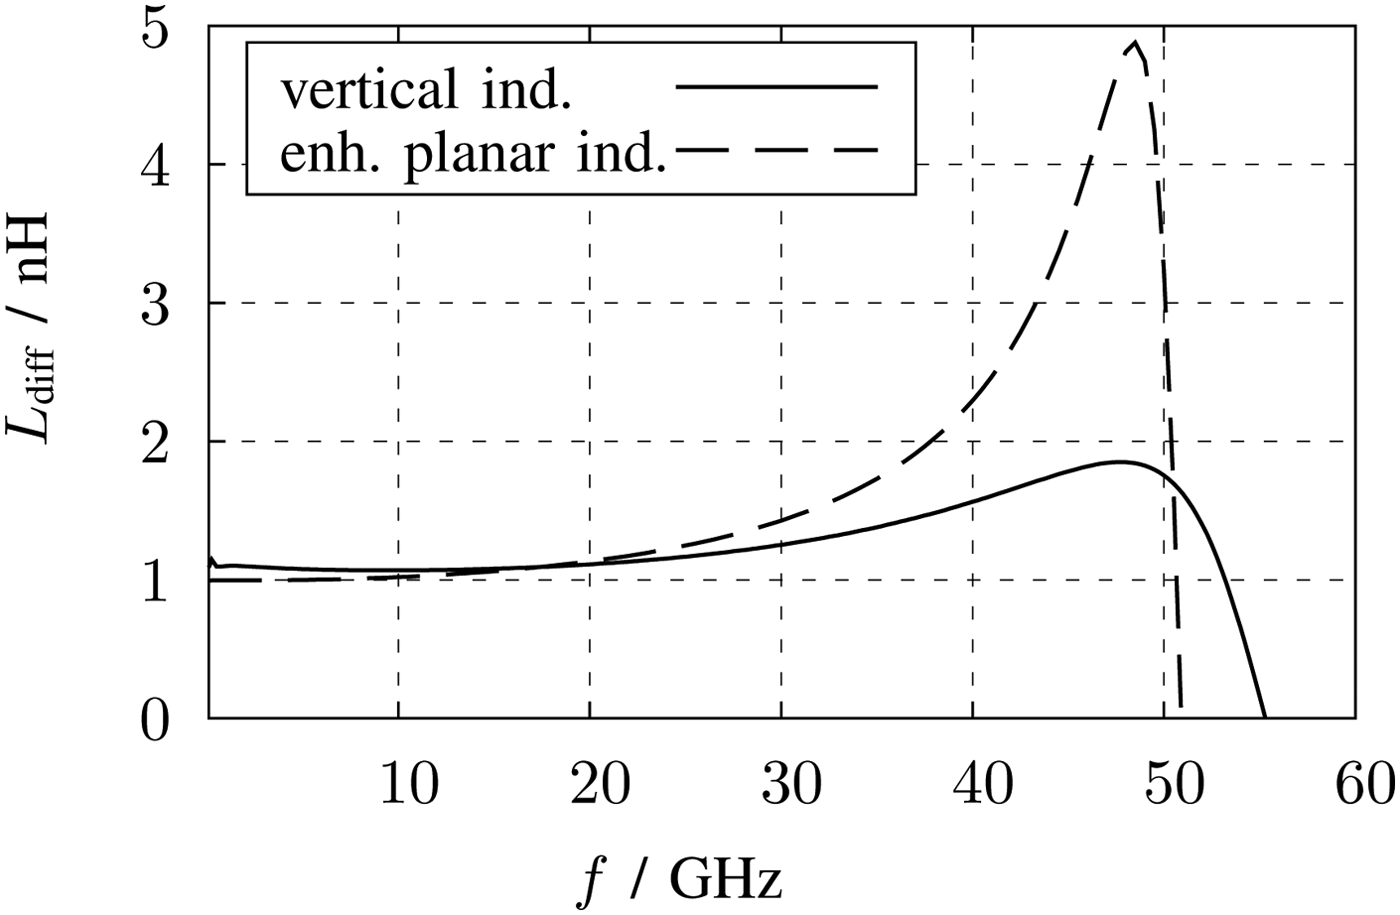
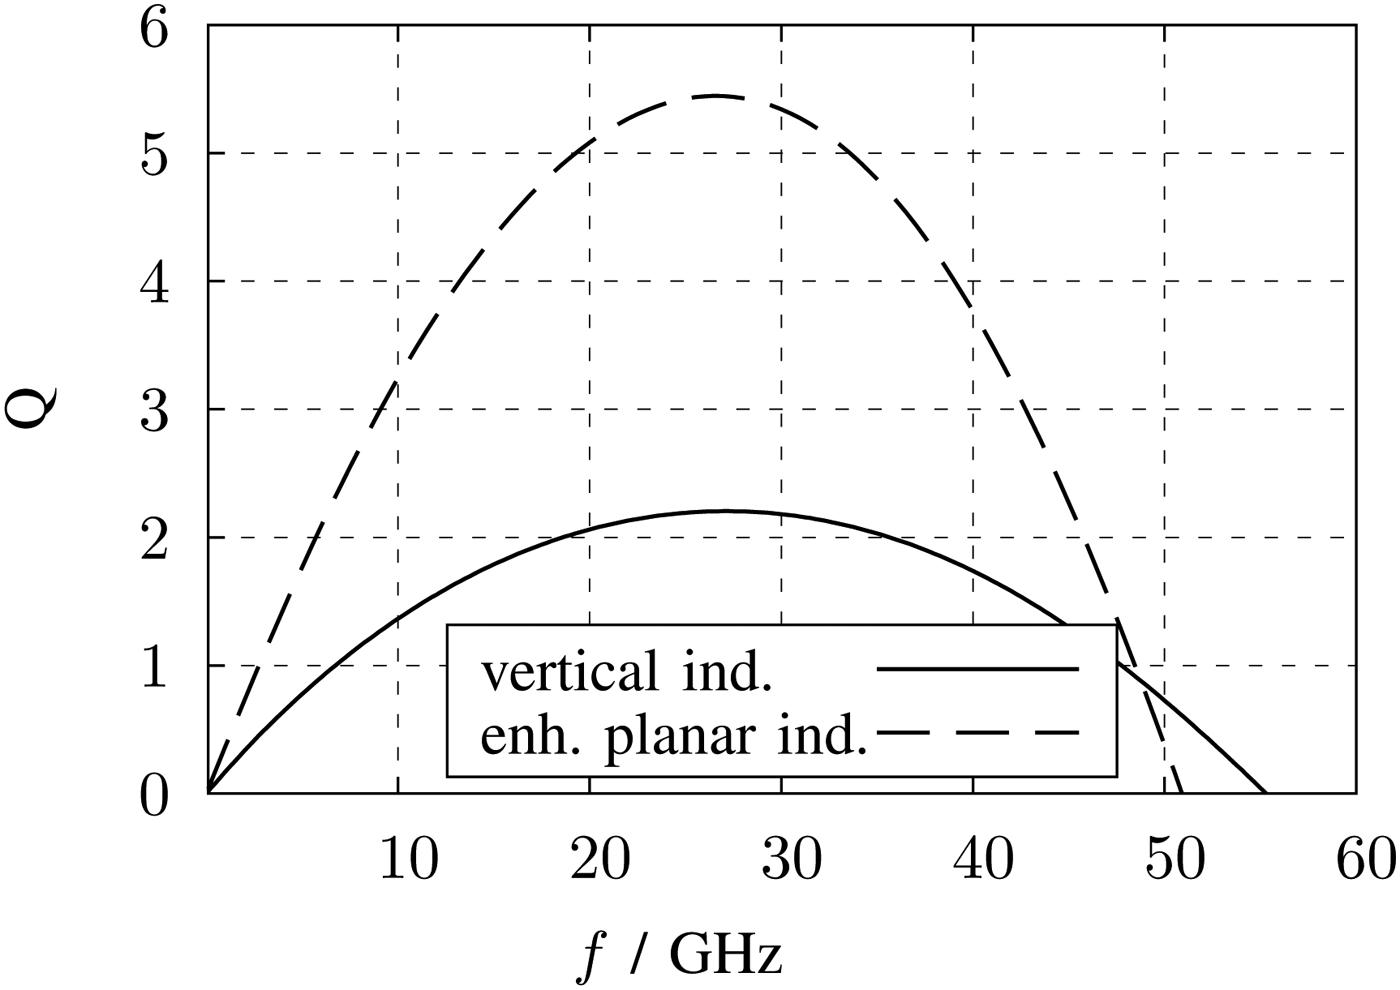
In [Reference Tretter, Fritsche, Khafaji, Carta and Ellinger14] all optimization techniques are combined and an enhanced planar symmetrical inductor is realized in a similar metal stack. For the comparison, this proposed inductor is modified in terms of inductance and quality factor to fit to the design requirements and to simplify the comparison. Figures 10 and 11 show the inductance and quality factor (Q) simulated in the 2.5 D EM-simulation software Sonnet. The values of this inductor version are also listed in Table 1. The inductance per area with 816 nH/mm2 achieves a very high value due to the fact, that only the upper metals with a high current density are carrying the current. As a result the width of windings must be only 1.2 µm. The quality factor of maximum 5.4 at 27.5 GHz is moderate, but for peaking issues applicable. The self resonance frequency (SRF) achieves the highest value of 50 GHz of the comparison table. In this configuration, the inductor is not bulky and is a good choice for the design.
Inductance of the symmetrical enhanced planar and the symmetrical vertical inductor versus frequency.
Quality factor of the symmetrical enhanced planar and the symmetrical vertical inductor versus frequency.
However, the layout of both planar inductors only uses the upper metal layers and therefore the local density of the lower metals cannot be met without filling. The RF performance degrades and the design is therewith not suitable for this design.
2) ACTIVE INDUCTOR
Another implementation of an element with inductive behavior is an active inductor. One possible topology is a pmos transistor as load with a resistor and a capacitor connected at the gate. In Fig. 12 the schematic representation of the LNA with active inductors as replacement of z L1(τ) is shown. Unfortunately this inductive component adds noise to the LNA like other active devices.
Schematic representation of the LNA with active inductors.
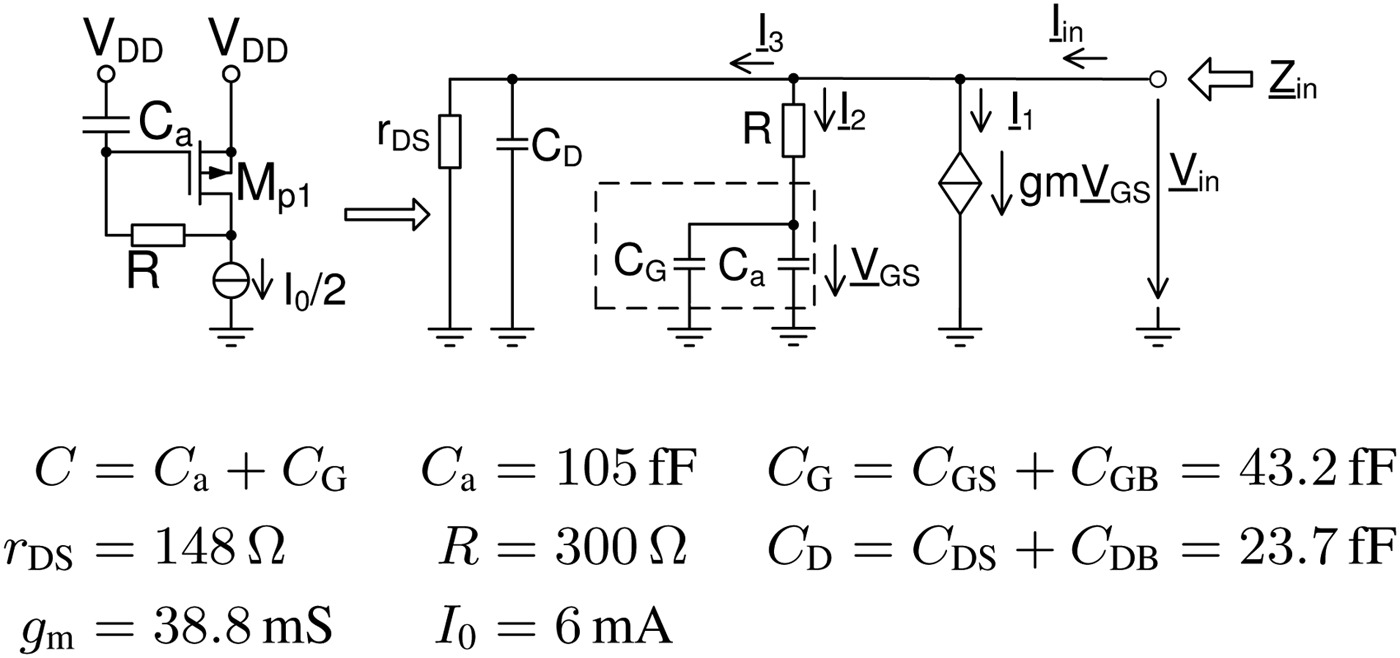
The input impedance Zin of the active inductor is a key parameter and can be calculated with the small signal model shown in Fig. 13. The model includes the capacitances C GS, C GB, C DS, C DB as well as r DS.
Small signal model of the active inductor.
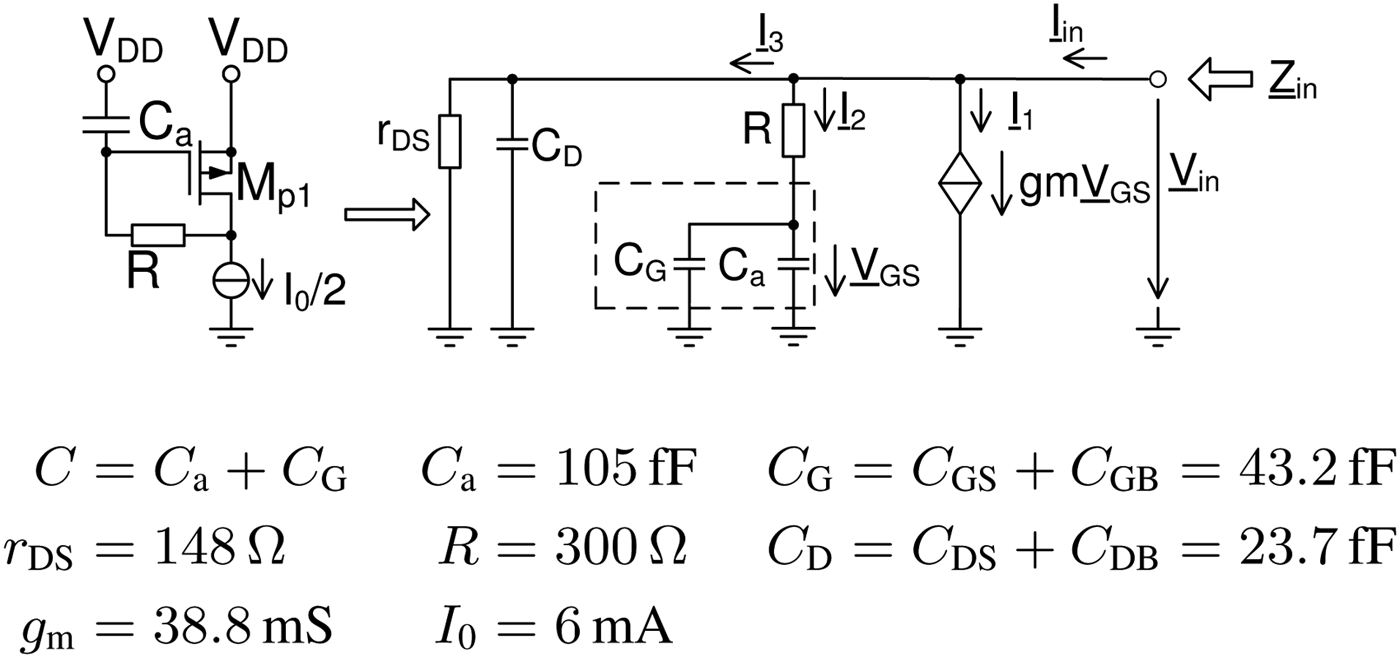
Following definitions simplify the model:
 $$C = C_{\rm a} + C_{\rm GS} + C_{\rm GB}, \quad \quad C_{\rm D} = C_{\rm DS} + C_{\rm DB,} $$
According to the model, the currents I1, I2, and I3 are defined as
 $$\underline{I} _1 = g_{\rm m} \underline{V} _{\rm GS} = g_{m} \displaystyle{{\underline{V} _{\rm in}} \over {1 + j\omega RC}},$$
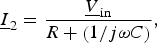 $$\underline{I}_2 = \displaystyle{{\underline{V}_{\rm in}} \over {R + \left( {1 / {j\omega C}}\right) }},$$
 $$\underline{I} _3 = \displaystyle{{\underline{V} _{\rm in}} \over {r_{\rm DS}}} \left( {1 + j\omega r_{\rm DS} C_{\rm D}} \right).$$
The input current Iin can be derived from Kirchhoff's law at the input node. Together with equations (5)–(7) yielding
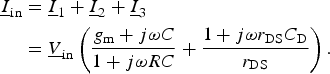 $$\eqalign{\underline{I} _{\rm in} & = \underline{I} _1 + \underline{I} _2 + \underline{I} _3 \cr & = \underline{V} _{\rm in} \left( {\displaystyle{{g_{\rm m} + j\omega C} \over {1 + j\omega RC}} + \displaystyle{{1 + j\omega r_{\rm DS} C_{\rm D}} \over {r_{\rm DS}}}} \right).} $$
The input impedance is then calculated as
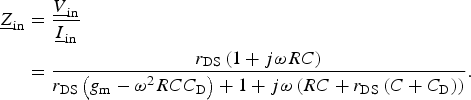 $$\eqalign{\underline{Z} _{\rm in} & = \displaystyle{{\underline{V} _{\rm in}} \over {\underline{I} _{\rm in}}} \cr & = \displaystyle{{r_{\rm DS} \left( {1 + j\omega RC} \right)} \over {r_{\rm DS} \left( {g_{\rm m} - \omega ^2 RCC_{\rm D}} \right) + 1 + j\omega \left( {RC + r_{\rm DS} \left( {C + C_{\rm D}} \right)} \right)}}.} $$
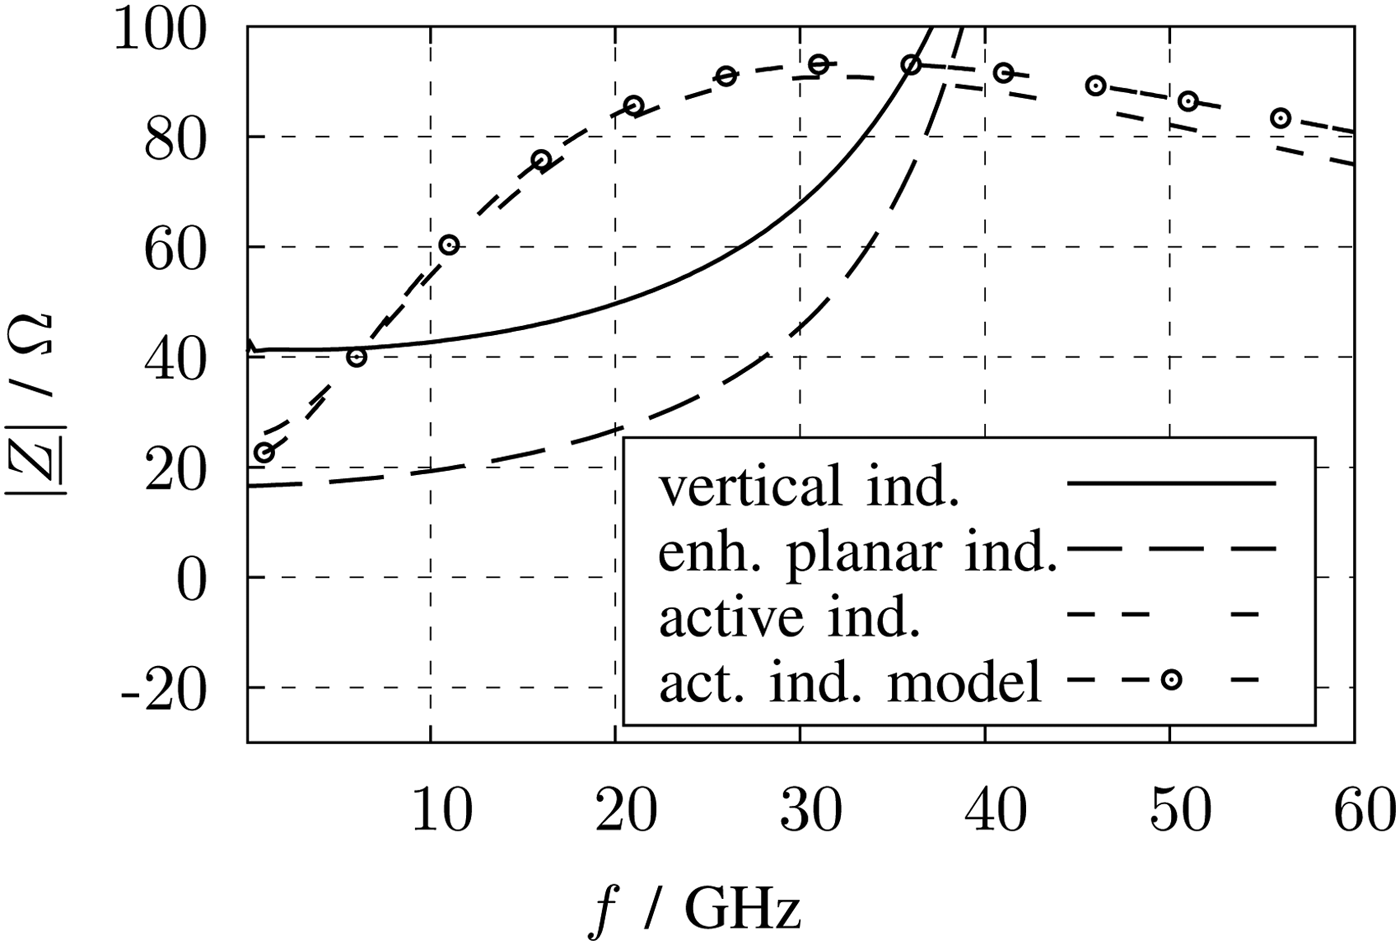
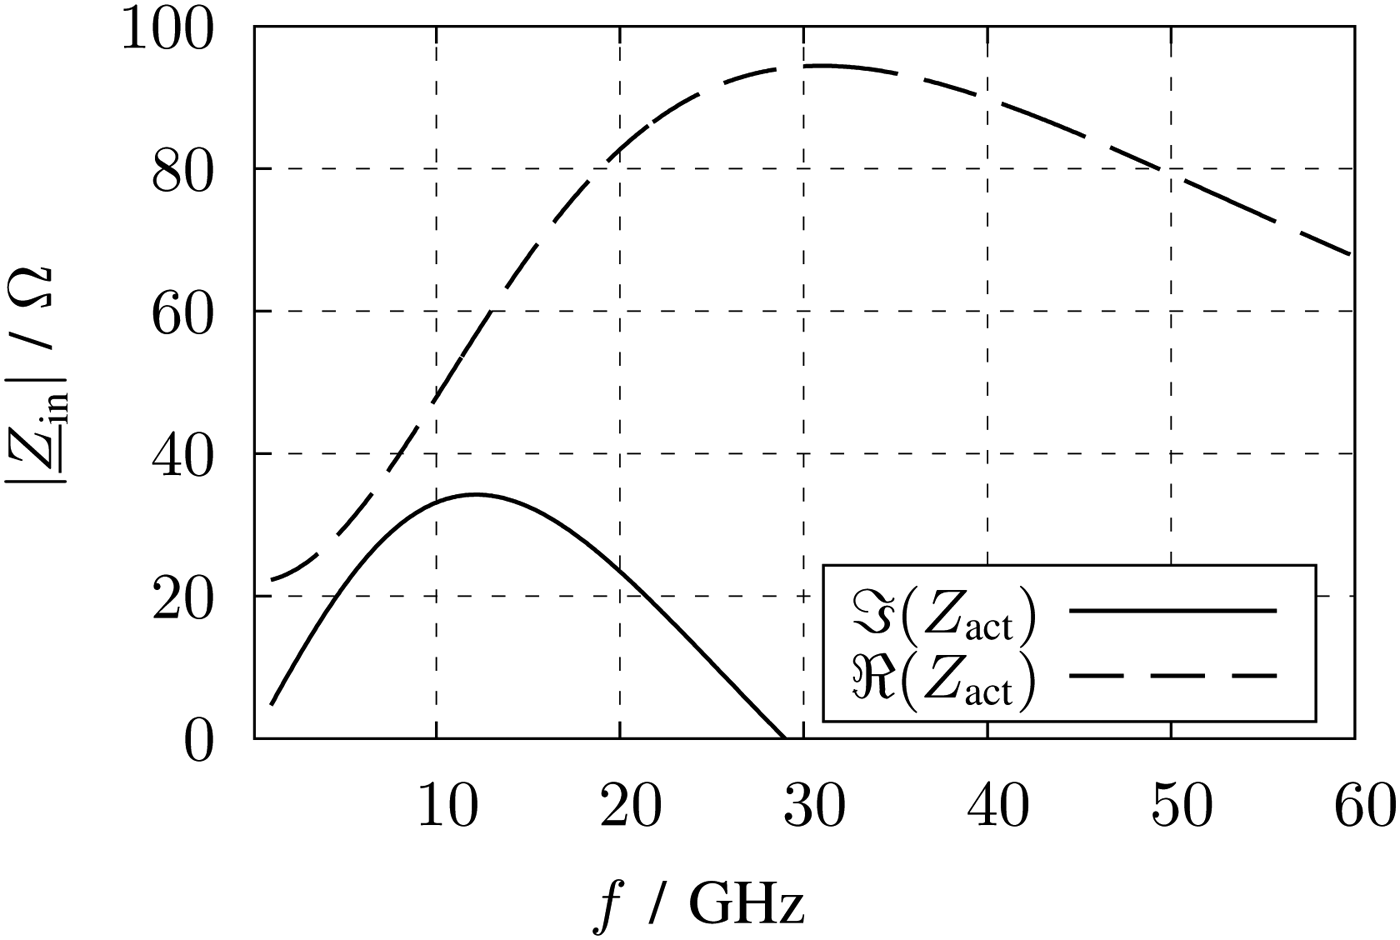
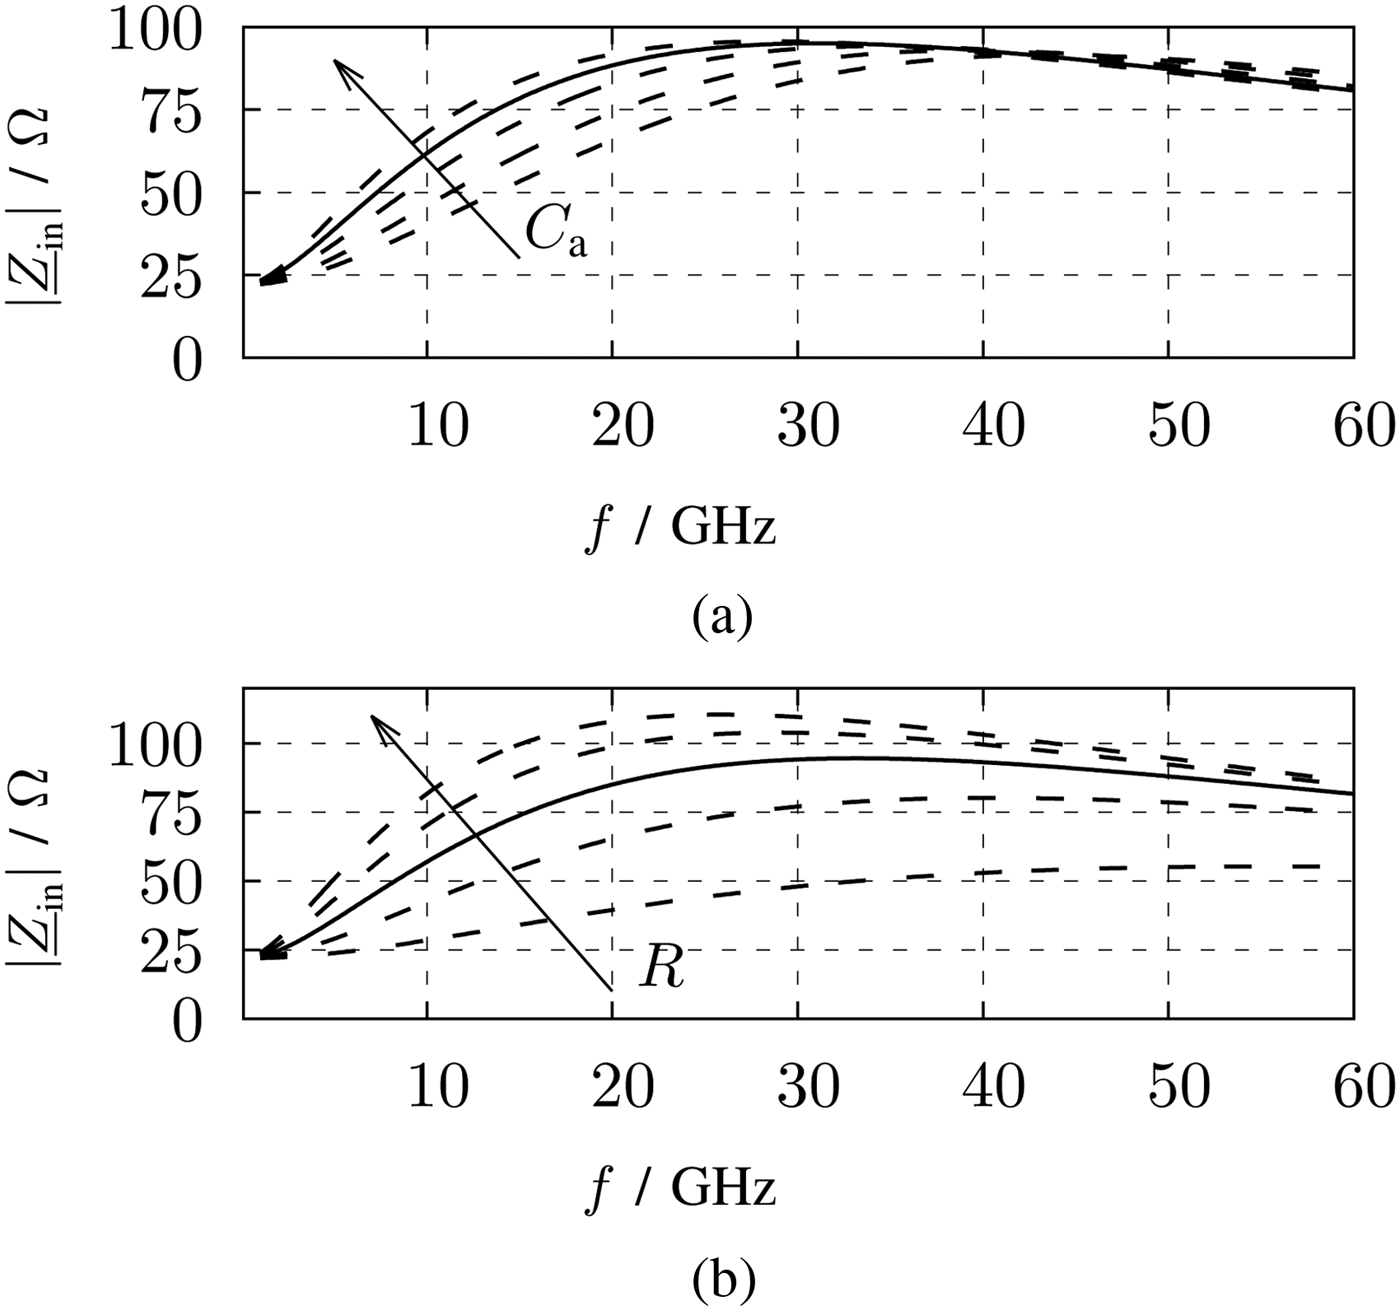
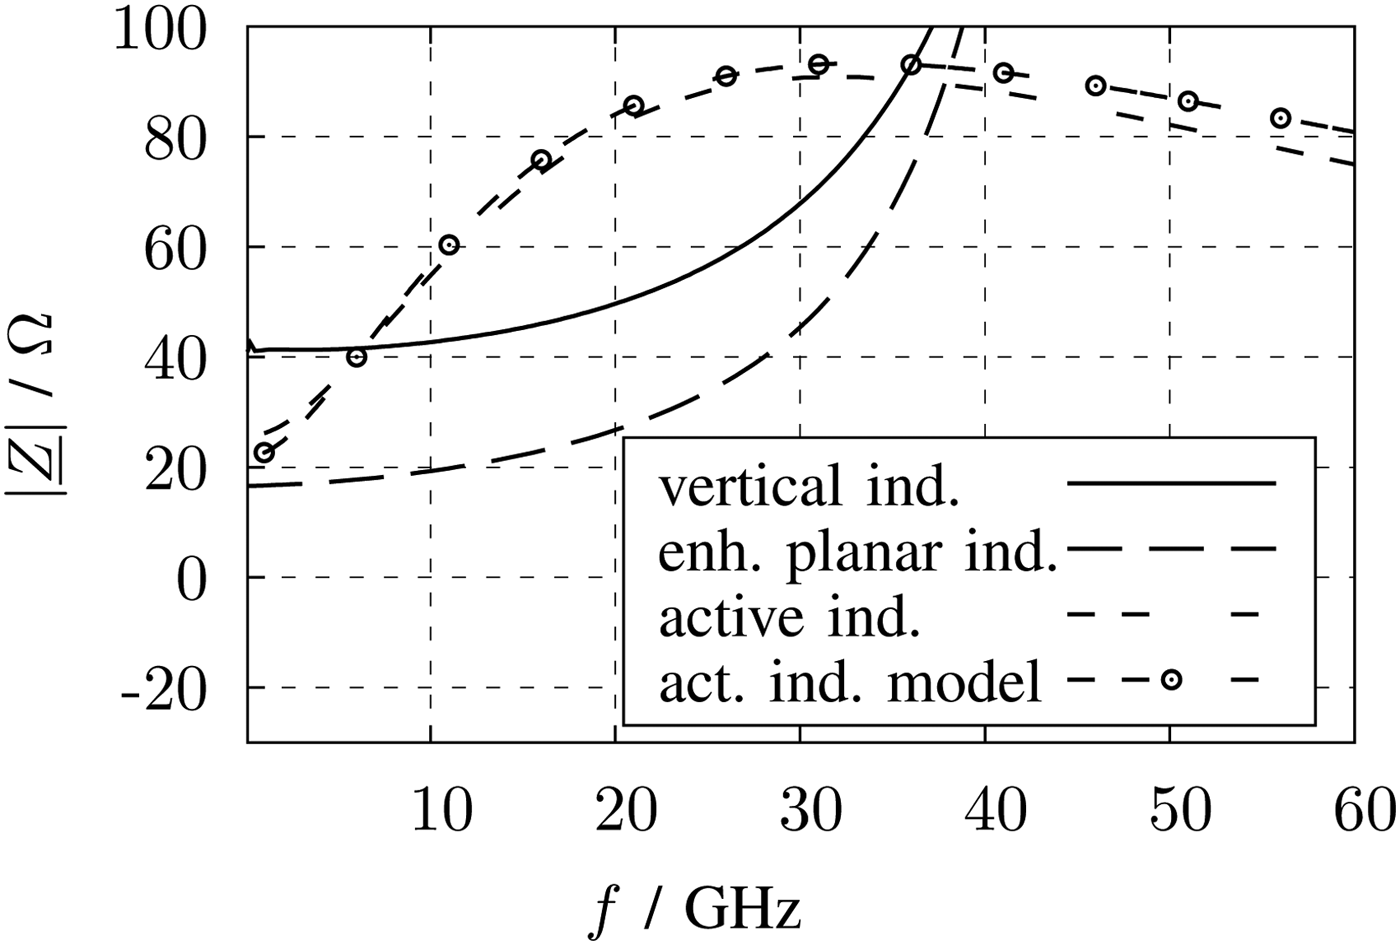
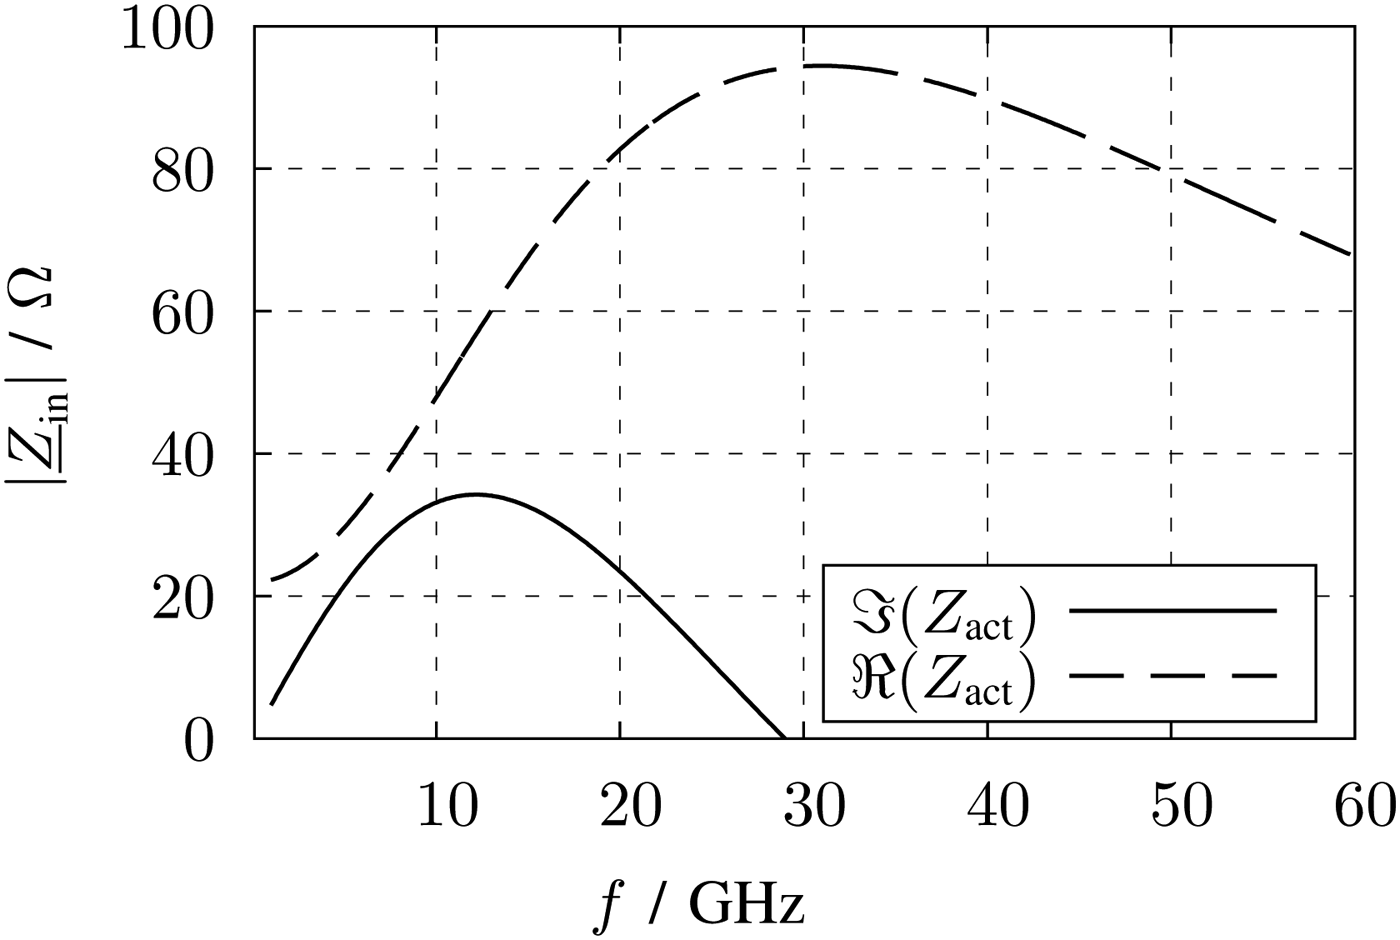
With the parameters listed in Fig. 13, the magnitude of Zin is also plotted together with the simulation results in Fig. 14. At lower frequencies both curves show the inductive behavior by increasing the magnitude of the impedance over frequency. This behavior is required to counteract the decline of the voltage gain of the LNA. To understand the active inductor, in Fig. 15 the impedance is splitted in real and imaginary parts. The imaginary part shows no broadband behavior and reaches zero before 30 GHz. Nevertheless, the magnitude of the impedance achieves its maximum at about 30 GHz. This effect comes from the frequency depending real part of the impedance, which is also shown in Fig. 15. The DC resistance is only 22 Ω, which reduces the DC losses.
Magnitude of the impedance of the inductors versus frequency.
Real and imaginary parts of the impedance of the active inductor.
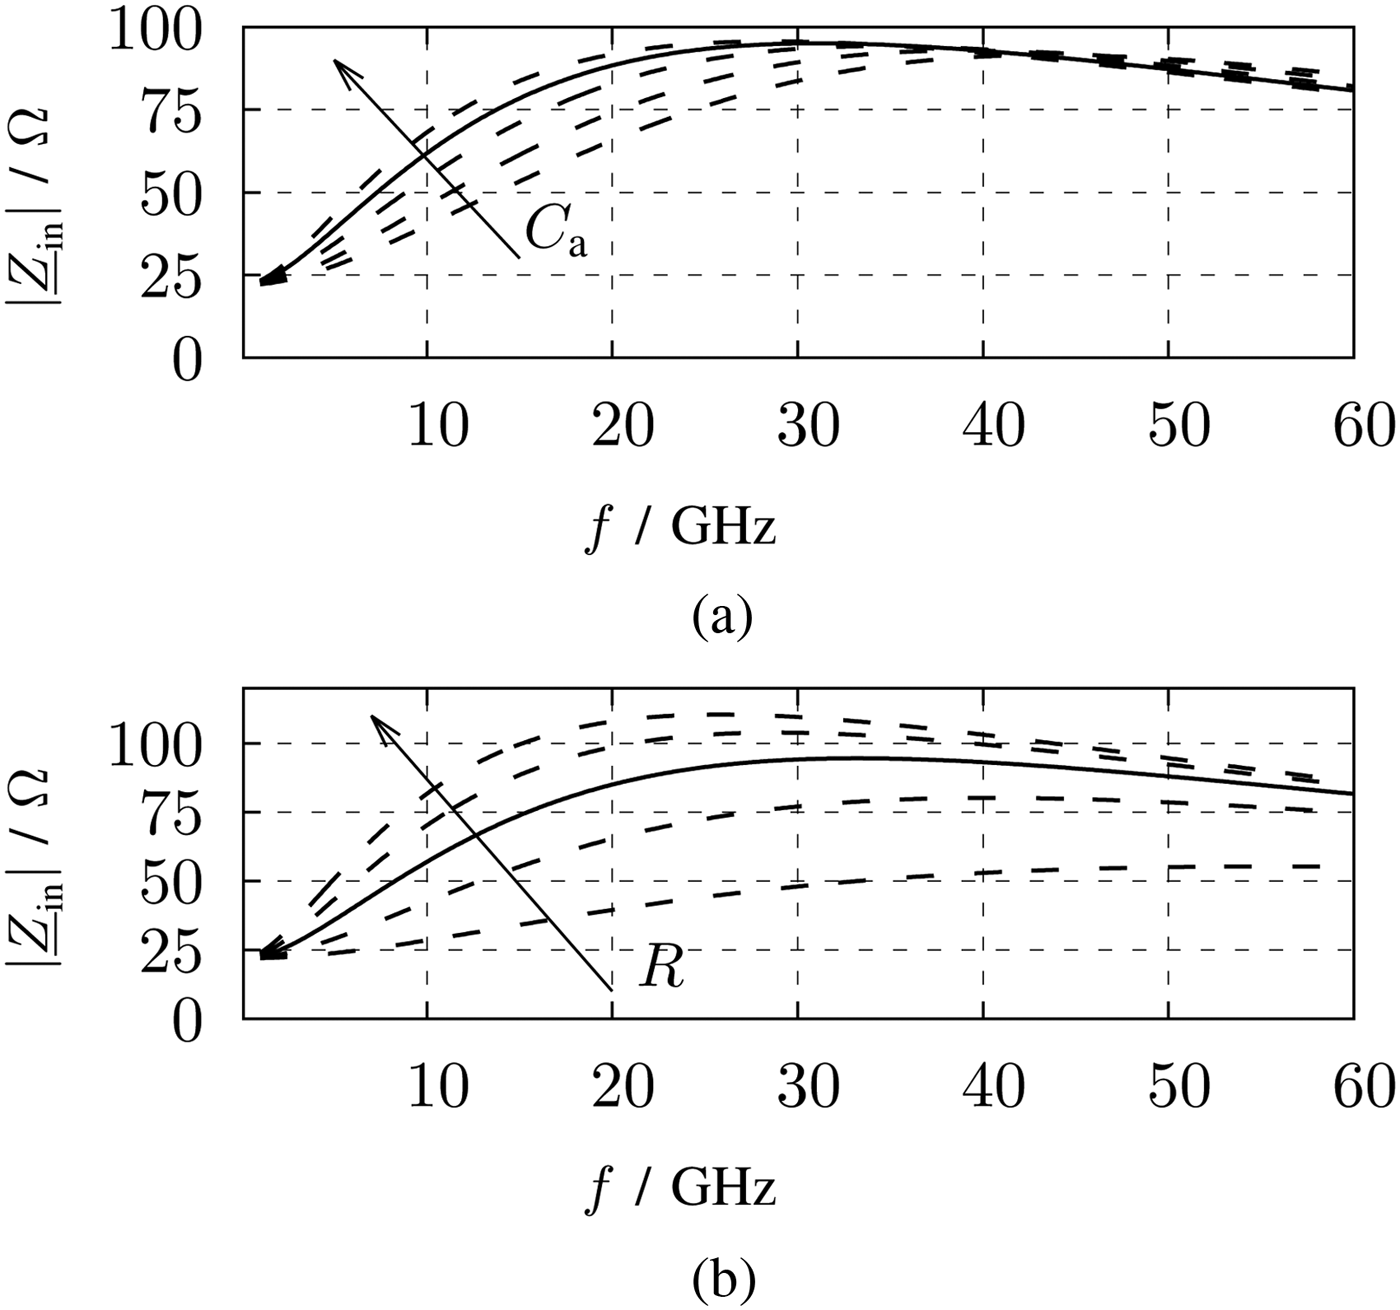
The capacitances and resistors of the transistor model are defined by the transistor width and length. The width is high enough to carry the tail current and the length is set to the minimum length to obtain a high bandwidth. Remaining parameters are C a and R, which are plotted with different values in Figs 16(a) and 16(b). By increasing C a or R, the slope of |Zin| also getting higher. C a defines the decline toward higher frequencies and R affects the maximum of |Zin|. For this design, C = 105 fF and R = 300 Ω are selected as a compromise for a minimum decline toward higher frequencies and for a maximum |Zin| at about 20 GHz to counteract the decline of voltage gain of the active inductor.
Magnitude of the impedance of the small signal model active inductor. (a) R = 300 Ω; C a = [40 fF, 150 fF]. (b) C a = 105 fF; R = [100 Ω, 500 Ω]
An advantage of this inductive element is, that the lower metal layers are covered by transistors and resistors. With a considered layout and the connection of the capacitor the metal density rules of the upper metals fullfilled.
3) VERTICAL INDUCTOR
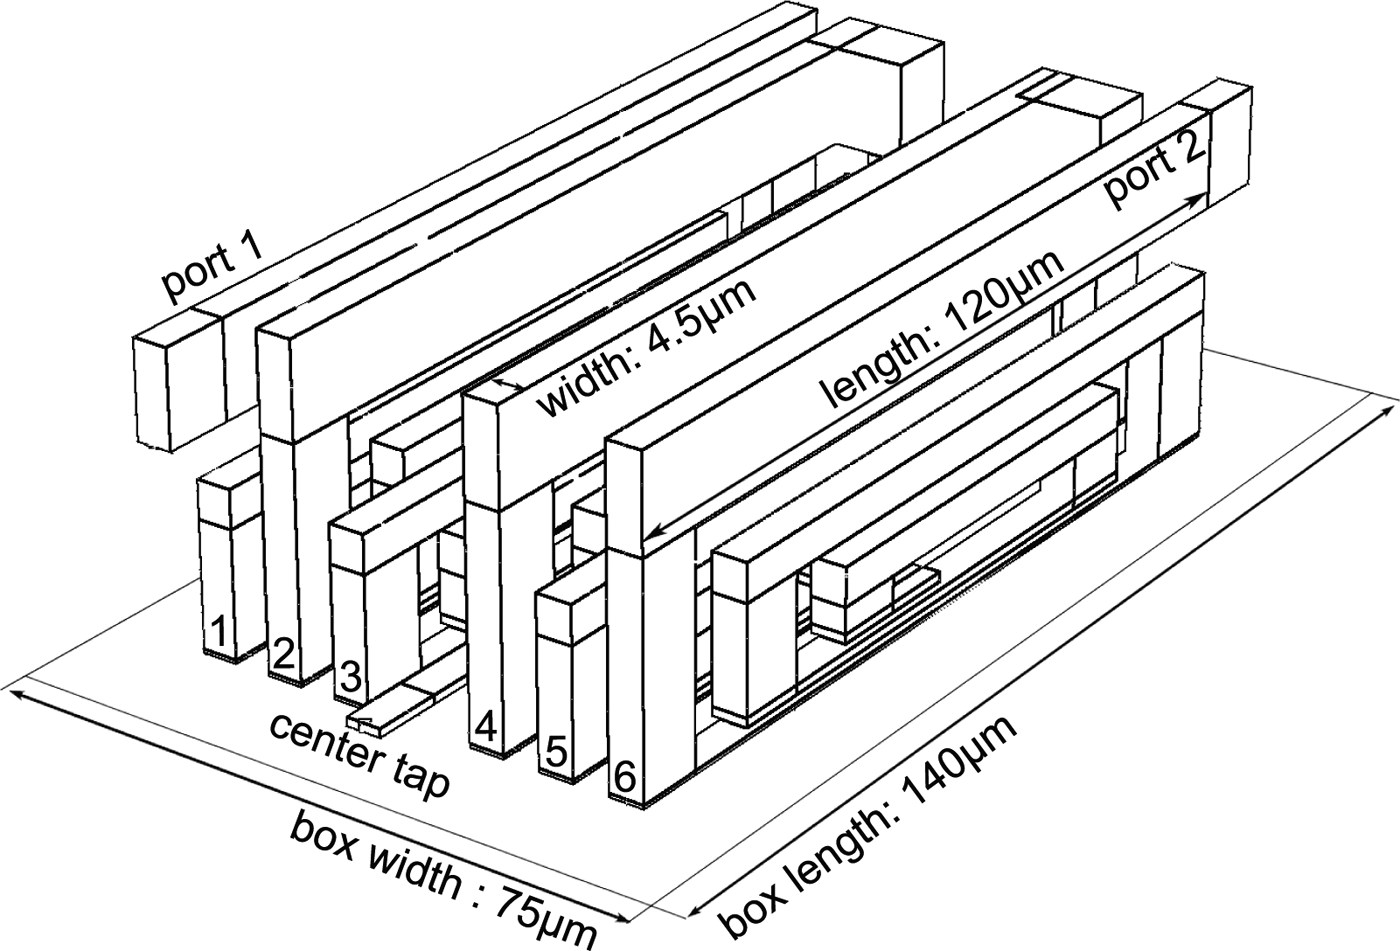
Another idea to design inductors with low size are vertical inductors. The implementation of these inductors is described in [Reference Belfiore, Henker and Ellinger15, Reference Belfiore, Henker and Ellinger16]. The turns are not planar to the substrate plane but run across the metal stack. The windings begin at the upper metal, run through the via stack to the lower metals and finally ends in the middle of the metal stack. The setup of the vertical inductor is shown in Fig. 17. The windings run through six conductor planes. To reduce the area, the inductor is designed as symmetrical inductor. The central tapping is on the lowest metal, whereas the contacts are on the top metal.
Setup of the vertical inductor.
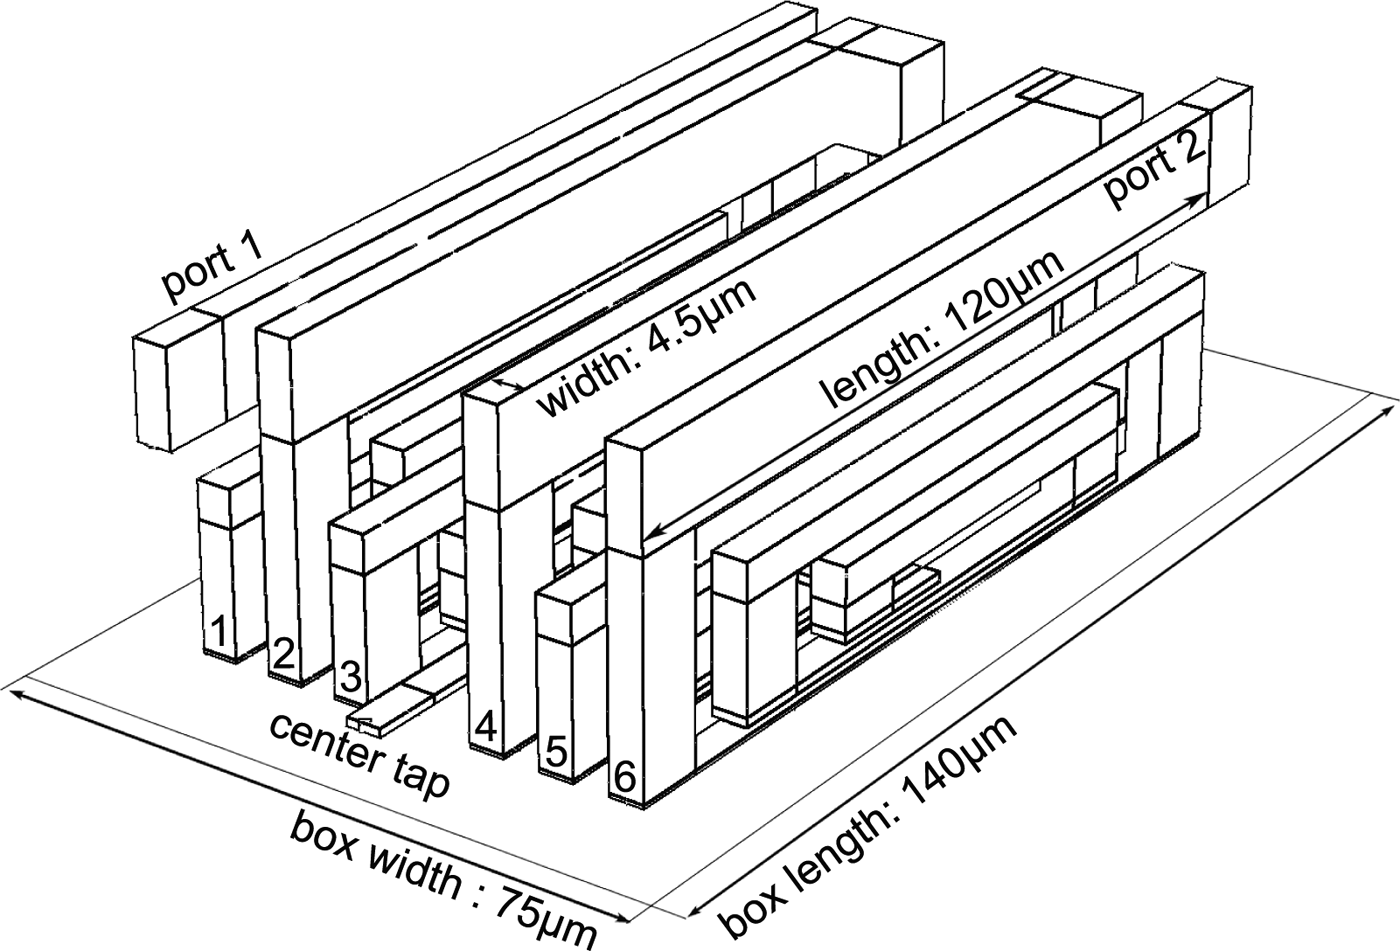
This geometry implicates a high dependency on the metal stack, so there is no degree of freedom for the designer. The distances of the conductor planes are fixed and change over the metal stack. Due to the fixed distances, the inductance can only be increased by connecting several inductors in series or by increasing the numbers of windings, which in turn are limited to the metal stack. In addition, the small distances of the lower metals decrease the SRF. For this LNA six smaller vertical inductors are connected in series to achieve the necessary differential inductance value of 1 nH. By changing the geometry the inductance cannot be achieved.
The width of the inductor is defined by the maximum current of the metals. Contrary to planar inductors, the vertical inductor also uses the low layers of the metal stack, which are often made of thin copper. This results in a higher width of 4.5 µm. Additionally, the contact area has to be large enough for the current and is defined by the low value of the current per via of the lower metals. This also increases the area compared with enhanced planar inductors. The advantage of the layout is that the local density rules can be easily fulfilled.
In Table 1, the key parameters of the vertical inductor are listed. The SRF of 45 GHz is sufficient and can be easily improved by spending more area and more distance to the guard ring of the inductor. Due to the use of lower metals and creating the inductor by six single inductors the area is moderate and hence the inductance per area reaches 95 nH/mm2.
The quality factor versus frequency is depicted in Fig. 11 and its maximum value of 2.2 at 27 GHz is low, but not a problem for this application.
4) COMPARISON OF INDUCTIVE COMPONENTS
Table 1 reports the comparison of the inductors. Two of them are symmetrical solutions: the enhanced planar inductor and the vertical inductor. For an equitable comparison the required area, the size of the single inductors has to be doubled for the implementation in a differential design. The area includes the whole area of the inductor including the guard ring, which influences the EM-field.
The most informative value is the inductance per area. Here strong distinctions can be demonstrated. The active inductor has a high equivalent inductance in a very compact size which results in inductance per area of 4167 nH/mm2. All passive versions achieve a much lower value, but there are marked differences, too. Compared with the vertical inductor, the enhanced planar inductor benefits from the high-current density of the upper metal layers and reaches a higher inductance per area.
A critical issue of the technology is the metal density. The local density of the lower metals of [Reference Molavi, Mirabbasi and Djahanshah13, Reference Tretter, Fritsche, Khafaji, Carta and Ellinger14] cannot be met without filling. By contrast, the active inductor solve this problem by a sophisticated layout and the vertical inductors by using all layers of the metal stack.
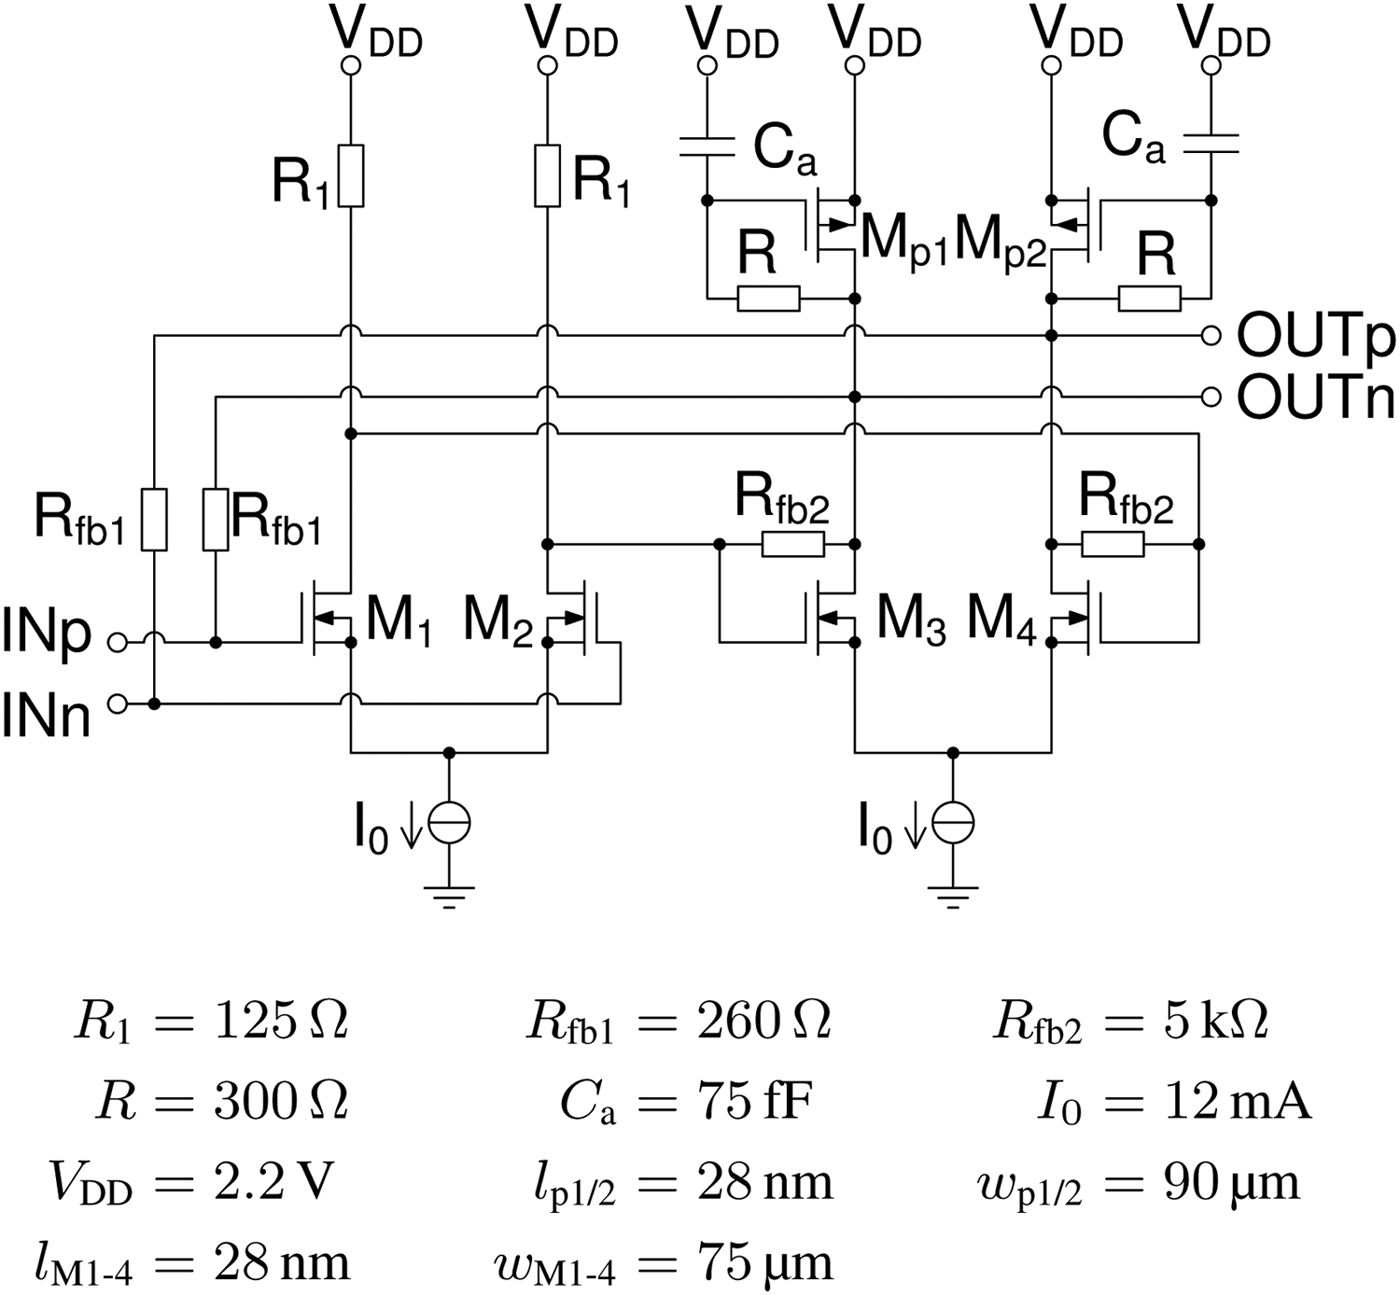
According to the analysis of this section two different versions of the LNA were implemented: one version with with active inductor and the other with vertical inductor. The first LNA shown in Fig. 12 is designed with an active inductor, which increases the NF, but has the smallest size. To keep the NF within limits only the load impedances of the second differential pair is replaced. This version benefits from the very small active inductor of 12×12 µm2. The second version implements a resistor and a vertical inductor in series as loads of both differential amplifiers. It is a remarkable example for the passive, but still small-sized solutions. The schematic representation of this version is depicted in Fig. 18.
Schematic representation of the LNA with vertical inductors.

III. MEASUREMENT RESULTS
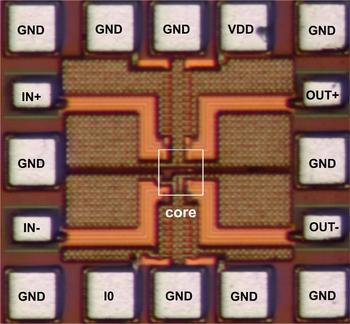
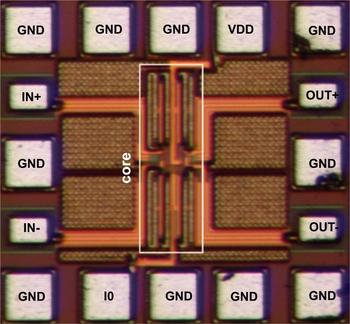
The LNAs were implemented in a low-power 28 nm bulk CMOS technology. Each circuit consumes P DC = 53 mW from a supply voltage of 2.2 V. The photographs of the fabricated dies are shown in Figs 19 and 20. In both pictures, the core areas are marked. The core area of the die with active inductors is 40 × 45 µm2 and 310 × 75 µm2 for the LNA with vertical inductors. The active inductors inside this area are so small that they cannot be recognized. On the contrary in Fig. 20, the vertical inductors can be easily identified due to their characteristic striped shape. On the top and on the bottom of each FET core, there is an array of six single vertical inductors.
Photograph of the die of the LNA with active inductors.

Photograph of the die of the LNA with vertical inductors.

The circuits were verified by measurements. For small signal measurements and the large signal 1 dB compression point the LNA were characterized on chip with the R&S ZVA-67. The other measurements were completed on printed circuit board (PCB) with the bonded chips. Both dies are part of a larger die, which could not be cut and therefore the bond wires of the outputs are very long. Due to this fact the RF behavior deteriorates. For the differential noise measurement, it was necessary to add low temperature cofired ceramic (LTCC) baluns to be connected to the single-ended measurement equipment. For the results the baluns were deembedded. With this test setup the noise figure were measured with the R&S FSW-67 with the noise source NC346V of NOISECOM. The large signal two-tone measurements for determining IM3 are performed by the R&S SMBV and FSV-7.
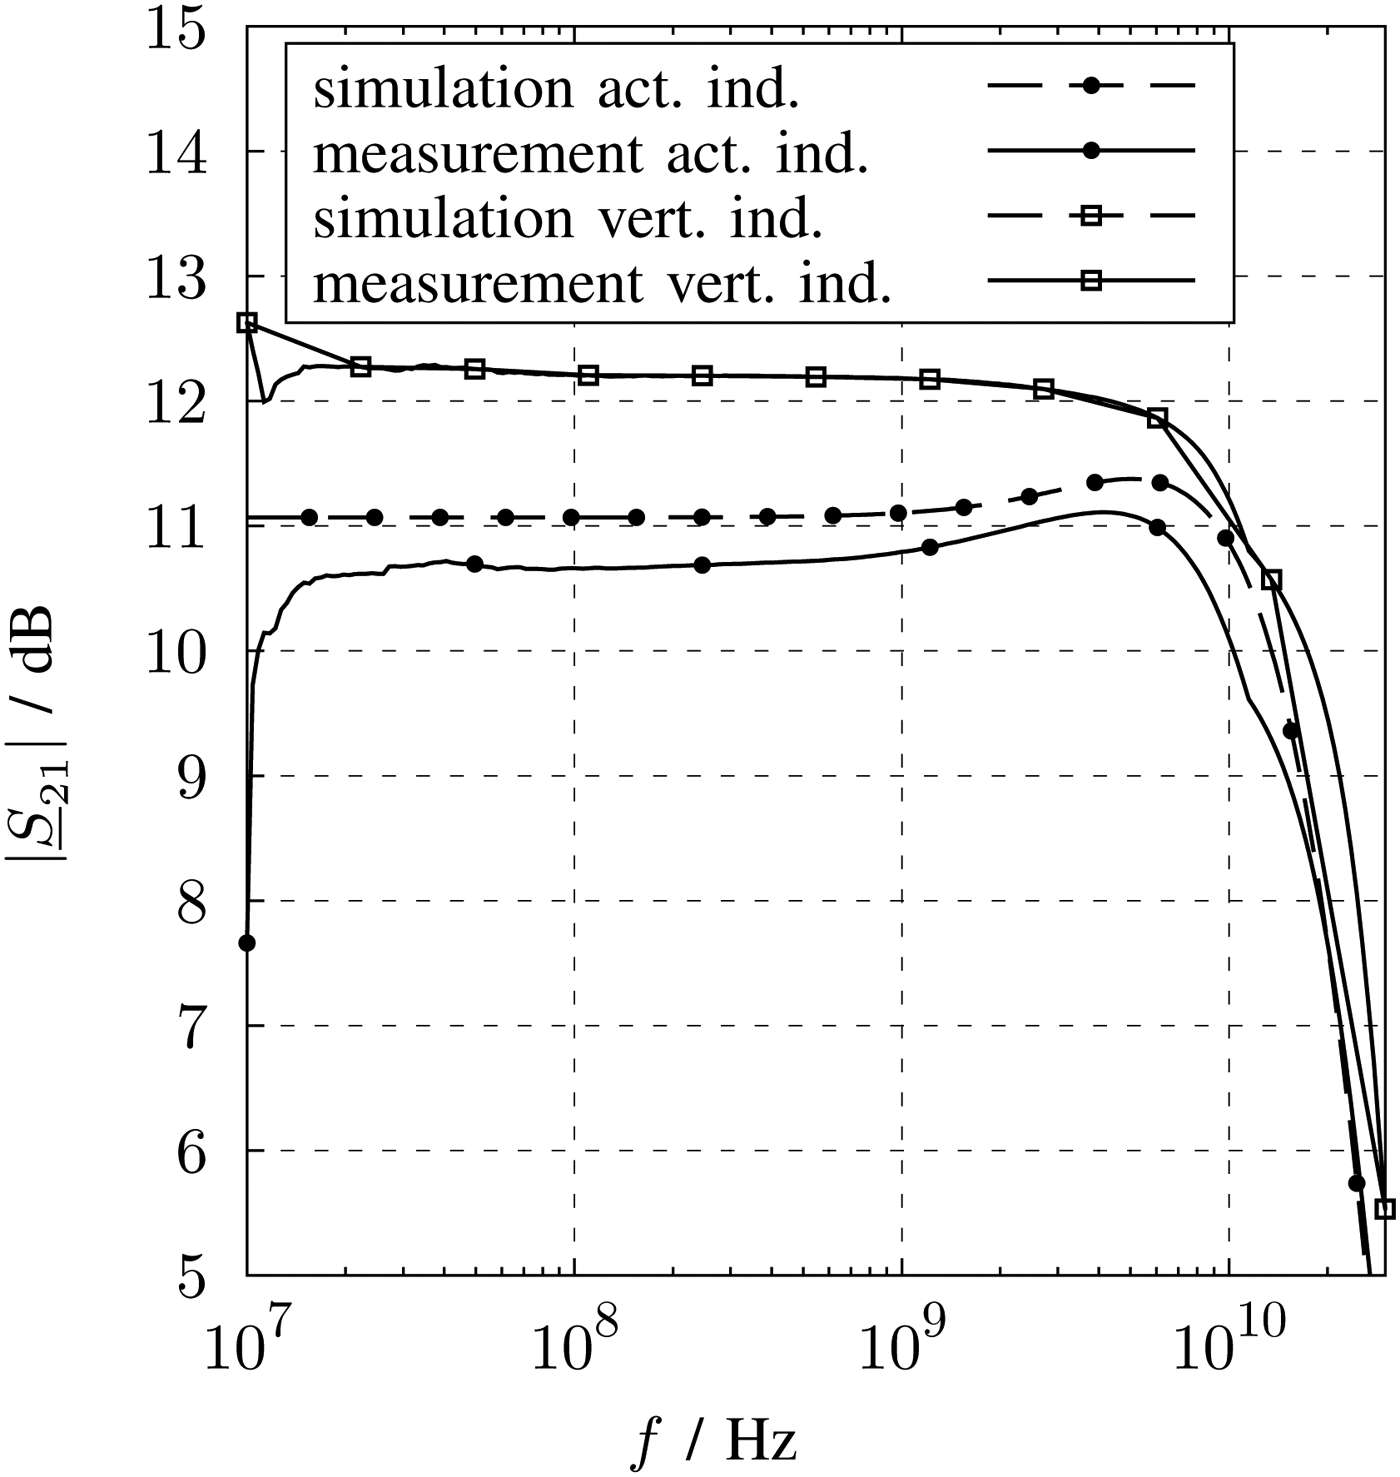
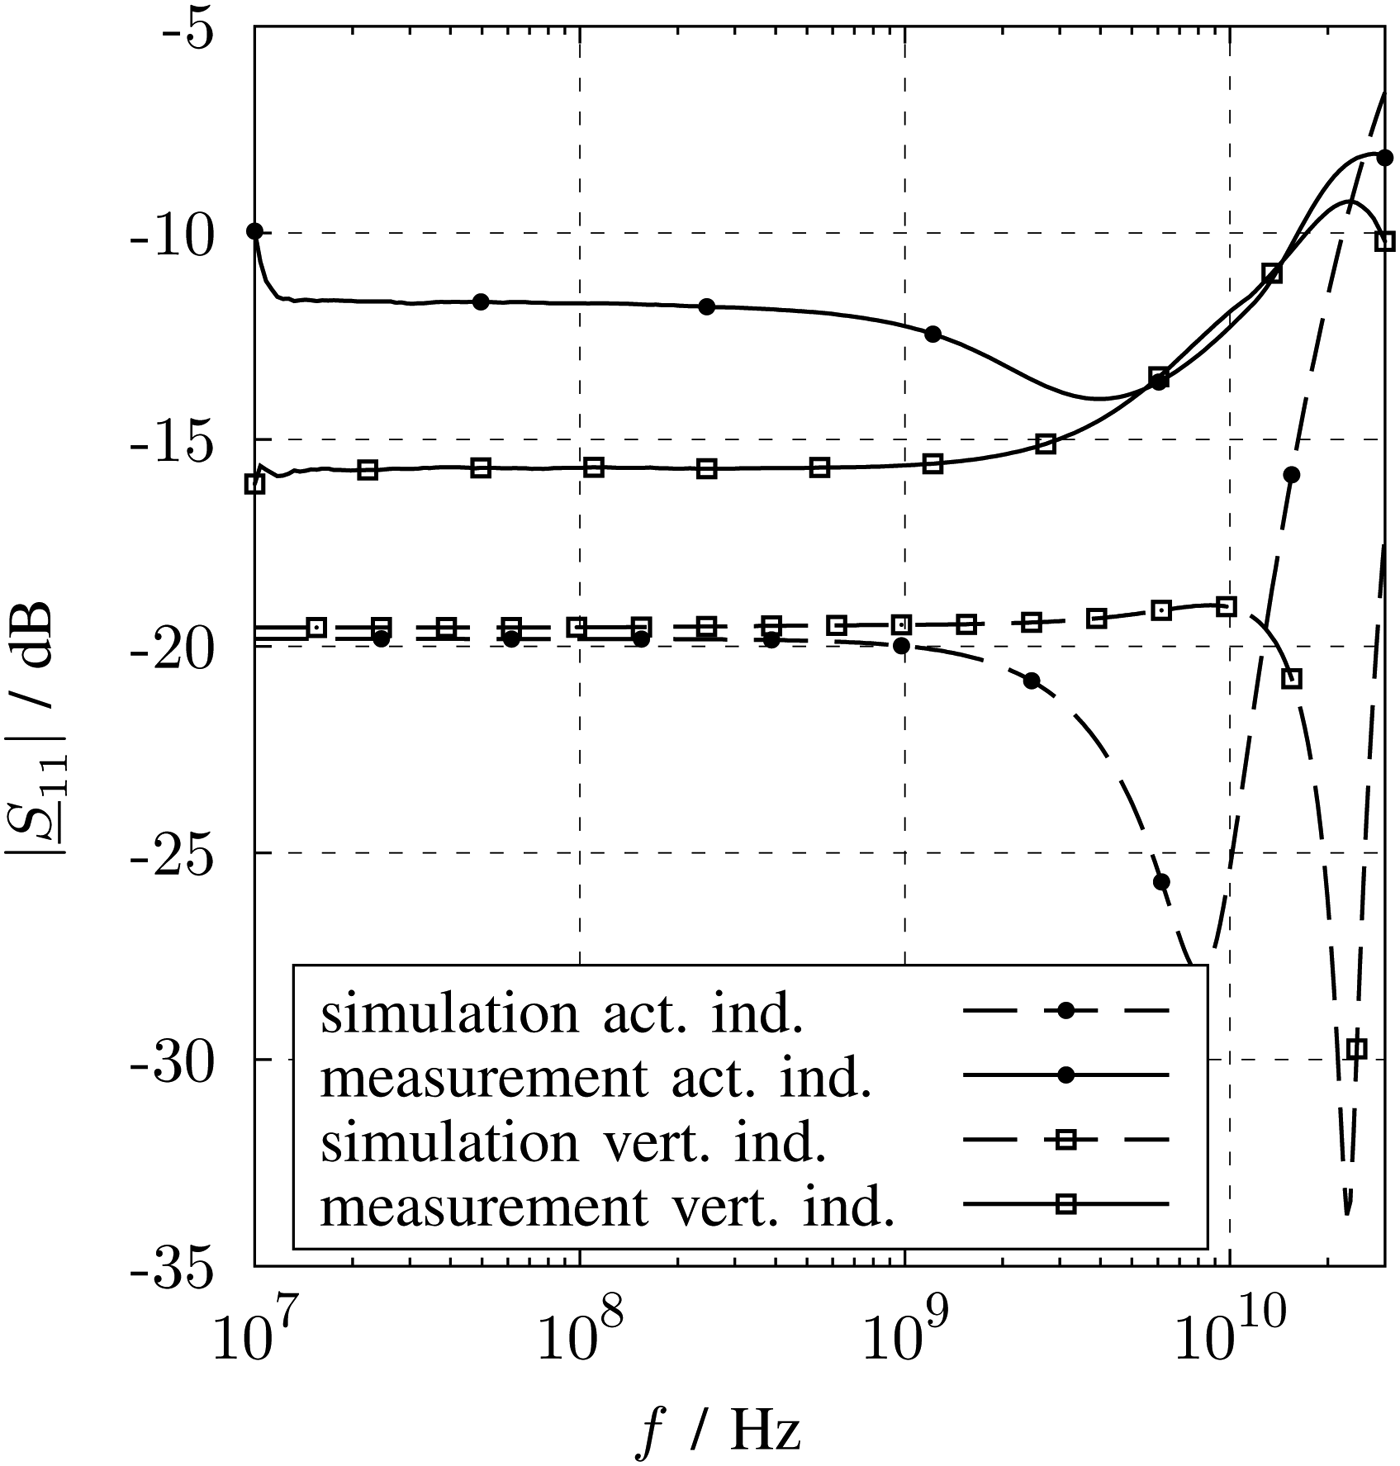
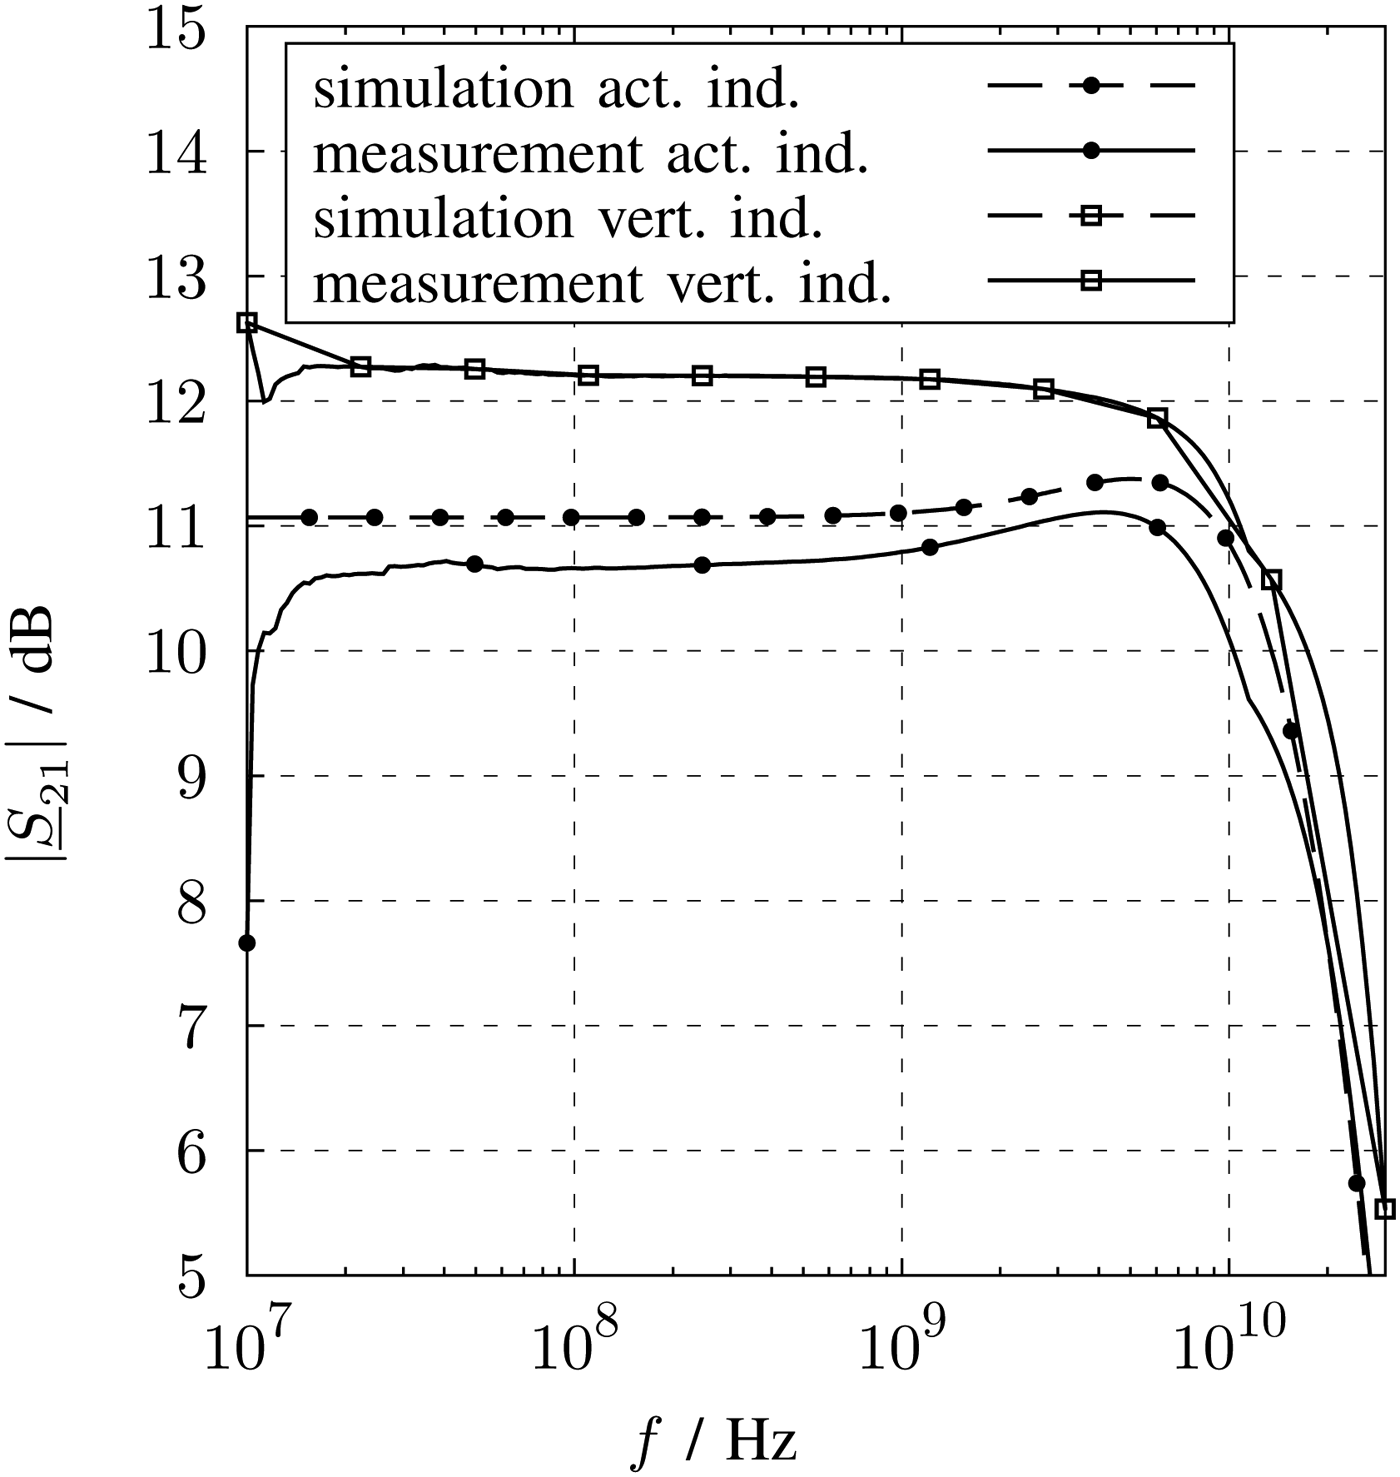
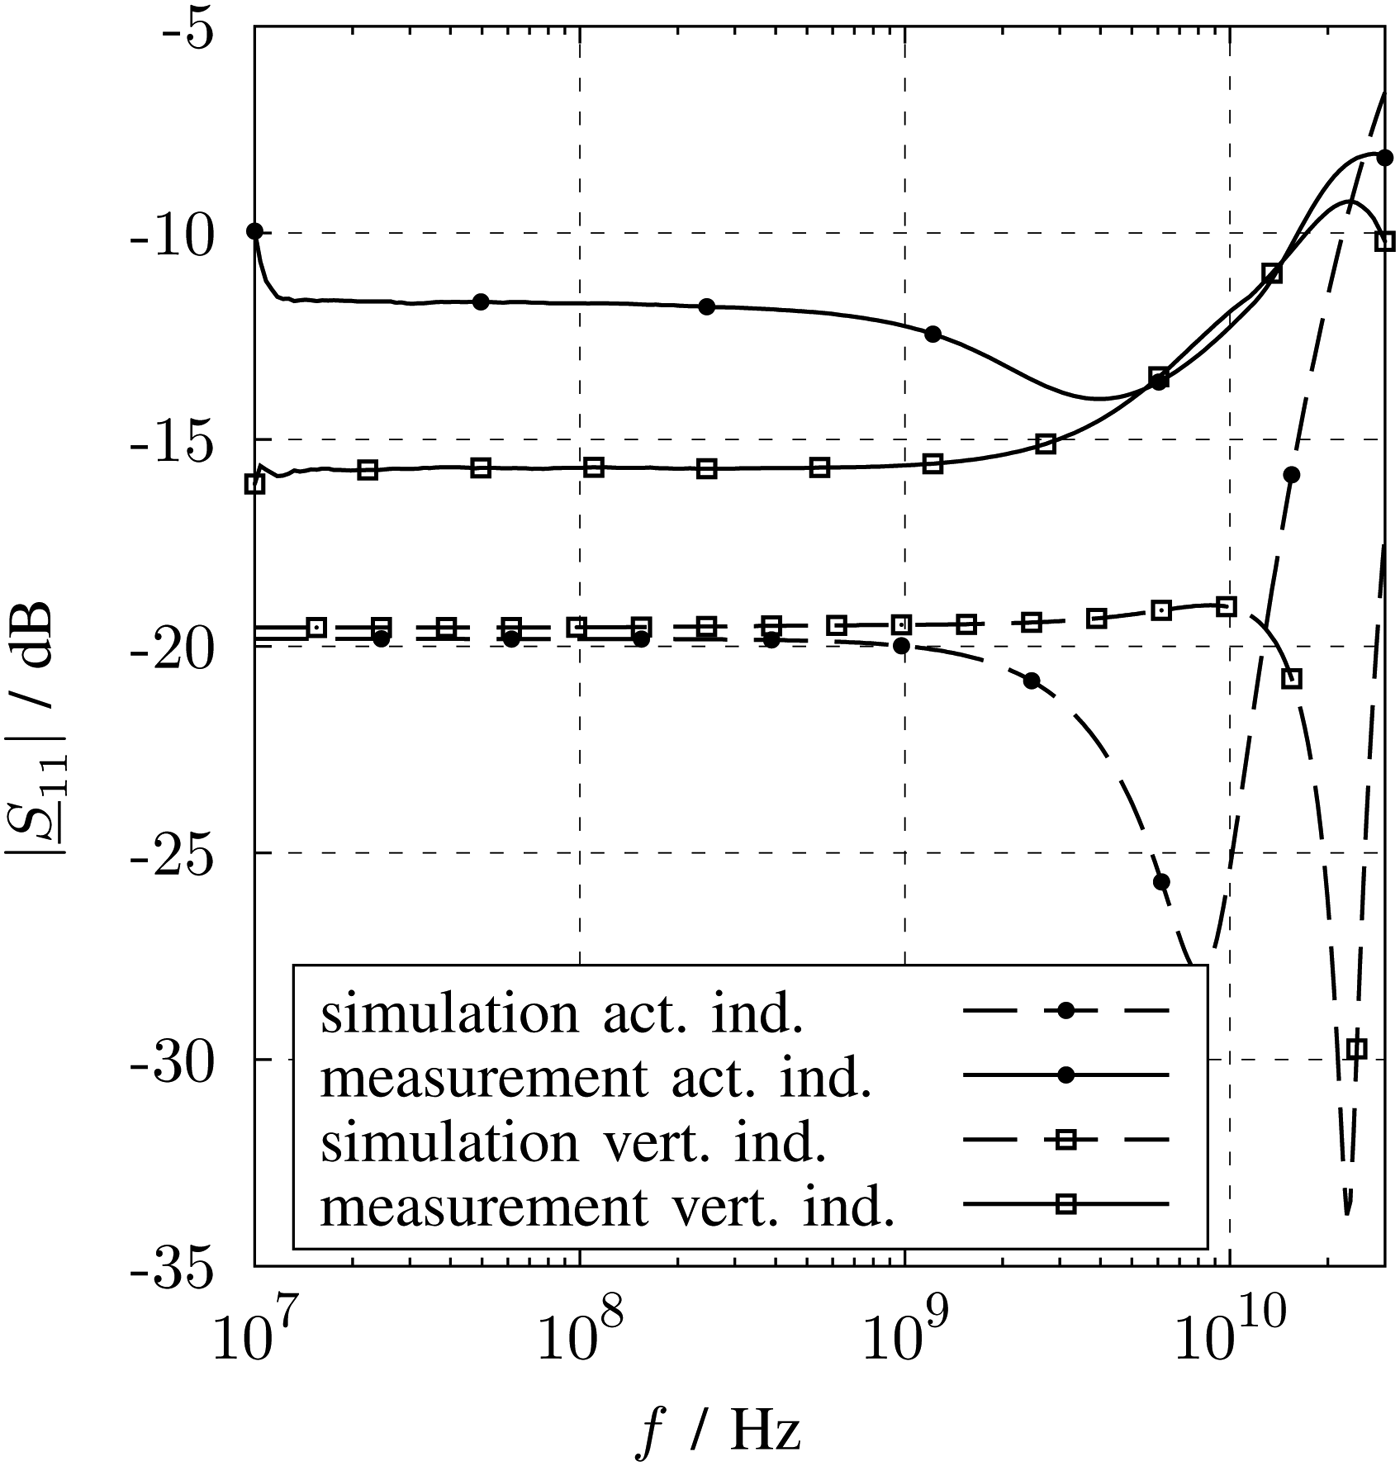
In Figs 21 and 22, the measured and simulated S-parameters are depicted. The input reflection coefficient and the forward transmission were verified for both LNA by measurements.
Measurement and simulation results of the forward transmission.
Measurement and simulation results of the input reflection coefficient.
The magnitude of S21 in Fig. 21 is constant over frequency for both LNA versions. Besides the degradation of the measurement results at low frequencies, there is a good agreement between measurements and simulations of both LNAs. This decline can be explained by a series DC block required for the measurement. The simulations are performed by an ideal switch, which also blocks the DC but do not show any high-pass characteristic.
S21 of the LNA with active inductors with 10.6 dB is lower compared with the other chip with 12.2 dB. The 3 dB-bandwidth of both circuits is similar and with about 20 GHz it covers frequency bands up to the 5.8 GHz ISM bands. For system setup, it can be mentioned that the voltage gain is about 2 dB higher than the power gain. The chip with vertical inductors was designed with a voltage output with a low output resistance of 40 Ω and the one with active inductors with 26 Ω, respectively. A low ohmic output is beneficial for the bandwidth if the subsequent stage have a capacitive input like a IQ switching mixer.
Over the frequency range of 10 GHz, the |S11| is lower than −12 dB for both LNA versions. This broadband behavior could only be achieved by resistive power matching.
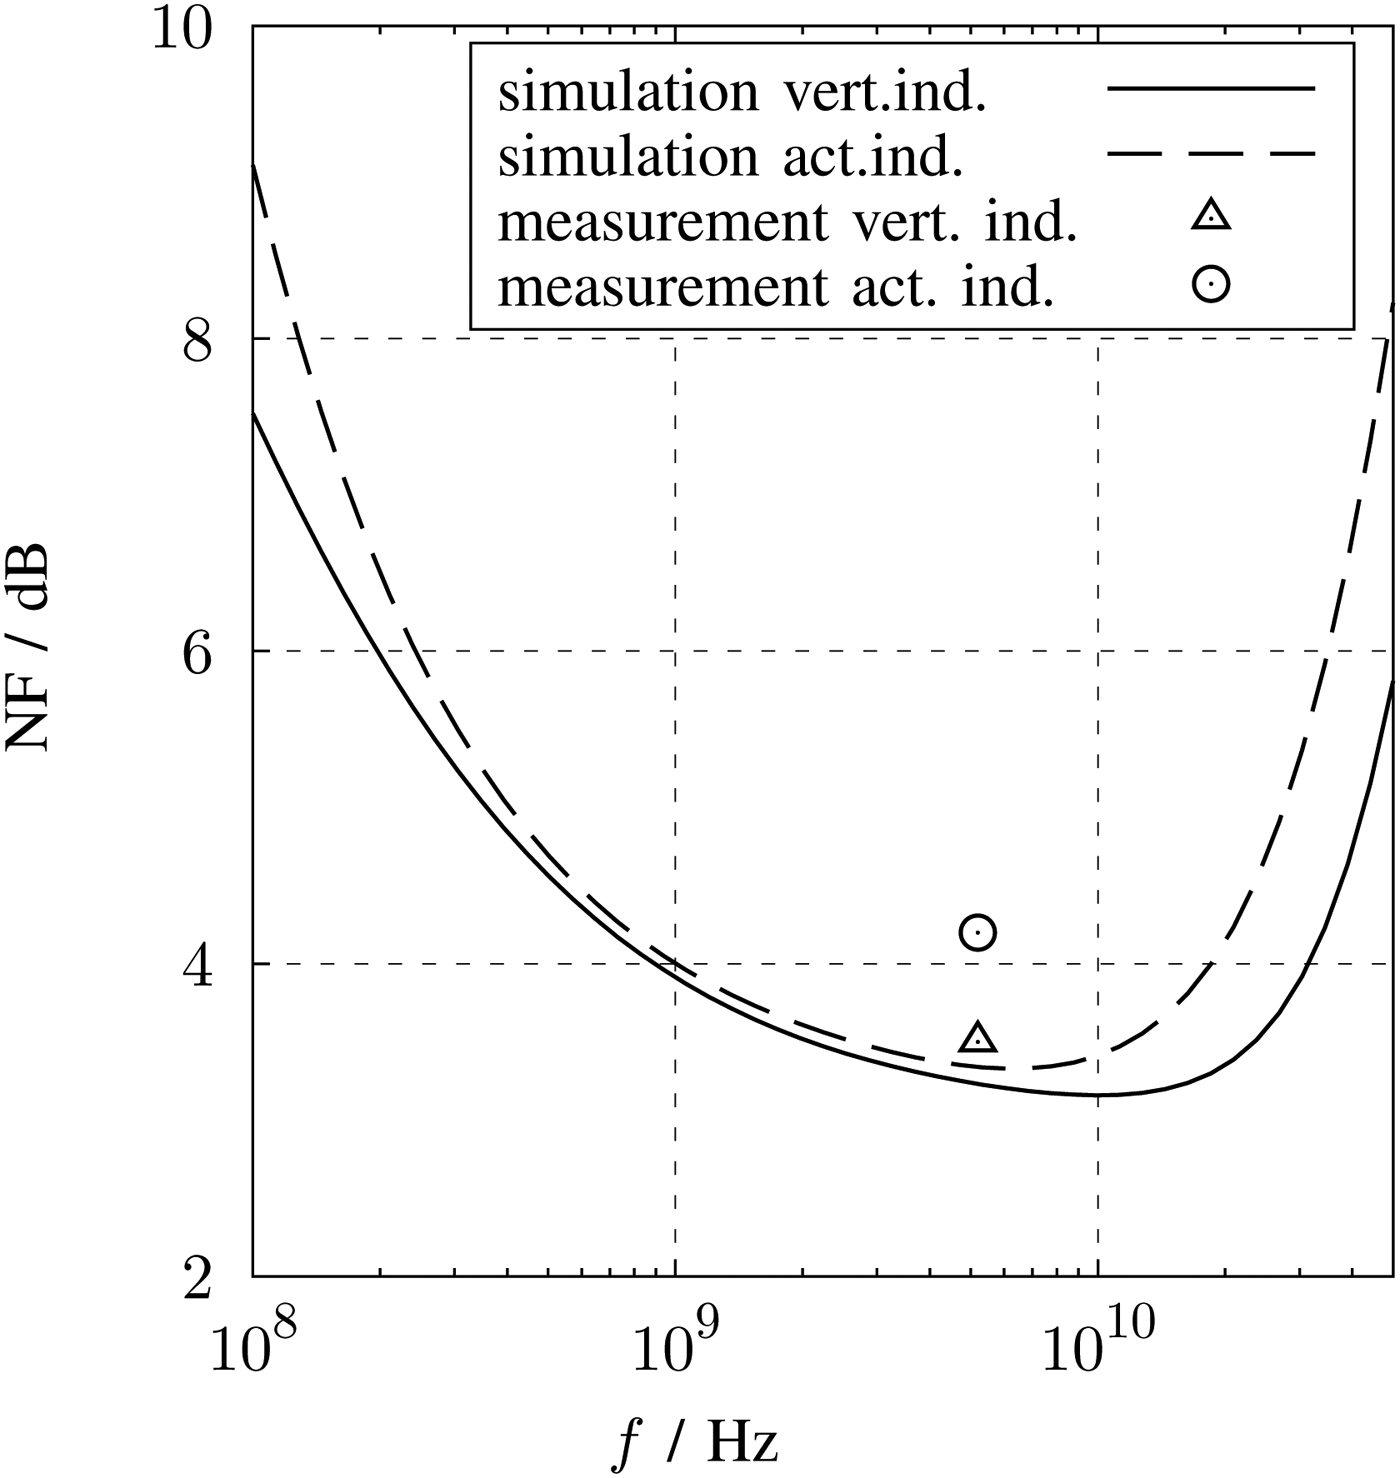
The noise figure could only be measured with the help of narrow band baluns with the result that only values at single frequencies can be specified. The lowest NF could be measured at the frequency of 5.2 GHz with 4.2 dB for the LNA version with active inductors and with 3.5 dB for the LNA with vertical inductors. Over the whole frequency range the LNA with vertical inductors shows lower NF values than the LNA with active inductors. In Fig. 23, the noise figure of the postlayout simulation is shown. Compared with the simulation values the measurement results are approximately 1 dB higher than the measurement results.
Noise figure versus frequency.

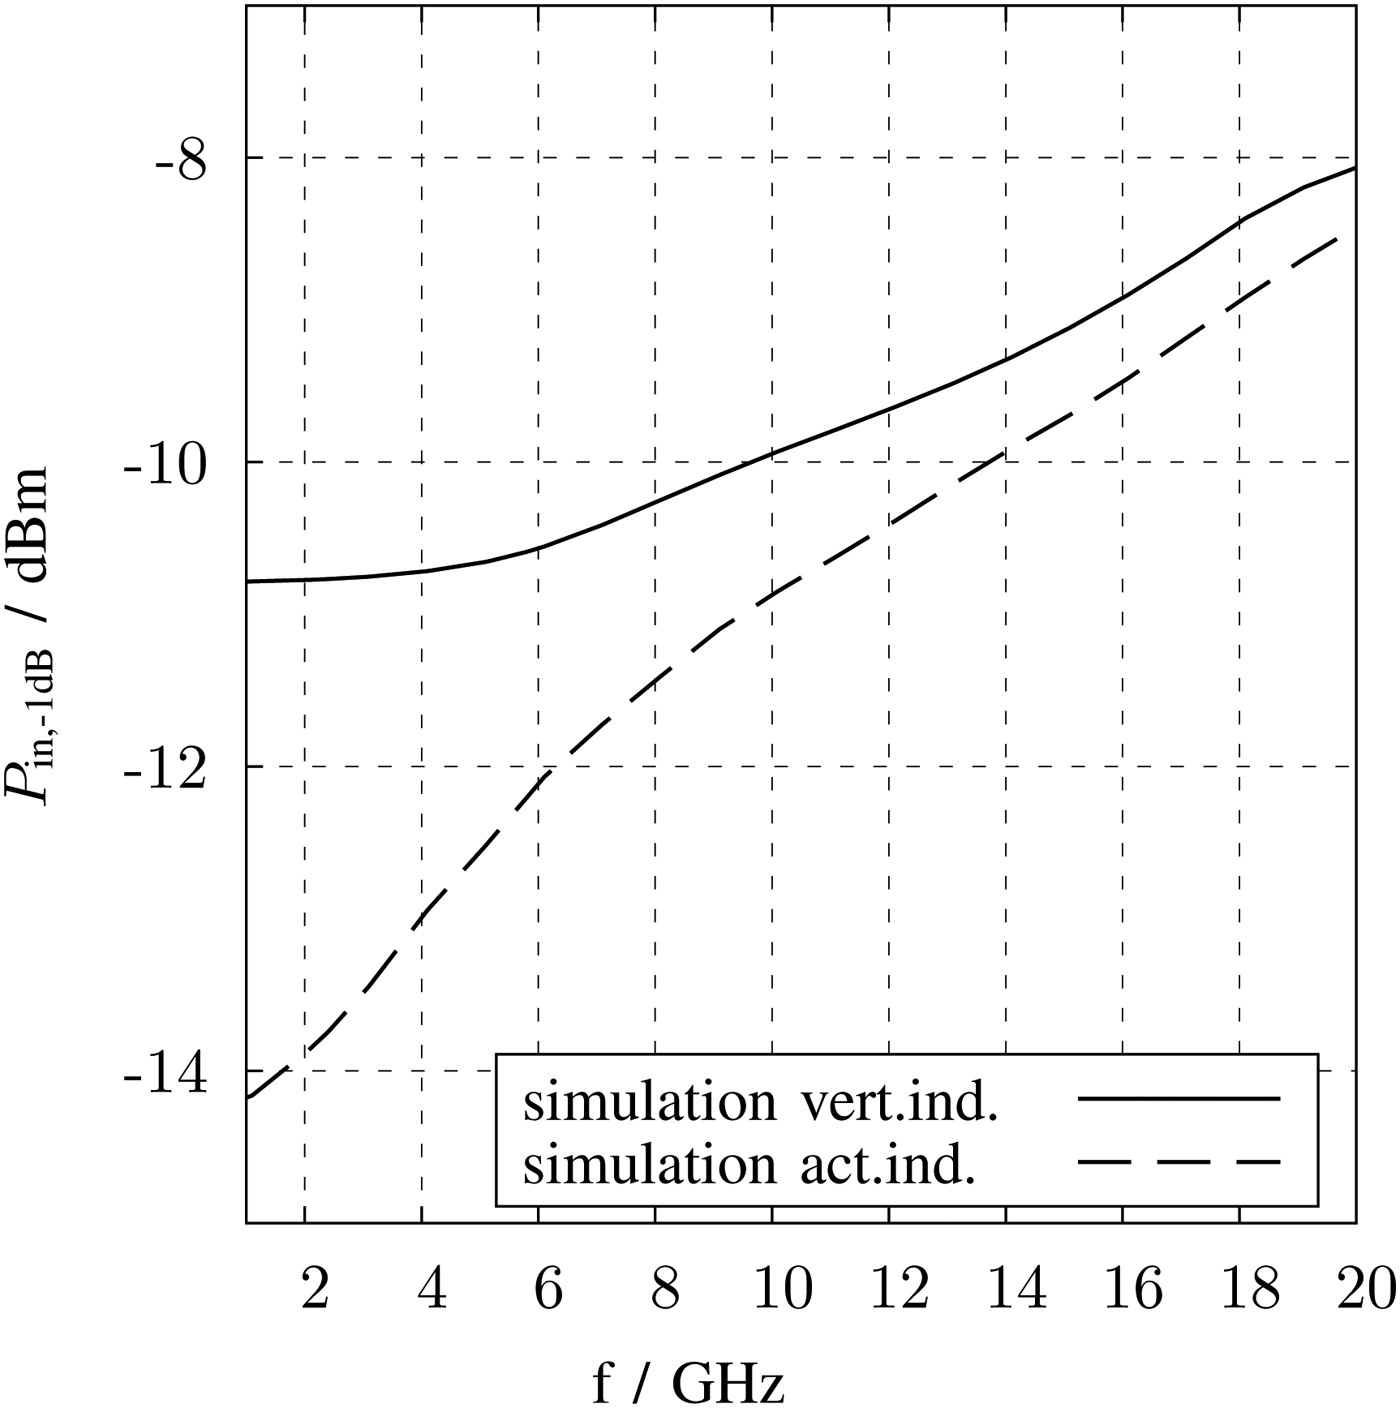
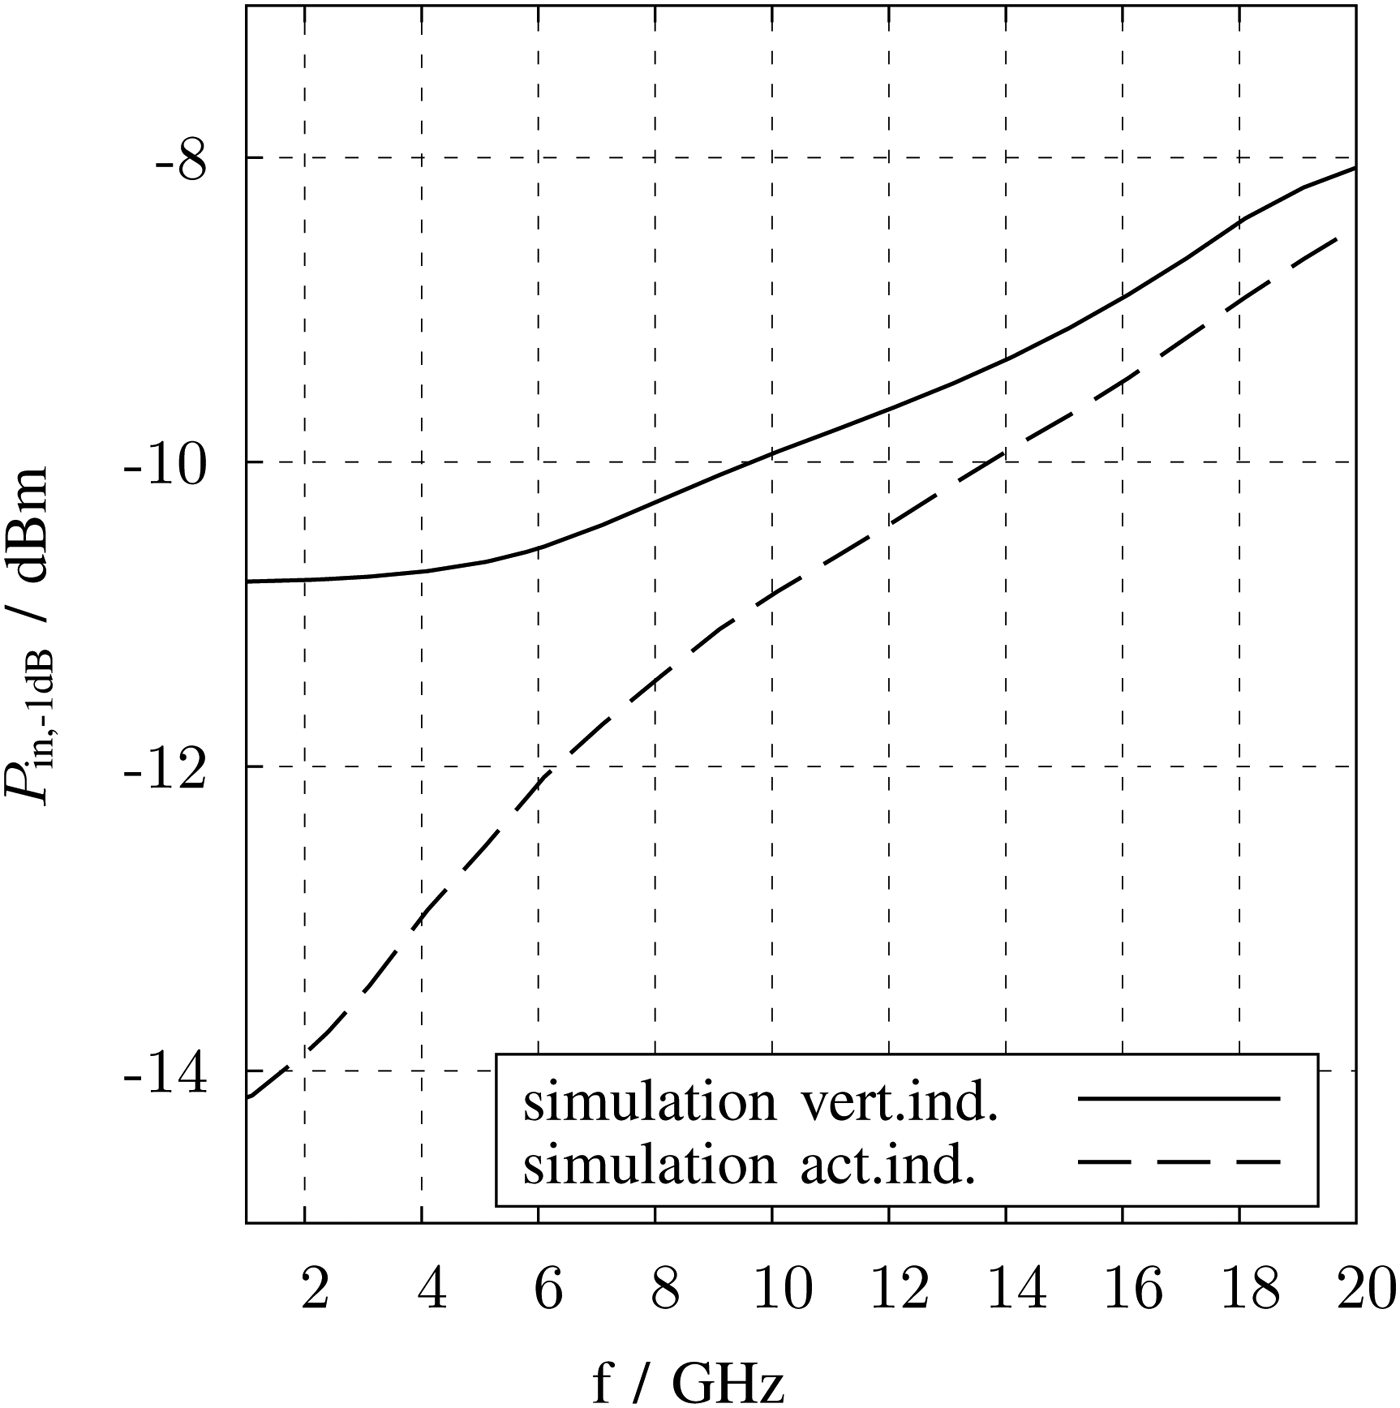
Characteristic parameter for the large signal measurement is the 1 dB-compression point. In Fig. 24, the compression point over frequency of the postlayout simulation for both LNA are shown. In the measurement, the compression point occur at least at −12 and −10 dBm input power for the LNA with active inductors and for the LNA with vertical inductors, respectively.
Compression point versus frequency.
An intermodulation distortion measurement was carried out using the RF input frequencies of f RF = f RFn ± 500 kHz for one measurement with f RF1 = 2.4 GHz and the other with f RF2 = 5.8 GHz. In the 1 dB-compression point the LNA with vertical inductors achieves maximum IM3 = −14 dBc with corresponding intermodulation intercept point of IIPIM3 = −13 dBm and the LNA with vertical inductors IM3 = −19 dBc and IIPIM3 = −8 dBm, respectively.
Both circuits are unconditional stable in differential and common mode.
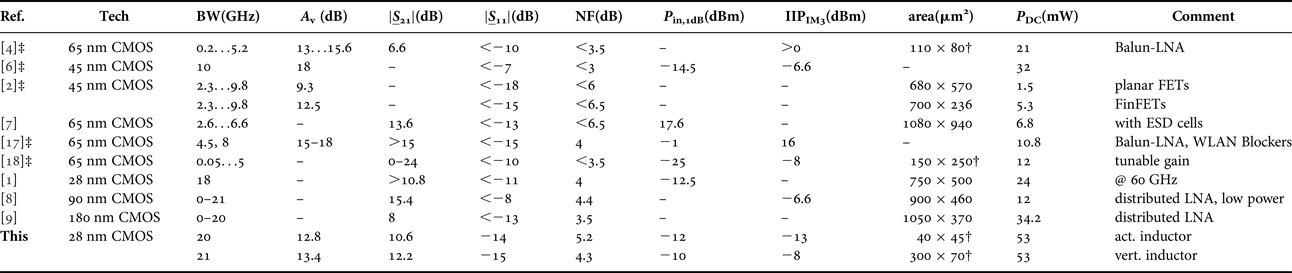
Table 2 shows state-of-the-art broadband LNA in highly scaled CMOS technologies. Besides the work of [Reference Fritsche, Tretter, Carta and Ellinger1] all listed LNA are designed in the same low frequency range up to 20 GHz like this work. The authors of [Reference Fritsche, Tretter, Carta and Ellinger1] are the only one presenting a LNA in a comparable technology. However, the working frequency is much higher and the design is narrow band. All other LNA are designed in a CMOS technology with higher minimum transistor length.
State-of-the-art.

*Measured on PCB.
†Core area.
‡Simulation results.
The works of [Reference Fritsche, Tretter, Carta and Ellinger1, Reference Blaakmeer, Klumperink, Leenaerts and Nauta4, Reference Tsai, Hsu, Hsueh, Jou, Chen and Song7, Reference Sturm, Xiang and Pretl18] show measurement results and thereby suitable for comparison.
The proposed LNA in Table 2 are among those with the highest bandwidth and smallest chip area. In [Reference Machiels, Reynaert and Steyaert8, Reference Chirala, Guan, Huynh and Nguyen9] two wideband distributed LNAs are introduced. Especially [Reference Chirala, Guan, Huynh and Nguyen9] show a very good overall performance and even has a low -power enhancement. Nevertheless, it suffers from its high chip size. The core area for the chip with active inductors is the smallest, the size of the LNA with vertical inductors is comparable with [Reference Blaakmeer, Klumperink, Leenaerts and Nauta4]. The 1 dB-compression point of theses proposed LNAs is among the best in Table 2 making this design suitable for communication frontends with like quadrature amplitude modulation (QAM)-64. Small signal gain and noise figure compare well with the other works. In comparison, the power consumption is rather high, which is mainly due to the optimization requirements of moderate noise figure and gain. Additionally, a challenge for the design is the low intrinsic gain of this CMOS bulk technology, which can be more or less compensated by increasing the current. In general, it can be stated, that a broadband LNA in a very compact size, which is applicable for the use for different communication services, was designed. At the best of the authors knowledge these are the first compact LNAs in 28 nm CMOS for this frequency range and the smallest of the state-of-the-art.
IV. CONCLUSION
In this work, two different versions of LNA implemented in a 28 nm bulk CMOS technology are presented. Both versions include inductive peaking components, one with vertical inductors and the other with active inductors. Investigations toward transistor design are done by the g m/I D-method to challenge the parameter of highly scaled transistors. There is a good agreement between measurement and simulations. A NF of 4.2 dB for the LNA with active inductors and 3.5,dB for the LNA with vertical inductors at 5.2 GHz were measured. The voltage gain amounts to 12.8 and 13.4 dB, respectively, at a high 3 dB-bandwidth of 20 GHz.
Compared with the state-of-the-art of compact LNA up to 20 GHz these LNA are the ones with the smallest active area at a high bandwidth with moderate voltage gain and NF.
ACKNOWLEDGEMENTS
The authors gratefully acknowledge financial support from the German Federal Ministry of Education and Research within Eurostars, a joint program of EUREKA and the European Community under the project E!6969.
 Elena Sobotta was born in Waiblingen, Germany, in 1987. She received the Bachelor degree (B.Eng.) in Electrical Engineering in cooperation with Agilent Technologies from the Duale Hochschule Baden-Württemberg inStuttgart, Germany and her Master degree (M.Sc.) from the Technische Universität Dresden, Germany in 2009 and in 2013, respectively. In 2010. she has been Product Manager for RF inductors and LTCC components at Würth Elektronik eiSos in Waldenburg, Germany. Since 2013, she is working toward the Ph.D. degree at the Technische Universität Dresden, Germany. Her main research interests are analog circuits especially the design of multi-standard transceivers.
 Guido Belfiore received the B.Sc. and the M.Sc. degrees in Electrical Engineering from the University of l'Aquila, Italy, in 2009 and 2012, respectively. His thesis work was on interface circuit design for resistive sensors. In 2011, he participated in an exchange program at the University of Glasgow, Scotland, U.K., where he investigated the dry etch processes for high-k dielectric material layers. Since 2012, he has been with the Chair for Circuit Design and Network Theory of Technische Universität Dresden, Germany, where he is currently working toward the Ph.D. degree. His main research activities are in broadband high-speed analog driver IC design for optical components.
 Frank Ellinger was born in Friedrichshafen, Germany, in 1972. He received the Diploma degree in Electrical Engineering from the University of Ulm, Germany, in 1996, the M.B.A., Ph.D. degrees in Electrical Engineering, and the Habilitation degree in high-frequency circuit design from ETH Zürich, Switzerland, in 2001 and 2004, respectively. Since August 2006, he has been a Full Professor and the Head of the Chair for Circuit Design and Network Theory, Technische Universität Dresden, Germany. From 2001 to 2006, he was the Head of the RFIC Design Group, Electronics Laboratory, ETH Zürich (ETHZ), Zürich, Switzerland, and a Project Leader of the IBM/ETHZ Competence Center for Advanced Silicon Electronics hosted atIBM Research, Rüschlikon, Switzerland. He authored or coauthored more than 300 refereed scientific papers.