Implications
The calving interval (CI; i.e. period between two calvings for the same cow) of dairy cows influences both their milk production and the production factors (feed and animal care costs) required. Therefore, the CI can indirectly impact the revenue of the dairy breeders. The type of diet can influence this impact. This study tries to define objectives of CI for different diets to advice the dairy breeders to enhance their profitability.
Introduction
Calving is the trigger for milk production. With a gestation period of 9 months, a minimum postpartum period of 45 days and sexual cycles of about 21 days, a cow can approximately calve once a year (Craplet and Thibier, Reference Craplet and Thibier1973) but the economic optimum CI is a controversial subject. While some studies have shown a positive economic effect of longer CI (Arbel et al., Reference Arbel, Bigun, Ezra, Sturman and Hojman2001; Brocard et al., Reference Brocard, Portier, Francois, Tranvoiz and Brun2013), others have found a negative relationship (Schmidt, Reference Schmidt1989; Espinasse et al., Reference Espinasse, Le Lan and Deparcy1997; Pérez-Cabal and Alenda, Reference Pérez-Cabal and Alenda2003; Groenendaal et al., Reference Groenendaal, Galligan and Mulder2004; Laloux et al., Reference Laloux, Bastin and Devroede2009; Inchaisri et al., Reference Inchaisri, Jorritsma, Vos, van der Weijden and Hogeveen2011).
All these studies must be considered in their contexts of different countries, regions, systems of dairy production, management, levels of production, feeding systems, etc. The divergences can therefore be explained by these different sources of variation that can influence the indirect relationships between CI and economic results. Most of these studies moderate their conclusions as a function of different factors. Calving interval can indirectly impact economic results of a farm in various ways, as a function of the level of milk production, among other factors. Inchaisri et al. (Reference Inchaisri, Jorritsma, Vos, van der Weijden and Hogeveen2011) showed that a voluntary waiting period longer than 6 weeks could be profitable only for cows with low milk production. Conversely, Arbel et al. (Reference Arbel, Bigun, Ezra, Sturman and Hojman2001) demonstrated the relevance in increasing CI in a context of high lactating cows. Moreover, fertility can also be a source of variation. In a poor fertility scenario, extending the CI negatively impacts economic results more than in a normal fertility scenario (Esslemont et al., Reference Esslemont, Kossaibati and Allcock2001; Groenendaal et al., Reference Groenendaal, Galligan and Mulder2004; Inchaisri et al., Reference Inchaisri, Jorritsma, Vos, van der Weijden and Hogeveen2010). A high level of persistency makes a long CI profitable (Sørensen and Østergaard, Reference Sørensen and Østergaard2003; Rotz et al., Reference Rotz, Zartman and Crandall2005; Inchaisri et al., Reference Inchaisri, Jorritsma, Vos, van der Weijden and Hogeveen2011). With the same idea, as a primiparous cow is more persistent, the lactation number can also have an effect (Arbel et al., Reference Arbel, Bigun, Ezra, Sturman and Hojman2001; Osterman and Bertilsson, Reference Osterman and Bertilsson2003; De Vries, Reference De Vries2006; Inchaisri et al., Reference Inchaisri, Jorritsma, Vos, van der Weijden and Hogeveen2011). Therefore different sources of variation must be taken into account when studying the relationships between CI and economic results. As the feeding system has a lot of influence on the cited factors, such as milk production and persistency, one innovative aspect of this study is to observe the relationships between CI and economic results separately for different kinds of feeding systems. The method of studying the relationships between CI and economic results of a farm can also have an influence. The previous studies were often conducted at low scale or used simulation models, which showed some difficulties in representing the field reality. Therefore the second innovative aspect of this study is to conduct a large scale study using field data. From these field data, the aim of this study is to highlight the CI associated with the best economic results of the dairy breeders and to nuance this economic optimum in function of the feeding system.
Material and methods
All editing and statistical analyses were carried out using SAS software (version 9.4.; SAS Institute Inc., Cary, NC, USA).
Data
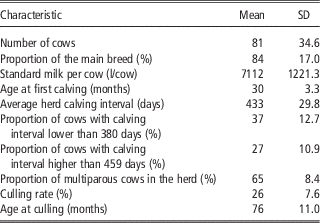
A total of 1832 accounting sheets collected from 2007 to 2014 and originating mostly from the Region Herbagère Liégeoise, a grassland area in the Walloon region of Belgium, were provided by the Walloon Breeding Association (Ciney, Belgium). This represented 390 herds, present from 1 to 7 times in the data set. Accounting sheets supply technical, typological and economic records. The average farm was described in Table 1. To avoid outliers of mean CI (mCI), only herds with mCI higher than 355 days and lower than 635 days were analysed (i.e. 7 herd×year observations deleted). 635 days corresponded to a maximum days-open of 355 days plus the pregnancy length (i.e. 280 days). To ensure representativeness of the mCI of the herd, observations were kept only if the proportion of cows that calved in the year of accounting was higher than 50%.
Average farm of the data set

Correction of the gross margin
The gross margin and its components are the preferred economic records in this study because, compared with the revenue, these traits do not take fixed costs into account (illustrated in Figures 1 and 2). The revenue information would disadvantage breeders who had recently made heavy investments. The value of milk production per cow was corrected to remove the effect of external factors on the milk price, such as the market, the organic status of the farm or the way of valorisation of the milk production. The corrected value of milk production per cow (cVMc) was calculated as follows:
 $$\eqalign { &{\rm Corrected}\,{\rm value}\,{\rm of}\,{\rm milk}\,{\rm production}\,{\rm per}\,{\rm cow\,{\equals}}\,\cr &{{{\rm Value}\,{\rm of}\,{\rm milk}\,{\rm production}\,{\rm per cow }} \over {{\rm Particular}\,{\rm price}\,{\rm for}\,{\rm 100}\,{\rm l}\,{\rm of}\,{\rm milk}}}{\rm {\times}Mean}\,{\rm price}\,{\rm for}\,{\rm 100 }\,{\rm l}\,{\rm of}\,{\rm milk}$$
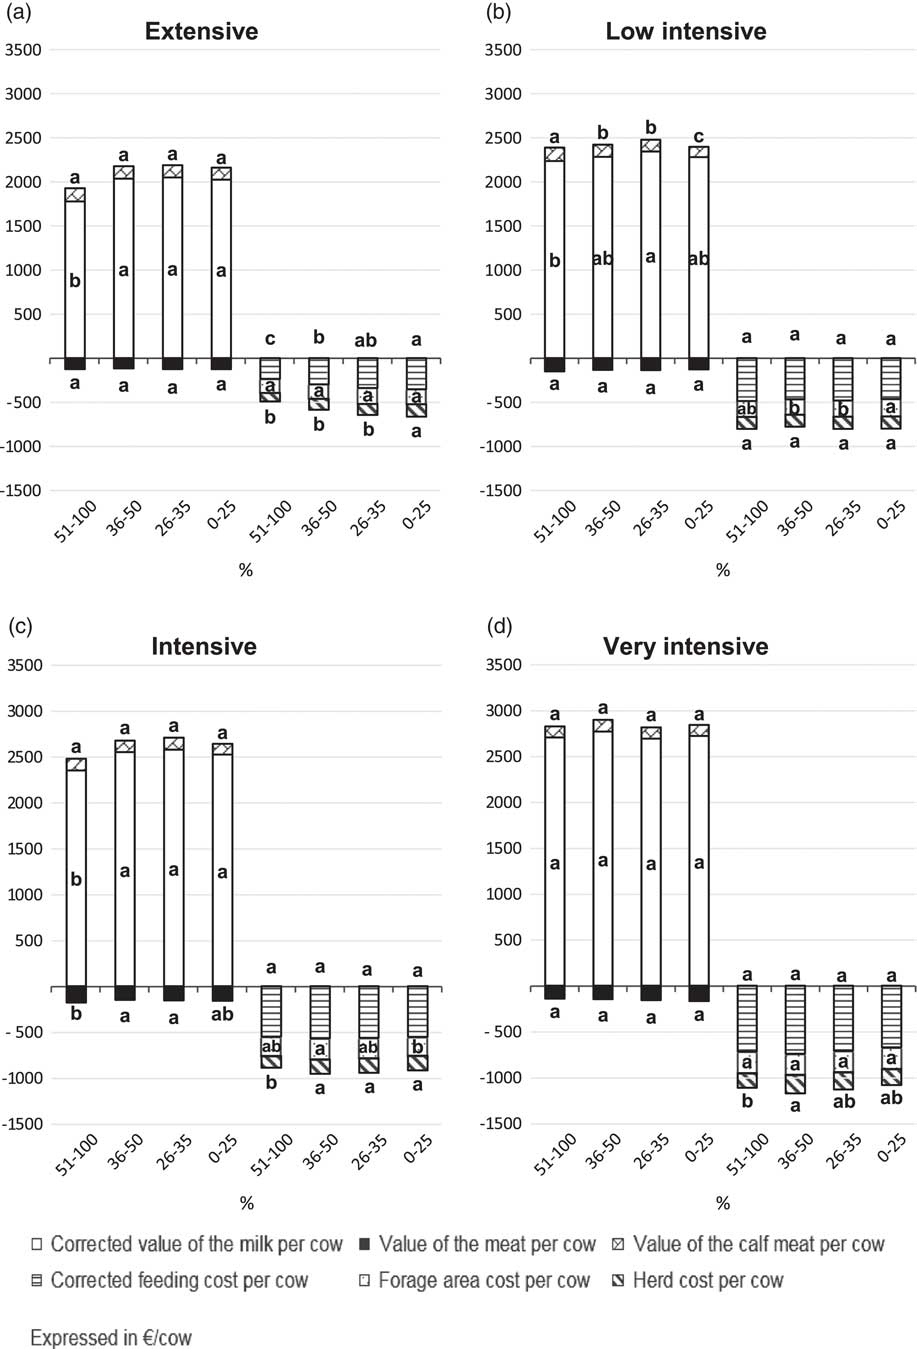
(a to d) Differences in the components of the corrected gross margin between proportions of dairy cows with a calving interval lower than 380 days within feeding groups. The classes of proportion of dairy cows with calving interval lower than 380 days are disposed in such a way that the calving interval increases along the x-axis. a,b,cMeans with the same superscript letter are not significantly different, means with different letters are significantly different (P<0.05). Significant differences denoted by letters are within-component of the corrected gross margin comparisons.

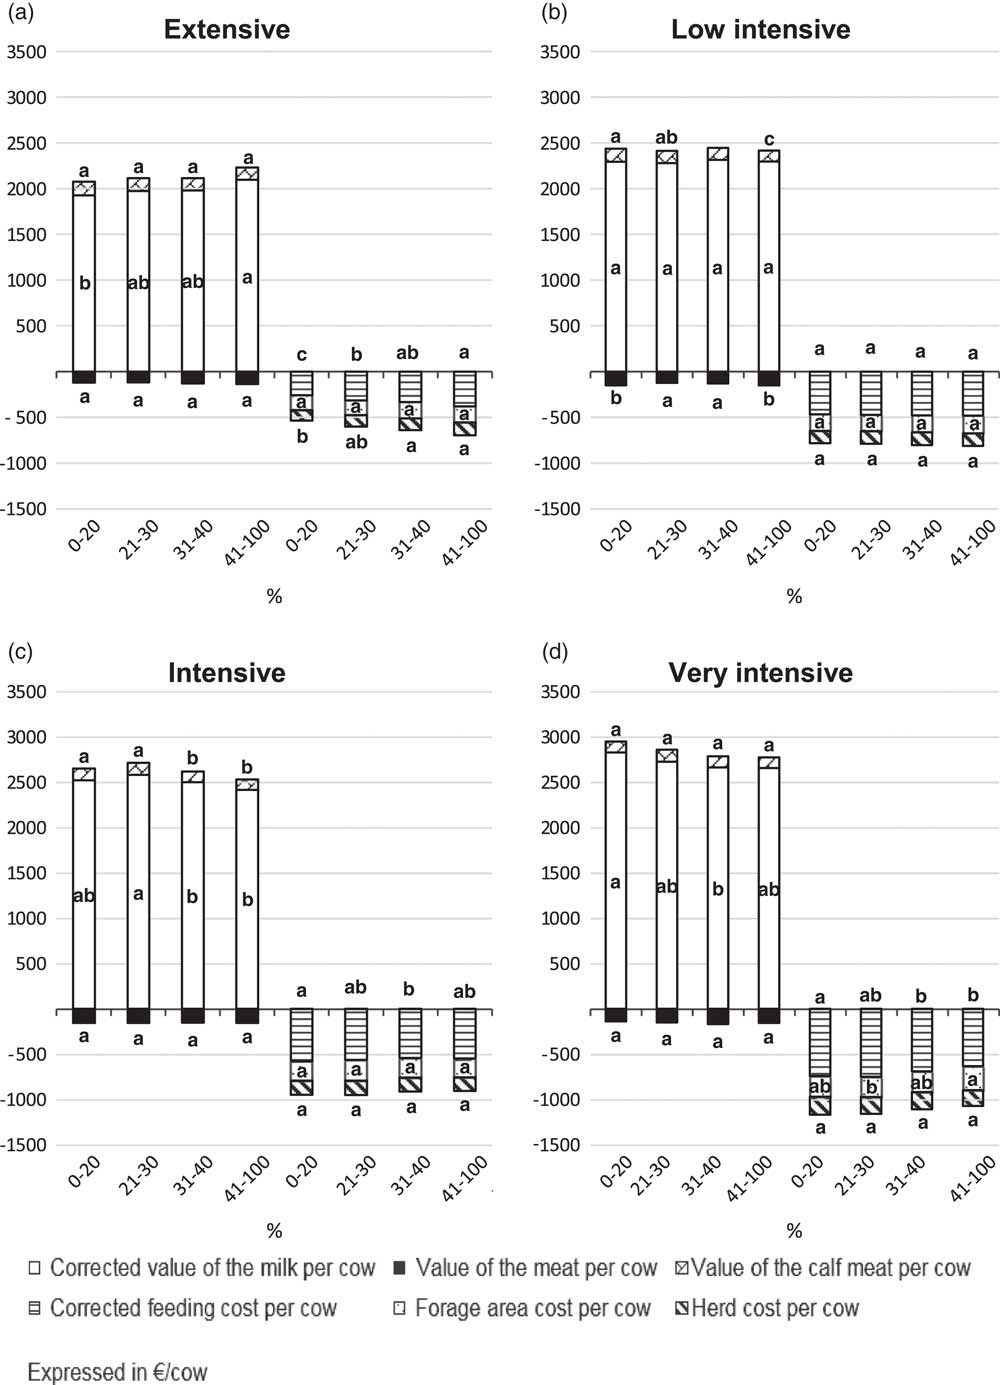
(a to d) Differences in the components of the corrected gross margin between proportions of dairy cows with calving interval higher than 459 days within feeding groups. The classes of proportion of dairy cows with calving interval higher than 459 days are disposed in such a way that the calving interval increases along the x-axis. a,b,cMeans with the same superscript letter are not significantly different, means with different letters are significantly different (P<0.05). Significant differences denoted by letters are within-component of the corrected gross margin comparisons.

For each year and herd the particular price for 100 l of milk was calculated as the mean of the price for each combination of year, month of start of the account, organic status of the farm and way of valorisation (i.e. dairy factory or farm valorisation) of the farm in the year. The mean price for 100 l of milk was the mean of all the prices of the studied herd×year accountings. The feeding cost per cow was corrected to remove variability in prices proposed by different animal feed companies. The corrected feeding cost per cow was calculated as follows:
 $$\eqalign { & {\rm Corrected}\,{\rm feeding}\,{\rm cost}\,{\rm per cow\,{\equals}}\,\cr &{{{\rm Feeding}\,{\rm cost}\,{\rm per}\,{\rm cow}} \over {{\rm Price}\,{\rm of}\,{\rm the}\,{\rm equivalent}\,{\rm concentrate}}} \cr&{\rm {\times}Mean}\,{\rm price}\,{\rm of}\,{\rm the}\,{\rm equivalent}\,{\rm concentrate}$$
An equivalent concentrate corresponds to 882 Voeder Eenheid Melk (VEM); 1000 VEM correspond to 6.9 MJ of net energy for lactation. The production of 1 kg of standard milk (4% fat and 3.4% protein) required about 442 VEM. The price of the equivalent concentrate is calculated by the Walloon Breeding Association and available in the accounting data used. The mean price of the equivalent concentrate was the mean of all prices of the equivalent concentrate of the studied herd×year accounting sheets.
Using the corrected value of milk production and feeding cost, the corrected gross margin per cow (cGMc) was calculated as follows:
 $$\eqalignno { & {\rm Corrected }\,{\rm gross }\,{\rm marg}\,{\rm in}\,{\rm per}\,{\rm cow} \,\cr & {\rm {\equals}\,Corrected}\,{\rm value}\,{\rm of}\,{\rm milk}\,{\rm production}\,{\rm per}\,{\rm cow} \cr & \quad {\rm {\plus} Value}\,{\rm of}\,{\rm meat}\,{\rm production}\,{\rm per}\,{\rm cow} \cr & \quad{\rm {\plus} Value}\,{\rm of}\,{\rm calf}\,{\rm meat}\,{\rm production}\,{\rm per}\,{\rm cow} \cr & \quad {\minus}{\rm (Corrected}\,{\rm feeding}\,{\rm costs}\,{\rm per}\,{\rm cow} \cr & \quad {\rm {\plus} Forage}\,{\rm area}\,{\rm costs}\,{\rm per}\,{\rm cow} \cr & \quad {\rm {\plus}Herd}\,{\rm costs}\,{\rm per}\,{\rm cow)} $$
The value of meat production per cow is the value of the exported meat (kg) (i.e. sold cows and dead cows) plus the variation of meat (kg) between the beginning and the end of inventory, minus the imported meat (kg) (new primiparous cows in the lactating herd and purchased cows). The value is generally negative.
Herd costs are variable costs including insemination, veterinarian, medicines, litter, etc., costs.
Relationship between calving interval and gross margin
The determination of the Pearson correlation coefficient illustrated the relationships between cGMc and its components on the one hand and the variables representing CI present in account data: proportion of cows with CI<380 days and proportion of cows with CI>459 days on the other hand. Only correlations with a P-value under 0.05 were considered significant. To study the relationship between cGMc and CI traits without assuming a linear relation between them, the proportion of cows with CI<380 days (between 356 and 379 days, i.e. approximately 1-year CI) and >459 days were divided into 4 levels: 0% to 25%, 26% to 35%, 36% to 50%, 51% to 100% (cl380) for the proportion of cows with CI<380 days, and 0% to 20%, 21% to 30%, 31% to 40%, 41% to 100% (cl459) for the proportion of cows with CI>459 days. Classes were defined to contain a minimum of 10% of observations. Corrected gross margin was modelled using these two ordinal categorical CI variables separately as fixed effects (i.e. four levels) using GLM running by PROC GLM procedure in SAS.
 $$\eqalignno{ & Y\,{\equals}\,{\rm cl}380{\plus}{\rm e} \cr & Y\,{\equals}\,{\rm cl}459{\plus}{\rm e} $$
where Y is the studied trait (cGMc).
Least square means were used for side-by-side comparisons of cGMc for the different levels of CI variables using the Tukey test. The CV (i.e. ratio of SD to mean) was estimated to quantify variability of the gross margin in each class.
Creation of herd×year observations groups with similar feeding typology
To study the relationships between cGMc and CI for herds with the same feeding system separately, groups of herds were defined regarding the feeding variables: quantity of equivalents concentrate per cow, area of grass per livestock unit (LU) and area of corn silage/LU. These characteristics were available as continuous variables. Accuracy errors can accompany field data collection. To avoid this, these variables were first transformed from quantitative to ordinal categorical variables by numerical classification, using the WARD method using PROC CLUSTER procedure in SAS. At each step the clustering with the lowest decrease of R 2, in comparison with the previous step, is chosen (Palm, Reference Palm1996). Data were previously standardised (i.e. 0 mean and SD equal to 1). The highest pseudo T 2 was used to fix the number of numerical classes kept for each variable (Palm, Reference Palm1996). Pseudo T 2 is the relation between the traces of the matrix of the sum of squares and the cross products deviations factorial and residual of the two groups which are going to be clustered. A multiple correspondence analysis (MCA) using PROC CORRESP procedure in SAS was then carried out on the three ordinal categorical variables created. A numerical classification was then applied to the coordinates of MCA.
Description of each feeding group and a study of relationships between economic results and calving interval in each group
To describe the feeding groups created, technical variables were modelled for each feeding group using GLM. Least squares means were used for side-by-side comparisons using the Tukey test. The level of significance of the difference between the least squares means was analysed using the P-value of the tests (level of significance: P<0.05).
 $$Y\,{\equals}\,{\rm feeding}\,{\rm group}{\plus}{\rm e}$$
where Y is the studied trait (feeding, production, management or economic information).
Per feeding group created, cGMc and its components were modelled using GLM including the two ordinal categorical CI variables separately as fixed effects (i.e. four levels). Least squares means and the level of significance between them were studied as previously.
 $$\eqalignno{ & Y\,{\equals}\,{\rm cl}380{\times}{\rm feeding \,\,group}{\plus}{\rm e} \cr & Y\,{\equals}\,{\rm cl}459{\times}{\rm feeding \,\,group}{\plus}{\rm e} $$
where Y is the studied trait (cGMc or its components).
Results
Relationships between calving interval and economic results
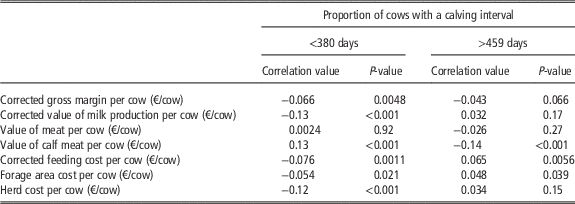
The linear correlations showed a downward trend of cGMc when the proportion of cows with CI<380 days or with CI>459 days increased, but the strength of the linear relations observed were low (Table 2). The study of the relationship between CI variables and the components of the gross margin showed that cVMc was significantly higher when the proportion of cows with CI<380 days decreased but for the proportion of cows with CI>459 days it was non-significant. All the studied costs, including the feed costs, showed the same tendency (Table 2).
Correlations between calving interval variables and corrected gross margin and its components in dairy cows

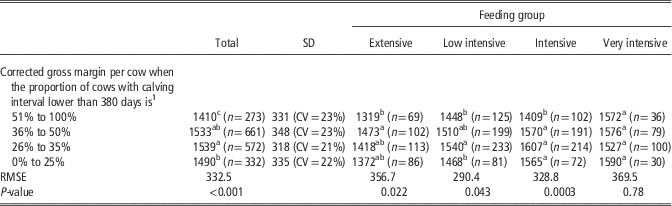
To avoid the assumption of a linear relation between cGMc and CI variables, cGMc was studied in function of CI levels. The global mean cGMc of all observations matched 1509 €/cow but cGMc varied as a function of CI distribution of the herd (Tables 3 and 4). Significant differences of cGMc were observed between the classes of proportions of cows with CI<380 days (cl<380), with the highest cGMc for the herds with this proportion ranging between 26% and 50% (Table 3). Corrected gross margin per cow decreased when this proportion was out of this range, and was the lowest when the proportion exceeded 50%. This last CI situation presented cGMc €129 lower than the highest cGMc observed (cGMccl<380 51% to 100% v. 26% to 35%=1410 v. 1539 €/cow). This means that the proportion of cows with CI<380 days could influence cGMc by almost 10%.
Differences in the corrected gross margin per dairy cow between proportions of cows with calving interval lower than 380 days and between proportions of cows with calving interval lower than 380 days within feeding groups

a,b,cMeans with the same superscript letter are not significantly different, means with different superscript letters are significantly different (P<0.05).
1 Significant differences denoted by letters are within-column comparisons.
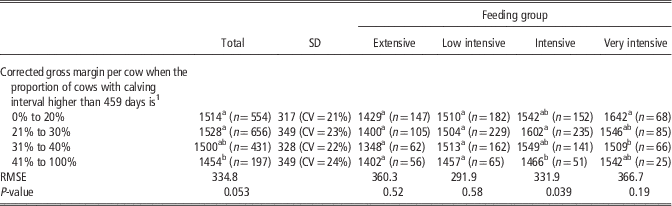
Nearly significantly different cGMc were observed between the classes of proportions of cows with CI>459 days (cl>459) (P=0.053, Table 4). Corrected gross margin per cow tended to decrease when the proportion of cows with CI>459 days exceeded 41% (Table 4; P cl>459 41% to 100% v. 0% to 20%=0.033; P cl>459 41% to 100% v. 21% to 30%=0.007; P cl>459 41% to 100% v. 31% to 40%=0.11), with a difference of €74 in comparison with the highest cGMc observed. High variability of cGMc was observed in each CI class, with a CV from 20% to 25% (Tables 3 and 4).
Differences in the corrected gross margin per dairy cow between proportions of cows with calving interval higher than 459 days and between proportions of cows with calving interval higher than 459 days within feeding groups

a,b,cMeans with the same superscript letter are not significantly different, means with different letters are significantly different (P<0.05).
1 Significant differences denoted by letters are within-column comparisons.
Description of the feeding groups
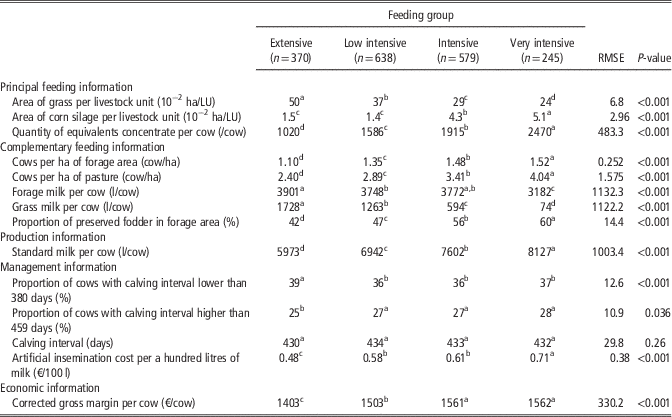
Four groups were defined from a Ward classification on the coordinates of MCA realised on the feeding variables: area of grass/LU, area of corn silage/LU, quantity of equivalents of concentrate/cow expressed as categorical variables. These four groups reflected successive feeding intensification levels of a herd, and were labelled extensive, low intensive, intensive and high intensive (Table 5). The herds included in the extensive feeding group had 50 ares of grass/LU, 1.49 ares of corn silage/LU and 1020 equivalents of concentrate/cow. Those in the very intensive group had half of the area of grass/LU, more than triple the corn silage/LU and double the quantity of equivalent concentrate/cow compared with herds in the extensive feeding group (Table 5). The number of cows per hectare of forage and of pasture increased for herds in the highest levels of feeding intensification. The milk produced from forage and grass decreased for herds with a high level of feeding intensification, whereas the proportion of preserved fodder in the forage area increased. More milk was produced per cow in the intensive feeding herds. Calving interval was constant between groups, although the artificial insemination cost increased significantly for herds with a higher level of feeding intensification. Compared to the other studied feeding groups, the extensive group was slightly different regarding CI composition with a higher proportion of cows with CI<380 days and a lower proportion of cows with CI>459 days.
Differences in feeding, production, management and economic information about dairy cows between the feeding groups

a,b,c,dMeans with the same superscript letter are not significantly different, means with different superscript letters are significantly different (P<0.05).
Economic optimum calving interval within feeding groups
It must be observed that the different feeding typology groups presented significantly different cGMc (Table 5). This trait increased with the level of intensification, with a difference of €159 between the extensive and very intensive feeding herds (Table 5). Within a feeding group, a significant variation of cGMc could also be observed between the different CI distributions in herds (Tables 3 and 4). The proportion of cows with CI<380 days seemed to influence cGMc more than the proportion of cows with CI>459 days (Tables 3 and 4).
Corrected gross margin per cow was related to the proportion of cows with CI>380 days for all the feeding groups, except for the very intensive herds. For the extensive, low intensive and intensive herds, cGMc tended to be the highest when between 26% and 51% of cows in the herd presented a CI<380 days. Indeed, cGMc was significantly lower when the proportion of cows with CI<380 days exceeded 51% (Table 3). As a function of the feeding group, an economic loss from €55 to €152 of cGMc was observed in this CI situation in comparison with the mean cGMc of the group. For the extensive and low intensive feeding herds, cGMc was significantly lower when the proportion of cows with CI<380 days decreased below 25% (Table 3).
Corrected gross margin per cow was not significantly different between the groups with a proportion of cows with CI>459 days for the extensive and low intensive feeding herds (Table 4).
For the intensive feeding herds, significantly different cGMc were observed, with the highest value occurring when the proportion of cows with CI>459 days was between 21% and 30% and the lowest value when this proportion exceeded 41% (Table 4). A difference of €136 was observed between these two values, almost 10% of the mean cGMc of the group. General linear model used to study cGMc as a function of the proportion of cows with CI>459 days for the very intensive herds showed no significant difference. A Tukey test to compare the means side-by-side highlighted a significant highest value of the cGMc for herds where the proportion of cows with a CI>459 days was lower than 20% in comparison with herds where this proportion was between 31% and 40% (Δ=€133, P=0.037).
Differences in the corrected gross margin between the calving interval groups explained by its components
For the extensive, low intensive and intensive groups a decomposition of cGMc indicated that the lowest cGMc observed when the proportion of cows with CI<380 days exceeded 51%, were due to a lower cVMc. For the very intensive groups for which no difference was found, cVMc was similar for each group of the proportion of cows with CI<380 days (Figure 1a until d). For the extensive group, a higher corrected feeding cost per cow was observed when the proportion of cows with CI<380 days was lower than 25% (Figure 1a). In this same CI situation, for the low intensive group a higher forage area cost per cow was observed (Figure 1b). These two higher costs led to a lowest cGMc in this CI distribution.
The extensive feeding herds showed a lower cVMc when the proportion of cows with CI>459 days was below 20% but the corrected feeding cost were lower too (Figure 2a), which resulted in an absence of variation of cGMc for this feeding group. For the low intensive feeding group, neither the value of cVMc, nor the corrected feeding cost varied between the groups of proportions of cows with CI>459 days (Figure 2b).
The significant differences of cGMc for the proportions of cows with CI>459 days obtained for the intensive and very intensive groups were mainly due to the cVMc component (Figure 2c and d). For neither case were the higher proportion groups clearly significantly different from the lower proportion groups but there was a tendency to this.
Discussion
Tables highlighted differences in economic results, in terms of gross margin, between herds with different proportions of cows with a CI<380 days or>459 days. This corresponded to the theory, defended for a long time by many authors, that CI and economic results of a herd are linked (Arbel et al., Reference Arbel, Bigun, Ezra, Sturman and Hojman2001; Groenendaal et al., Reference Groenendaal, Galligan and Mulder2004; Inchaisri et al., Reference Inchaisri, Jorritsma, Vos, van der Weijden and Hogeveen2011). But, in the present study, the results showed that the relationships between these two traits were not similar if they were studied separately for different levels of feeding intensification. Suffered or voluntary extending of the CI cannot be checked in this study. Whatever the nature of this longer CI, its existence permitted to observe its possible positive impact.
About the economic necessity of maintaining calving interval around 1 year
Except for the very intensive feeding herds, for who there was no difference at all between the groups of proportions, keeping most of the cows in a herd with CI around 1 year (i.e. <380 days in this study) seemed to not be profitable (Table 3). One explanation for this tendency could be that a near-1-year CI was not accompanied by as high milk production as for the other CI groups (Figure 1a to c). It would be of interest to not manage all cows with a CI<380 days to permit the best milk production. The negative impact of a short mean CI was also observed in the work of Durocher and Roy (Reference Durocher and Roy2008), using accounting data from milk producers of Quebec, Canada.
For the very intensive feeding herds, a decrease in the proportion of cows in a herd with CI around 1 year, suffered or voluntary, was not related to a variation of cVMc and therefore did not lead to an economic loss (Table 3, Figure 1d). This was also reported by several authors. Sørensen and Østergaard (Reference Sørensen and Østergaard2003) demonstrated with a simulation model that a postponed first insemination of 35 or 70 days in high yielding cows caused a decrease in herd profit of between only 1% and 4%. This loss could be counterbalanced by a reduction in labour thanks to a lower number of calvings or could disappear if the beef price diminishes. Arbel et al. (Reference Arbel, Bigun, Ezra, Sturman and Hojman2001) reported an experiment on high yielding cows. They compared the total net return, which is the difference between the value of the milk and meat production and the variable costs, and the net return per day for a group of cows with a mean CI of 464 days for primiparous cows and 436 days for multiparous cows to those of a control group with a short CI (i.e. 405 and 389 days for primiparous and multiparous cows). The total net return and the net return per day for the experimental groups were higher for the group with an extended CI than for the control group.
In the present study, for the extensive and low intensive feeding herds, an observed decrease in the proportion of cows in a herd with CI around 1 year <25% caused economic loss. For them, higher values of the feeding components were observed but were not accompanied by higher milk production (Figure 1a and b), which resulted in lower economic results compared with the higher proportions of short CI in the herd (Table 3). Less than 25% of cows with a near-1-year CI in the herd meant fewer starts of lactation per year in this herd. An assumption can be made that the feed efficiency is higher at the beginning of lactation. On the basis of data from an experiment conducted in Ireland, with a pasture-based diet, Prendiville et al. (Reference Prendiville, Pierce, Delaby and Buckley2011) found that feed efficiency tended to be the highest in early lactation and decreased throughout lactation.
About the economic interest to have a calving interval beyond 459 days
Table 4 showed that to have a longer CI for a certain proportion of cows in a herd caused an economic loss and a decrease in milk production only for the highest levels of intensive feeding herds. For this type of herd, a higher or lower proportion of cows with CI<380 days caused no economic loss (Table 3) but cows could not present a very long CI (i.e. exceeding 459 days) (Table 4). In contrast, when the feeding system was extensive, the proportion of cows in a herd with CI beyond 459 days would not have negative economic impact (Table 4).
Feeding system and the economic optimum calving interval
A first factor for CI economic optimum could be the feeding system. The intensive and very intensive breeders propose a richer ration (Table 5), or more total mixed rations (TMR) (Wyzen B., personal communication). Conversely, extensive and low intensive feeding herds are in a pasture-based system. An assumption can be made that the feeding system can influence the persistency of milk production. The persistency can be defined as the ability to maintain levels of production during lactation (Gengler, Reference Gengler1996), and persistency influences the economic optimum CI. This would explain that a longer CI caused no economic loss for the extensive feeding herds but well for the intensive feeding herds.
Feeding system and persistency
Numerous studies have listed the different factors for persistency, such as the feeding system. Grainger et al. (Reference Grainger, Auldist, O’Brien, Macmillan and Culley2009) found that fewer cows fed on a TMR diet were able to milk at 500 days in milk (DIM) than cows with a pasture-based diet with concentrate supplementation to reach 160 or 180 MJ of milk energy/cow. This difference became significant at 600 DIM. Delany et al. (Reference Delany, Macmillan, Grainger, Thomson, Blache, Nicholas and Auldist2010) compared two groups of Holstein Friesian cows in an extended lactation of 670 days, the first were fed TMR diet and the second a pasture-based diet with grain supplementation. All the cows in the second group were still milking at 612 days compared with only half of the TMR group. They observed that TMR diet tended to favour an enhancement of body condition scores, at the expense of milk production.
Physiological explanation
Kay et al. (Reference Kay, Phyn, Roche and Kolver2009) tried to explain this phenomenon through the evolution of plasma hormone and metabolite concentrations. In their study, three groups of cows in an extended lactation were fed on a pasture-based diet with 0, 3 or 6 kg of concentrate per day. For the richer diet (6 kg of concentrate) the glucose concentrations were higher due to a higher production of propionate produced following consumption of the concentrate. This glucose concentration induces a higher concentration of insulin, which tends to increase leptin concentrations. Leptin is consistent with a preferential deposition of energy towards the adipose tissues rather than milk production, and so produces a greater body condition score. A difference in persistency during extended lactation was not observed for cows in a pasture-based system with different levels of concentrates (Sorensen and Knight, Reference Sorensen and Knight2002; Kolver et al., Reference Kolver, Roche, Burke, Kay and Aspin2007; Williams et al., Reference Williams, Clarke, Hannah, Marett, Moate, Auldist and Wales2013). It seems that a significant difference appears when a diet is richer, when TMR and a pasture-based diet are opposed. A TMR diet could generate this phenomenon more than the pasture-based diet.
Persistency and the economic optimum calving interval
Other authors concluded that persistency is a factor to explain the success of a long CI. If the cow is persistent, a belated calving is profitable. Inchaisri et al. (Reference Inchaisri, Jorritsma, Vos, van der Weijden and Hogeveen2011) reported that a high persistency of the cow could make a voluntary waiting period of 10 weeks optimal. Němečková et al. (Reference Němečková, Stádník and Čítek2015) showed that if the persistency is high, the middle CI (i.e. 400 to 439 days) permits the highest average milk yield per day of CI. Rotz et al. (Reference Rotz, Zartman and Crandall2005) found in their farm model simulation that perennial cows (CI of 2 years) were more profitable than conventional CI cows if they were persistent. The potential influence of the feeding system on the economic optimum CI due to its impact on milk persistency was supported by several studies. Auldist et al. (Reference Auldist, O’Brien, Cole, Macmillan and Grainger2007) observed that cows on a pasture-based diet in Australia with annual production of 5000 to 6000 showed no decrease in annual yields of milk until 16 months of lactation and of milk solids until 19 months.
Level of production and the economic optimum calving interval
A second factor of the economic optimum CI could be the level of production, due to the feeding system or other factors, such as the genetic level of the herd or other management practices. The level of production was lowest in the extensive group and increased with the intensification of the feeding system (Table 5). An assumption could be made that a long CI is optimal only for a low level of production, observed in the most extensive feeding herds but not for high level production observed in the very intensive feeding herds. In 2011, Inchaisri et al. observed a similar opposition in their study where they concluded that a voluntary waiting period (i.e. time between parturition and the time at which the cow is first eligible for insemination) of 6 weeks was optimal, but a waiting period longer than 10 weeks could be optimal if the cows showed low milk production, among others.
It could be assumed that in the groups with high levels of production, more ‘peak of lactation’ cows are found which concentrate their lactation at the beginning of their lactation stage. Therefore a short CI is sufficient to catch the majority of the milk production. On the contrary, in the groups with low levels of production, more persistent cows are found and a longer CI is needed to benefit from the more dispersed milk production throughout the lactation. This assumption cannot be verified in this study but could be checked using the observations made within routine milk recording.
Paradox of the extensive and low intensive feeding herds
The last phenomenon that must be discussed is the fact that the extensive and low intensive feeding herds had cGMc that decreased when the proportion of cows with CI<380 days decreased to 0% to 25% (Table 3) but the increase in the proportion of cows in a herd with CI beyond 459 days caused no economic loss (Table 4). This contrast can be explained by the fact that the cows are not all genetically able to be persistent during an extended lactation, whatever the management procedures (Lehmann et al., Reference Lehmann, Fadel, Mogensen, Kristensen, Gaillard and Kebreab2016). Therefore, a proportion of cows can maintain a constant milk production during an extended CI higher than 459 days but some cows must not exceed a near-1-year CI. This is because certain cows must stay in a short CI management to restart milk production more frequently. The work is now to characterise the cows that can be persistent in certain conditions.
In conclusion, relationships between economic results and CI distribution in the herd were highlighted. These relationships differed as a function of the feeding system. Herds must keep an intermediate proportion of cows with a near-1-year CI, except for the very intensive breeders where economic results are similar for all the CI distributions. Herds can have a higher proportion of cows with CI>459 days beyond 20%, except in the very intensive herds where the best economic results are found when this proportion is lower. Different phenomena can explained these results, such as the feed efficiency, the milk persistency and its link with the feeding system.
Acknowledgements
The authors would like to thank the CAMI platform (Calcul et Modélisation Informatique) of the AGROBIOCHEM department for providing the computational resources.