Introduction
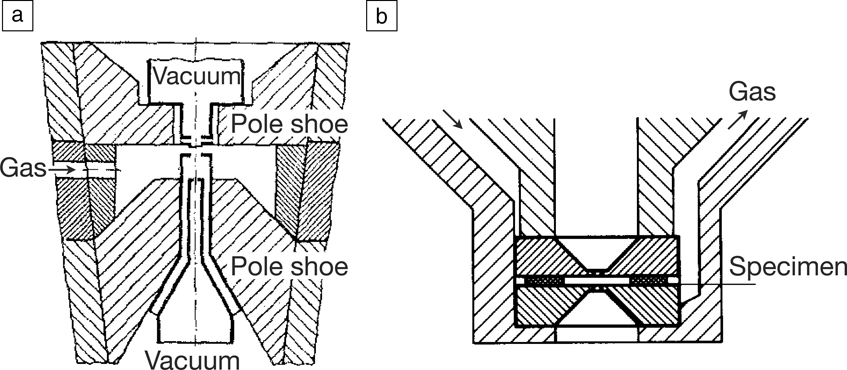
Transmission electron microscopy (TEM) is such a powerful technique for obtaining high-resolution spatial and chemical information about solid samples that it has always been tempting to apply it to liquid samples as well. During the past decade, this goal has been realized, and TEM of liquid samples has become a widely used microscopy method. Reference de Jonge and Ross1,Reference Ross2 Implementing TEM of liquid samples required overcoming two technological challenges. First, most liquids do not exhibit a sufficiently low vapor pressure to remain stable in the vacuum environment of the TEM. Second, it is necessary to control the physical location of the liquid to create a geometry compatible with TEM. Early pioneers of electron microscopy recognized these two issues in the 1940s. Reference Ruska3,Reference Abrams and McBain4 Their early work set the stage for two experimental strategies, which are referred to as open- and closed-cell (or chamber) approaches; these still form the basis of electron microscopy in liquids ( Figure 1 ). In open-cell microscopy, Reference Ruska3,Reference Danilatos and Robinson5 the pressure around the sample is controlled using differential pumping to maintain a vacuum in the rest of the system that is good enough to operate the microscope (Figure 1a). In closed-cell microscopy, Reference Abrams and McBain4,Reference Heide6 the liquid is enclosed between two closely spaced electron-transparent membranes (Figure 1b). By physically confining the liquid within a thin layer, imaging is possible in transmission mode through the windows and liquid.
Designs for closed- and open-liquid-cell transmission electron microscopy (TEM). (a) Transmission electron microscope with differentially pumped environmental chamber for imaging specimens at higher pressures. The specimen in a gaseous environment is separated from the high vacuum of the electron column via pump-limiting apertures. The apertures are placed on the pole pieces (labeled “pole shoe”) of the objective lens. (b) Environmental chamber enclosed by thin windows. Two aperture holders support thin films and are placed face to face in the upper pole piece of the objective lens. A thin film between the aperture holders serves as a spacer of about 5 μm thickness. (a) Reprinted with permission from Reference Reference Ruska3. © 1942 Springer. (b) Reprinted with permission from Reference Reference Heide6. © 1960 Springer.

Despite this impressive progress, electron microscopy of liquids did not become widely popular because of the engineering challenges involved. Closed cells used relatively thick windows (made, for example, of carbon) and thick liquid layers, so they generally did not provide a resolution that was much better than that of light microscopy. In open-cell TEM, it was difficult to control the liquid/vapor environment, and the analogous open-cell use of environmental scanning electron microscopy (ESEM) for studying liquids remained underappreciated because the lower beam energy (and other factors) prevented high-resolution imaging. Biologists turned to rapid freezing to prepare samples for imaging, while materials scientists found other problems to solve.
The use of electron microscopy for high-resolution and in situ investigations of liquids had to await advances in microfabrication to provide solutions to the technical challenges. In particular, for closed-cell electron microscopy, silicon nitride films supported on silicon microchips were found to act as robust, transparent windows that could withstand more than an atmosphere of pressure difference and could readily be produced in the required dimensions. Reference Williamson, Tromp, Vereecken, Hull and Ross7 Water can be placed Reference Franks, Morefield, Wen, Liao, Alvarado, Strano and Marsh8,Reference Zheng, Smith, Jun, Kisielowski, Dahmen and Alivisatos9 or flowed Reference de Jonge, Peckys, Kremers and Piston10,Reference Ring and de Jonge11 between two such windows for observation in the microscope. Additional microfabrication steps allow incorporation of electrodes Reference Williamson, Tromp, Vereecken, Hull and Ross7,Reference Unocic, Sacci, Brown, Veith, Dudney, More, Walden, Gardiner, Damiano and Nackashi12 in the liquid enclosure, increasing the functionality. Even thinner materials such as graphene can be used as windows, Reference Yuk, Park, Ercius, Kim, Hellebusch, Crommie, Lee, Zettl and Alivisatos13,Reference Wojcik, Hauser, Li, Moon and Xu14 although (at present) with a less well-controlled liquid geometry and functionality. For open-cell experiments, low-vapor-pressure liquids such as ionic liquids can be integrated within microfabricated or micromanipulator-based sample holders to enable a variety of in situ experiments. Reference Huang, Zhong, Wang, Sullivan, Xu, Zhang, Mao, Hudak, Liu, Subramanian, Fan, Qi, Kushima and Li15 Liquid samples have been studied with both TEM and scanning transmission electron microscopy (STEM). TEM can provide higher temporal resolution, while STEM provides excellent contrast for materials of high atomic number in liquids. STEM can be used in dedicated instruments, in combined TEM/STEM instruments, or as the detection mode through thin liquid samples in ESEM. Reference Bogner, Thollet, Basset, Jouneau and Gauthier16
In this article, we aim to indicate the current state, scope, and opportunities available with TEM and STEM of liquid samples by focusing on three applications. We first discuss the design of closed liquid cells (sometimes called liquid micro-chambers) for TEM, with a particular emphasis on electrochemical processes. We then describe open-cell (or open-chamber) experiments for low-vapor-pressure liquids, showing processes relevant to battery operation. We finally describe how to adapt liquid-phase electron microscopy to study biological materials in their native environment. Biological materials present an additional challenge related to sample thickness; for instance, mammalian cells can be several micrometers thick. We discuss STEM imaging of labeled proteins in thick water layers, as well as STEM detection in ESEM that allows similar imaging in a native environment.
Closed-cell TEM for electrochemical reactions
Electrochemical setup, beam effects, and resolution
Our interest in putting liquids in the TEM came about as a result of the excitement surrounding porous silicon after its optical emission properties were discovered in 1990. Reference Canham17 A liquid-phase (hydrofluoric acid) anodic etching process creates the porous network. To observe this process in situ, we attempted to etch a thin doped Si layer sandwiched between two undoped layers. Reference Ross, Searson, Bailey, Hennigar and Zaluzec18 Problems with this design led to the use of silicon nitride as a more reliable means to enclose a liquid, using a spacer layer to control liquid thickness and a glued vacuum seal. Reference Ross19 This simpler design enabled a more general type of experiment. In particular, electrochemical processes could be examined by incorporating electrodes within the liquid cell. The early cells, glued by hand and with low success rates, have now been superseded by improved designs with various functionalities now available commercially and from academic laboratories. Reference Ring and de Jonge11,Reference Unocic, Sacci, Brown, Veith, Dudney, More, Walden, Gardiner, Damiano and Nackashi12,Reference Grogan, Schneider, Ross and Bau20–Reference Creemer, Helveg, Hoveling, Ullmann, Molenbroek, Sarro and Zandbergen22
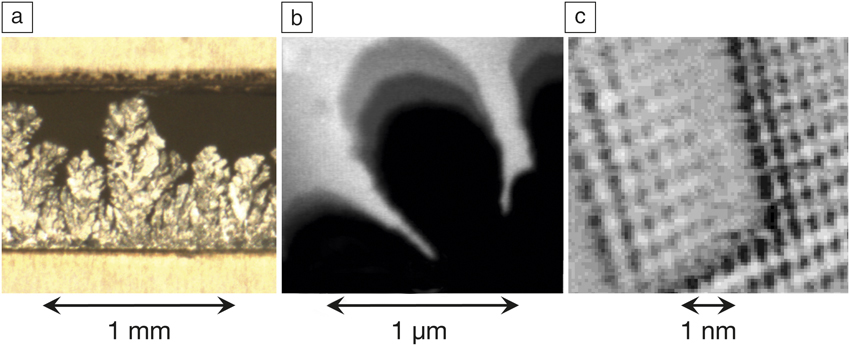
Closed-liquid-cell electron microscopy turns out to be well suited for electrochemical explorations, because it fills an important niche in terms of temporal and spatial resolution that is not addressed by other techniques. It occupies the gap between light microscopy, Reference Gallaway, Desai, Gaikwad, Corredor, Banerjee and Steingart23 which has good temporal resolution but limited spatial resolution, and scanning tunneling microscopy ( Figure 2 ). Scanning probe techniques can have remarkable resolution in liquids, Reference Magnussen, Zitzler, Gleich, Vogt and Behm24 but the frame rate is limited by the physical scan speed, and it is challenging to access rough liquid/solid interfaces.
Comparison of imaging techniques for electrochemistry indicating the available resolution. (a) Light microscopy: Deposition of Zn in alkaline electrolyte, from a video at 30 images per s. (b) Liquid-phase transmission electron microscopy: Progression of the growth front during potentiostatic Cu deposition from H2SO4/CuSO4. Three images from a video are superimposed showing the advancing growth front. Reference Grogan, Schneider, Ross and Bau20 (c) Scanning tunneling microscopy: Dynamic changes in the structure of the Cu(100) surface in 0.01M HCl at a voltage of –0.23 VSCE (where VSCE is the potential with respect to a saturated calomel electrode). One image is shown from a sequence recorded at 10 images per s during “collective” growth of a terrace segment several rows wide. (a) Reprinted with permission from Reference Reference Gallaway, Desai, Gaikwad, Corredor, Banerjee and Steingart23. © 2010 The Electrochemical Society. (c) Reprinted with permission from Reference Reference Magnussen, Zitzler, Gleich, Vogt and Behm24. © 2001 Elsevier.
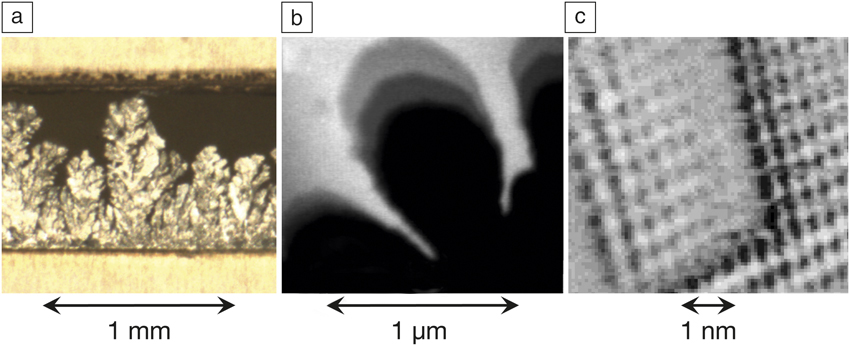
This leads us to consider the important question of what resolution we should expect from a closed-liquid-cell experiment. In TEM, thicker samples generally reduce the resolution due to multiple scattering and energy loss of the transmitted electrons. Reference de Jonge and Ross1 Resolution is improved by making both the liquid and the windows as thin as possible. However, too thin of a liquid layer may not support realistic physical phenomena. For electrochemical experiments in particular, where diffusion often dominates the process under study, a compromise must be made where the liquid is thick enough to allow the experiment to represent the “real life” process, yet thin enough to provide reasonable resolution.
A second consideration in liquid-cell electron microscopy—for all experiments, not just electrochemical investigations—is the effect of the electron beam. Reference Abellan, Woehl, Parent, Browning, Evans and Arslan25 Sample–beam interactions in TEM have been well studied for solid samples, but for liquids, we can use the literature from medical and reactor physics. The electron beam deposits energy that breaks bonds to create radiolytic species that then react to generate a cascade of other products. In water, a several hundred keV electron beam can produce strong effects at the high dose rates typical of TEM imaging. Reference Peckys, Veith, Joy and de Jonge26
Models for water radiolysis, adapted to apply to TEM, Reference Schneider, Norton, Mendel, Grogan, Ross and Bau27,Reference Grogan, Schneider, Ross and Bau28 show that radiolysis products quickly reach a steady-state concentration that depends on the dose rate, and can be rather different from the initial state of the sample. The pH can be changed by irradiation (generally becoming more acidic), radiolytic hydrogen can form bubbles, and radiolytic hydrated electrons, which are highly reactive electrons surrounded by a shell of water, can react with metal ions in solution to form solid particles within the irradiated area. Because of the sensitivity of electrochemical processes to solution chemistry, beam effects must be modeled, and low-dose imaging and efficient detectors are important.
Examples in electrochemistry
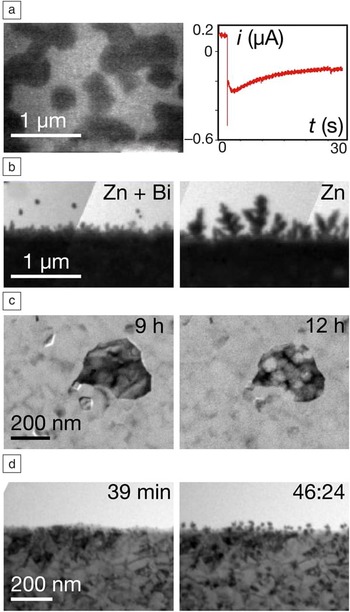
Closed-liquid-cell TEM can address a variety of electrochemical questions, with Figure 3 illustrating a few of the possibilities. The deposition of copper from an acidified copper sulfate solution is shown in Figure 3a. This process is used in the microelectronics industry to form metallic interconnects, and details of nucleation and grain structure are important in optimizing the results. To image nucleation, we use a liquid cell with electrodes that are electron transparent and also polycrystalline (making them somewhat more relevant to the industrial substrates). Reference Williamson, Tromp, Vereecken, Hull and Ross7,Reference Ross19 The single image shown in Figure 3a is taken from a set of movies recorded under constant potential. Reference Radisic, Vereecken, Hannon, Searson and Ross29 Nucleation, growth, crystal shape, and coalescence are visible as a function of time.
Electrochemical processes imaged using a closed-liquid cell in transmission electron microscopy. (a) Bright-field image from a movie obtained during potentiostatic deposition of Cu islands (dark features) on polycrystalline Au (background), and the complete current (i) versus time (t) for the movie. The electrolyte is 0.1 M CuSO4 + 0.18 M H2SO4, and deposition took place at a constant potential of –70 mV with respect to a Cu reference electrode. Reference Radisic, Vereecken, Hannon, Searson and Ross29 (b) Growth instabilities forming during galvanostatic deposition of Zn onto polycrystalline Au. In a pulsed mode, 40 nA was applied (10 s on, 10 s off for 20 cycles). The electrolyte is 0.5 M ZnSO4 + 0.1 M H2SO4 for both images, but with the addition of 0.25 mM Bi2O3 in the left-hand image. The Bi does not suppress dendrites, but it delays their development by favoring Zn growth between the asperities. (c) Formation of intragranular pits in a coarse-grained Al film after exposure to distilled water in a closed-liquid cell for the times indicated. Reference Chee, Ross, Duquette and Hull33 (d) Galvanic displacement of Ni by Pd. The right-hand image shows Pd nanostructures (dark features) that formed after flow of 0.18 M H2SO4 + 0.025 M PdSO4.

We simultaneously recorded the current flowing through the liquid cell at each time (see the graph in Figure 3a) and correlated this electrochemical signature with the movie. Such information is helpful in developing models of nucleation and growth, especially as compared to standard analysis where the surface is imaged only ex situ after deposition is complete or at fixed times after interrupting growth. The data in Figure 3a were used to identify different pathways by which atoms arrive at the growing nuclei. Reference Radisic, Vereecken, Hannon, Searson and Ross29,Reference Radisic, Vereecken, Searson and Ross30
Once the surface is covered with metal, it is still possible to track deposition by imaging the edge of the electrode as the growth front propagates into the liquid. An example is shown in Figure 3b for the growth of zinc. Reference Park, Steingart, Schneider, Kodambaka and Ross31 The growth front has developed an irregular, dendritic appearance. Analysis of the growth front evolution can be carried out over a range of conditions, measuring for example, roughness, local deposition rate, and spatial correlations. This provides the opportunity to examine the physical phenomena that determine growth front stability. Analysis based on fitting classical models for growth front dynamics, such as kinetic roughening and diffusion limited models, can help in understanding what triggers the growth front to become unstable.
Growth front stability is important in battery charge/discharge cycling, where formation of the type of structure shown in Figure 3b could potentially short out the battery. Reference Tarascon and Armand32 For zinc-based batteries, which otherwise have many environmental and cost benefits, dendrite formation is a particular problem, reducing cycle life. Reference Gallaway, Desai, Gaikwad, Corredor, Banerjee and Steingart23 Liquid-cell TEM allows us to evaluate strategies that have been developed to maintain growth-front planarity, such as the use of additives and pulse plating. As an example, the two images in Figure 3b compare similar growth with and without the presence of an inorganic additive, Bi2O3. The additive does not suppress instabilities, but delays their onset (Figure 3b, left). Reference Park, Steingart, Schneider, Kodambaka and Ross31 It would allow a slightly faster charge rate for a battery—if we first complete the important work of showing that this result also applies to much larger practical systems.
Another electrochemical example where liquid-cell microscopy can be helpful is corrosion. This hugely important problem starts at small features—pinholes, grain boundaries, crevices—making corrosion challenging to analyze using spatially averaged techniques. The images in Figure 3c are from an Al thin film exposed to water in the liquid cell and imaged every few hours. Reference Chee, Ross, Duquette and Hull33 Intragranular pit formation is followed by the formation of voids beneath the passivating oxide layer. The possibilities are exciting, especially if combined with compositional measurements. Reference Zaluzec, Burke, Haigh and Kulzick34
Figure 3d shows a related example of the process of galvanic displacement. A solution containing palladium ions is flowed over a nickel surface, and Pd is deposited as the “less noble” metal as Ni goes into solution. Liquid-cell TEM provides a good way to access the microstructural details of this type of process. Reference Sutter, Jungjohann, Bliznakov, Courty, Maisonhaute, Tenney and Sutter35 Here, Pd is seen in the second image to deposit in the form of nanoparticles, creating a nanostructured Pd/Ni surface that has useful catalytic properties, for example, for subsequent electroless deposition of magnetic materials.
These examples illustrate some of the electrochemical processes that are accessible with closed-liquid-cell TEM. The key benefit is the combination of electrochemical measurements with structural information obtained with a temporal and spatial resolution that cannot be achieved using other techniques. The challenge in using the results to refine electrochemical models is to relate the liquid-cell data to the larger-scale process. We need to control the experimental geometry, compare with ex situ data, and understand and model the sample–beam interactions and liquid flow patterns.
With careful quantification, and continuing improvements in the closed-cell experimental technique, we anticipate exciting opportunities involving heating, cooling, different electrode geometries and materials, and well-controlled liquid flow. Advanced electron microscopy techniques including high-speed image acquisition, analytical microscopy, aberration-corrected microscopy, and correlative microscopy, which we discuss next in the context of biological materials, will extend the reach of these in situ investigations even further.
Open-cell electrochemical TEM studies of rechargeable battery processes
The fundamental concept of open-cell TEM
Energy storage systems such as rechargeable batteries include multiple components, and these components are closely integrated to allow concordant ionic and electronic transport during functioning. Reference Tarascon and Armand32 Cyclic charging and discharging of a battery causes structural and chemical evolution of the cathode, anode, electrolyte, and the interfaces between the liquid electrolyte and electrode. It is this evolution of the battery components that, in most cases, directly contributes to capacity fading and the eventual failure of the battery. Designing and discovering new or improved materials for batteries therefore critically relies on a fundamental understanding and direct correlation between structural and chemical evolution and performance. Electron microscopy and spectroscopy in ex situ mode is one of the most powerful tools to probe the relevant characteristics of battery materials, comparing microstructural features before and after cycling to yield insights into the relationship between microstructure and battery failure. However, the dynamic nature of cycling and the continuous evolution of the battery components mean that ex situ microscopy cannot answer key questions regarding the timing and mechanism of structural and chemical evolution. Direct observation under dynamic operating conditions is preferable.
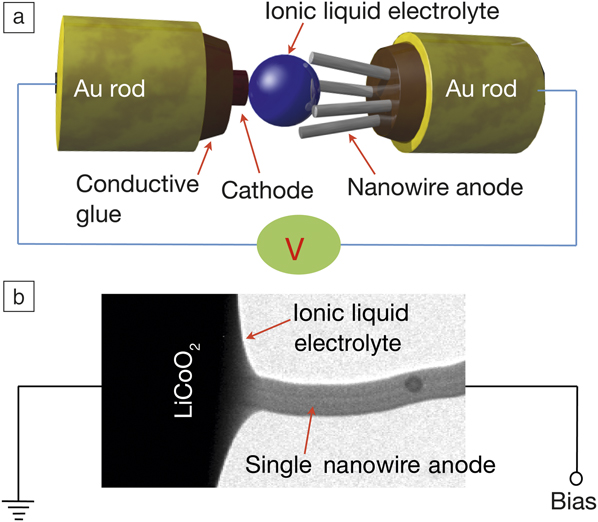
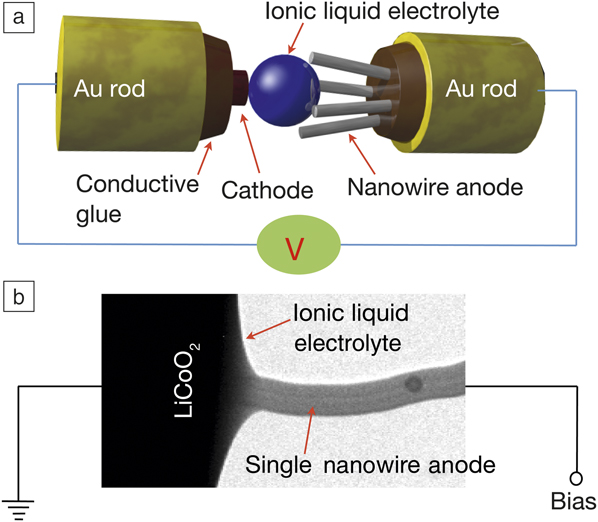
The development of open-cell TEM techniques has therefore been a major advance for TEM studies of rechargeable batteries. Reference Huang, Zhong, Wang, Sullivan, Xu, Zhang, Mao, Hudak, Liu, Subramanian, Fan, Qi, Kushima and Li15,Reference Wang, Xu, Liu, Choi, Arey, Saraf, Zhang, Yang, Thevuthasan, Baer and Salmon36 Open cells can be used because electrolytes based on ionic liquids with low-vapor pressure can be loaded directly into the TEM vacuum and imaged without the need for windows. At the same time, to make the battery small enough to fit into the TEM, a single nanowire can be used to form the observable electrode. The arrangement of such a nanobattery is schematically illustrated in Figure 4a. Reference Wang37 Here we show SnO2 for the anode and LiCoO2 for the cathode; the electrolyte is 10% lithium bis(trifluoromethanesulfonyl)imide (LiTFSI) dissolved in a hydrophobic ionic liquid, 1-butyl-1-methylpyrrolidium (P14) TFSI (P14TFSI). This electrolyte wets the nanowire surface to form a conformal coating (Figure 4b), which is equivalent to immersion of the electrode material in the electrolyte. In this sense, the open-cell nanobattery configuration can mimic the processes that occur in a real battery. A variation of the open-cell configuration is achieved by using lithium oxide as a solid electrolyte. Reference Liu and Huang38,Reference Wang, Yu, Chen, Wu, Pereira, Thornton, Van der Ven, Zhu, Amatucci and Graetz39
Open-cell transmission electron microscope (TEM) used to examine operation of a nanobattery formed using an ionic liquid as the electrolyte and a 100 nm diameter nanowire as the anode. Reference Wang37 (a) Schematic drawing showing the experimental configuration. (b) Typical TEM image of the anode of a working nanobattery visualized during cycling.
Although the open-cell nanobattery works well for direct observation of electrode material evolution, we find some deficiencies if we compare it with real batteries. These include modification of kinetics (Li-ion transport and electrode response to ion motion) and the lack of a solid-electrolyte interphase layer. Closed cells allow use of electrolytes that are closer to real battery operation, mitigating the previously discussed shortcomings, but the presence of the windows lowers the resolution. A combination of open- and closed-cell TEM is the best way to achieve an accurate understanding of the operation of these complex materials systems.
Direct observations of lithiation-induced structural and chemical evolution
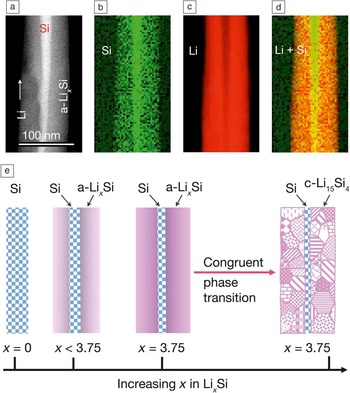
The open-cell configuration has provided a wealth of information regarding the behavior of metal ions such as Li, Na, and Ca in electrode materials during charge/discharge cycles, Reference He, Gu, Xiao, Luo, Shao, Gao, Du, Mao and Wang40 directly revealing structural and morphological evolution in anode materials such as Si, Ge, Al2O3, SnO2, ZnO, Sn, graphene, and carbon nanotubes. The lithiation behavior of Si illustrates the complexity of these reactions, as it features lithiation-induced solid-state amorphization, anisotropic volume expansion, a two-phase reaction process, a self-regulated lithiation rate due to stress generation, a phase transition of amorphous Li x Si to Li15Si4 at a critical composition x, and a critical size for fracture of the Si particles. Reference Gu, Wang, Connell, Perea, Lauhon, Gao and Wang41 The lithiation of a silicon nanowire is schematically illustrated in Figure 5 .
Lithiation process studied with scanning transmission electron microscopy (STEM). (a) STEM annular dark-field image of a Si nanowire anode. Electron energy-loss spectroscopy maps of elemental distribution, (b) Si, (c) Li, and (d) superimposed Li and Si, revealing the core–shell lithiation of the silicon nanowire. (e) Schematic of the silicon nanowire lithiation process and the spontaneous congruent phase transition of amorphous a-Li x Si to crystalline c-Li15Si4 when x reaches the critical value of 3.75 in the amorphous phase. Reference Gu, Wang, Connell, Perea, Lauhon, Gao and Wang41

To illustrate the power of open-cell TEM, consider one stage of this process, the phase transition of amorphous Li x Si (a-Li x Si) to crystalline (c-) Li15Si4. A variety of in situ and ex situ spectroscopy measurements have shown that lithiated a-Li x Si crystallizes instantaneously to either Li15Si4 or Li22Si5. Reference Hatchard and Dahn42 In situ S/TEM provided a detailed atomistic mechanism for this phase transition, revealing that a-Li x Si transforms to c-Li15Si4 when x reaches a critical value of 3.75, and this phase transition occurs via a congruent process that leads to neither phase segregation nor formation of a residual phase (Figure 5). Reference Gu, Wang, Connell, Perea, Lauhon, Gao and Wang41 The congruent phase transformation process does not involve long-range diffusion of the chemical species, only local atomic rearrangement, in contrast to general nucleation and growth processes in which local chemical composition fluctuations lead to phase separation. In situ TEM imaging, with its resolution and compositional capability, is a powerful approach for understanding and optimizing the reactions taking place during battery operation.
Liquid-phase STEM for studying membrane proteins in whole mammalian cells
Principles of studying membrane proteins
Liquid-phase electron microscopy has great potential for the study of membrane proteins in mammalian cells. Reference de Jonge, Peckys, Kremers and Piston10,Reference Kinoshita, Mori, Hirano, Sugimoto, Okuda, Matsumoto, Namiki, Ebihara, Kawata, Nishiyama, Sato, Suga, Higashiyama, Sonomoto, Mizunoe, Nishihara and Sato43–Reference Nishiyama, Suga, Ogura, Maruyama, Koizumi, Mio, Kitamura and Sato47 Membrane proteins (receptors) in the plasma membrane of the cell respond to the presence of small proteins, specifically binding to the receptor (so-called ligands), and then decide what action the cell should take, for example, cell growth. But despite the fact that membrane proteins represent almost one-third of all cellular proteins and two-thirds of current drug targets, many factors governing their function are still unknown.
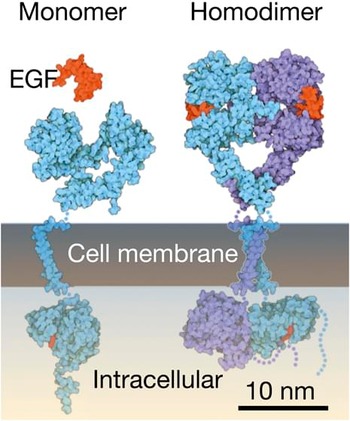
An example of a membrane protein is the epidermal growth factor receptor (EGFR) ( Figure 6 ). 48 This receptor becomes activated upon binding of its ligand (EGF) and then forms a protein complex together with another activated EGFR. This dimerization is followed by a conformational change of the intracellular part of the dimer, which triggers a signal cascade eventually leading to cell growth. To find out exactly what happens at the cell membrane once EGF is present, one would be interested in knowing, for example, in which cellular region or in which cells dimerization takes place, or under which chemical conditions and at which time points. But no one has observed individual proteins in the intact cell. Most of our knowledge about these proteins has been obtained from indirect biochemical methods where material from thousands of cells is pooled, and cell heterogeneity is thus not taken into account. Reference Peckys, Korf and de Jonge46
Side view of the HER1 dimer in the plasma membrane. Left: Non-activated HER1 monomer and unbound ligand epidermal growth factor (EGF). Right: Activated HER1 dimer with bound EGF ligand. 48

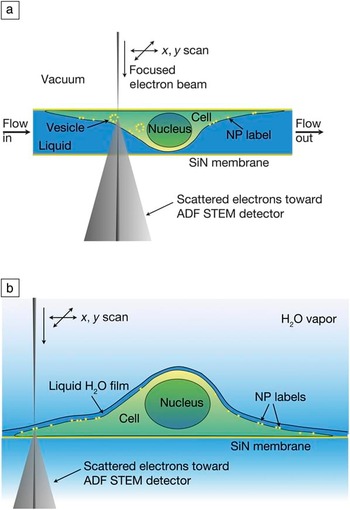
To study membrane proteins with liquid-phase STEM, mammalian cells in liquid are enclosed between thin and electron transparent silicon nitride windows separating the sample from the vacuum of the electron microscope ( Figure 7a). In order to obtain contrast through water and cell material that is several micrometers in thickness, nanoparticles of a material of high density and atomic number (Z) such as gold or fluorescent quantum dots (QDs) are used as specific protein labels. Since the labels may influence the proteins, extensive control experiments are needed. The atomic number contrast in STEM imaging allows these nanoparticles to be detected above the background signal produced by the thick layer of low-Z material. Reference de Jonge, Peckys, Kremers and Piston10,Reference de Jonge, Poirier-Demers, Demers, Peckys and Drouin49
Principles of liquid-phase scanning transmission electron microscopy (STEM) for whole cells. The cell is grown on a supporting silicon nitride (SiN) thin film. Proteins labeled with nanoparticles (NPs) reside in the plasma membrane. As the focused electron beam scans over the cell, the transmitted electrons are recorded using a STEM detector beneath the sample. (a) The cell is fully enclosed in a microfluidic chamber with two windows. (b) The cell is maintained in an atmosphere of saturated water vapor, while a thin layer of cooled water covers the cell, allowing STEM imaging in an environmental scanning electron microscope. Reference Peckys and de Jonge45 Note: ADF, annular dark field.

It is not always necessary to enclose the cells fully in liquid in a microfluidic chamber. For many studies, it is sufficient to obtain information from the thin outer regions of the cells, and those can be imaged with high resolution using ESEM with a STEM detector (Figure 7b). Reference Bogner, Thollet, Basset, Jouneau and Gauthier16,Reference Peckys, Baudoin, Eder, Werner and de Jonge50 ESEM works for thinner samples than standard TEM/STEM because of the lower electron-beam energy (30 keV versus 200 keV), but the same principle of Z-contrast applies using the STEM detector in ESEM. Cells in water are kept at 3°C in a sample stage equipped with a Peltier cooling element, and the vacuum level in the specimen chamber is carefully adjusted to around 740 Pa to maintain a thin liquid layer on the sample. Imaging is accomplished with an electron dose below the damage threshold. Reference Hermannsdörfer, Tinnemann, Peckys and de Jonge51
For many biological experiments, it is highly desirable to examine not just a randomly selected cellular region, but rather to navigate through many cells and select regions of interest. For this reason, correlative light microscopy and liquid-phase STEM are powerful tools, Reference Dukes, Peckys and de Jonge52 especially since the microchip with cells presents a simple platform for transferring a sample between the two microscopes.
Research on HER2 in breast cancer cells
As an example of the capabilities of liquid-phase STEM, we describe results obtained for HER2 receptors in breast cancer cells. Reference Peckys, Korf and de Jonge46 This receptor of the EGFR family is special because it does not need a ligand to become active; it is an orphan receptor. As a consequence, this protein can trigger cell growth without being controlled by an external signal. This can lead to dysregulation of cell growth in the tumor type that overexpresses HER2. Reference Brennan, Kumagai, Berezov, Murali and Greene53 Particularly problematic is that drug resistance develops in many patients, Reference Vu and Claret54 with an origin that is not fully understood.
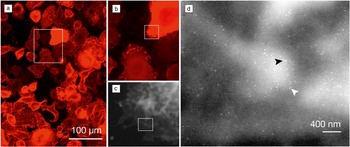
Figure 8a shows an overview fluorescence image of QD-labeled HER2 in breast cancer cells. These cells differ from each other in morphology and HER2 membrane concentration. The fluorescence and STEM images of a region of interest are shown in Figure 8b–c. The QD labels become visible at higher magnification (Figure 8d). The high spatial resolution of 3 nm allows measurement of the individual positions of all labeled HER2 proteins. The HER2 distances were statistically analyzed and it was found that an interlabel distance of 20 nm occurred more frequently than expected at random. Since the expected center-to-center label distance of two labels attached to a HER2 homodimer amounts to 20 nm, it was deduced that HER2 was present as a homodimer. Reference Peckys, Korf and de Jonge46 It was thus possible to quantify the stoichiometry of the HER2 complexes, distinguishing between monomers, dimers, and higher-order clusters, and resolving this information per cellular region.
Correlative light and electron microscope overview images of quantum dot-labeled HER2 proteins in SKBR3 human breast cancer cells. (a) Fluorescence overview image showing several dozens of cells. (b) Fluorescence image of the cells within the boxed area in (a). (c) Liquid-phase scanning transmission electron microscope (STEM) image of the boxed region in (b) recorded at 15,000× magnification using environmental scanning electron microscopy. (d) STEM image recorded in the boxed region shown in (c) at 75,000× magnification. The localization of individual HER2 receptors is visible as the bright, bullet-shaped labels. The brighter background represents membrane ruffles. Many pairs (homodimers) are visible; two are indicated with arrowheads. Reference Peckys, Korf and de Jonge46

A key finding was the discovery of a small (few percent of the total of cells) sub-population of cells with a different phenotype compared to the average cell. Reference Peckys, Korf and de Jonge46 This group of cells was characterized by a flat cytoplasmic border and was identified as resting cells. HER2 homodimers were found to be absent from this subpopulation of cells, even though the membrane concentration of HER2 was similar to that of the majority of cancer cells. We hypothesize that this sub-population of cancer cells plays a critical role in the development of drug resistance because these small sub-populations of cells could possibly respond differently or not at all to the drugs, while they would remain undetected using biochemical methods or conventional microscopy techniques. This example demonstrates both the need for single-cell studies to address cancer cell heterogeneity, and the unique capabilities of liquid phase STEM.
Conclusions
TEM and STEM of liquid samples has developed into a widely used analytical microscopy technique in which nanoscale spatial resolution and video-rate temporal resolution are readily obtained using modern electron microscopes and sample holder systems. The technique has already provided unique scientific information in areas that include electrochemical processes, battery materials evolution and biological materials such as membrane proteins in cells, as well as topics not discussed here such as solution-based materials synthesis and biomineralization. Of particular importance for electrochemistry is the ability to observe materials changes at the nanoscale while controlling and correlating with electrical potentials and current flow. For biological studies, the key advantage is the few-nanometer resolution for imaging intact cells in a hydrated state.
The solid/liquid interface is centrally important in a wide class of scientific and technological problems. The development of new generations of electrical energy-storage systems relies on a fundamental understanding of mass and charge transport across the solid/liquid interface. Materials synthesis Reference Zheng, Smith, Jun, Kisielowski, Dahmen and Alivisatos9 and particle dynamics in liquids, Reference White, Singer, Augustyn, Hubbard, Mecklenburg, Dunn and Regan55,Reference Alloyeau, Dachraoui, Javed, Belkahla, Wang, Lecoq, Ammar, Ersen, Wisnet, Gazeau and Ricolleau56 surface functionalization, self-assembly, biomineralization Reference Smeets, Cho, Kempen, Sommerdijk and De Yoreo57 and geological phenomena, and liquid-mediated environmental remediation are among the processes that indispensably depend on liquid/solid interfaces and require direct probing of phenomena in liquid. Single-cell studies of biological function Reference Woehl, Kashyap, Firlar, Perez-Gonzalez, Faivre, Trubitsyn, Bazylinski and Prozorov58 and biological macromolecules Reference Dukes, Thomas, Damiano, Klein, Balasubramaniam, Kayandan, Riffle, Davis, McDonald and Kelly59 require imaging through liquid with good spatial resolution and minimal damage from the probing beam. Accomplishing these and other research tasks places stringent requirements on resolution and dose effects, and requires input from other techniques that provide complementary information. Electron microscopy of liquids is continuously improving in this regard, and has a promising future in addressing a broad variety of interesting problems.
Acknowledgments
F.M.R. acknowledges R.M. Tromp, A.W. Ellis, and M.C. Reuter for their collaborations during the development of the closed liquid cell. N.J. is grateful to D.B. Peckys for biological research and discussions, E. Arzt for his support through INM, and the Leibniz Association. C.M.W. acknowledges the support of the Assistant Secretary for Energy Efficiency and Renewable Energy, Office of Vehicle Technologies of the US Department of Energy (DOE), Contract No. DE-AC02–05CH11231, Subcontract No. 6951379, under the Battery Materials Research Program. Part of the research described here was performed at EMSL, a national scientific user facility sponsored by the DOE’s Office of Biological and Environmental Research and located at PNNL.

Frances M. Ross is currently at the IBM T.J. Watson Research Center. She received her BA degree in physics and PhD degree in materials science from the University of Cambridge. Following a postdoc at AT&T Bell Laboratories, she joined the National Center for Electron Microscopy, Lawrence Berkeley National Laboratory and then IBM, building a program around a microscope with deposition and focused ion beam capabilities. Her interests include liquid-cell electron microscopy, epitaxy, nanowires, and electrodeposition. She received the UK Institute of Physics Boys Medal, the MRS Outstanding Young Investigator Award, and the MSA Burton Medal; holds an honorary doctorate from Lund, and is a Fellow of MRS, APS, AAAS, MSA, and AVS. Ross can be reached by email at fmross@us.ibm.com.

Chongmin Wang is a staff scientist at Pacific Northwest National Laboratory. He received his BSc and MSc degrees in physics from Lanzhou University in China and a PhD degree in materials science and engineering from the University of Leeds, UK. He worked at the Max-Planck Institute for Metals Research in Stuttgart, Germany, as an Alexander von Humboldt Research Fellow, the National Institute for Materials Science in Japan, and Lehigh University, where he focused on atomic-level study of grain-boundary structure and chemistry using S/TEM. His research interests include S/TEM and spectroscopy and applications to materials characterization, especially in situ and operando S/TEM techniques for energy materials applications. He was the recipient of the Microscopy Today Innovation Award, an R&D 100 Award, the Rowland Snow Award from The American Ceramic Society, the Outstanding Invention Award from the Japanese Science and Education Committee, and a PNNL Exceptional Contribution Award. Wang can be reached by email at chongmin.wang@pnnl.gov.

Niels de Jonge is a senior group leader at the INM-Leibniz Institute for New Materials, Germany, and honorary professor of experimental physics, Saarland University, Germany. He received his MSc degree in physics from the University of Amsterdam, The Netherlands, and a PhD degree in natural sciences, specializing in biophysics, from the University of Freiburg, Germany. He worked as a senior scientist at Philips Research, The Netherlands. At Oak Ridge National Laboratory (ORNL), he pioneered STEM of liquid specimens. He then joined Vanderbilt University School of Medicine as an assistant professor of biophysics. His research interests include in situ electron microscopy of biological samples and nanoparticles in the liquid phase, and 3D STEM. De Jonge received the ORNL Innovation Award, the ORNL Esprit de Corps Award, and the Microscopy and Microanalysis Best Paper Award. De Jonge can be reached by email at niels.dejonge@leibniz-inm.de.