Assessment of right ventricular systolic and diastolic cardiac function is essential in patients with CHD. Invasive haemodynamic measurements via cardiac catheterisation, although the gold standard for evaluating function,Reference Feltes, Bacha and Beekman 1 are impractical for routine clinical practice. Thus, echocardiography remains the non-invasive mainstay for evaluating function in patients with CHD.Reference Lopez, Colan and Frommelt 2 Newer echocardiographic techniques to assess functions such as tissue Doppler imaging and deformation analysis may allow more accurate assessment of function, but these values have not been extensively validated in the paediatric population.Reference Dandel, Lehmkuhl, Knosalla, Suramelashvili and Hetzer 3
Adult studies have shown relationships between various echocardiographic systolic and diastolic values with invasive haemodynamic measurements.Reference Mattioli, Castelli and Mattioli 4 , Reference Hilde, Skjorten and Grotta 5 In addition, the newer echocardiographic techniques of tissue Doppler imaging and deformation analysis have also been shown to correlate with catheterisation values of systolic and diastolic function in adult studies;Reference Constantinescu, Magda and Niculescu 6 – Reference Naderi, Ojaghi Haghighi and Amin 8 however, minimal data exist in children documenting correlations between catheterisation values of function with echocardiographic measurements of function.Reference Cevik, Kula and Olgunturk 9 – Reference Schlangen, Petko and Hansen 13
The goal of this exploratory study was to evaluate echocardiographic measurements that best correlate with right ventricular systolic and diastolic catheterisation parameters in paediatric congenital heart patients with two-ventricle physiology.
Methods
This prospective, cross-sectional study was approved by the institutional review board. All patients with CHD and two-ventricle physiology undergoing catheterisation for any indication were recruited for this study. Informed consent was obtained from parents before the start of catheterisation, and assent was obtained from children older than 9 years of age. Exclusion criteria included poor echocardiographic windows during image acquisition, poor image quality during post-processing strain analysis, leading to inability for adequate six-segment tracking, incorrect frame rate, or incomplete catheterisation data.
Echocardiography
Echocardiographic studies were obtained using a Vivid I machine (GE Healthcare, Wauwatosa, Wisconsin, United States of America). Images were acquired as four second clips while the patient was supine and under general anaesthesia and before any cardiac catheterisation intervention. Frame rates were set at greater than 80 frames/second for all included studies. All measurements were obtained from a standard apical four-chamber view. Post-processing of all images for deformation analysis was completed offline using EchoPAC version 10 (GE Healthcare).
Early-diastolic wave (E) and late-diastolic wave (A) inflow velocities of the tricuspid valve were recorded. Fractional area change was calculated according to American Society of Echocardiography guidelines.Reference Lopez, Colan and Frommelt 2
Pulse wave spectral Doppler of the right ventricular free wall at the level of the tricuspid valve annulus was used to obtain tissue Doppler imaging early-diastolic wave (e’), late-diastolic wave (a’), and systolic wave (s’) (Fig 1). Early-diastolic wave (E)/tissue Doppler imaging early-diastolic wave (e’) and tissue Doppler imaging early-diastolic wave (e’)/tissue Doppler imaging late-diastolic wave (a’) ratios were also calculated.
Pulse wave spectral Doppler of the right ventricular free wall at the level of the tricuspid valve annulus to obtain tissue Doppler imaging early-diastolic wave (e’), late-diastolic wave (a’), and systolic wave (s’).

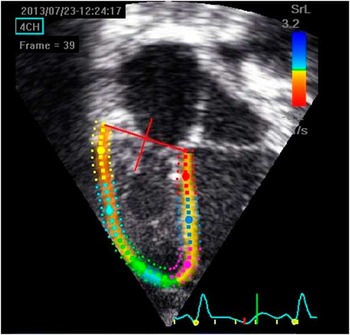
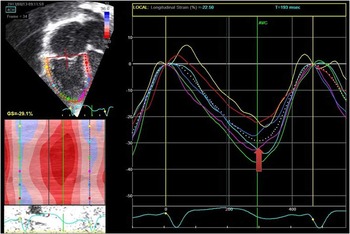
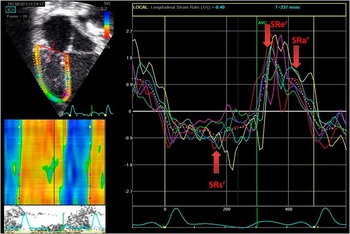
The endocardial border of the right ventricle was traced starting from the lateral atrioventricular annular hinge point to the apex and then to the right ventricular septal hinge point for deformation analysis. The right ventricle was divided automatically into a six-segment model, and the tracings were accepted if both visual inspection and the software indicated adequate tracking for all segments (Fig 2). Speckle analysis-derived peak global longitudinal strain, peak global early-diastolic strain rate wave (SRe’), peak global late-diastolic strain rate wave (SRa’), and peak global systolic strain rate wave (SRs’) were obtained via post-processing evaluation (Figs 3 and 4). Global values were obtained by averaging the values of the six-segment model in EchoPAC. Early-diastolic wave (E)/strain rate e’ and strain rate e’/strain rate a’ were calculated. Displacement of the right ventricular free wall basal segment was also obtained via speckle tracking as a surrogate for tricuspid annular plane systolic excursion.
Six-segment colour-coded model for two-dimensional strain analysis. Segments are colour coded as follows: red: basal interventricular septum, dark blue: mid-interventricular septum, pink: apical interventricular septum, green: apical right ventricular free wall, light blue: mid-right ventricular free wall, and yellow: basal right ventricular free wall.

Two-dimensional strain analysis. Top left: six-segment colour-coded model for two-dimensional strain analysis. Segments are colour coded as follows: red: basal interventricular septum, dark blue: mid-interventricular septum, pink: apical interventricular septum, green: apical right ventricular free wall, light blue: mid-right ventricular free wall, and yellow: basal right ventricular free wall. Waveform depicts strain curve with global left ventricular strain value (designated by the dashed white line.

Strain rate analysis. Right ventricle segments are colour coded. Segments are colour coded as follows: red: basal interventricular septum, dark blue: mid-interventricular septum, pink: apical interventricular septum, green: apical right ventricular free wall, light blue: mid-right ventricular free wall, and yellow: basal right ventricular free wall. Global strain rate values are represented by the dashed white line. SRa’=strain rate late-diastolic wave; SRe’=strain rate early-diastolic wave; SRs’=strain rate systolic wave.

Catheterisation Data
Baseline haemodynamics were measured after the echocardiogram was complete and before any catheter interventions. All measurements were made under the same baseline conditions using fluid-filled catheters. Catheterisation data were obtained and processed on Siemens AXIOM Sensis XP software, version VC3 (Axiom Sensis XP VC11C, Sensis Information System VC11C, Win NT 5.1 SP3, Siemens AG Berlin and Munchen 2011, Hoffman Estates, Illinois, United States of America and Forchheim, Germany). DP/dt was used as a marker for systolic function, and the right ventricular end-diastolic pressure was used as a marker for diastolic function. Both values were obtained from the catheterisation report. DP/dt was determined as the maximum slope between the end-diastolic pressure and peak systolic pressure via software analysis. Right ventricular end-diastolic pressure was measured from the right ventricle pressure tracing as the point just before the rapid rise in ventricular pressure corresponding to ventricular systole.
Correlations
Correlations between dP/dt and echocardiographic variables ejection fraction, tissue Doppler imaging s’, global longitudinal strain, and strain rate s’ were performed. Correlations between right ventricular end-diastolic pressure and echocardiographic variables early-diastolic wave (E), late-diastolic wave (A), tissue Doppler imaging e’, tissue Doppler imaging a’, early-diastolic wave E/tissue Doppler imaging e’, tissue Doppler imaging e’/tissue Doppler imaging a’, strain rate e’, strain rate a’, early-diastolic wave E/strain rate e’, and strain rate e’/strain rate a’ were also performed.
Statistical analysis
Pearson’s test was used to test the linear correlation among variables mentioned above. A p<0.05 was considered significant. Data are presented as means and averages unless otherwise stated. Our echocardiographic laboratory has previously noted good-to-excellent inter- and intra-observer intraclass coefficients for the echocardiographic measurements obtained.Reference Husain, Gokhale, Nicholson, Cheatham, Holzer and Cua 10 , Reference Husain, Gokhale and Nicholson 11 , Reference Gokhale, Husain, Nicholson, Texter, Zaidi and Cua 14 , Reference Yates, Welty, Gest and Cua 15 All post-processing measurements were made in triplicate by a single observer blinded to the catheterisation results.
Results
A total of 42 patients were recruited and consented to participate over a 4-month period. Among them, 10 patients were excluded – eight patients were excluded for inadequate images, one patient was excluded for inadequate frame rates, and one patient was excluded for incomplete catheterisation data. Thus, 32 patients were included in the study. Age at catheterisation was 4.1±4.1 years (median 3.1 years, range 0.3–17.6 years). The median right ventricular dP/dt was 461 mmHg/second, ranging from 27 to 1687 mmHg/second. The median right ventricular end-diastolic pressure was 8 mmHg, ranging from 4 to 14 mmHg. The anatomical subsets are listed in Table 1. The majority of patients were undergoing catheterisation for patent ductus arteriosus or atrial septal defect device closure.
Baseline demographics.

AS=aortic stenosis; ASD=atrial septal defect; DORV=double-outlet right ventricle; IAA=interrupted aortic arch; PA=pulmonary atresia; PDA=patent ductus arteriosus; PS=pulmonary stenosis; TGA=transposition of the great arteries; TOF=tetralogy of Fallot; VSD=ventricular septal defect
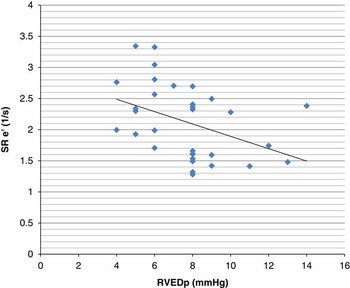
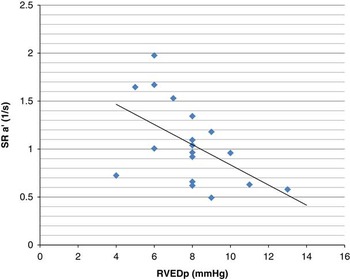
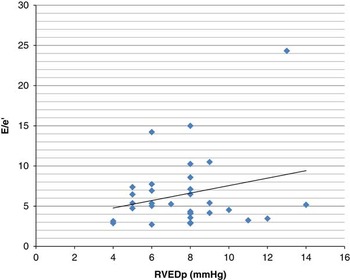
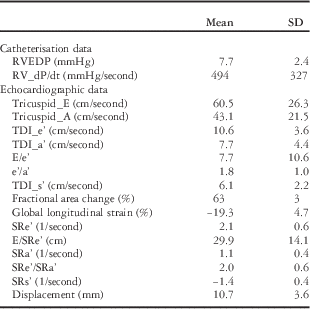
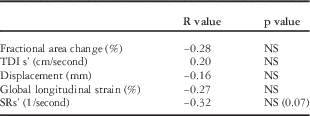
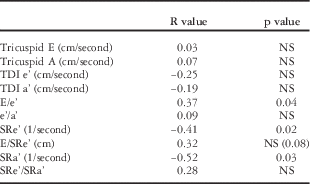
Echocardiographic and catheterisation data are presented in Table 2. Echocardiographic systolic correlations with dP/dt are presented in Table 3. There were no significant correlations noted. There was a trend for correlation between dP/dt and strain rate s’ (r=−0.32, p=0.07) (Fig 5). Echocardiographic diastolic correlations with right ventricular end-diastolic pressure are presented in Table 4. Right ventricular end-diastolic pressure correlated significantly with strain rate e’ (r=−0.4, p=0.02) (Fig 5), strain rate a’ (r=−0.5, p=0.03) (Fig 6), and early-diastolic wave E/tissue Doppler imaging e’ (r=0.4, p=0.04) (Fig 7). There was a trend for correlation between right ventricular end-diastolic pressure and early-diastolic wave E/strain rate e’ (r=0.32, p=0.08).
Global strain rate early-diastolic wave versus right ventricular end-diastolic pressure. RVEDP=right ventricular end-diastolic pressure; SRe’=peak global early-diastolic strain rate wave.

Global strain rate late-diastolic wave versus right ventricular end-diastolic pressure. RVEDP=right ventricular end-diastolic pressure; SRa’=peak global late-diastolic strain rate wave.

Tricuspid valve early-diastolic wave/tissue Doppler early-diastolic wave versus right ventricular end-diastolic pressure. RVEDP=right ventricular end-diastolic pressure; E/e’=Early-diastolic wave (E)/strain rate e’.

Echocardiographic and catheterisation data.

A=late-diastolic wave; E=early-diastolic wave; LV=left ventricle; RVEDP=right ventricular end-diastolic pressure; SR=strain rate; TDI=tissue Doppler imaging
Echocardiographic systolic correlations with dP/dt.

NS=not significant; s’= systolic wave; SR=strain rate; TDI=tissue Doppler imaging
Echocardiographic diastolic correlations with right ventricular end-diastolic pressure.

A=late-diastolic wave; E=early-diastolic wave; NS=not significant; SR=strain rate; TDI=tissue Doppler imaging
Discussion
Echocardiography remains the main technique in assessing right ventricular function in children with CHD.Reference Lopez, Colan and Frommelt 2 Systolic and diastolic right ventricular echocardiographic values have been validated against cardiac catheterisation data in the adult population,Reference Mattioli, Castelli and Mattioli 4 – Reference Naderi, Ojaghi Haghighi and Amin 8 but minimal data exist in the paediatric congenital heart population correlating echocardiographic variables of right ventricular function with cardiac catheterisation data. Even less data exist validating the newer echocardiographic techniques of tissue Doppler imaging and deformation analysis for assessing right ventricular function in the paediatric population. In this study, there was no significant correlation of any of the systolic echocardiographic parameters with catheterisation DP/dt; however, there were significant correlations of tissue Doppler imaging and strain rate values with right ventricular end-diastolic pressure.
The maximum rate of ventricular isovolumic pressure rise in early systole, or dP/dt max, has long been used as a measure of both right and left ventricular systolic functions, given its relative non-reliance on ventricular preload or afterload.Reference Quinones, Gaasch and Alexander 16 – Reference Yabek, Berman and Dillon 20 Other catheterisation values of systolic function could have been used such as cardiac index and end-systolic elastance, but the former relies on certain assumptions that may not be valid in the congenital heart population and the latter is cumbersome to perform and not usually obtained during a routine catheterisation. That being said, no echocardiographic parameter significantly correlated with dP/dt, although there was a trend for a negative correlation with strain rate s’.
This lack of correlation is in contrast to animal and adult studies that have shown correlations between dP/dt and echocardiographic measurements.Reference Tei, Nishimura, Seward and Tajik 21 – Reference Yamada, Oki, Tabata, Iuchi and Ito 23 This negative finding may be due to multiple factors. First, the animal and adult studies evaluated hearts with normal cardiac anatomy, whereas this study dealt with a paediatric population with CHD. The non-uniformity of the right ventricle in this paediatric population may not allow for a simple segmental assessment such as tissue Doppler imaging s’ wave or displacement to translate into a global right ventricular functional analysis. This is analogous to the finding that tissue Doppler imaging values did not correlate to overall right ventricular function in patients with tetralogy of Fallot because of the non-uniformity and complex geometry of the right ventricle.Reference Kutty, Zhou, Gauvreau, Trincado, Powell and Geva 24
Deformation analysis hypothetically is less load dependent and is also considered independent of the angle of interrogation when evaluated via speckle tracking.Reference Artis, Williams, Pepper and Tan 25 In addition, as a six-segmental model was obtained, a more complete evaluation of the right ventricle was performed, although not a complete model. Despite these theoretical advantages, there were still no correlations found between deformation values and dP/dt, although there was a trend with strain rate s’. A previous study noted a significant correlation between catheter-derived end-systolic elastance and strain rate s’ in a paediatric population with single right ventricle morphology.Reference Schlangen, Petko and Hansen 13 This suggests that strain rate s’ could possibly be a useful non-invasive measurement of systolic function in this population. Only larger studies will be able to determine the implication of these findings.
There was no correlation with tricuspid valve E or A waves with end-diastolic pressure. Both these variables are fairly preload and afterload dependent, and phenomena such as pseudo-normalisation of inflow wavesReference Ho 26 may be one reason that there was no correlation present. The right ventricular end-diastolic pressure range was also somewhat narrow in the patients studied, such that inflow velocities may not be sufficient to discriminate such small differences.
There was a significant correlation with right ventricular end-diastolic pressure and E/e’ values, although this correlation was somewhat weak; however, tissue Doppler imaging e’ and tissue Doppler imaging a’ waves did not correlate with right ventricular end-diastolic pressure. Most adult studies have shown correlations between early-diastolic wave E/tissue Doppler imaging e’ values with left ventricular end-diastolic pressure,Reference Ahn, Kim and Kim 27 , Reference Gellen, Canoui-Poitrine and Lesault 28 but this is not absolute.Reference Marchandise, Vanoverschelde and D’Hondt 29 , Reference Previtali, Chieffo, Ferrario and Klersy 30 Less data are available correlating tissue Doppler imaging values with right ventricular diastolic function. These data are somewhat varied, but it does appear that tissue Doppler imaging in certain circumstances can be useful in evaluating right ventricular diastolic function.Reference Menon, Gray and Tani 12 , Reference Watanabe, Ono and Tomomasa 31 , Reference Okumura, Slorach and Mroczek 32 As stated, the only significant correlation was weak, and it may be that patients with CHD may be another population where tissue Doppler imaging estimates of diastolic function are less robust in assessing diastolic function. Only one segment of the right ventricle was evaluated. It may be possible that if a more complete evaluation of the right ventricle was performed, stronger and more significant correlations may have been detected. This is especially true in the congenital heart population where intracardiac procedures have been performed.
Strain rate analysis did show significant correlations with right ventricular end-diastolic pressure in this population. Both strain rate e’ and strain rate a’ had significant correlations that were moderate in strength to right ventricular end-diastolic pressure. In addition, there was a trend for correlation between early-diastolic wave E/strain rate e’ and right ventricular end-diastolic pressure. As right ventricular end-diastolic pressure increases because of worsening diastolic function, one could assume that early relaxation and atrial filling properties decrease as signified by strain rate e’ and strain rate a’, respectively. Again, most adult studies have evaluated the left ventricle. These studies have documented superior estimation of left ventricular end-diastolic pressure using strain analysis, specifically early-diastolic wave E/strain rate e’, versus tissue Doppler imaging, analogous to these results.Reference Kasner, Gaub and Sinning 33 , Reference Meluzin, Spinarova and Hude 34 Limited right ventricular data also appear to corroborate the correlations between strain rate analysis and right ventricular function.Reference Husain, Gokhale, Nicholson, Cheatham, Holzer and Cua 10 , Reference Padeletti, Cameli and Lisi 35 The reasons for significant correlations with right ventricular end-diastolic pressure are parallel to the reasons why tissue Doppler imaging may not have correlated. Strain rate analysis is not angle dependent, and a six-segment model was used for analysis instead of a single segment that was used for tissue Doppler imaging.
There are several limitations to this study. The main limitation of this study is that it represents a relatively small cohort of patients with heterogeneous anatomical and surgical diagnosis. All patients had relatively normal systolic and diastolic function, and as such these conclusions may be hampered by these issues. Future studies will need to include more patients with abnormal right ventricular end-diastolic pressures in order to define threshold levels of echocardiographic parameters that correlate with abnormal right ventricular end-diastolic pressures. No radial or circumferential deformation data were obtained to determine correlations with catheterisation data. Echocardiographic measurements were not adjusted for afterload indices. Although this study did find some significant correlations, the small sample size may have contributed to the lack of uncovering other significant correlations. The correlations noted were modest at best. Multiple comparisons were performed in a small exploratory sample, therefore increasing the likelihood of significance at a p<0.05. Further directed studies including larger samples with a correction for alpha level are needed to verify these results. Fluid-filled catheters were used for catheter measurements versus the gold standard of high-fidelity catheter tip micromanometers. These high-fidelity catheters are rarely used in general practice, and this study used a study population of convenience. Although catheterisation dP/dt is an accepted surrogate for systolic function, the gold standard for contractility assessment is catheter-derived pressure–volume loops and end-systolic elastance measurements, which were not calculated. Strong clinical conclusions cannot be definitively made because of the above reasons.
In conclusion, echocardiographic parameters of systolic function did not correlate with invasively derived dP/dt in patients with biventricular CHD, although there was a trend for strain rate s’. Early-diastolic wave E/tissue Doppler imaging e’ and strain rate values did correlate significantly with right ventricular end-diastolic pressure in this population. These values should be further studied to determine whether they may be used as an alternative method to estimate right ventricular end-diastolic pressure in this patient population. Larger studies are needed to determine the clinical significance, if any, of these measurements.
Acknowledgements
None. Authors’ Contributions: Holly Nadorlik performed echocardiograms, strain measurements, and data analysis and was involved in manuscript preparation and concept design. Clifford Cua involved in data analysis, manuscript preparation, and concept design. Corey Stiver performed echocardiograms and was involved in manuscript preparation. Sairah Khan was involved in manuscript preparation. Yongjie Miao was involved in statistical analysis. Ralf Holzer was involved in concept design. John P. Cheatham was involved in concept design.
Financial Support
This research received no specific grant from any funding agency or from commercial or not-for-profit sectors.
Conflicts of Interest
None.