Implications
Feeding of enzymatically modified starch up-regulated jejunal expression of one short-chain fatty acid transporter, intestinal alkaline phosphatase and the incretins. Thus, inclusion of enzymatically modified starch in the diets of growing pigs shows advantages in enhancing fermentation-related health benefits in the jejunum. These findings emphasize the interaction between diet and host and may provide premises for designing functional feed that target the jejunum in pigs.
Introduction
Cereal starch is the major dietary energy source for monogastric animals such as pig. Many factors, such as starch chemistry, association of starch molecules with other dietary components and food technological aspects, influence intestinal starch digestion (Birt et al., Reference Birt, Boylston, Hendrich, Jane, Hollis, Li, McClelland, Moore, Phillips, Rowling, Schalinske, Scott and Whitley2013). Health benefits of slowly digestible and resistant starches (RS) were classically studied in relation to prevention and treatment of human lifestyle diseases (e.g. type 2 diabetes and obesity) (Singh et al., Reference Singh, Dartois and Kaur2010; Birt et al., Reference Birt, Boylston, Hendrich, Jane, Hollis, Li, McClelland, Moore, Phillips, Rowling, Schalinske, Scott and Whitley2013). More recent research, however, indicates positive effects of RS consumption in pigs as well. For instance, feeding RS to pigs showed to prolong satiety and reduce feed search behavior, which was associated with a reduced intestinal glucose release as well as enhanced intestinal short-chain fatty acid (SCFA) production (Heo et al., Reference Heo, Agyekum, Yin, Rideout and Nyachoti2014; Souza da Silva et al., Reference Souza da Silva, Bosch, Bolhuis, Stappers, van Hees, Gerrits and Kemp2014).
Food technological approaches allow for chemical modification of the structure of starch molecules via transglycosylation, esterification or crosslinking (Birt et al., Reference Birt, Boylston, Hendrich, Jane, Hollis, Li, McClelland, Moore, Phillips, Rowling, Schalinske, Scott and Whitley2013). In contrast to native dietary components, the digestibility and thus nutritional value of chemically modified starches (CMS) can be more exactly defined without the natural fluctuations observed in native ingredients. By far, CMS are common food additives to improve rheological properties and texture of processed food items aimed for human consumption. Like other purified dietary fiber fractions available from the bioprocessing industry, CMS may be an attractive source of purified starch to be supplemented in pig diets, particularly if they show physiological effects comparable with slowly digestible starches or RS. However, little information is available about intestinal and metabolic effects of CMS so far (Birt et al., Reference Birt, Boylston, Hendrich, Jane, Hollis, Li, McClelland, Moore, Phillips, Rowling, Schalinske, Scott and Whitley2013). We could recently show for an enzymatically modified starch (EMS) product to decrease feed conversion efficiency in growing pigs (Metzler-Zebeli et al., Reference Metzler-Zebeli, Hollmann, Sabitzer, Podstatzky-Lichtenstein, Klein and Zebeli2015c).
Aside from the digestibility of starch in the small intestine, part of the metabolic effect of starches on the host is related to intestinal SCFA generation (e.g. Haenen et al., Reference Haenen, Zhang, Souza da Silva, Bosch, van der Meer, van Arkel, van den Borne, Pérez Gutiérrez, Smidt, Kemp, Müller and Hooiveld2013). However, in contrast to other reports on RS effects in pigs (e.g. Haenen et al., Reference Haenen, Zhang, Souza da Silva, Bosch, van der Meer, van Arkel, van den Borne, Pérez Gutiérrez, Smidt, Kemp, Müller and Hooiveld2013), EMS feeding decreased luminal SCFA in cecal digesta (Metzler-Zebeli et al., Reference Metzler-Zebeli, Hollmann, Sabitzer, Podstatzky-Lichtenstein, Klein and Zebeli2015c). In using functional metagenome prediction, reduced bacterial utilization of EMS was further indicated by the lower abundance of carbohydrate and SCFA metabolic pathways in the cecal bacterial microbiome in those pigs (Metzler-Zebeli et al., Reference Metzler-Zebeli, Hollmann, Sabitzer, Podstatzky-Lichtenstein, Klein and Zebeli2015c). Moreover, EMS attenuated the postprandial rise in serum triglycerides in an 8-h meal tolerance test and altered preprandial and postprandial serum phospholipid and amino acid metabolome in jugular vein catheterized pigs (Metzler-Zebeli et al., Reference Metzler-Zebeli, Mann, Ertl, Schmitz-Esser, Wagner, Klein, Ritzmann and Zebeli2015a) and may suggest alterations in hepatic glucose and lipid metabolism. Having in mind the aforementioned observations, it may be hypothesized that the mucosal expression of incretins and transporters for glucose and SCFA as well as the hepatic expression of genes related to glucose and lipid metabolism may be modified in pigs fed a diet containing EMS.
The aim of the present study was to investigate the gene expression response of the jejunal and cecal mucosa in relation to starch digestion, sugar and SCFA transport and incretins in male growing barrows. To provide a link between findings at intestinal level to systemic level and growth performance, we further investigated postprandial serum metabolites and hepatic genes involved in glucose and lipid metabolism. Feeding level may influence mucosal and hepatic gene expression responses. However, in order to mimic the situation in practice and observe potential effects on the feed intake and thus feeding behavior (Metzler-Zebeli et al., Reference Metzler-Zebeli, Hollmann, Sabitzer, Podstatzky-Lichtenstein, Klein and Zebeli2015c), pigs received free access to their diets three times daily.
Material and methods
Experimental design, animals and housing
Intestinal tissue samples used in this study were collected in the experiment reported earlier (Metzler-Zebeli et al., Reference Metzler-Zebeli, Hollmann, Sabitzer, Podstatzky-Lichtenstein, Klein and Zebeli2015c). In brief, 24 cross-bred barrows ((Landrace×Large White)×Piétrain; age: 3 to 4 months; initial BW: 29 (SD=2.8) kg) were randomly assigned to one of the two diets in a randomized design with three experimental runs of eight pigs each. Per run, four pigs received one of the two diets. Pigs were individually fed and housed in metabolism cages (1.20×1.00 m) with Plexiglas walls to allow visual contact. Each cage contained one nipple drinker with free access to demineralized water, one feeder and one heating lamp. All procedures involving animal handling and treatment were approved by the institutional ethics committee of the University of Veterinary Medicine and the national authority according to paragraph 26 of Law for Animal Experiments, Tierversuchsgesetz – TVG (GZ 68.205/0063-WF/II3b/2014).
Diets and feeding
Before the experiment, pigs were fed a commercial cereal-based grower diet (metabolizable energy, 13.4 MJ/kg; CP, 16.8% as-fed basis). On the last 2 days of the 9-day adaptation, pigs were transitioned from the grower to the experimental diets by blending the grower diet with the experimental diets (50/50 v/v). Experimental diets were formulated to meet or exceed current recommendations for nutrient requirements (Nutrient Research Council, 2012) and were identical except for the type of starch (control starch (CON) v. EMS). Ingredients and chemical composition of diets are shown in Table 1. The CON diet contained standard rapidly digestible waxy corn starch (AGRANA Stärke GmbH, Gmünd, Austria). The test starch (EMS) diet contained Agenanova (AGRANA Stärke GmbH) that was prepared from waxy corn starch (Metzler-Zebeli et al., Reference Metzler-Zebeli, Mann, Ertl, Schmitz-Esser, Wagner, Klein, Ritzmann and Zebeli2015a and Reference Metzler-Zebeli, Hollmann, Sabitzer, Podstatzky-Lichtenstein, Klein and Zebeli2015c). Aside from a uniform but reduced molecular weight distribution, the amylopectin fraction of the EMS contains twice as many α-1,6-glycosidic bonds (~8%) in comparison with the non-modified native waxy corn starch (4% α-1,6-glycosidic bonds). In addition, monosaccharide and disaccharide were absent to the greatest possible extent (Metzler-Zebeli et al., Reference Metzler-Zebeli, Mann, Ertl, Schmitz-Esser, Wagner, Klein, Ritzmann and Zebeli2015a and Reference Metzler-Zebeli, Hollmann, Sabitzer, Podstatzky-Lichtenstein, Klein and Zebeli2015c).
Dietary ingredients and analyzed chemical composition of the enzymatically modified starch (EMS) diet and control (CON) diet (Metzler-Zebeli et al., Reference Metzler-Zebeli, Hollmann, Sabitzer, Podstatzky-Lichtenstein, Klein and Zebeli2015c)

DM=dry matter.
1 Quemina (AGRANA Stärke GmbH, Gmünd, Austria), chemical composition per kilogram of starch (analyzed): 97.3% of (DM), 0.4% (DM) of CP, 0.1% (DM) of crude ash.
2 Agenanova (AGRANA Stärke GmbH), chemical composition per kilogram of starch (analyzed): 96.5% of DM, 0.4% (DM) of CP, 0% (DM) of crude ash.
3 Plasvita (calcium caseinate; Rovita, Engelsberg, Germany), chemical composition per kilogram of starch: 94.4% of DM, 94.8% (DM) of CP (analyzed), 4.6% (DM) of crude ash (analyzed), 1.44% (DM) of Ca (analyzed), 0.91% (DM) of P (analyzed), 4.26% (protein) of alanine, 2.11% (protein) of arginine, 9.21% (protein) aspartate, 1.99% (protein) of cysteine, 14.50% (protein) of glutamate, 1.51% (protein) of glycine, 1.73% (protein) of histidine, 5.25% (protein) of isoleucine, 8.94% (protein) of leucine, 7.70% (protein) of lysine, 1.80% (protein) of methionine, 2.66% (protein) of phenylalanine, 4.88% (protein) of proline, 4.27% (protein) of serine, 5.80% (protein) of threonine, 1.49% (DM) of tryptophan, 2.48% (DM) of tyrosine, 4.86% (DM) of valine (amino acid profile was provided by supplier).
4 FibreCell (Agromed Austria GmbH, Kremsmünster, Austria).
5 Provided per kilogram of complete diet (GARANT GmbH, Pöchlarn, Austria): 16 000 IU of vitamin A, 2000 IU of vitamin D3, 125 mg of vitamin E, 2.0 mg of vitamin B1, 6.0 mg of vitamin B2, 3.0 mg of vitamin B6, 0.03 mg of vitamin B12, 3.0 mg of vitamin K3, 30 mg of niacin, 15.0 mg of pantothenic acid, 900 mg of choline chloride, 0.15 mg of biotin, 1.5 mg of folic acid, 200 mg of vitamin C; 4.6 g of Ca, 2.3 g of digestible P, 2.4 g of Na, 2.0 g of Cl, 3.2 g of K, 1.0 g of Mg, 50 mg of Mn (as MnO), 100 mg of Zn (as ZnSO4), 120 mg of Fe (as FeSO4), 15.6 mg of Cu (as CuSO4), 0.5 mg of Se (as Na2SeO3), 1.9 mg of I (as Ca(IO3)2), 3 g of TiO2.
6 Total starch was determined using the Total Starch Assay Kit (K-TSTA; Megazyme International Ireland Ltd, Bray, Ireland).
Diets were fed for 10 days. Pigs were offered their respective diets three times daily at 0800, 1200 and 1630 h as mash. Feed allowances were calculated to surpass pig’s appetite. Spillage and feed leftovers in feeding bowls were collected after feeding. One pig of the first block and receiving the EMS diet showed symptoms of illness during the experimental period and was removed from the experiment.
Collection of blood, intestinal digesta and mucosa
On day 11, blood, intestinal digesta and mucosal scrapings were collected 2 to 3 h after the last meal of the pig. After sedation (Narketan, 10 ml/kg BW, Ketamine HCl; Vétoquinol AG, Ittigen, Austria; and Stresnil, 3 ml/kg BW, Azaperone; Biokema SA, Crissier, Switzerland), blood was collected by cardiac puncture into serum collection tubes (S-Monovette 9.0 ml Z; Sarstedt GmbH & Co., Nümbrecht, Germany) and placed on ice until centrifugation at 1811×g for 10 min at 4°C (Eppendorf Centrifuge 5810 R; Eppendorf, Hamburg, Germany), and stored at −20°C until analysis. Immediately thereafter, pigs were euthanized by intracardiac injection of T61 (10 ml/kg, Embutramide; MSD Animal Health, Vienna, Austria) and the abdominal cavity was opened. The liver and the entire gastrointestinal tract were removed from the cavity. The liver was instantly washed with phosphate-buffered saline to remove blood, blotted dry on paper towel, cut into small pieces and snap frozen in liquid N2 before storage at −80°C. Alongside, the small and large intestines were carefully dissected from the mesentery. The small intestine was divided by half to identify the mid-jejunum. Intestinal tube pieces were opened at the mesentery and digesta were removed. Intestinal tissues – mid-jejunum, cecum, proximal and mid colon – were thoroughly washed in ice-cold phosphate-buffered saline and the mucosa from 20-cm pieces was scraped off using a glass plate. Mucosa samples were immediately snap frozen in liquid N2 and stored at −80°C for subsequent RNA isolation. The mucosa from the mid-jejunum and cecum were selected for candidate gene expression because of their important roles in digestion, absorption and fermentation.
RNA isolation and quantitative real-time PCR
Total RNA was isolated from hepatic tissue and jejunal and cecal mucosal scrapings essentially as recently described (Metzler-Zebeli et al., Reference Metzler-Zebeli, Eberspächer, Grüll, Kowalczyk, Molnar and Zebeli2013 and Reference Metzler-Zebeli, Schmitz-Esser, Mann, Grüll, Molnar and Zebeli2015b) using mechanical homogenization and the RNeasy Mini Kit (Qiagen, Hilden, Germany). RNA isolates were treated with DNase I (Turbo DNA-free Kit; Ambion, Austin, TX, USA). Quality of RNA was verified using the Agilent 2100 Bioanalyzer (Agilent Technologies, Santa Clara, CA, USA) and the subsequent determination of RNA integrity numbers (RIN). Except for two jejunal samples with RINs of 8.2 and 8.7 and two cecal samples with RINs of 7.4 and 8.4, the RINs of all other jejunal and cecal mucosa samples were between 9 and 10. The majority of hepatic samples had RINs between 9 and 10; three hepatic samples had RINs of 7.0, 7.6 and 7.7.
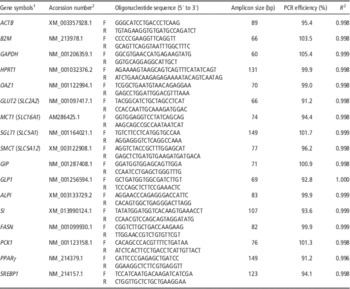
DNAse I treatment of the samples was used to prevent DNA detection. Single-stranded complementary DNA (cDNA) was synthesized from 1 µg of total RNA using the High-Capacity Reverse Transcription Kit (Life Technologies, Foster City, CA, USA). Primers were located on different exons and were designed using the Primer Express Software, version 3.0 (Life Technologies; Table 2). In hepatic tissue, genes related to gluconeogenesis (phosphoenolpyruvate carboxykinase 1 (PCK1)) and lipid metabolism (fatty acid synthase (FASN), sterol regulatory element-binding protein 1 (SREBP1) and peroxisome proliferator-activated receptor γ (PPARγ)) were targeted. In jejunum and cecum, candidate genes were sugar transporters (solute carrier family 2 (facilitated glucose transporter), member 2 (GLUT2) and solute carrier family 5 (sodium/glucose cotransporter), member 1 (SGLT1)), monocarboxylate transporters (monocarboxylate transporter 1 (MCT1) and sodium-coupled monocarboxylate transporter (SMCT)) and incretins (gastric inhibitory polypeptide (GIP) and glucagon-like peptide-1 (GLP1)); additionally in the jejunum brush-border enzymes maltase-sucrase (SI) and intestinal alkaline phosphatase (ALPI) were targeted (Table 2). Amplifications of target genes as well as housekeeping genes (HKG; β-actin (ACTB), hypoxanthine phosphoribosyltransferase 1 (HPRT1), glyceraldehyde-3-phosphate dehydrogenase (GAPDH), β-2 microglobulin (B2M) and ornithine decarboxylase antizyme 1 (OAZ1)) were performed on a ViiA 7 Real-Time PCR System (Life Technologies, Carlsbad, CA, USA). Quantitative real-time PCR was carried out in 20 µl reactions including 2-µl cDNA template, 200 nM of each primer, 0.2 mM of each deoxynucleotide (dNTP), 3 mM MgCl2, 1× buffer B2 (Solis BioDyne, Tartu, Estonia), 50 nM ROX reference dye (Invitrogen, Carlsbad, CA, USA), 0.4× EvaGreen fluorescent dye (Biotium, Hayward, CA, USA) and 1 unit of HOT FIREPol DNA polymerase (Solis BioDyne; Metzler-Zebeli et al., Reference Metzler-Zebeli, Schmitz-Esser, Mann, Grüll, Molnar and Zebeli2015b). Reverse transcription controls (RT minus) were included in order to control for residual DNA contamination. All samples, RT minus samples and negative template controls were analyzed in duplicates. Out of five tested HKGs, the three most stably expressed ones (ACTB, GAPDH, OAZ1) were identified using the geometric mean and the geNorm software tool (Vandesompele et al., Reference Vandesompele, De Preter, Pattyn, Poppe, Van Roy, De Paepe and Speleman2002). The mean expression level of the identified three HKGs was used for normalization of the target gene expression levels. The expression of the target gene, normalized to the mean of three HKGs, was calculated relative to the expression in the jejunum of one pig fed the control diet using the
 $2^{{{\minus}\Delta \Delta C_{t} }} $
method (Livak and Schmittgen, Reference Livak and Schmittgen2001). Amplification efficiencies (E=10(−1/slope)−1) of all primer sets were provided in Table 2 and prepared by using a fivefold serial dilution of samples.
Forward (F) and reverse (R) primers used for quantitative PCR, PCR efficiency and coefficient of correlation of standard curve

ACTB=β-actin; B2M=β-2 microglobulin; GAPDH=glyceraldehyde-3-phosphate dehydrogenase; HPRT1=hypoxanthine phosphoribosyltransferase 1; OAZ1=ornithine decarboxylase antizyme 1; GLUT2 (SLC2A2)=solute carrier family 2 (facilitated glucose transporter), member 2; MCT1 (SLC16A1)=monocarboxylic acid transporter 1 (solute carrier family 16, member 1); SMCT (SLC5A12)=solute carrier family 5 (sodium/monocarboxylate cotransporter), member 12; GIP=gastric inhibitory polypeptide; GLP1=glucagon-like peptide-1; ALPI=intestinal alkaline phosphatase; SI=brush-border enzymes maltase-sucrase; FASN=fatty acid synthase; PCK1=phosphoenolpyruvate carboxykinase 1; PPARγ=peroxisome proliferator-activated receptor γ; SREBP1=sterol regulatory element-binding protein 1; SGLT1 (SLC5A1)=solute carrier family 5 (sodium/glucose cotransporter), member 1.
1 Alternate gene names are shown in brackets.
2 National Center for Biotechnology Information (NCBI) Entrez Gene (http://www.ncbi.nlm.nih.gov/sites/entrez?db=gene, accessed 25 March 2016).
Serum measurements, chemical and microbiota analyses
Serum glucose, urea-N, triglycerides, cholesterol and non-esterified fatty acids (NEFA) were determined by standard enzymatic colorimetric analysis using an autoanalyzer for clinical chemistry (Cobas 6000/c501; Roche Diagnostics GmbH, Vienna, Austria). Diets were analyzed for dry matter (DM) (method 3.1; Naumann and Basler, Reference Naumann and Bassler2012), and N by the Kjeldahl method (method 4.1.1; Naumann and Basler, Reference Naumann and Bassler2012), Ca (method 10.3.2; Naumann and Basler, Reference Naumann and Bassler2012) and P (method 10.6.1; Naumann and Basler, Reference Naumann and Bassler2012). Dietary total starch content was determined using enzymatic kit (K-TSTA; Megazyme International Ireland Ltd, Bray, Ireland).
Statistical analysis
Serum parameters and hepatic and intestinal expression of target genes were first checked for normality using Shapiro–Wilk’s test and outlier in SAS (version 9.2; SAS Institute Inc., Cary, NC, USA). To compare differences between the two diets, data were subjected to ANOVA using the MIXED procedure in SAS using the pig as experimental unit. For serum metabolites and hepatic expression of target genes, fixed effects of diet and block as well as the random effect of pig within block were included in the main model. Data of expression of genes in jejunum and cecum were analyzed as repeated measures over intestinal sites including the fixed effects of block, diet, intestinal site and diet×intestinal site. In this case, measurement taken from the same animal at different intestinal sites were considered as repeated measures in the analysis using compound symmetry as variance–covariance structure. Degrees of freedom were approximated using Kenward–Rogers method (ddfm=kr). The pairwise comparisons among least-squares means were performed using the probability of difference option implemented in SAS. Results are expressed as least-squares means with their standard error of mean, and P⩽0.05 and 0.05<P⩽0.10 were defined as significance and trend, respectively. Linear discriminate analysis (LDA) was carried out using JMP10 software (SAS Institute Inc., Cary, NC, USA). The LDA attempts to look for linear combinations of variables which best explain the data and expresses one dependent variable as a linear combination of other features or measurements. Here, the relative expression of target genes in jejunum, cecum and liver was used as covariates and diet as the categorical variable. The LDA results were visualized using the first two principal components of the scores plot to identify characteristic trends or grouping among pigs in relation to diet and circles describing the 95% confidence intervals.
Results
Feed intake and growth performance results were already presented in Metzler-Zebeli et al. (Reference Metzler-Zebeli, Hollmann, Sabitzer, Podstatzky-Lichtenstein, Klein and Zebeli2015c). Because these data are equally important for the interpretation of the current results, they are also given in the following. Pigs fed the EMS diet ate 270 g more per day than pigs fed the CON diet (feed intake, CON diet: 978 g/day v. EMS diet: 1248 g/day (SEM ±35.5 g/day; P<0.001)). However, pigs did not differ in their average daily weight gain (EMS diet v. CON diet: 813 v. 779±32.8 g/day; P=0.471).
Relative expression of target genes in hepatic and intestinal tissue
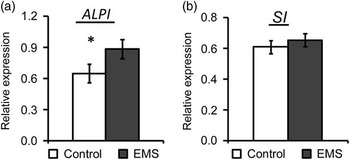
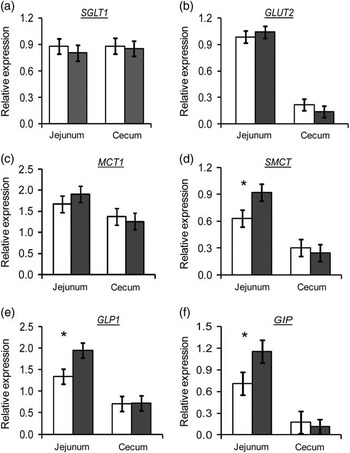
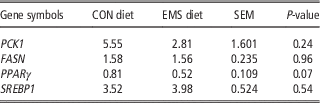
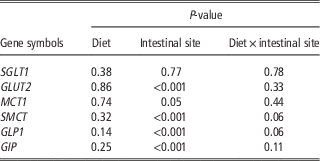
Of the targeted genes (PCK1, FASN, PPARγ and SREBP1) in hepatic tissue, the transcription factor PPARγ showed a trend (P=0.07) for a 36% down-regulation in pigs fed the EMS diet compared with those fed the CON diet (Table 3). The brush-border sucrase-isomaltase and sugar transporters in the jejunum were not differently expressed in the two treatment groups, whereas jejunal ALPI tended (P=0.08) to be up-regulated by 36% by EMS feeding compared with the control diet (Figure 1). Intestinal site affected the mucosal expression of genes for GLUT2, MCT1, SMCT, GIP and GLP1, which was greater (P<0.05) in the jejunum compared with the cecum, whereas the expression of SGLT1 was similar at both intestinal sites (Figure 2; Table 4). The EMS diet further up-regulated (P<0.05) the mucosal expression of both incretins (i.e. GIP and GLP1) in the jejunum by ~50% compared with the CON diet, but not in the cecum (Figure 2; Table 4). Likewise, the expression of SMCT was up-regulated (P<0.05) by about 50% in the jejunum with the EMS diet compared with the CON diet, whereas the expression of MCT1 was similar for both diets.
Relative expression of target genes in jejunal mucosa of pigs fed the enzymatically modified starch (EMS; ■) diet and control (□) diet. Trend for diet effect is indicated by *P<0.10. (a) Relative intestinal alkaline phosphatase (ALPI) expression; and (b) relative brush-border enzymes maltase-sucrase (SI) expression.

Relative expression of target genes in jejunal and cecal mucosa of pigs fed the enzymatically modified starch (■) diet and control (□) diet. (a) Relative solute carrier family 5 (sodium/glucose cotransporter), member 1 (SGLT1) expression; (b) relative solute carrier family 2 (facilitated glucose transporter), member 2 (GLUT2) expression, intestinal site, P<0.001; (c) relative monocarboxylate transporter 1 (MCT1) expression; (d) relative sodium-coupled monocarboxylate transporter (SMCT) expression; (e) relative glucagon-like peptide-1 (GLP1) expression; (f) relative gastric inhibitory polypeptide (GIP) expression. Statistical significance of diet effect is indicated by *P<0.05. Gut site affected the expression of GLUT2, SMCT, GLP1 and GIP (P<0.05) and of MCT1 (P=0.05).

Relative expression of genes in hepatic tissue of pigs fed the enzymatically modified starch (EMS) diet or control (CON) diet

PCK1=phosphoenolpyruvate carboxykinase 1; FASN=fatty acid synthase; PPARγ=peroxisome proliferator-activated receptor γ; SREBP1=sterol regulatory element-binding protein 1.
Main effects and interactions for the relative expression of genes in jejunal and cecal mucosa of pigs fed the enzymatically modified starch diet or control diet

GLUT2=solute carrier family 2 (facilitated glucose transporter), member 2; MCT1=monocarboxylate transporter 1; SMCT=sodium-coupled monocarboxylate transporter; GLP1=glucagon-like peptide-1; GIP=gastric inhibitory polypeptide.
Serum parameters
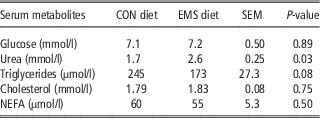
Serum urea-N concentration was 50% higher (P=0.029) in pigs fed the EMS diet compared with pigs fed the CON diet (Table 5). Serum glucose, cholesterol and NEFA concentrations did not differ between diets, whereas serum triglycerides showed a trend (P=0.08) to be decreased by 30% in pigs fed the EMS diet compared with their counterparts fed the CON diet.
Serum parameters of pigs fed the enzymatically modified starch (EMS) diet or control (CON) diet

NEFA=non-esterified fatty acids.
Multivariate and correlation analysis
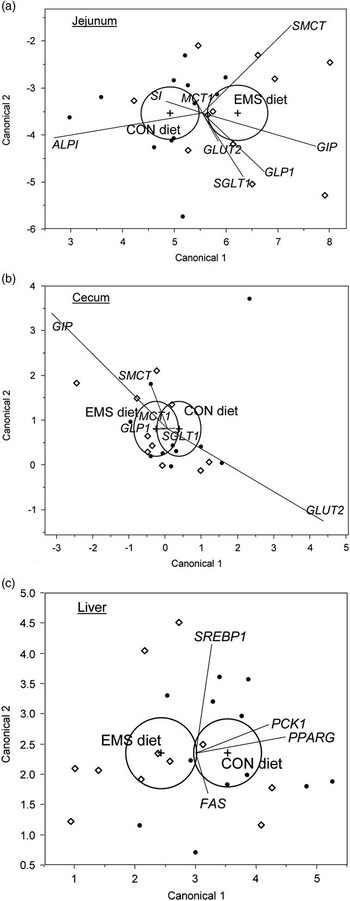
Linear discriminant analysis showed distinctive clustering of mucosal gene expression between the EMS diet and the CON diet in jejunum (Figure 3a), whereas 95% confidence intervals for gene expression in cecal mucosa (Figure 3b) and liver overlapped (Figure 3c). Jejunal expression of GLUT2, SGLT1, GLP1, GIP and SMCT discriminated best for the EMS diet, whereas SI, ALPI and MCT1 correlated more to the CON diet (Figure 3a).
Linear discriminant analysis of the enzymatically modified starch (EMS) diet and control (CON) diet and data for gene expression in (a) jejunum, (b) cecum and (c) liver of pigs (n=23). Circles indicate 95% confidence intervals. ●=CON diet; ◇=EMS diet; SMCT=sodium-coupled monocarboxylate transporter; SI=brush-border enzymes maltase-sucrase; MCT1=monocarboxylate transporter 1; ALPI=intestinal alkaline phosphatase; GLUT2=solute carrier family 2 (facilitated glucose transporter), member 2; GIP=gastric inhibitory polypeptide; GLP1=glucagon-like peptide-1; SGLT1=solute carrier family 5 (sodium/glucose cotransporter), member 1; SREBP1=sterol regulatory element-binding protein 1; PCK1=phosphoenolpyruvate carboxykinase 1; PPARG=peroxisome proliferator-activated receptor γ; FAS=fatty acid synthase.

Discussion
The present results showed that feeding growing pigs with a diet containing EMS increased feed intake and modified the jejunal, but not cecal, expression of incretins and of the SCFA transporter SMCT, which was in contrast to previous findings for slowly digestible starches and RS (e.g. Woodward et al., Reference Woodward, Regmi, Gänzle, van Kempen and Zijlstra2012; Haenen et al., Reference Haenen, Zhang, Souza da Silva, Bosch, van der Meer, van Arkel, van den Borne, Pérez Gutiérrez, Smidt, Kemp, Müller and Hooiveld2013). Clustering of diets in the LDA score plots supported that EMS consumption predominantly affected jejunal mucosal expression of target genes and serum parameters, whereas EMS effects were less pronounced for hepatic and cecal mucosal gene expression.
The higher DM intake of pigs fed the EMS diet to gain equal weight than pigs fed the CON diet (Metzler-Zebeli et al., Reference Metzler-Zebeli, Hollmann, Sabitzer, Podstatzky-Lichtenstein, Klein and Zebeli2015c) indicated reduced digestibility of the EMS diet. The increased α-1,6-branching in the EMS was assumed to increase the packaging of the glucose molecules; thereby reducing the accessibility for α-amylase. Isomaltase activity at the brush-border membrane cleaves α-1,6-glycosidic linkages (Sim et al., Reference Sim, Willemsma, Mohan, Naim, Pinto and Rose2010). However, neither this enzyme nor epithelial glucose transport were affected by EMS feeding at gene expression level. It is feasible that the higher DM intake of pigs fed the EMS diet may have balanced the expression of target genes and hence masked potential changes in jejunal and cecal gene expression between diets. However, in the practical feeding situation and in humans, diets would be offered ad libitum or in meals. Contrary to our observation, Woodward et al. (Reference Woodward, Regmi, Gänzle, van Kempen and Zijlstra2012) found up-regulated SGLT1 expression at the ileal mucosa in growing pigs fed diets containing slowly digestible pea and corn starches compared with pigs fed rapidly digestible rice starch. Many dietary factors modulate the mucosal ALPI expression directly or indirectly via changes in the intestinal microbial composition (Lallès, Reference Lallès2014). Accordingly, the up-regulated jejunal expression of ALPI may have indicated changes in the jejunal microbial community in pigs fed the EMS diet compared with those fed the CON diet.
An estimated 60% of the intestinal SCFA uptake occurs via simple diffusion, whereas the remainder and lactate are actively taken up by the enterocyte via SMCT and MCT1, 2 and 4 (Cuff and Shirazi-Beechey, Reference Cuff and Shirazi-Beechey2004; Halestrap et al., Reference Halestrap and Meredith2004; Iwanaga et al., Reference Iwanaga, Takebe, Kato, Karaki and Kuwahara2006; Sepponen et al., Reference Sepponen, Ruusunen, Pakkanen and Pösö2007). The intestinal SCFA transporter expression is substrate induced and should therefore respond to changes in luminal SCFA concentrations (Sepponen et al., Reference Sepponen, Ruusunen, Pakkanen and Pösö2007). Only the expression of SMCT was up-regulated in pigs fed the EMS diet which might have indicated a greater SCFA or lactate availability in the upper small intestine. Unfortunately, we did not collect jejunal digesta to measure SCFA concentrations to prove the above-mentioned associations. Equal expression of SCFA transporters in the cecum, however, did not correspond to the decreased luminal SCFA concentration in pigs fed the EMS diet compared with those fed the CON diet (Metzler-Zebeli et al., Reference Metzler-Zebeli, Hollmann, Sabitzer, Podstatzky-Lichtenstein, Klein and Zebeli2015c). Moreover, it needs to be considered that modifications at translational level or post-translation may have altered the observations made at transcriptional level. Contrary to our findings, Woodward et al. (Reference Woodward, Regmi, Gänzle, van Kempen and Zijlstra2012) observed down-regulated ileal and up-regulated colonic expression of MCT1 as well as down-regulated colonic SMCT expression in pigs fed slowly digestible pea and corn starches compared with rapidly digestible rice starch. Likewise, Haenen et al. (Reference Haenen, Zhang, Souza da Silva, Bosch, van der Meer, van Arkel, van den Borne, Pérez Gutiérrez, Smidt, Kemp, Müller and Hooiveld2013) found an up-regulation of cecal MCT1 expression but not of SMCT by retrograded tapioca starch compared with pre-gelatinized potato starch when comparing transporter expression at 10 different sites of the small and large intestines. In both studies, elevated SCFA concentrations either in colonic or cecal digesta could explain the up-regulation of MCT1 expression (Woodward et al., Reference Woodward, Regmi, Gänzle, van Kempen and Zijlstra2012; Haenen et al., Reference Haenen, Zhang, Souza da Silva, Bosch, van der Meer, van Arkel, van den Borne, Pérez Gutiérrez, Smidt, Kemp, Müller and Hooiveld2013).
Glucose and luminal SCFA induce expression of GLP1 and GIP in L- and K-cells of the intestinal mucosa (Zhou et al., Reference Zhou, Hegsted, McCutcheon, Keenan, Xi, Raggio and Martin2006; Nøhr et al., Reference Nøhr, Pedersen, Gille, Egerod, Engelstoft, Husted, Sichlau, Grunddal, Poulsen, Han, Jones, Offermanns and Schwartz2013; Pluske, 2013). The up-regulated expression of GLP1 and GIP at the jejunal mucosa of pigs fed the EMS diet might have therefore indicated greater jejunal glucose and SCFA concentrations compared with pigs fed the CON diet. Both incretins are potent antihyperglycemic hormones, inducing glucose-dependent stimulation of insulin secretion while suppressing glucagon secretion (Zhou et al., Reference Zhou, Hegsted, McCutcheon, Keenan, Xi, Raggio and Martin2006; Den Besten et al., Reference Den Besten, Bleeker, Gerding, van Eunen, Havinga, van Dijk, Oosterveer, Jonker, Groen, Reijngoud and Bakker2015b). Serum glucose was similar among pigs at the time of sampling. As glucose was only determined in peripheral blood and not in portal venous blood, the serum results have less explanatory power. Yet, when comparing the present results with the previously reported serum metabolites (Metzler-Zebeli et al., Reference Metzler-Zebeli, Mann, Ertl, Schmitz-Esser, Wagner, Klein, Ritzmann and Zebeli2015a), the potentiating effect of intestinal incretins on glucose-stimulated insulin secretion (Baggio and Drucker, Reference Baggio and Drucker2007) may explain the more pronounced immediate insulin response with the EMS diet compared with the CON diet in our previous study.
Many hormones and nutrients modulate lipogenesis via SREBP1 and PPARγ in hepatic and adipose tissue (Soares et al., Reference Soares, Murhadi, Kurpad, Chan She Ping-Delfos and Piers2012). The down-regulated expression of PPARγ might therefore partly explain the EMS-related reduction in postprandial serum triglycerides in our current and previous study, as well as the modification of fasting and postprandial phospholipid metabolome in our previous study (Metzler-Zebeli et al., Reference Metzler-Zebeli, Mann, Ertl, Schmitz-Esser, Wagner, Klein, Ritzmann and Zebeli2015a). As a potential underlying mechanism, intestinal SCFA interact in the signaling cascade via repression of hepatic PPARγ and SREBP1 expression and activation of AMP-activated protein kinase (Den Besten et al., Reference Den Besten, Gerding, van Dijk, Ciapaite, Bleeker, van Eunen, Havinga, Groen, Reijngoud and Bakker2015a). Moreover, pigs fed the EMS diet had an elevated serum urea concentration, possibly indicating an up-regulation of the urea cycle and increased utilization of amino acids as energy source.
In conclusion, present results showed that EMS mainly up-regulated jejunal expression of SMCT, intestinal incretins and, as trend, of ALPI, but not in the cecum. The jejunum may be therefore one of the target sites to influence the intestinal epithelium by EMS feeding. At metabolic level, EMS down-regulated hepatic PPARγ expression which might have caused the trend for lower serum triglycerides. Whether elevated serum urea may indicate greater energy use in pigs fed the EMS diet should be verified in further research.
Acknowledgments
This work was supported by the Austrian Research Promotion Agency (FFG), BRIDGE project no. 836447 – ‘Healthy Carbohydrates.’ The authors thank M. Hollmann, A. Dockner, M. Wild and S. Sharma of the Institute of Animal Nutrition and Functional Plant Compounds for assistance with sampling and technical assistance. The authors also thank Agromed Austria GmbH (Kremsmünster, Austria) for providing FibroCell M1. The Agrana Research & Innovation Center GmbH provided support in the form of salaries for authors D. G. and T. M. The funders had no role in study design, data collection and analysis, decision to publish or preparation of the manuscript.