Introduction
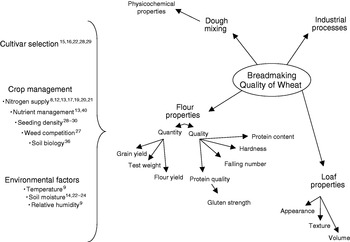
There are a number of factors used to evaluate bread quality, such as flavour, nutritional value, texture and colorReference Cauvain and Cauvain1. In combination with industrial processes (e.g., milling and baking), wheat flour properties, dough mixing abilities and loaf characteristics are determinants of bread qualityReference Cauvain and Cauvain1. These determinants can be further broken down into categories and are often evaluated in terms of breadmaking potential using a variety of tests (Figure 1).
Flow chart describing components that determine breadmaking quality and mediating influences of cultivar selection, crop management and environmental factors.

Cultivars of the Canadian Western Hard Red Spring (CWRS) class of wheat are the most widely grown in western Canada; comprising about 83% of the hexaploid wheat area in the region, and generating $3 billion in gross revenue in 19982. CWRS wheat is recognized as premium quality wheat, ideal for breadmaking due to its superior milling qualities, baking characteristics and protein content3. It is ideal for use in the production of high-volume pan breads, and it is commonly utilized, either alone or in mixture with weaker wheats, in the production of hearth breads, noodles, flat breads and steam breads3. A number of analytical procedures are used in the evaluation of each new CWRS cultivar in order to ensure conformity with Canadian industrial quality standards. The Canadian Grain Commission divides these tests into two main categories, (1) wheat tests, including protein content, test weight, flour yield, kernel hardness, falling number and sodium dodecyl sulfate sedimentation (SDSS), and (2) flour tests, including ash content, gluten index, extensigraph, amylograph, farinograph and mixograph testsReference Williams4.
Grain protein content is one of the main factors influencing wheat quality and is a valuable predictor of overall breadmaking qualityReference Ohm and Chung5,Reference Souza, Martin, Guttieri, O'Brien, Habernicht, Lanning, McLean, Carlson and Talbert6. It is the protein portion that gives the strength to the dough, allowing it to trap CO2 gases produced during fermentationReference Gooding, Cannon, Thompson and Davies7. For breadmaking, protein contents ranging from 10.5 to 13.5% are most desirableReference Williams4. Wheats with lower than 10% protein are often used for making cakes, cookies and crackers, or are blended with grain containing higher than 14% protein. Test weight is used to indicate the density and soundness of the wheat, and generally high test weights (>75 kg hl−1) are desirable. Flour yield is another important consideration and a simple measure of milling quality. A high flour yield is approx. 78%. Kernel hardness is usually expressed in terms of Particle Size Index (PSI). CWRS cultivars usually fall between 50 and 55 PSI. Harder kernels require more energy to break down into flour thereby increasing the amount of damaged starch granules in the flour, influencing gas production and flour water absorption. Falling number is an indicator of the sprouting resistance of the wheat. Sprouting can cause the release of large amounts of normally absent α-amylase into the kernel, ultimately altering its water holding properties. A falling number above 400 is indicative of a sound starch with little or no α-amylase presentReference Williams4.
The SDSS test is used to distinguish wheat genotypes with superior gluten strength and is commonly referred to as an indicator of protein quality and overall end-use potentialReference Gooding, Davies, Thompson and Smith8,Reference Peterson, Graybosch, Shelton and Baenziger9. SDSS tests give a measure of high molecular weight proteins, mainly glutenins, present in wheat flourReference Gooding, Cannon, Thompson and Davies7. Sedimentation volumes range from 15 ml in wheat with weak gluten to 80 ml in wheats with strong gluten; CWRS wheats typically fall between 55 and 60 ml. The mixograph is one of many physical dough-testing instruments available in order to predict the behavior of dough mixing properties of wheat cultivarsReference Khatkar, Bell and Scholfield10. The mixograph tests the physicochemical properties of dough, which are strongly related to gluten propertiesReference Williams4.
Grain protein content is the most commonly studied parameter of wheat quality. Both grain protein content and overall bread quality are affected by genotype and environment (e.g., year, temperature, rainfall and soil nutrient management)Reference Souza, Martin, Guttieri, O'Brien, Habernicht, Lanning, McLean, Carlson and Talbert6,Reference Fowler and Kovacs11–Reference Rharrabti, Royo, Villegas, Aparicio and García14 (Figure 1). Fowler and De la RocheReference Fowler and De la15 reported significant differences among Canadian spring wheat cultivars for test weight, protein content, flour yield and for some mixograph parameters. Preston et al.Reference Preston, Hucl, Townley-Smith, Dexter, Williams and Stevenson16 reported genotypic differences in kernel hardness, protein content, and physical flour properties of CWRS wheats, and that environment had the largest effect on protein content. Similarly, Fowler and De la RocheReference Fowler and De la15 reported that the effect of environment was the main contributor to variation in yield and protein content in Canadian spring wheat. Variation among environments can be due to climatic and/or management factors. The most important management and climatic effects on protein content are nitrogen fertilizers and soil moistureReference Fowler and De la15,Reference Randall, Freney, Smith, Moss, Wrigley and Galbally17,Reference Shier, Kelman and Dunson18. Grain protein content of wheat is commonly reported to increase with applications of N fertilizerReference Gooding, Davies, Thompson and Smith8,Reference Randall, Freney, Smith, Moss, Wrigley and Galbally17,Reference Lloveras, Lopez, Ferran, Espachs and Solsona19, and is lower in nitrogen-deficient soils. In addition to protein quantity, gluten strength (as measured by SDSS) has been positively influenced by increased NReference Gooding, Davies, Thompson and Smith8,Reference Lerner, Seghezzo, Molfese, Ponzio, Cogliatti and Rogers13,Reference Lloveras, Lopez, Ferran, Espachs and Solsona19 and SReference Lerner, Seghezzo, Molfese, Ponzio, Cogliatti and Rogers13 application. Several studies have reported that N fertilizer regimes that increased protein quantity also increased gluten strengthReference Johansson, Prieto-Linde, Svensson and Jönsson12,Reference Ames, Clarke, Dexter, Woods, Selles and Marchylo20,Reference Dexter, Crowle, Matsuo and Kosmolak21. Under moderate drought stress, grain protein concentrations have reportedly increasedReference Rharrabti, Royo, Villegas, Aparicio and García14,Reference Guttieri, Ahmad, Stark and Souza22,Reference Kimball, Morris, Pinter, Wall, Hunsaker, Adamsen, LaMorte, Leavitt, Thompson, Matthias and Brooks23, yet tend to decrease under more extreme moisture deficitsReference Xu and Yu24. This increased protein under limited moisture is thought to be a result of altered starch and protein deposition in the grain, leading to an increase in the ratio of protein to starchReference Jenner, Ugalde and Aspinall25. Researchers in Spain reported that, in addition to protein content, test weight and gluten strength were higher under rainfed conditions compared to irrigated conditionsReference Rharrabti, Royo, Villegas, Aparicio and García14. Another climatic factor, heat stress, appears to be more variable in its effect on grain protein quantity, although it has been reported to have detrimental effects on protein and baking qualityReference Peterson, Graybosch, Shelton and Baenziger9.
Organic cropping systems differ primarily from conventional systems because the use of mineral fertilizers and synthetic chemical pesticides are prohibited. Organic wheat production is becoming more prevalent in Canada, due to an increased consumer demand for organic wheat products. Differences may exist in the baking and milling quality of wheat grown under conventional and organic management, a result of the dissimilarity between organic and conventional soil and crop management practices. Soils of organically managed fields often have lower N levels than their conventional counterparts, which may influence organic grain protein contentReference Nass, Ivany and MacLeod26. Aside from differences in soil N, organic and conventional systems often differ in terms of weed prevalence and diversity, and soil biology, which could influence competition for soil resources (i.e., nutrients and moisture) and stress tolerance. Mason and MadinReference Mason and Madin27 reported variable effects of weed competition on the grain protein content of wheat, while others have reported both improvements and declines in various wheat quality measures with changes in seeding rateReference Bavec, Bavec, Varga and Kovačević28–Reference Gooding, Pinyosinwat and Ellis30. This suggests that both inter- and intra-specific competition effects have the potential to affect wheat quality and should be further studied. The various inputs associated with organic management (e.g., crop residues and animal manure) can greatly increase the biological activity of a soil which can alter nutrient availabilityReference Burger and Jackson31–Reference Emmerling, Udelhoven and Schroder33. Burger and JacksonReference Burger and Jackson31 reported that organic soils receiving inputs of composted manure and harvest residues had a higher N-supplying capacity than conventionally managed soils receiving mineral fertilizers and harvest residues. They also suggested that the supply of N in organic soils extended later in to the growing season than in the conventionally managed soil. In addition, mycorrhizal colonization of wheat has been found to be greater in soils under organic management when compared to conventionally managed soils, and has also been found to moderate yield losses commonly experienced by organic producersReference Mader, Edenhofer, Boller, Wiemken and Niggli34. While mycorrhizae are known largely for their ability to assist in phosphorus uptake, there is evidence that mycorrhizal associations assist in the uptake of N in wheatReference Hawkins, Johansen and George35,Reference Singh and Kapoor36.
Research investigating quality differences between organically and conventionally grown wheat has been conducted in some European nations; however there is no evidence of any research of this kind in Canada to date. Some researchers have observed that grain protein is higher in conventional systems than in organicReference Baeckstrom, Hanell and Svensson37–Reference Starling and Richards39 and biodynamic management systemsReference Granstedt and Kjellenberg40, where no chemical fertilizers or pesticides were used. In contrast, Shier et al.Reference Shier, Kelman and Dunson18 reported no differences in grain protein levels of spring wheat grown in organic and conventional cropping systems, which they attributed to adequate soil nutrient levels in both systems. Similarly, Ryan et al.Reference Ryan, Derrick and Dann41 found no difference in grain nitrogen concentration between organic and conventional sites. Other studies, though not directly comparing organic and conventionally grown grain, have reported grain protein levels in organic systems to be lower than is required for breadmakingReference Gooding, Cannon, Thompson and Davies7,Reference Nass, Ivany and MacLeod26,Reference Storey, Hogan and Humphreys42.
The effect of organic management systems on other wheat quality parameters such as test weight, falling number and flour yield has been less frequently studied. Gooding et al.Reference Gooding, Cannon, Thompson and Davies7 reported that the test weights of several cultivars grown under organic management were adequate for breadmaking (>75 kg hl−1); thus test weight was not a significant constraint to marketing organic bread wheat. Storey et al.Reference Storey, Hogan and Humphreys42 also found test weights of organic wheat to be above 75 kg hl−1. Baeckstrom et al.Reference Baeckstrom, Hanell and Svensson37 and Poutala et al.Reference Poutala, Korva and Varis38 similarly reported that test weights were similar between organic and conventional cropping systems. Storey et al.Reference Storey, Hogan and Humphreys42 reported low Hagberg falling numbers for organically produced winter wheat, while Gooding et al.Reference Gooding, Cannon, Thompson and Davies7 found falling number values of organically grown UK wheat cultivars to be lower than required for breadmaking in many instances. Baeckstrom et al.Reference Baeckstrom, Hanell and Svensson37 reported that Swedish winter wheat cultivars grown under conventional and organic management had similar falling number values. Conversely, Granstedt and KjellenbergReference Granstedt and Kjellenberg40 reported higher falling number values for wheat grown in biodynamic systems and Poutala et al.Reference Poutala, Korva and Varis38 found that falling number values were generally higher under organic cropping systems. Baeckstrom et al.Reference Baeckstrom, Hanell and Svensson37 reported that although conventional values for flour yield were slightly higher in conventional systems, differences were not significant.
The objective of this experiment was to determine if quality differences exist between organically and conventionally grown CWRS cultivars, in order to establish whether high-quality CWRS wheat can be produced on organically managed land. We also wished to determine if any wheat cultivars exhibited different and potentially superior breadmaking potential in organically managed systems, as this would suggest the potential for breeding wheat cultivars especially suited to high quality organic wheat production.
Materials and Methods
Twenty-seven CWRS wheat cultivars representing 114 years of Canadian wheat breeding were grown under both conventional and organic management systems. Field trials were conducted in 2003 and 2004 at the Edmonton Research Station (ERS), Edmonton, AB, Canada (53° 34′N, 113° 31′W) on one organically managed field and one conventionally managed field, located less than 1 km apart. Soils were classified as Orthic Black Chernozemics, typical of central Alberta43.
The experiment was designed as a randomized compete block with four replicates. All plots were seeded at a rate of 300 viable seeds m−2, according to local recommended seeding rates44. In 2003, plot dimensions were 6 m×0.9 m and consisted of four rows spaced approximately 23 cm apart. Plots were seeded using a four row, double disk drill (Fabro Enterprises Ltd, Swift Current, SK, Canada). In 2004, plot dimensions at ERS were 4 m×1.38 m, consisting of six rows spaced approximately 23 cm apart. Plots were seeded using a six row, no-till double disk drill (Fabro Enterprises Ltd, Swift Current, SK, Canada). Seed used each year was increased the previous year at the ERS on conventionally managed land. Seeds were free of disease and therefore did not receive chemical seed treatment prior to seeding. The trials were not irrigated. All trials were planted in May and harvested in early to mid-September.
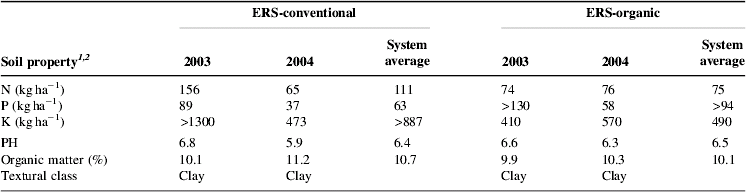
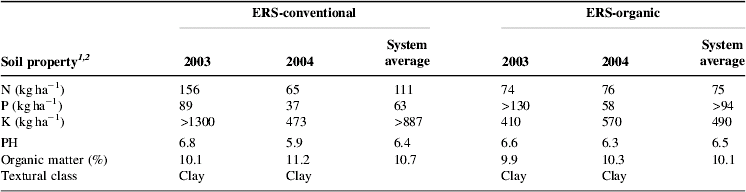
Conventional sites were managed according to local recommendations44,45. Fertilizers were applied following soil fertility testing in early spring. At the 2003 site, fertilizer (90 kg ha−1 N as 46-0-0 and 28 kg ha−1 P as 8-24-24) was broadcast after seeding. At the 2004 site, fertilizer (39 kg ha−1 N as 46-0-0) was banded at a depth of 8.5 cm into the soil in the fall of 2003 and again in spring 2004 (11 kg ha−1 N as 46-0-0 and 6 kg ha−1 P as 8-24-24) prior to seeding. Soil tests were conducted after seeding each year at each site (Table 1). All conventional fields were cultivated and harrowed prior to planting in spring and received recommended rates45 of MCPA Amine 500 to control broadleaf weeds.
Organically managed sites did not receive any applications of chemical fertilizers or herbicides, and were managed in accordance with the guidelines of the Organic Crop Improvement Association International Certification Standards46. The organic sites were situated on a section of land at the ERS that was first designated to be organically managed (no chemical fertilizers or synthetic pesticides) in the spring of 2001. This land received its last application of chemical fertilizer (67 kg ha−1 N as 46-0-0 and 22 kg ha−1 P as 8-24-24) in the fall of 2000. The land was subsequently seeded to winter triticale (Triticale hexaploide Lart.) which was harvested in fall 2001; triticale stubble was left on the field. Prior to the planting of experiments, the organic land was divided into sections which were subsequently managed with different crop rotations.
The 2003 organic site was planted to fall rye in the fall of 2001, which was mowed throughout the summer of 2002. The vegetative fall rye was disked under in the fall of 2002, just prior to an application of composted dairy manure at a rate of 60 t ha−1. In the spring of 2003, the land was cultivated and harrowed just prior to seeding of the 2003 trial. The 2004 organic site was left to triticale stubble in the fall of 2001 and was seeded with berseem clover (Trifolium alexandrinum L.) in the spring of 2002. Extreme drought across the Canadian Prairies in the 2002 growing season caused the clover crop to fail and the land was seeded to fall rye in late summer of 2002. In the summer of 2003, the fall rye was harvested, and the soil was disked and treated with an application of composted dairy manure at a rate of 60 t ha−1. In the spring of 2004, the land was cultivated and harrowed prior to planting. Weeds at both organic sites were manually removed at the 5–6 leaf crop stage in each year, and were subsequently left untouched. Despite the absence of leguminous crops in the rotation, the chernozemic soils typical of north central Alberta have developed under Prairie grassland and are thereby relatively high in fertility and organic matter.
Disease assessments were conducted at all site-years, and very mild and sporadic incidences of powdery mildew (Erysiphe graminis) and stripe rust (Puccinia striiformis) were observed, with no apparent differences between sites or years. Because of the low and infrequent disease incidence, it was determined that no control measures were necessary.
Plots were harvested using a Wintersteiger plot combine following maturity. Grain yield was recorded on a dry weight basis. Harvested grain samples were dried at 60°C for approx. 24 h and weed seeds were removed using a 2 mm mesh sieve (Canadian Standard Sieve Series No. 10). Hectoliter weight (i.e., test weight) was determined from a one pint (473 ml) subsample of plot yield.
Five of the 27 cultivars were chosen for quality analysis, where quality parameters (including test weight) were selected based on their importance in meeting breadmaking quality objectives and their use in the Canadian wheat grading system47,48. The cultivars (Red Fife (released 1885), Marquis (released 1910), Thatcher (released 1935), Park (released 1963) and McKenzie (released 1997)) were chosen as representatives of some of the most important wheat cultivars in the history of CWRS wheat breeding. Grain samples from each replication of the 2003 and 2004 sites were analyzed for breadmaking quality traits at the Cereal Research Centre, Agriculture and Agri-Food Canada, Winnipeg. Grain samples (∼20 g) used to determine wholemeal protein (PRO), PSI and wholemeal SDSS volume were ground using an UDY Cyclone Sample Mill (UDY Corporation, Fort Collins, CO, USA) using a 1.0 mm screen. Wholemeal protein (N×5.7) and PSI were then determined using a 3 g flour sample in an Instalab 600 Series Near-Infrared Reflectance Analyzer (DICKEY-john Corporation, Auburn, IL, USA). SDSS tests were conducted in accordance with Approved Method 56–61A49. Flour Yield was determined using a Brabender Quadrumat Junior Mill (C.W. Brabender Instruments, South Hackensack, NJ, USA) according to the Approved Method 26–5049. Falling number tests were conducted according to Approved Method 56–81B49. All flour tests were expressed on a 14% moisture basis.
Mixograph parameters were determined using a 10 g fixed bowl mixograph (K&S Tool and Die Ltd, Winnipeg, MB, Canada) at 60% water absorption. Automated data collection and analysis were performed as described by Pon et al.Reference Pon, Lukow and Buckley50. Measurements included mixing development time (MDT), peak height, total energy under the graph, energy to peak (ETP), peak bandwidth (PBW) and bandwidth energy.
Analyses of data were performed using the PROC MIXED procedure of SAS51. The experiment was analyzed as a split plot, with management system as the main plot and cultivar as the subplot. Years were treated as blocks and were considered as a random effect in both combined analysis and analysis by management system. Cultivar and management system (where applicable) were considered as fixed effects. Effects were considered significant at P⩽0.10, an appropriate level for an experiment of small sizeReference Steel, Torrie and Dickey52. Data were also analyzed using a fixed effects model, with the PROC GLM procedure of SAS, for the purpose of exploring the percent variation attributable to year, cultivar, management and their interactions. Single degree of freedom contrasts were employed to identify differences in the breadmaking quality of cultivars in conventional versus organic systems. Pearson's coefficients of correlation were computed using genotypic least squares means within each management system (organic and conventional) within the PROC CORR procedure of SAS. Three of the six mixograph parameters, namely peak height, total energy under the graph and bandwidth energy, were found to be non-significant for all effects and are hereafter not discussed.
Results and Discussion
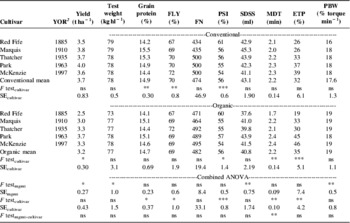
The organic and conventional sites were less than 1 km apart, with similar growing temperatures and precipitation levels within years (Table 2); thus differences between the two systems are likely due to the different management strategies and the resulting differences in nutrient levels (Table 1) and weed pressure. Weed biomass was significantly higher at the organic sites, with an average biomass of 134 g m−2 under organic management and 1.4 g m−2 under conventional management. The main effect of management was significant for grain yield, test weight, SDSS volume and mixograph PBW (Table 3). Management×cultivar interactions were significant for MDT, while cultivar main effects were significant for several traits, including grain protein, flour yield, PSI, MDT and ETP (Table 3).
Precipitation and mean temperature dataFootnote 1 for the 2003 and 2004 growing seasons at ERS, Edmonton, AB, Canada.

1 Data collected by the University of Alberta, ERS.
2 Data from Environment Canada59.
–, Data not available.
Least squares means and analyses of variance of grain yield, test weight, grain protein, wholemeal protein, flour yield (FLY), falling number (FN), PSI, SDSS, MDT, ETP and PBW for CWRS cultivars grown under conventional and organic management in Edmonton, AB, Canada in 2003 and 2004Footnote 1.

1 F values significant at the following levels: ***0.01, **0.05, *0.1. ns denotes non-significance.
2 YOR indicates year of release.
Grain yield was greater under conventional management, with average grain yields of 3.7 t ha−1 compared to 3.2 t ha−1 under organic management (Table 3). Test weight was lower on organic land (77 kg hl−1) compared to conventional (78 kg hl−1). It is likely that the elevated competition with weeds for moisture and nutrients on organic land contributed to lower grain yields and test weights. Many studies conducted on conventional land have reported similar results, where grain yields were reduced by the presence of weeds in the cropReference Mason and Madin27,Reference Das and Yaduraju53,Reference Thompson and Woodward54; however the effect of weeds and the resulting competition for resources on test weight is less clearly defined. Das and YadurajuReference Das and Yaduraju53 reported test weight of wheat was not significantly affected by weed growth and that frequent irrigation increased test weight. They also reported that the effect of chemical N, P and K fertilizers on test weight was significant yet erratic. While test weights in the present study did differ between the two systems, averages for each management system were above the minimum 75 kg hl−1 for a No. 1 CWRS grading. In terms of cultivar averages, only Red Fife under organic management was below the desired level, with an average test weight of 73 kg hl−1, meaning, all other factors remaining equal, that it would receive a No. 2 CWRS grading48.
Mean wholemeal protein content did not differ between conventional and organic management systems (Table 3). This is supported by Shier et al.Reference Shier, Kelman and Dunson18 and Ryan et al.Reference Ryan, Derrick and Dann41, who reported no significant difference between grain protein content of organically and conventionally grown wheat, which Shier et al.Reference Shier, Kelman and Dunson18 attributed to adequate soil N levels in both systems. Conversely, Baeckstrom et al.Reference Baeckstrom, Hanell and Svensson37 and Poutala et al.Reference Poutala, Korva and Varis38 reported higher grain protein concentrations under conventional management than in organic cropping systems. Overall, protein contents were high under both conventional and organic management, at 14.9 and 14.7%, respectively. This level of protein content surpasses the minimum standard of 13.5% protein for CWRS wheat (Table 3), indicating the potential for growing high-quality bread wheat under either management system in north central Alberta. While varietal differences in protein were significant (Table 3), average protein content for all cultivars again exceeded 13.5% protein (data not shown). Marquis achieved the highest protein level, while Red Fife achieved the lowest.
Post-seeding soil tests in the current study indicated that in 2003, the conventional site had greater N levels than the organic site, while in 2004, the organic and conventional sites had similar N content (Table 1). Averaged across years, N content was 75 kg ha−1 in the organic system and 111 kg ha−1 in the conventional system. There are several possible explanations for the relatively high protein levels of the organically grown wheat in the current study, despite comparatively low-soil N concentrations. Crop residues and animal manure can increase soil biological activity, altering the extent and timing of nutrient availabilityReference Burger and Jackson31–Reference Emmerling, Udelhoven and Schroder33. This could be related to mycorrhizal colonization, which has been found to be greater in organic soils than in conventional soilsReference Mader, Edenhofer, Boller, Wiemken and Niggli34. Though these effects were not measured in the present study, the organically managed land did receive applications of composted manure and greater crop residues than the conventionally managed sites.
Crop stress (e.g., limited moisture) has been found to shorten the duration of starch deposition into the wheat kernels, thereby increasing the ratio of protein to starch, ultimately increasing protein percentageReference Jenner, Ugalde and Aspinall25. In the present experiment, it may be that crop weeds created some moisture stress and, despite lower N availability, helped to increase the ratio of protein to starch. Mason and MadinReference Mason and Madin27 reported that the effect of weeds on the protein content of wheat was variable across sites and suggested that the impact of weeds on wheat protein was likely dependent on late season competition between crop and weeds for nitrogen and water, and on the interaction between those factors. Another possible explanation for the relatively high protein content of organic wheat is that the soil analyses may not have adequately described the potential of the soil to supply nitrogen to the crop. Our soil analyses measured nitrate-nitrogen (NO3), which varies with changes in soil temperature, moisture and biological activityReference Wallace55. WallaceReference Wallace55 suggested that analyses of nitrate-nitrogen give an idea of the current, rather than long-term, N status of the soil.
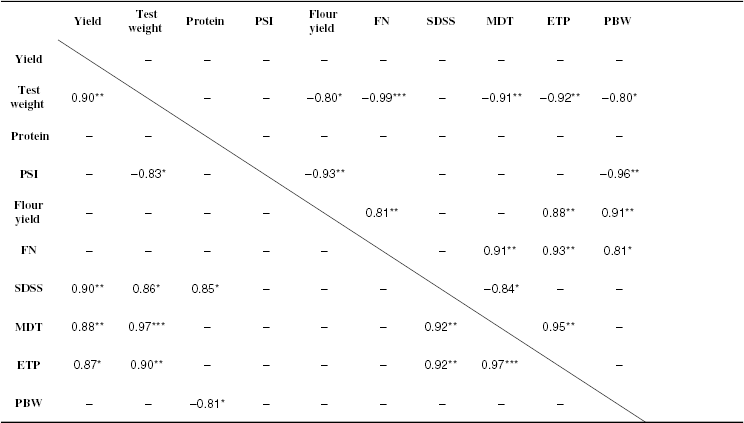
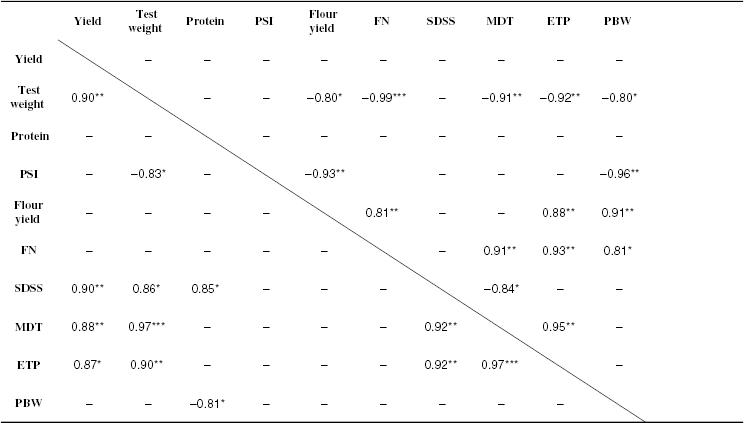
Higher gluten strength, as measured by SDSS, occurred under conventional (43 ml) as opposed to organic (41 ml) management (Table 3). While no studies comparing the quality of organically and conventionally grown wheat have considered SDSS, Gooding et al.Reference Gooding, Davies, Thompson and Smith8, Lloveras et al.Reference Lloveras, Lopez, Ferran, Espachs and Solsona19 and Ames et al.Reference Ames, Clarke, Dexter, Woods, Selles and Marchylo20 reported increases in SDSS volumes with nitrogen fertilization in UK bread wheat, Spanish bread wheat and Canadian durum wheat, respectively. Thus, higher SDSS volumes under conventional management in the current study could be due to higher N availability at conventional sites. Dexter et al.Reference Dexter, Crowle, Matsuo and Kosmolak21 suggested that increases in SDSS volumes from increases in N fertilizer were related to overall increases in protein. Ames et al.Reference Ames, Clarke, Dexter, Woods, Selles and Marchylo20 reported a trend in durum wheat towards higher SDSS volumes with increasing protein. In the current study, SDSS volumes were not related to protein content on conventional land, but were positively associated with protein content on organic land (Table 4). These discrepancies suggest that a difference may exist in the partitioning of high- and low-molecular weight proteins between organically and conventionally grown wheat, which may be related to the stresses associated with organic production.
Genotypic correlations of yield, test weight, protein, PSI, flour yield, falling number (FN), SDSS and mixograph parametersFootnote 1 of five CWRS cultivars, released 1885–1997, grown at conventionally and organically managed sites in 2003 and 2004 at ERS, Edmonton, AB, CanadaFootnote 2,Footnote 3.
1 Mixograph parameters include MDT, ETP and PBW.
2 r values significant at the following levels: ***0.01, **0.05, *0.1. ‘_’ denotes non-significance.
3 Correlations above the diagonal represent conventional management, while those below the diagonal represent organic management.
Average mixograph values for each management system revealed trends toward higher dough strength under organic management (Table 3). The main effect of management on PBW was significant, as was the management×cultivar interaction for MDT. PBW was higher on organic land than conventional, measuring 19 and 17.6% torque min−1, respectively, reflective of stronger glutenic bonds that may be more tolerant to mixing. Examination of the management×cultivar interaction for MDT reveals that organically grown Red Fife performed poorly relative to all other cultivars in either management system, with an MDT of 1.7 min, indicating low dough strength. Conventional Red Fife, with an MDT of 2.1 min, performed equally or better than all but the organic Park and McKenzie, both at 2.4 min. This interaction suggests that it may be possible to select for high-quality wheat cultivars specific to organic environments.
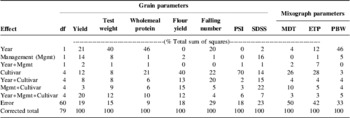
In order to assess the effects of genotypic and environmental factors, we considered year, management system and their interaction as environmental effects, and as expected, cultivar effects in our model are discussed as genotypic effects. Environmental effects (year, management, year×management) accounted for over 35% of the variation in grain yield, test weight, wholemeal protein and PBW (Table 5). Fowler and De la RocheReference Fowler and De la15 reported that yield, test weight and protein exhibited the largest response to environment, while Preston et al.Reference Preston, Hucl, Townley-Smith, Dexter, Williams and Stevenson16 similarly suggested that flour protein was most influenced by environment. The effect of year was more prominent than the effect of management system, which contributed less than 10% of the variation in all traits except for yield (14%) and SDSS volume (16%) (Table 5). Fowler and De la RocheReference Fowler and De la15 reported that SDSS volume was influenced equally by genotype and environment, and our results indicate a similar outcome for both SDSS and falling number. Of the three mixograph parameters measured, MDT and ETP were more influenced by genotype than by environment, representing the possibility for achieving high-breadmaking quality on organic land (Table 5). Fowler and De la RocheReference Fowler and De la15 reported that MDT showed a high degree of heritability compared to the influence of environment, although the effects of genotype and environment on other mixograph parameters in that study were less clearly defined. MDT has been reported to be strongly associated with farinograph dough development time and stabilityReference Kaur, Lukow, Preston and Malcolmson56, and a study of CWRS wheat by Preston et al.Reference Preston, Hucl, Townley-Smith, Dexter, Williams and Stevenson16 suggested that farinograph dough development time and stability were mainly influenced by genotype. Cultivar main effects accounted for less than 25% of the variation in four of the six remaining breadmaking quality traits; however cultivar effects were considerable for PSI (kernel hardness) and flour yield (Table 5). Fowler and De la RocheReference Fowler and De la15 reported a larger genetic influence than environmental for kernel hardness and flour yield, and Preston et al.Reference Preston, Hucl, Townley-Smith, Dexter, Williams and Stevenson16 reported genotype to be the main contributor to kernel hardness, although they reported the effect of environment to be significant as well.
Percent sums of squares (using fixed effects analyses of variance) for the grain parameters yield, test weight, wholemeal protein, flour yield, falling number, PSI and SDSS and for the mixograph parameters MDT, ETP and PBW.

Note: Corrected totals may not sum to 100% due to rounding.
Grain yield was positively associated with test weight, SDSS volume, MDT and ETP under organic management, but not under conventional management, suggesting that cultivars that yield well on organic land also possess higher breadmaking quality (Table 4). This may be related to varietal ability to withstand stresses associated with organic management, since the same relationships were not observed in the relatively low-stress conventional system. Test weight was found to be negatively associated with flour yield, falling number, MDT, ETP and PBW on conventional land, while it was positively related to SDSS volume, MDT and ETP on organic land. If varieties that are capable of attaining high-grain yield and test weight under organic management are consistently found to have high-breadmaking quality, selection of high-quality wheat for organic production could be simplified.
Within the conventional management system, the main effect of cultivar was significant for wholemeal protein, flour yield and PSI (kernel hardness), with Red Fife among the lowest in protein and flour yield, with the softest kernels (Table 3). Under organic management, cultivars differed for grain yield, PSI, MDT and ETP, again with Red Fife having the lowest grain yield, MDT, ETP, and the softest kernels (Table 3). In both systems, Park and McKenzie were the superior cultivars, while Red Fife appeared to be the least suitable cultivar for breadmaking of the five cultivars tested, suggesting that older CWRS cultivars may not be suitable for breadmaking by today's conventional breadmaking standards. However Marquis and Thatcher, released in 1910 and 1935, respectively, had some of the highest protein contents under conventional management, while McKenzie, released in 1997, was among the lowest (yet adequate) in protein content. Further, Park was released in 1963 and could hardly be considered a ‘modern’ wheat cultivar. In a study of 14 CWRS cultivars released from 1981 to 1995, Preston et al.Reference Preston, Hucl, Townley-Smith, Dexter, Williams and Stevenson16 reported no trends in quality parameters, including protein content, between registration date and cultivar. A study by Wang et al.Reference Wang, McCaig, DePauw, Clarke and Clarke57 on the semi-arid Prairies indicated that Marquis had significantly lower protein content than newer cultivars released 1996–1999, primarily due to more efficient utilization of plant N, rather than increased N uptake by the newer cultivars. However, it is possible that this relationship may be altered by increased soil moisture levels.
There were few differences in the performance of individual cultivars in the two systems, excepting Red Fife. Red Fife was the oldest cultivar (released 1885), and it exhibited higher test weight, SDSS, MDT and ETP under conventional when compared to organic management (Table 3). The PBW of Red Fife was higher under organic management. In general, our results suggest that protein quality of Red Fife was higher under conventional management. Marquis (released in 1910) had lower MDT time under conventional management versus organic, reflecting higher breadmaking quality under organic management. The cultivar Thatcher (released in 1935) did not perform differently between the two management systems. Park (released in 1963) exhibited significantly higher SDSS volume under organic management, indicating higher breadmaking quality. McKenzie (released in 1997) produced higher flour yield under conventional management. The variability of the performance of these cultivars within the two systems allows us to conclude that older cultivars do not necessarily perform better on organic land in terms of breadmaking quality.
Conclusions
Grain yield and test weight were higher on conventional land when compared to organic; however protein content did not differ between the two systems, despite the probability that overall N availability was higher at the conventional sites. Despite existing differences between management systems and cultivars, test weight and protein content were sufficiently high in both management systems to meet the grading requirements for CWRS wheat. Gluten strength, as measured by SDSS volume, was improved under conventional management, possibly as a result of higher overall N availability. The trend towards enhanced dough strength of organically grown cultivars, as determined through the use of the mixograph, requires further examination. Overall, the results of this study suggest that organically managed CWRS wheat varieties are capable of achieving good breadmaking quality. The significant management×cultivar interaction for MDT indicates that some cultivars may be able to achieve higher breadmaking quality when grown on organic land than if grown on conventional land, and implies that breeding specifically for high-quality organic wheat production may be possible. Grain yield, test weight and protein content were largely determined by environment, while flour yield, kernel hardness, MDT and ETP were more influenced by genotypic factors. Falling number and SDSS volume were similarly influenced by genotype and environment. The cultivar Red Fife, released in 1885, had the poorest breadmaking quality of the five cultivars studied, while the most modern cultivars, Park and McKenzie, had the highest quality. This suggests that the oldest CWRS cultivars may not be suitable for breadmaking, regardless of management system. The variable performance of old and new cultivars under different management regimes indicated that older cultivars, while selected prior to the widespread use of pesticides and fertilizers in breeding programs, may not be better suited to organic production.
Acknowledgements
The technical assistance of Byron Cordero, Amy Kaut, Dione Litun, Dan Stanton and Klaus Strenzke is gratefully acknowledged. This research has been supported by the Canadian Wheat Board, the Organic Agriculture Centre of Canada (OACC), the Alberta Crop Industry Development Fund, the Alberta Agricultural Research Institute, check-off funds provided through the Western Grains Research Foundation and a Natural Sciences and Engineering Research Council of Canada (NSERC) Discovery Grant.