

Introduction
The profound worldwide transformations in the agricultural sector in the second half of the twentieth century have generated enormous academic interest. Diverse scientific perspectives have been employed to analyse some of the most notable aspects of these transformations, such as technological change, including the significance and consequences of the Green Revolution, increases in production, changes in social relationships, evolution of property distribution, and attempts at agrarian reform – or, more broadly, to analyse the development of rural societies.
Today, the Latin American agricultural sector continues to play an influential role in the economic growth of this world region. However, despite the improvements that took place in the second half of the twentieth century, the sector in this region still lags behind those of developed countries in terms of productivity levels.
Within this context, the objective of this article is to analyse the case of Latin American countries. More precisely, it seeks to examine the principal dynamics of the agricultural sector of this world region, and specifically the sources of agricultural production growth in the second half of the twentieth century.Footnote 1 To this end, our aim is to explain the 3 per cent annual growth rate over the last 60 years of agricultural production in Latin America. We wish to determine whether the process was a response to increases in the use of factors of production, and which of these have been most important, or whether it was due to efficiency gains and increases in the total factor productivity (TFP)Footnote 2 of Latin American countries. Therefore, it is necessary to calculate the increase in the use of inputs in the agricultural sector, as well as the gains in TFP.
Due to the difficulty arising from not having data available for all the variables for the complete period 1950–2008, we have had to omit certain medium-sized and small countries from the study. However, the countries included in the analysis (Argentina, Brazil, Chile, Colombia, Honduras, Mexico, Panama, Peru, Uruguay and Venezuela) represent the vast majority of Latin American agriculture, given that between 1965 and 2005 they accounted for between 85 and 90 per cent of its gross agricultural production.
To achieve the objectives proposed a quantitative database was constructed upon which to base our analyses. It is largely derived from Food and Agriculture Organization (FAO) statistics, although a series of estimates also had to be made, particularly for the 1950s (see the online Appendix).Footnote 3 For the most part we calculated the evolution of agricultural production and use of inputs. It was thus possible to calculate total TFP, and thereby determine to what extent increases in production are explained by an increase in factors or by an improvement in efficiency.
Previous studies have calculated TFP in Latin America from 1960 onwards, or, more often, for the period after 1970.Footnote 4 Nevertheless, compared with the perspective used in the current study, such research, usually performed by agricultural economists, notably lacks a historical perspective. Its principal objective is to obtain internationally comparable productivity growth rate data and it does not analyse the dynamics which led to such results or the individual contexts of each country, which are key to understanding these results.
Furthermore, unlike our research, there are only a few studies which, from a historical perspective, have paid attention to the evolution of agricultural production in Latin America as a whole,Footnote 5 although there are many that analyse individual countries.Footnote 6 In particular, for the extended time horizon proposed, such studies are rare. Other topics have stimulated greater interest, such as changes in agricultural ownership, attempts at agrarian reform or the development policies implemented and their effects on agricultural sectors.
We believe that it was right to begin our analysis in 1950, as the majority of studies of Latin American agriculture commence in the 1960s and therefore ignore the years immediately following the Second World War. The turning point in the development model of a large part of Latin America – that is, the advent of import substitution industrialisation (ISI) policies – occurred at exactly this time, so our study period enables us to analyse the early years of ISI and the state's increasing intervention in the economy.
In view of the above, we believe that our approach makes an important contribution to the study of the historical evolution of Latin American agricultural production during a key period of its transformation as it offers a much wider time horizon than any other study, it analyses a very extensive sample of countries, and it takes a far-reaching historical perspective.
Obviously, as our study takes a country-level macroeconomic approach, it has important limitations. For example, it cannot account for the extent to which growth in agricultural production or agricultural development strategies have led to poverty reduction or an improvement in the income of the least favoured rural sectors. However, recent studies provide satisfactory approaches in this respect.Footnote 7
Following this introduction, the next section analyses the development of Latin American agriculture, in terms of agricultural production, the use of factors of production (inputs) and TFP. The third section discusses our periodisation. We then explain the evolution of the main trends in agricultural production throughout the second half of the twentieth century in Latin American countries. The following section studies the evolution of the use of factors of production. The role of TFP in the growth of agricultural production throughout the three periods studied in the different countries is addressed in the sixth section, and the article ends with our conclusions.
Sixty Years of Latin American Agricultural Production
Production
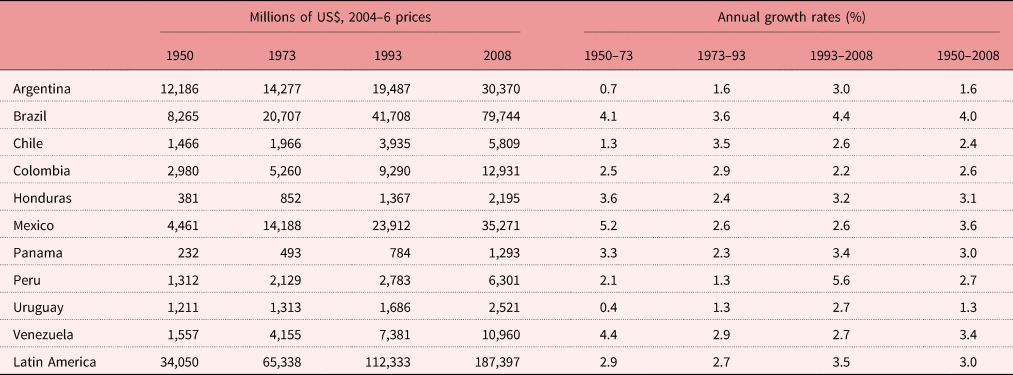
Latin American agricultural production experienced an unprecedented expansion from the 1950s onwards, with an average annual growth rate of 3.0 per cent. In other words, it multiplied by five and a half times in 58 years (see Table 1 and Figure 1). Especially noteworthy are the cases of Brazil and Mexico, which grew at average annual rates of 4.0 and 3.6 per cent respectively, leading the expansion throughout the whole period, although with different characteristics. While Brazil became one of the world leaders in the production of agricultural and livestock commodities at the start of the twenty-first century, Mexico underwent a sharp expansion during the 1950s and 1960s and then slowed down from the 1980s onwards. By contrast, the lowest increases in agricultural production took place in Argentina and Uruguay, with average annual growth of merely 1.6 and 1.3 per cent respectively. These countries specialise in temperate-climate production (livestock, cereals), which displayed great dynamism in the final decades of the nineteenth century and the initial years of the twentieth century, enabling them to reach very high levels of production and use of inputs prior to WWII and consequent low increases in the periods under study.
Gross Agricultural Production, 1950–2008

Note: Triennial averages, except 1950.
Source: See the online Appendix for methodology and sources.
Net Agricultural Production, 1950–2008 (millions of US$, at international 2004–6 prices)

Output growth was very high in the case of products for which domestic demand rose in Latin America (oilseeds, vegetable oils, alcoholic beverages, meat, fruit and vegetables, and dairy products). However, the output of the main agro-export crops grew very slowly.Footnote 8
The composition of production, comprising both crops and livestock, experienced moderate changes in the period. In Latin America, with the exception of Argentina and Uruguay, crops had always accounted for the majority of production, representing, until 1990, approximately 60 per cent of total production, after which its significance fell slightly, to 57 per cent. In both Argentina and Uruguay the share of crops rose. In the former, the production of crops became predominant, rising from over 40 per cent at the beginning of the 1960s to 62 per cent of the total in 2008.Footnote 9 In Uruguay the significance of crops rose, although not to the same extent as in Argentina (between the same dates the latter rose from 19.9 to 32.6 per cent).Footnote 10
Inputs
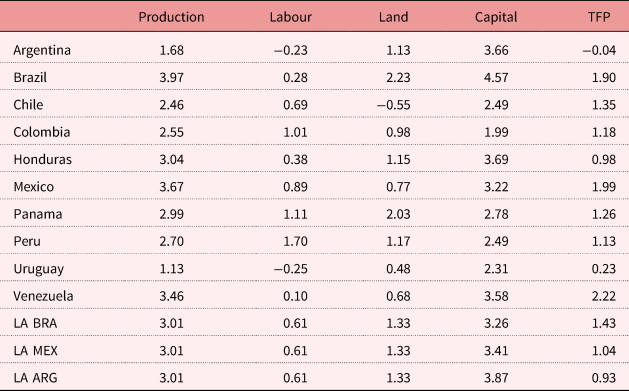
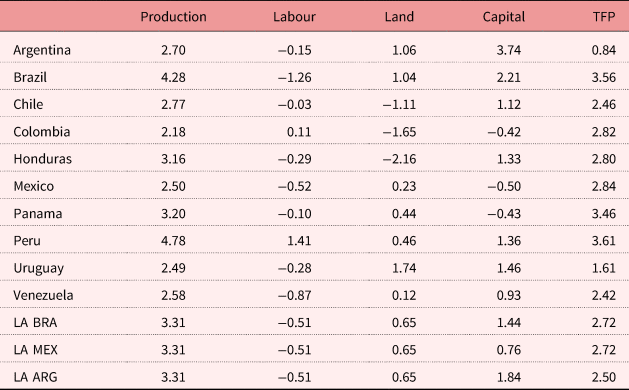
The growth in agricultural production may be due to a greater use of inputs (Table 2). Consequently, we shall proceed to study the incorporation of land, labour and capital into agricultural production.Footnote 11
Annual Average Logarithmic Rates between 1950 and 2008

Notes: LA BRA: Latin America including Brazilian share in the capital and TFP calculation; LA MEX: Latin America including Mexican share in the capital and TFP calculation; LA ARG: Latin America including Argentine share in the capital and TFP calculation.
Source: See the online Appendix for methodology and sources.
The use of land in Latin American agriculture increased by 1.3 per cent annually, doubling between 1950 and 2008. The Latin American pattern resembles that of the developing world and contrasts with that of the developed countries, where agricultural land area decreased in general.
There was a slight slowdown in the growth of the active agricultural population during the period. The supply of new labour-saving technologies, structural change processes and policies to promote industrialisation explain this slower growth.
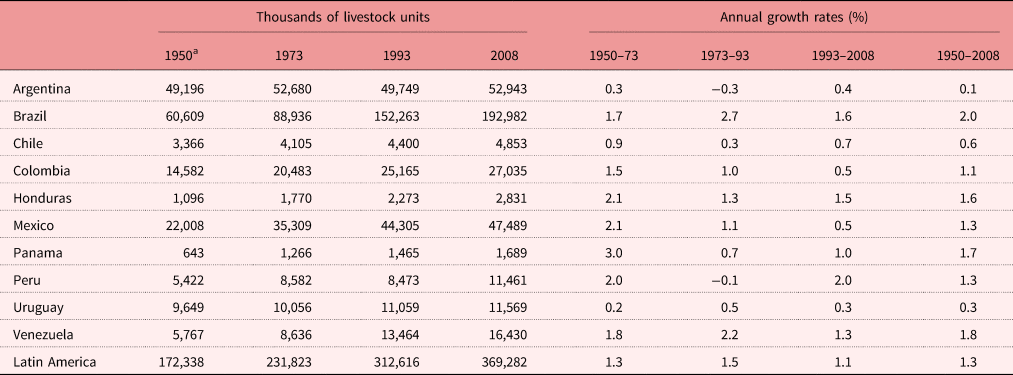
In order to obtain an approximate view of the evolution of the capital employed, we will use two of the principal fixed capital components – head of livestock and agricultural machinery – plus fertilisers and chemical manures as proxies for circulating capital. The increase in livestock was spectacular: the number of heads doubled throughout the period, at an annual rate of over 1.3 per cent. This increase was generalised throughout all Latin American countries, with the exception of Argentina and Uruguay. As we saw earlier, livestock production represented a higher proportion of agricultural activity at an earlier stage in the development of these two countries and so its rate of growth slowed down.
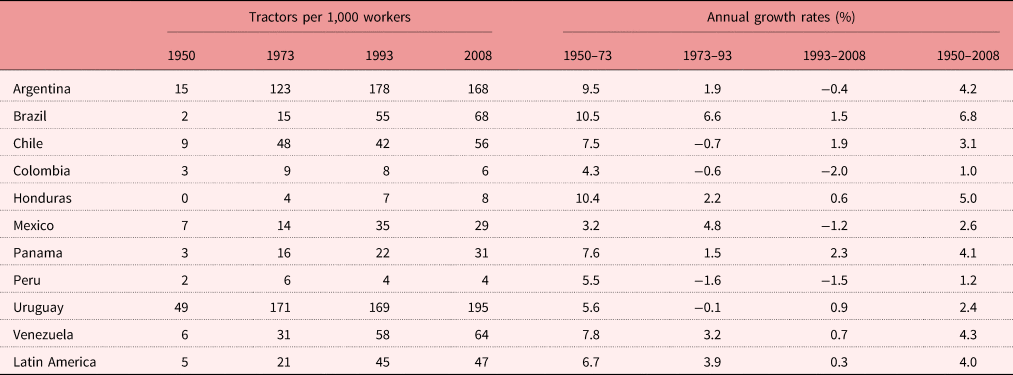
Latin America was not immune to the process of mechanisation taking place during this period. Its impressive growth in the use of tractors, with an annual increase of 4.7 per cent in the region as a whole, was similar to that in other regions of the world. The ratio of tractors to 1,000 workers also shows the importance of the acquisitions of machinery by farms, with growth of over 4.0 per cent annually for the region over the 58 years of our study.
With an average annual growth rate for the region of 7.9 per cent during this period, Latin America joined the global trend of the intense use of chemical products. The level of fertilisers per hectare also shows a considerable expansion in their use, with increases in this ratio of 6.5 per cent annually for Latin America as a whole.
Although the only types of capital which can be quantified are those examined above, we cannot ignore the crucial role played by others, and in particular the new high-yield seeds (HYS), principally the result of the efforts of public agronomic research centres which led to the so-called Green Revolution. Mexico played the leading role from the 1940s onwards with wheat. Although in Latin America the adoption of HYS was somewhat slower than in the Asian countries, such seeds subsequently made a significant contribution to the increase in agricultural yields and productivity.Footnote 12 Thus, for example, it has been estimated that in Brazil the use of HYS raised by 50 per cent, on average, the yields of those crops in which they were introduced between 1991 and 1998.Footnote 13 In addition, a third of the increase in the productivity of Brazilian agriculture between 1970 and 1985 was also due to an increase in the use of HYS.Footnote 14
Total Factor Productivity
TFP is a good indicator with which to approach the measurement of efficiency in the agricultural sector. The measurement proposed follows the methodology of growth accounting. TFP is based on the primary definition of the Solow residual, that is to say, it is calculated as the difference between the growth of output and of a combination of production factors. In this analysis, this combination is formed of the land factor, comprised of an aggregation of rain-fed and irrigated land (arable hectares of land and permanent crops),Footnote 15 labour, and capital, made up of chemical fertilisers, self-propelled machinery and livestock units.Footnote 16 The data that we have used are from FAOSTAT, the FAO and the International Fertilizer Association (IFA).Footnote 17 This combination is a weighted average (the weightings used are those in Tables A.3.1, A.3.2 and A.3.3 of the online Appendix) and are the returns that each factor receives in percentage terms over total production.Footnote 18 We have applied the weightings of Argentina to Argentina, Chile and Uruguay, those of Mexico to Mexico, Colombia, Honduras and Peru, and those of Brazil to Brazil, Panama and Venezuela.
The formula employed to obtain the growth in TFP is that proposed by Fuglie:Footnote 19
 $$\ln \left( {\displaystyle{{{\rm TF}{\rm P}_{i,t}} \over {{\rm TF}{\rm P}_{i, t-1}}}} \right) = \ln \left( {\displaystyle{{Y_{i,t}} \over {Y_{i,t-1}}}} \right)-\mathop \sum \limits_i \lpar {s_{i, j, t}} \rpar \cdot \ln \left( {\displaystyle{{X_{i,j, t}} \over {X_{i, j, t-1}}}} \right)$$
where: Y and X are vectors; s: weightings; i: countries (i = 1, … ,10); j: inputs (j = 1, … , 5).
Table 2 shows the rates of growth in production, inputs and agricultural productivity of Latin America and of the countries analysed.Footnote 20
The impressive rate of production growth (3 per cent annually) was principally driven by the incorporation of inputs into the production process; the most notable role was that of capital, which expanded by more than 3 per cent. The contribution of TFP was modest, although very significant differences are found. Thus, the leading economies in terms of the increase in productive efficiency were Venezuela, Mexico and Brazil, with increases of 2.2, 2.0 and 1.9 per cent. The only countries to distance themselves significantly from the Latin American average were Uruguay and Argentina, where the rates of variation of TFP were very low for the former country and negative for the latter. The remaining countries had values very close to the regional average.
Establishing a Periodisation for the Analysis of Latin American Agriculture
A study such as this – consisting, as it does, of a large number of years and countries – requires a periodisation which allows for a more precise analysis of the evolution of production and its determinants. In order to establish these periods, we have used a series of dates which mark significant moments for the Latin American economy and, most of all, for its economic and agricultural policies. We therefore selected the following years: 1973, the year when the so-called oil crisis began; and 1993, the year from when a widespread change in policies began to overcome the critical situation experienced during the previous years.
The first break, 1973, has a clear analytical significance in Latin American history. After the Arab–Israeli war in 1973, the Organization of Petroleum Exporting Countries (OPEC) was able to impose severe export quotas on its members, and oil prices quadrupled. Those republics that were net importers of oil at the time – all except Bolivia, Colombia, Ecuador and VenezuelaFootnote 21 – suffered a severe reaction to the first oil shock; this constituted a harsh reminder of the limitations that could be placed on economic development by balance-of-payments constraints. The same lesson was driven home even more forcefully by the second oil shock after 1978.Footnote 22 In addition, the industrialisation process reached its peak in Latin America in 1973–4. Until then, the manufacturing sector's share of GDP had climbed steadily, but after these watershed years – and, thus, long before the collapse triggered by the debt crisis – the region's industrialisation coefficient began to decline.Footnote 23 The crisis, however, was longer and more acute than expected, and, in fact, the 1980s became known in Latin America as the ‘lost decade’.
By the mid-1980s, most scholars were certain that the crisis was going to be long-lived and some argued that a deep transformation in the development pattern was necessary.Footnote 24 The policies that were suggested – and even imposed in the context of international agreements – and that eventually became known as the Washington Consensus are, therefore, the result of the need for a new development strategy that implied deep changes in the pace of the structural reforms in the region. It is not possible to find a year that defines the widespread adoption of these policies. Therefore, in order to establish a criterion which divides the period as a whole, we empirically and econometrically observed when a structural change occurred in Latin American agricultural production taken together. We performed the test proposed by Mohitosh Kejriwal and Pierre Perron that uses a sequential procedure to determine the number of breaks in trend with an integrated or stationary noise component.Footnote 25 This approach showed that there was a structural break in 1993, and we used this year as the starting point of our last period.
In this way, three periods are distinguished: the implementation phase of ISI policies (1950–73),Footnote 26 a second period comprising the years of the oil and foreign debt payment crises and the initiation of economic stabilisation programmes (1973–93) and, finally, the phase of structural reformsFootnote 27 and reintegration into international trade until the beginning of the international economic crisis of 2008 (1993–2008).
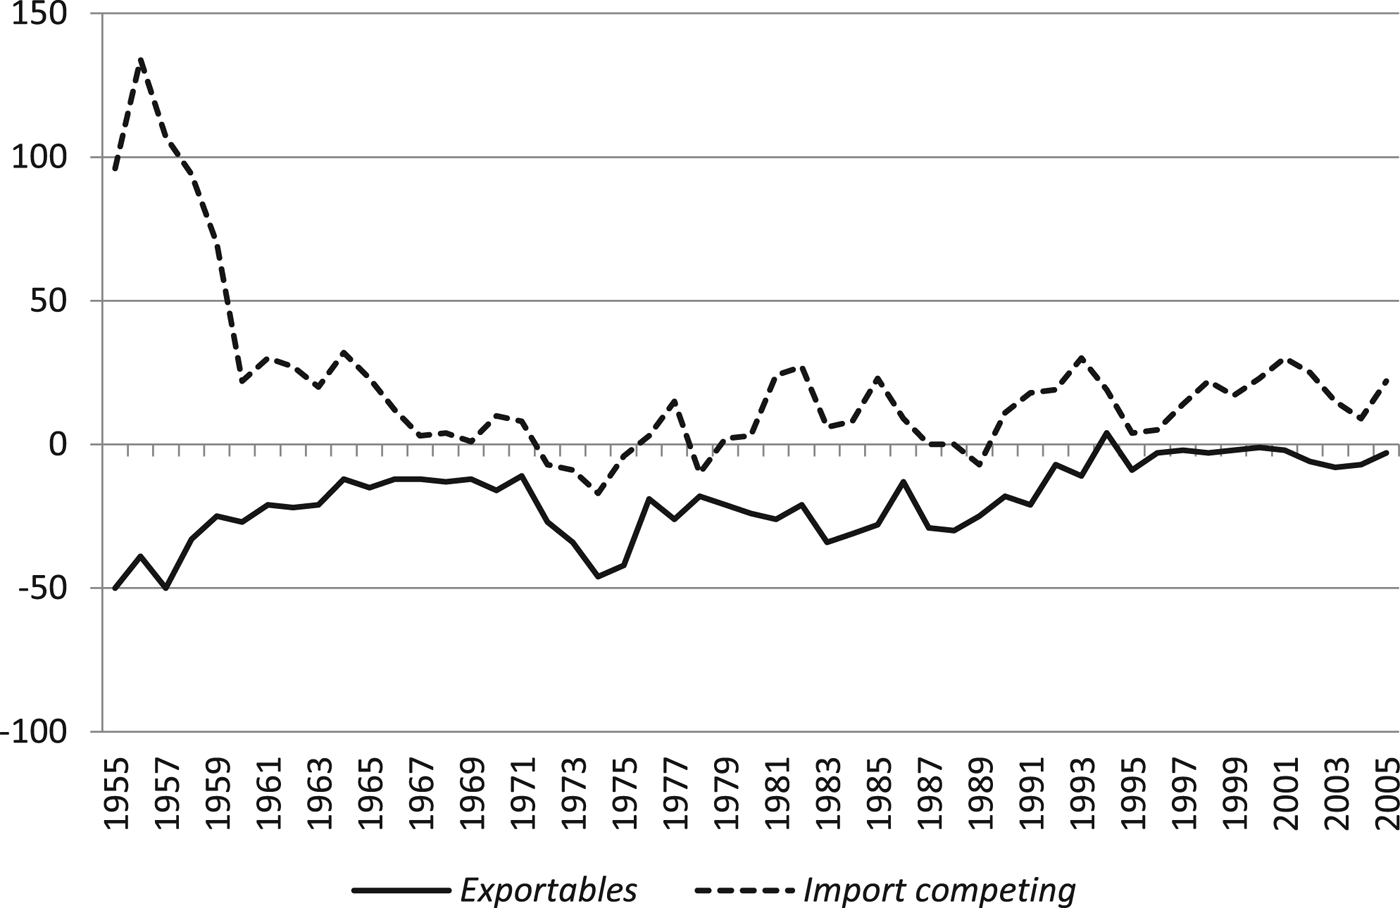
We can obtain an overall view of the openness of agriculture and of government support to agriculture throughout these three periods by analysing the trade openness (defined as the ratio of agricultural exports and imports to agricultural GDP) and the nominal rate of assistance (NRA) (the support through public policies received by the exportable agricultural products and competing imports). Figure 2 shows the substantial protection received by products aimed at the domestic market until the end of the 1960s. In contrast, export products were harshly penalised until the beginning of the 1970s. From then until 1993, a significant level of penalisation was maintained, after which it was reduced considerably.
Nominal Rate of Assistance (NRA) for Latin American Agriculture, 1955–2007

During the first period, in those countries which implemented ISI policies the role and functions of the state expanded, and significant changes were made to the instruments of regulation of productive activities (taxes, subsidies, fees and tariffs). With regard to agriculture for export, it is possible to identify a bias against the sector.Footnote 28 Export agriculture had negative support rates, while the opposite was true for that aimed at the domestic market. The change in development strategy meant that export agriculture ceased to be the motor of expansion of agricultural production in most of Latin America. However, in the Central American countries the agro-exporting model was not modified, and it brought about an appreciable increase in production.Footnote 29
Regarding agricultural and food exports, if we take the case of South America as a whole, in 1950 its volume of agricultural exports was already considerably lower than the maximum reached prior to 1929, but it fell still further throughout the 1950s, precisely when world agricultural trade increased more rapidly.Footnote 30 As a result, Latin America's position among worldwide exporters of agricultural products and food dropped until the beginning of the 1990s. This was not due solely to policy changes and their anti-export agricultural bias, but also to specialisation in products for which there was little demand which required only limited processing. Further restrictions were caused by protectionist policies in the developed countries, especially in Europe, with regard to agricultural products, given that trade was often undertaken within regional agreements.Footnote 31 However, support for agriculture oriented to the production of food or raw materials for the domestic market strongly stimulated this type of production, especially in a context of demographic boom in the Latin American countries. As a result, the trade openness of Latin American agriculture in this period was extremely low (Figure 3).
Trade Openness of Latin American Agriculture (%), 1961–2008

In the second period, economic crisis, the decline in ISI and the foreign debt crisis created conditions for a change to a development model directed at export growth and agriculture opened up significantly.
Finally, the third period was one of an extension of the adjustment policies and structural reforms undertaken in the late 1980s and early 1990s. As a result of the redefinition of the role of the state and the implementation of policies aimed at favouring the free market, the economy as a whole and agriculture in particular underwent changes in productive structure, competitiveness, productivity and profitability.Footnote 32 The new strategy involved mobilising resources in competitive export sectors, including agriculture. The result was an increase in agricultural exports and a definite change in their composition towards products with a greater degree of industrial processing or which better met consumer requirements. New products tended to complement or replace traditional exports, such as fresh fruit and vegetables, vegetable oils or fodder. Consequently, from the 1990s onwards Latin America's position in international markets for agricultural products and food started to climb. Nevertheless, the prices of traditional agricultural exports from Latin America experienced a sharp fall in real terms from 1976, so their improvement in terms of volume was not reflected in a similar increase in their real value.Footnote 33 Strong demand from Asia for certain agricultural and food raw materials also reinforced this recovery of and impulse to the agro-exporting sector.Footnote 34 In this third period, the openness of agriculture increased substantially (Figure 3).
The Heterogeneous Agricultural Growth of the Latin American Countries
In this section we will explain the diversity of the results of the different Latin American countries in each of these periods.
In the period coinciding with ISI (1950–73) the average annual growth of Latin American agriculture was slightly below that of the entire period analysed as a whole (2.9 per cent) (see Table 1). Most Latin American countries, attuned to the interests of urban sectors, adopted an import substitution growth strategy in the hope of developing industry. Tariffs, particularly for industrial products, were raised to favour local industries. Yet these industrial products were not internationally competitive for the most part and countries had to turn to agriculture to produce the export surplus to earn the foreign exchange needed to supply industry with capital goods and raw materials. However, the new industries were unable to supply the rural sector with the chemical fertilisers and pesticides or the machinery needed for modernisation at a reasonable price. The result was a moderate expansion in the rural sector.Footnote 35 The countries which experienced the highest growth were Mexico, Venezuela and Brazil, with rates of 5.2, 4.4 and 4.1 per cent, respectively. The three countries had in common an integrationist conception of ISI, whereby agriculture served as a support for the process of industrialisation itself and fed from it, the state was actively involved in technological development (linked to the Green Revolution), and important institutional changes, such as those related to agrarian reform, took place.
From WWII until the 1960s, ISI became the dominant strategy in Venezuela; it consisted in replacing the import of processed agricultural products. Consequently, wheat, sugar, balanced animal feed, oils, beef cattle and milk, among other food industries, were developed. In order to achieve the modernisation of agriculture, two principal measures were implemented. The first was land reform, which expanded the agricultural frontier by using public and private lands that were allocated to new agri-business producers of mechanised crops and to peasants, who became part of a modern agricultural process. The second measure was agricultural policy, in which the government financed and supported agricultural expansion through cheap credit and inputs, a pricing policy that ensured low prices for domestic purchases (consumers) and imports (agri-business). In addition, governments were primarily responsible for technological development by supporting new research, by promoting the application of scientific research and new knowledge to agricultural practices through farmer education, and by providing technical assistance.Footnote 36
In Mexico, following the revolutionary process in 1910 and the subsequent implementation of land reforms, including the Cárdenas reforms (1934–40), the agrarian structure was radically transformed. This meant the consolidation of the ejidos (communal lands) and the disappearance of traditional landowners (the hacendados), thereby facilitating a rapid expansion in the agricultural frontier. As for the ejidos, they increased their share of arable land (from 13 in 1930 to 47 per cent in 1940), as did irrigated areas (from 13 to 57 per cent); total production also increased (from 11 to 53 per cent).Footnote 37 The fast growth in Mexican agricultural production between 1950 and 1966 took place as a result of an enormous increase in the irrigated land area, which went up in that period by approximately a million hectares, and also of the early utilisation of high-yield seeds – maize and wheat – developed in Mexico from 1944 by Norman Borlaug through the agricultural research programme established between the Rockefeller Foundation and the Mexican government. Mexico was therefore the primary nucleus of the Green Revolution.Footnote 38
As in the period as a whole, the countries with the slowest growth were Argentina and Uruguay, with weak annual rates of below 1 per cent (0.7 and 0.4 per cent respectively). In both cases, the 1950s and 1960s were dominated by a policy of industrial promotion which involved the transfer of resources from the agricultural to the manufacturing sector (with profuse rent-seeking activities),Footnote 39 and also a variety of restrictions on imports of machinery and inputs, resulting in severe negative effects for the production of agricultural commodities.Footnote 40 The Argentine case clearly shows the contrast between the stagnation in agriculture for export, located principally in the Pampas region, and an expansion in the production of industrial and domestic consumption crops. From the mid-1950s onwards, a change in agricultural policies favoured a greater increase in agriculture in the Pampas. The low growth exhibited by Argentine production in the first period is even more striking if we take into account the significant fall in aggregate production in the 1940s and early 1950s, with the result that previous historic maxima were achieved again only by the mid-1960s.Footnote 41
The growth in Latin American agricultural production between 1973 and 1993 was the lowest in the entire period, although very close to that of the previous stage (2.7 per cent). The structural adjustment programmes in the region also had an impact upon agriculture. On the one hand there was a fall in support for rural development, subsidised inputs, state purchases with guaranteed prices, technical assistance and the subsidising of rural credit. Consequently, both private and public agricultural investment were reduced.Footnote 42 Although exchange rate policies tended to benefit agricultural and livestock exporters, their impact was limited by both the constraints on access to foreign markets and the sharp deterioration in international agricultural prices in this period.
Once again, Brazil became the country with the highest annual growth rate in agricultural production (3.6 per cent), followed this time by Chile (3.5 per cent) and Colombia (2.9 per cent). In the case of Chile, the period coincides with the general take-off of an economy based, as a political strategy, on the promotion of exports, especially those of a non-traditional character, such as fruit and flowers.Footnote 43 In turn, Colombian agriculture experienced its golden age from WWII until 1980 and, as in the Chilean case, a large part of this success depended on the traditional orientation of production towards exports (where the earlier staple coffee was joined by palm oil).Footnote 44
By contrast, Mexico showed a notable decline in the pace of growth in production in this period. Antonio Yúnez has attributed this low growth principally to the drastic fall in the production of maize, a basic food in the country, as a consequence of its poor price performance.Footnote 45 Between 1977 and 1981, Mexican agriculture recovered its dynamism as a result of increased public spending – basically irrigation and drainage research and extension (agricultural advisory services), agricultural credit, cheap inputs and profitable prices. However, this expansion ended abruptly in 1982 with the economic and external debt payment crises and the subsequent implementation of adjustment and stabilisation programmes. All of this led to the end of ISI and interventionism as well as of the developmental role of the state, creating the conditions for a new external market-oriented model. In this new scenario, restrictive fiscal policies led to the dismantling of compensatory policies for agriculture and a drastic reduction in investment and public spending (public investment in rural development fell by 92.5 per cent between 1981 and 1998).Footnote 46
As in previous periods, Uruguay and Argentina were the countries which least increased their production, with annual growth rates of 1.3 and 1.6 per cent. Like Chile, both of these economies underwent rapid and significant processes of economic liberalisation (together with a monetary approach to the balance of payments) with reduced tariffs on imports and fees on exports, but accompanied by rigid exchange rate policies which hindered the competitiveness of agriculture without providing it with special programmes of promotion or support in exchange.Footnote 47 Peru also displayed poor results during a period which included diverse agricultural policies such as price controls to keep consumer prices low until 1979,Footnote 48 and a heterodox programme of demand expansion during the 1980s, which resulted in hyperinflation.Footnote 49
The greatest annual growth in Latin American agricultural production took place between 1993 and 2008, at an average rate of 3.5 per cent, the leaders being Peru (5.6 per cent) and Brazil (4.4 per cent). In Peru, the implementation of the stabilisation programme and state structural reforms modified the institutional framework and the conditions in which agricultural producers participated in market relations.Footnote 50 In particular, the explicit policy of stimulating investment in the agricultural sector and the liberalisation of the market for food and agricultural inputs and of the land market were determining aspects. Meanwhile, Brazil consolidated its expansionary trajectory and, progressively, the extensive character of its agriculture over the preceding decades gave way to more intensive activity, with a more intense use of factors of production and increasing incorporation of technical progress.Footnote 51
In turn, the lowest increases were seen in Colombia, Mexico and Chile, with rates of 2.2 and of 2.6 per cent for the latter two countries. Colombia displayed a contrast with the previous period, since its agricultural sector entered a phase of great difficulties dominated by real revaluations of the currency and sizeable capital movements in a type of ‘Dutch disease’.Footnote 52 An intensive liberalisation process took place in Mexico from the beginning of the 1990s, one which also profoundly affected agriculture, and which involved a redefinition of property rights, trade liberalisation (through reduction of tariffs, the signing of the NAFTA agreement concerning North American integration, and the abolition of import permits), and the elimination of most guaranteed prices to the producer. These policies stimulated a sharp increase in exports of fruit and vegetables. Despite this, agriculture as a whole did not expand sufficiently. The results of these policies were not overly brilliant, which can be largely attributed to the incapacity of a liberalising agricultural policy, highly inequitable in its support for farmers, to transform the agriculture of the country.Footnote 53
In the Southern Cone, rising international prices for cereals and soya stimulated growth in the production of these crops. The adoption of transgenic seeds and other innovations such as direct sowing boosted Argentine production from the mid-1990s onwards; its growth rate in 1993–2008 was its highest for the whole period under study.Footnote 54 As during the ‘belle époque’, foreign demand stimulated this increase in production.Footnote 55
The Incorporation of Inputs: Land, Labour and Capital
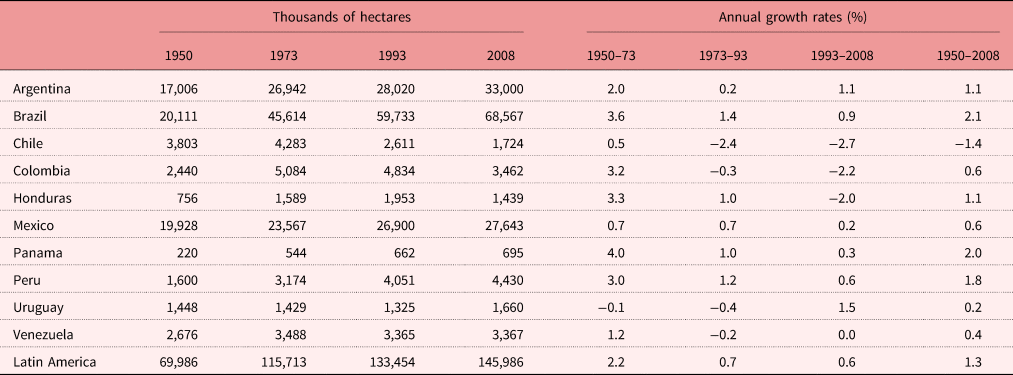
Before WWII, the area devoted to agricultural cultivation and livestock rearing expanded primarily in the temperate and subtropical regions (the Southern Cone, southern Brazil and Mexico) and the coastal tropical regions. After the end of the war, agricultural and grazing areas increased principally in tropical and interior regions (Table 3). This transformation is identified with a movement from extensive to intensive agriculture which was the result of the occupation of most of the best agricultural land together with the availability of new technologies related to the Green Revolution. The general consequence was a slowing down in the incorporation of land for production in the following decades.
Arable Land and Permanent Crops, 1950–2008

Note: Triennial averages, except 1950.
Source: See the online Appendix for methodology and sources.
Once more, the exceptions were Argentina and Uruguay, with strong rates of expansion in 1993–2008. These cases can be explained by their increase in crop production and the previously mentioned loss of space dedicated to livestock production. Part of the increase in cultivated land area in these two countries was related to the cultivation of genetically modified soybeans on new lands.
Only in Chile did the area of agricultural land decline substantially, while the most significant process of expansion took place in Brazil, which more than tripled its cultivated land area. The predominant trend for the region as a whole was that of a progressive deceleration in the process, with decreasing rates in the three periods (3.6, 1.4 and 0.9 per cent, respectively; see Table 3) as the rate of growth of land available for agriculturewas progressively reduced.
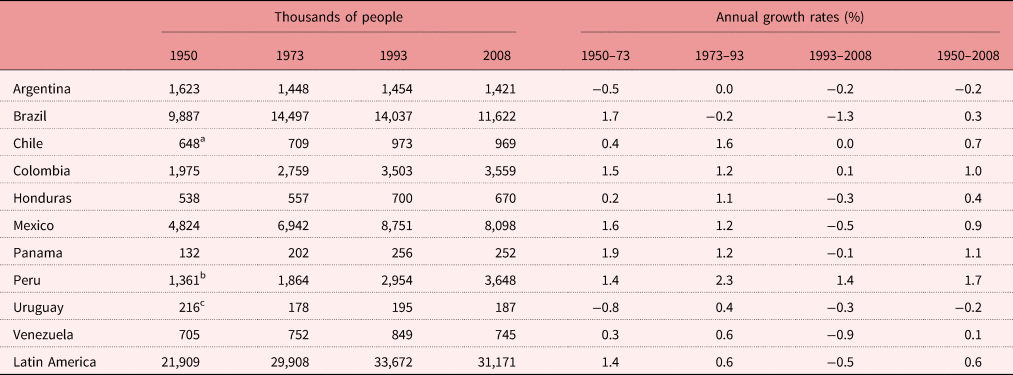
In the long term, agricultural labour shrank in absolute terms only in Argentina and Uruguay (Table 4). It grew modestly in Brazil, Chile, Honduras and Venezuela, with notable increases in Colombia, Mexico, Panama and Peru. Of these countries, only in Argentina, Chile and Uruguay did agricultural manpower already constitute a minority of the active population in 1950, with respective percentages of 25.1, 34.2 and 24.3 per cent. In 1980, in all of the above countries except Honduras, agricultural workers already represented less than 50 per cent of the labour force.Footnote 56 It is important to underline that in all those countries which increased their agricultural labour force in absolute terms, a significant fall in relative terms also occurred in all or part of the period. Therefore, the evolution of the active agricultural populations was clearly a result of the initial situation in 1950 and the intensity of the processes of industrialisation and urbanisation in the individual countries.
Active Population in Agriculture, 1950–2008

Notes: a Figure calculated for 1950. We have assumed that between 1950 and 1952 the data follow the Argentine pattern.
b Figure calculated for 1950. We have assumed that between 1950 and 1952 the data follow the aggregate of the Honduran and Mexican pattern.
c Figure calculated for 1950. We have assumed that between 1950 and 1960 the data follow the Argentine pattern.
Source: See the online Appendix for methodology and sources.
Practically all of the expansion in the agricultural labour force took place between 1950 and 1993, with the above-mentioned exceptions of Argentina and Uruguay. From then on, the labour force fell slightly, or remained stable, except in Peru. In this country, the number of agricultural workers continued to increase, although more slowly, due to land redistribution from the end of the 1960s (following the agrarian reform)Footnote 57 and increased flexibility in the hiring of workers from the 1990s (as a result of the implementation of the Ley de Promoción del Sector Agrario, Law of the Promotion of the Agrarian Sector).Footnote 58
Table 5 shows the livestock units in the Latin American countries. Brazil (2.0 per cent) and Venezuela (1.8 per cent) were the countries which grew fastest, tripling their stock of live animals in the second half of the twentieth century and the beginning of the twentieth-first century. The boom in poultry breeding and the increase in cattle are the main trends explaining this growth. At the other end of the scale (0.1 and 0.3 per cent annually) were Argentina and Uruguay which, by 1950, had already specialised in livestock. The stagnation experienced in these countries was due to a severe reduction in cattle and draft animals such as horses and mules, although there were enormous increases in poultry.
Livestock Units, 1950–2008

Note: a Average data calculated by FAO for the period 1948–52. For the rest of the years, triennial averages.
Source: See the online Appendix for methodology and sources.
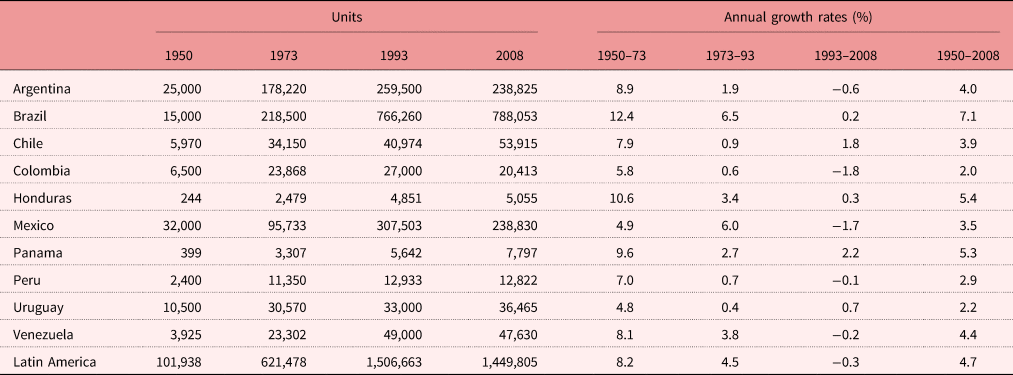
As we saw above, mechanisation was intense in Latin American agriculture (see Table 6, which gives data for tractor use as a proxy for mechanisation). The country which most increased its use of tractors was Brazil, with an annual rate of over 7 per cent. Until 1993, the increase in the use of tractors in Latin America as a whole was very rapid, especially until 1973, with an annual rate of increase of 8.2 per cent, coinciding with their widespread diffusion across the world. The number of tractors grew very slowly between 1993 and 2000, and stagnated from then on. This trend could reflect the slower rate of incorporation of tractors into agriculture once they had been adopted widely, but it is also undeniable that newer models were more powerful: the increased horsepower of the new tractors could account for the apparent decrease in the process of mechanisation towards the end of the century.
Agricultural Tractors, 1950–2008

Source: See the online Appendix for methodology and sources.
Relating the tractor use indicator with the degree of mechanisation of agriculture (Table 7), we can observe, as above, a progressive deceleration in the process, from its most dynamic phase between 1950 and 1973 (6.7 per cent) to a very moderate growth of 0.3 per cent between 1993 and 2008. Argentina and Uruguay (with over 15 and 49 tractors per 1,000 workers, respectively) are particularly noteworthy as they had levels above even the Mediterranean countries or eastern Europe until 1950.Footnote 59

All the countries registered increases in their degree of mechanisation in the period, although the leaders in the middle of the twentieth century remained the same at the beginning of the twentieth-first century. In 2008, in addition to Argentina and Uruguay, which were the traditional leaders, Brazil and Venezuela also displayed high levels of mechanisation.
In Argentina, the adoption of modern machinery was favoured in the 1950s, stimulating its national production and the installation of branches of multinationals for the manufacture of tractors. In addition, from 1957, the Instituto Nacional de Tecnología Agropecuaria (National Institute of Farming Technology, INTA) helped to adapt technological resources – especially seeds and agro-chemicals – to Argentine conditions. From the early 1970s in particular, a more generalised use was made of high-yield hybrid seeds in the most important crops, such as maize, wheat, sunflowers or soya, which raised yields.Footnote 60
The strategy of successive Venezuelan governments, with the exception of the periods of falling oil income and economic crisis, was to encourage agricultural production through massive transfers (subsidised loans, price controls, technical transfers, etc.). The result has been the development of a modern agricultural sector, intensive in the use of fertilisers and agricultural machinery which, nevertheless, displays a model of expansion which is highly vulnerable insofar as it depends on state support and protectionist policies.Footnote 61
In the case of Brazil, by the 1960s the import substitution strategy had already been created to establish bases for capital formation and industrialisation which would give rise to the modernisation of the agricultural sector through fertilisers, chemical products and the manufacture of agricultural machinery. This constituted the first phase in the transformation of Brazilian agriculture,Footnote 62 and was followed by a second stage, in the 1960s and 1970s, when the economy continued to expand its exports of processed and semi-processed agricultural productsFootnote 63 and implement diverse plans for agricultural research and development.Footnote 64
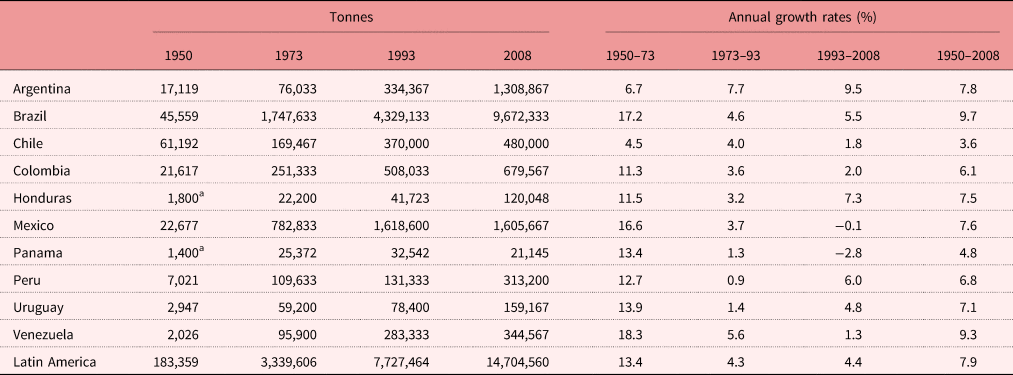
In Table 8 we can see the evolution of the consumption of chemical fertilisers. Growth in the employment of chemical fertilisers, in the same way as machinery, was concentrated in the initial decades of the second half of the twentieth century, especially between 1950 and 1973 (13.4 per cent annually). The rate of expansion was reduced in the following decades (although annual rates of above 4 per cent were maintained).
Chemical Fertilisers, 1950–2008

Notes: Triennial averages.
a 1950 figures for nitrogenous fertilisers and 1952 figures for potash and phosphorus.
Source: See the online Appendix for methodology and sources.
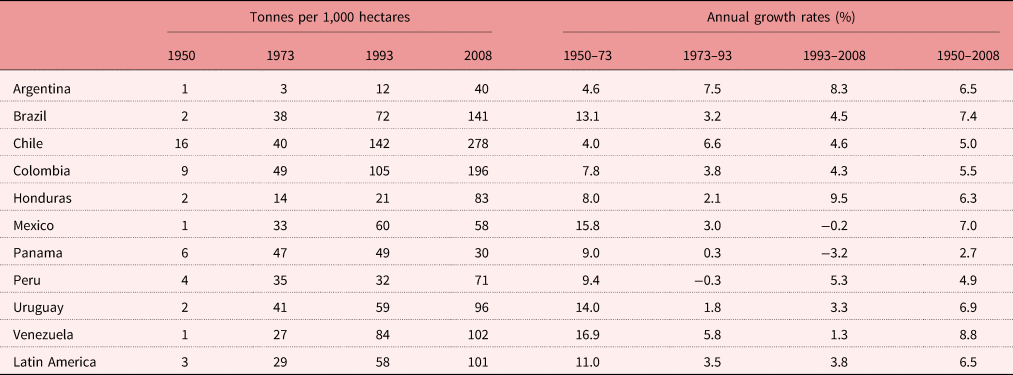
Table 9 shows the development of chemical intensity in agriculture in the Latin American countries. For example, the low relative level of fertilisation intensity in Argentina was related to its high cost and largely insignificant impact on the predominant crop type. However, the introduction of soya from the early 1980s and its rotation with short-cycle Mexican wheat varieties gave a strong boost to the use of fertilisers. While in 1977 fewer than 100,000 hectares were fertilised, by 1985 this figure reached almost 2 million.Footnote 65
Chemical Fertilisation Intensity, 1950–2008

Note: Triennial averages, except for the 1950 land data and the 1950 fertilisers data for Honduras and Panama.
Source: See the online Appendix for methodology and sources.
Agricultural Productivity Growth
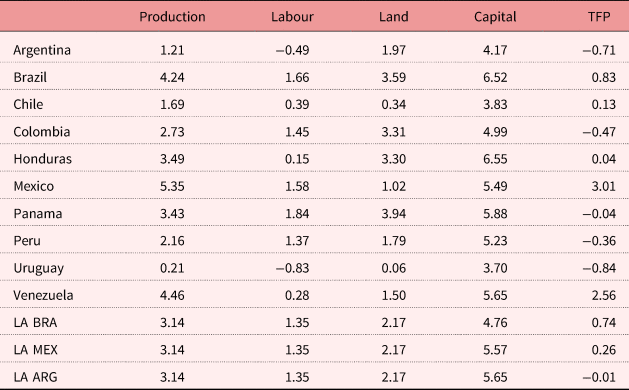
The growth in the use of capital registered its highest rate during the stage identified with ISI, and the lowest contribution of TFP during the period analysed also occurred during the ISI stage.Footnote 66 That is to say, the period of industrialisation induced by the state resulted, in the agricultural sector, in an ‘extensive’ growth which barely showed any returns in efficiency improvements (Table 10). Furthermore, any such efficiency improvements were very different between countries throughout the entire period, with both very high rates – such as in Mexico (3.0 per cent) and Venezuela (2.6 per cent) – and rates which in other countries which were almost flat, such as in Honduras, or even negative, as in the case of Colombia, Peru, Uruguay, Panama and Argentina. This period coincides with the highest growth of production and TFP in Mexican agriculture. The panorama changed sharply in the following stage.
Annual Average Logarithmic Rates between 1950 and 1973

Source: See the online Appendix for methodology and sources.
The high growth rate of Mexican agricultural productivity in the period 1950–73 was associated with the use of improved seeds introduced in the 1950s and the increased use of modern inputs, especially irrigated land, fertilisers, pesticides and animal feed.Footnote 67 That is to say, land reform, infrastructure and favourable relative prices created the conditions for a significant increase in the capitalisation of Mexican agriculture, which permitted a boom to take place. In this scenario, government involvement was essential, through massive investment and public subsidies, to finance the expansion of the sector. For example, between 1957 and 1981, public investment in agriculture grew at an annual rate of over 10 per cent.Footnote 68 A substantial part of this investment was channelled into the expansion of irrigation in northern Mexico, which encouraged the expansion of the cotton export sector and boosted wheat production for the domestic market.Footnote 69 These years also coincide with the onset of the Green Revolution, precisely in Mexican territory and initially applied to the cultivation of wheat.
The case of Argentina, which surely had the most advanced agricultural sector in the region in 1950, is significant. The low incorporation of technological innovations in the country in this period had already been underlined by early analysts, such as Carlos Díaz Alejandro.Footnote 70 An economic policy shift towards the internal market in the development strategy discouraged the adoption of such innovations in an agriculture which had, until then, been strongly oriented towards exports.
Between 1974 and 1993, and in contrast to the foregoing period, the contribution of productivity was greater, despite agricultural output increasing at a slightly lower rate (Table 11). In this period no negative variations in productivity were recorded and Chile (1.9 per cent), Brazil (1.9 per cent) and Venezuela (1.7 per cent) stood out, with above-average increases. Exports of Chilean temperate fruit grew quickly from 1974 to the beginning of the 1990s. An important aspect of this unusual success was the rapidity with which Chileans were able to transfer, adapt and extend fruit technologies, initially developed for California and other fruit-growing regions, to their home country. Moreover, although the public sector was responsible during the 1960s for developing the scientific expertise and technological base that initiated the expansion of the fruit sector, the private sector was the motivating force for the substantial, varied and broadly diffused technological advances which occurred after 1974 and which have been directly associated with Chile's expansion into international markets.Footnote 71 In 1973, a military coup imposed an authoritarian government that quickly moved to liberalise markets, reduce government intervention and end the land reform of the previous Salvador Allende government.Footnote 72 Rural labour unions were banned and workers could be fired at will. Real wages fell significantly, reducing labour costs and increasing producers’ profits.
Annual Average Logarithmic Rates between 1974 and 1993

Source: See the online Appendix for methodology and sources.
A second phase of agricultural transformation took place in the 1970s and early 1980s in Brazil, when the economy continued to open up, due to expansion in processed and semi-processed agricultural exports.Footnote 73 The establishment of the Empresa Brasileira de Pesquisa Agropecuária (Brazilian Agricultural Research Agency, EMBRAPA), in 1973, led to an even greater transformation in production. EMBRAPA was formed to increase investment in human capital and to carry out research and development to improve small farmers’ productivity and increase yields.Footnote 74 In the late 1980s, Brazil began to move towards a more laissez-faire and free-market oriented policy which significantly affected the agricultural sector. Agricultural policy became focused on the elimination of export taxes and price controls, the deregulation of commodity markets and unilateral trade liberalisation.Footnote 75
In the case of Venezuela, TFP results were higher than the average growth in Latin America until the 1990s and then the growth rate in TFP fell below the overall average. The uneven evolution of agricultural production, coupled with the variable increase in demand for food, became a clear problem. Venezuela represents the case of a victim to the ‘curse’ of natural resources (based on oil exports), which prevents the creation of the conditions for sustainable agriculture and steady growth.Footnote 76
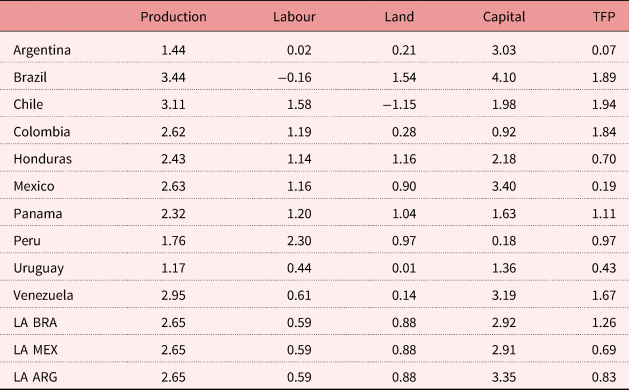
For the whole region, the period with the greatest productivity increases was that of the final two decades of the period under study (1994–2008), coinciding with the greatest increase in production (Table 12). In this latter period, the contribution of TFP was notable, exceeding even the expansion in capital for the Latin American average, with the sole exception of Argentina. As in the period as a whole, the countries with the worst performance in terms of efficiency improvements in agriculture were Uruguay (1.6 per cent) and Argentina (0.8 per cent).
Annual Average Logarithmic Rates between 1994 and 2008

Source: See the online Appendix for methodology and sources.
This significant increase in TFP coincided with a reduction in the use of labour, which fell by 0.5 per cent in Latin America on average, in a trend which was also followed by Argentina, Brazil, Chile, Honduras, Mexico, Panama, Uruguay and Venezuela. Finally, the contribution of the land factor was very variable. Its contribution was reduced in Latin America as a whole and decreased in three countries.
Cristóbal Kay maintains that, as part of the process of the globalisation of the economy, transnational agricultural corporations and local investors came to dominate the Latin American scene.Footnote 77 With the use of new technology, which permitted improvements in storage, agro-industrial processing, preservation, transport, communications and industrial organisation systems, these companies achieved advantages in the production of fruit, vegetables and flowers. The cases of Chile and Peru (and, partially, Brazil and Colombia) are representative of these trends. The structural reforms of the 1990s and, in particular, the policies aimed at promoting the development of the agri-food industry – together with the advent of free trade treaties – created favourable conditions for non-traditional agricultural exports to expand and become consolidated. Thus, in the period 1990–2008 notable changes took place in TFP, which were accompanied by the further opening-up of trade to international markets, increasing worldwide demand for healthy, quality foodstuffs, the incorporation of new lands into agricultural activity, the proliferation of interest in biofuels, increases in the income of a population which demanded a more varied supply of high-quality foodstuffs, and the expansion of private investment in agriculture. In the temperate zones – such as the Southern Cone – from the 1990s onwards, the economy embarked upon a stage of marked liberalisation, with a reduction in tariffs and dismantling of rigid exchange rates; these affected the competitiveness of agriculture, which did not receive any special programmes of promotion or support. This challenge was overcome by significant advances in agricultural modernisation, the results of which show clear indications of structural change, including the expansion of the agricultural frontier in Argentina (greater intensity in land use in the Pampas)Footnote 78 and various states of Brazil, new forms of production (the ‘sowing pools’, whose star product was soya)Footnote 79 and the explosive growth in outdoor pens (feedlots).
Conclusions
An analysis of the different Latin American countries reveals very significant contrasts. It is not possible to talk about a common model; rather there are large variations between the diverse national experiences. If we consider the contribution to the increase in production of the inputs employed and of TFP, several conclusions may be reached.
First, an increase in production took place in the period as a whole. This was remarkable, at 3 per cent annually for 58 years, which meant a truly notable increase in production in absolute terms (production in 2008 was over five times higher than in 1950).Footnote 80 However, the differences between countries were significant. The countries which were most successful in basing their model of growth on the first wave of globalisation of agricultural exports, Argentina and Uruguay, were those which grew least in the period under study, due especially to their poor performance until 1990. Brazil, Mexico and Venezuela were the leaders in growth.
Second, this increase was very similar during the ISI stage (1950s–60s) and the crises of the 1970s and 1980s, and then accelerated during the subsequent liberalisation. The acceleration in growth in Latin America after 1990 is clearly apparent in those countries which had grown least and which, during the 1990s, made a decisive turn back to the world market for agricultural products, namely Argentina and Uruguay. Brazil maintained very high rates throughout the period, while some countries, such as Colombia, Mexico and Venezuela, reduced their growth rates from those dates onwards.
Efficiency gains made a rather modest contribution to this strong increase in production. Above all, capital was the productive factor which best explains the increase in output. The remaining factors displayed positive but lower growth.
The differences between the Latin American economies are significant. Paradoxically, in the countries with a more modern agriculture in 1950, Argentina and Uruguay, the contribution of TFP was lower. Countries such as Mexico, Venezuela or Brazil, which in 1950 continued to have a fairly traditional sector, were those in which the contribution of TFP was greatest.
Over time, efficiency gains have made an increasing contribution to the growth of production. In this latest period the abandonment of ISI policies and the introduction of a greater liberalisation into agriculture were especially significant, and improvements in efficiency constituted the key element for driving strong growth in production.
Regarding the implications of the article for the literature on agricultural development, our findings show that in the processes of agricultural modernisation, the growth of production is usually – in its early stages – based on a greater use of inputs. Only when a certain level of development is reached, not only in agriculture but also in the economy as a whole, does the contribution made by the increase in productivity take on greater importance. These results coincide with those obtained in other works for developed countries in the last two centuries and for the European continent in the second half of the twentieth century.Footnote 81 Furthermore, in the context of low- and middle-income countries, the modernisation of agriculture accelerated their economic transformation into modern economies,Footnote 82 taking advantage of the variety of linkages connecting agriculture and overall economic growth.Footnote 83 The study has also shown that a favourable macroeconomic environment and a successful incorporation into world markets are important for boosting the growth of production and improving productivity. The active participation of the state in the generation and diffusion of technological change in agriculture is also crucial.Footnote 84
In terms of future research, some tasks remain to be done. For example, in order to overcome some of the limitations of this article, it is necessary to provide a conceptual framework that includes all the variables involved and that allows a rigorous analysis of the complexity of the interactions.
Supplementary material
To view the supplementary materials for this article, please visit https://doi.org/10.1017/S0022216X18001141
Author ORCIDs
Miguel Martín-Retortillo, 0000-0003-3431-0691; Vicente Pinilla, 0000-0003-2256-8898.
Acknowledgements
We are grateful for the comments received from the participants in the 11th Conference of the Spanish Economic History Association, the 4th Latin American Economic History Conference (CLADHE IV), the 10th Uruguayan Economic History Association Conference, the 14th Spanish Agricultural History Society Conference, the 3rd Mexican Economic History Association Conference, the 17th World Economic History Congress, the Seminar of Economic History at the Universidad Carlos III of Madrid, and for those made by Pablo Astorga and Leandro Prados de la Escosura.
Financial support
This study has received financial support from the Spanish Ministry of Science and Innovation, project ECO2015-65582, and the Spanish Ministry of Education's Formación de Profesorado Universitario (University Teaching Training Programme, FPU) programme, and from the Government of Aragon, through the Research Group ‘Agrifood Economic History (19th and 20th Centuries)’.