I. INTRODUCTION
CoCrMo alloys are known for their high wear resistance and corrosion resistance, and are also one of the best known alloys exhibiting high strength and biocompatibility. Reference Amstutz and Grigoris1–Reference Giacchi, Morando, Fornaro and Palacio3 These alloys have been shown to exhibit unique property of self-polishing ability during articulation against CoCrMo alloy thus reducing accelerated wear. Reference Amstutz and Grigoris1 Significant research has been done on conventionally processed CoCrMo alloys for a variety of applications. Detailed microstructural analysis of cast and wrought CoCrMo alloys showed M23C6 and M6C type (M = Cr, Mo, Co) carbides primarily along the grain boundaries and interdendritic regions, Reference Liao, Pourzal, Stemmer, Wimmer, Jacobs, Fischer and Marks2,Reference Giacchi, Morando, Fornaro and Palacio3 which are responsible for high strength and wear resistance of these alloys. Julian et al. studied corrosion and wear performance of high carbon CoCrMo alloy in simulated body fluids. Reference Julian and Munoz4 They found that post-fabrication heat treatment can significantly change their electrochemical and tribological properties particularly fine grains with large grain boundary area found to accelerate the corrosion. Reference Julian and Munoz4 Further, recent tribocorrosion study on high carbon CoCrMo alloy demonstrated strong influence of electrode potential on tribocorrosion rates. Reference Gil and Muñoz5
Reports on fabrication of CoCrMo alloy structures and coatings using laser-based additive manufacturing are very limited. Reference España, Balla, Bose and Bandyopadhyay6–Reference Dittrick, Balla, Davies, Bose and Bandyopadhyay9 Using laser engineered net shaping (LENS™), España et al. Reference España, Balla, Bose and Bandyopadhyay6 successfully fabricated net shape porous CoCrMo alloy structures without compromising its inherent biocompatibility for bone implant applications. Novel CoCrMo alloy structures with porous core and solid shell with total porosity in the range of 10 and 18% found to exhibit effective modulus between 33 and 43 GPa, Reference España, Balla, Bose and Bandyopadhyay6 thus demonstrating their potential to reduce stress shielding associated with load bearing implants. To utilize inherent wear and corrosion resistance of CoCrMo alloy, an attempt has been made to deposit the alloy on Ti Reference Ram, Esplin and Stucker7 using LENS™. It was found that the formation of intermetallic compounds and process induced stresses result in coating delamination. Reference Ram, Esplin and Stucker7 However, with the application of gradient coatings this problem has been found to be solved. Reference Krishna, Xue, Bose and Bandyopadhyay8 Krishna et al. reported a significant increase in the surface hardness Reference Krishna, Xue, Bose and Bandyopadhyay8 and associated wear resistance in functionally graded CoCrMo alloy coatings deposited on Ti using LENS™. Reference Dittrick, Balla, Davies, Bose and Bandyopadhyay9 Further, the CoCrMo alloy processed using LENS™ was found to be nontoxic and exhibited similar biocompatibility of that of a conventionally processed alloy. Considering the potential of this additive manufacturing technology, an attempt has been made to study the influence of LENS™ process parameters such as laser power, powder feed rate, and scan velocity on microstructure, hardness, wear resistance, and electrochemical performance of CoCrMo alloy deposits for non-biomedical applications. Grey relational grade analysis and analysis of variance (ANOVA) have been applied to identify optimum process parameter combination.
II. MATERIALS AND METHODS
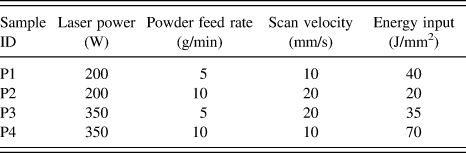
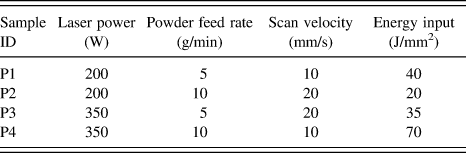
Commercially available CoCrMo powder (Stellite21, Kennametal Stellite, Goshen, IN) was deposited on 5-mm-thick CoCrMo alloy substrate using LENS™ (MR-7, Optomec Inc., Albuquerque, NM). The particle size of the powder used in the present work was between 40 and 150 μm. L4 Orthogonal array was used to study the influence of process parameters on the thickness and properties of CoCrMo alloy deposits. The sample IDs and corresponding process parameters used in the present work are presented in Table I. Several deposits (20 deposits for each sample ID) were prepared using these process parameters for further characterization and testing. Details of LENS™ processing can be found elsewhere. Reference Das, Balla, Sampath Kumar and Manna10 During deposition, the oxygen content was maintained below 10 ppm in the working chamber using argon gas. Thick samples with ϕ 10 mm were prepared by depositing five layers of CoCrMo alloy.
Process parameters and L4 Orthogonal array used in the present investigation.
The deposits were prepared following standard metallographic polishing and etching technique for microstructural analysis. The etched surfaces of the deposits were observed using scanning electron microscope (SEM, Hitachi S-3700N, Hitachi High Technologies, Tokyo, Japan). The thickness of the deposits was measured from cross-sectional images of two deposits from each sample ID. For each sample ID/deposit, three cross-sectional images were taken and on each image the thickness was measured at 3 different places along the deposit. Therefore, the deposit thicknesses reported here were an average of 18 measurements on each deposit. The deposit hardness was measured using Vickers microhardness tester (MMT X7 MATSUZAWA, Matsuzawa Co. Ltd., Akita Pref, Japan.), per ASTM E384-10, at a load of 200 g (20 s) and average of nine measurements (3 measurements on 3 identical samples/deposits) was reported. The constituent microstructural phases of laser-deposited CoCrMo alloy were determined using an X’Pert Pro MPD diffractometer (PANalytical, Almelo, Netherlands) operating at 45 kV and 40 mA using Ni-filtered Cu Kα radiation.
Electrochemical measurements were performed on the deposits using a potentiostat/galvanostat (SP300, Bio-Logic SAS, Claix, France) in 3.5% NaCl solution. Before testing, the top surfaces of the deposits were polished following standard metallographic preparation up to 1 µm Al2O3 suspension. Potentiodynamic polarization tests were performed by scanning the applied potential from −0.5 to 1.6 V versus saturated calomel electrode (SCE) at a rate of 10 mV/min. The corrosion potential (E corr) was obtained as the potential at which the net current density was equal to zero and the corrosion current density (I corr) was extracted from the polarization curves of linear part of the cathodic curve (Tafel behavior). The electrochemical tests were carried out on three samples per deposit type and the results (E corr and I corr) were reported as average ± standard deviation.
Pin-on-disc tribometer (Ducom, Bangalore, India) was used to determine the wear resistance of LENS™ processed CoCrMo alloy coatings at room temperature in a dry condition for non-biomedical applications. The deposits were used as pins and the contact surface was polished following standard metallographic procedure. The disc was made of EN31 hardened steel. Pin-on-disc wear tests were performed for 1000 m sliding distance at two speeds (1047 mm/s and 1571 mm/s) using normal loads of 10 N and 20 N. The wear rate of the deposits was calculated from the wear track measurements and was represented as mm3/Nm. These tribological tests were performed in triplicate and average wear rate was reported. The wear tracks were observed under SEM to understand the wear mechanism.
ANOVA was performed on experimentally determined thickness, hardness, wear rate, and corrosion potential/current. Grey relational grade analysis was used to identify optimum process parameter combination for high wear and corrosion resistance.
III. RESULTS AND DISCUSSION
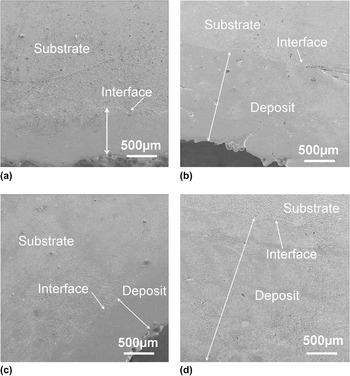
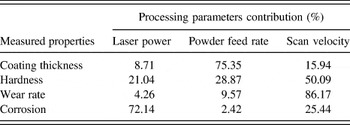
Low magnification cross-sectional SEM images of the deposits are presented in Fig. 1. The interface between the substrate and the first deposited layer, and the interfaces between any two layers deposited one on top of another were found to exhibit no evidence of porosity, cracks and lack of fusion defects. This is primarily due to complete melting of CoCrMo alloy powder during laser deposition. Table II shows the thickness of the deposits measured from cross-sectional micrographs shown in Fig. 1. Highest deposit thickness of 2.05 ± 0.16 mm was obtained with high laser power, high powder feed rate, and low scan speed (P4). The deposits fabricated at low powder feed rate exhibited lower thickness than the deposits prepared using high powder feed rate. For example, the thicknesses of P1 and P3 deposits were between 0.71 ± 0.03 mm and 0.59 ± 0.09 mm compared with thicker deposits in the range of 1.25 and 2.0 mm for P2 and P4, respectively. The variations in deposit thickness can be directly related to processing parameters. Increasing the laser power increases the energy input during deposition consequently large melt pools and high melt pool temperatures are created leading to thick deposits. The scan velocity has opposite effect on deposit thickness due to reduction in laser–materials interaction time during deposition. However, in the present investigation, the powder feed rate is found to have strong influence on thickness of CoCrMo alloy deposits. High powder feed rate increases the melt pool volume leading to thicker deposits compared with the deposits prepared at low powder feed rate. Grey relational grade analysis (Table III) also showed that powder feed rate had the strongest influence (75.35%) on deposit thickness followed by scan velocity (15.94%) and laser power (8.71%).
Cross-sectional images showing the variation in CoCrMo alloy deposit thickness. (a) 200 W, 5 g/min, 10 mm/s (P1), (b) 200 W, 10 g/min, 20 mm/s (P2), (c) 350 W, 5 g/min, 20 mm/s (P3), (d) 350 W, 10 g/min, 10 mm/s (P4).

Coating characteristics and properties prepared using LENS™.

Process parameter contribution (%) determined using Grey relational grade analysis.

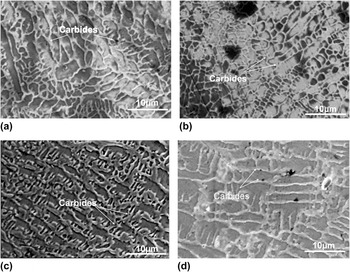
Figure 2 shows high magnification microstructures of laser-deposited CoCrMo alloy. Irrespective of process parameters, all deposits showed carbide precipitates, primarily along the grain boundaries or at inter-dendritic regions. Such microstructures are commonly encountered in cast CoCrMo alloys. Reference Liao, Pourzal, Stemmer, Wimmer, Jacobs, Fischer and Marks2,Reference Giacchi, Morando, Fornaro and Palacio3 Formation of carbide network along the grain boundaries or at inter-dendritic regions clearly suggests that they were formed at the later stages of solidification. Cast CoCrMo alloys are found to have different carbides such as M23C6, M7C3, and M6C. Reference Liao, Pourzal, Stemmer, Wimmer, Jacobs, Fischer and Marks2,Reference Giacchi, Morando, Fornaro and Palacio3
Microstructures of laser-processed CoCrMo alloy deposits. (a) 200 W, 5 g/min, 10 mm/s (P1), (b) 200 W, 10 g/min, 20 mm/s (P2), (c) 350 W, 5 g/min, 20 mm/s (P3), (d) 350 W, 10 g/min, 10 mm/s (P4).

Interestingly, the scale of solidification microstructure was different in the deposits made at different laser process parameters. The deposits (P2) made using 200 W laser power, 10 g/min powder feed rate at 20 mm/s scan velocity showed relatively finer grains compared with other deposits. Coarse microstructures were observed in the deposits prepared at 350 W, 10 g/min, 10 mm/s (P4). During LENS™ processing, the deposit is produced in layer-by-layer fashion and each layer is completed by consecutive overlapping tracks. In this work, the total energy input (E) during deposition of CoCrMo alloy was estimated using the following relation Reference Mazumder, Schifferer and Choi11 :
 $$E = {P \over {vD}}\quad ,$$
where P is laser power, v is scan velocity, D is the laser beam diameter.
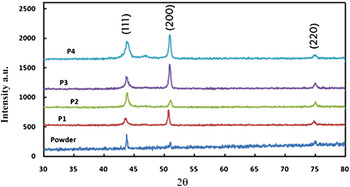
The energy inputs thus calculated for different deposition parameter sets were between 20 J/mm2 and 70 J/mm2 (Table I). It is known that the scale of solidification microstructures depends on the cooling rates. During laser processing, the cooling rates within the melt pool are directly related to the product of solidification velocity (R) and local temperature gradient (G). Reference Bontha, Klingbeil, Kobryn and Fraser12 Further, it has been determined that R is close to laser scan velocity (mm/s) and G is in the order of ∼100 K/mm. Reference Hofmeister, Griffith, Ensz and Smugeresky13,Reference Gäumann, Henry, Cleton, Wagniere and Kurz14 Therefore, present experimental scan velocities of 10 and 20 mm/s could produce cooling rates between 1000 and 2000 K/s. Moreover, low heat input increases the cooling rate due to small melt pool and high thermal gradients near the melt zone. Reference Kurz, Bezencon and Gäumann15 Therefore, the deposits prepared at the lowest energy input of 20 J/mm2 (200 W, 10 g/min, 20 mm/s) showed finer microstructural features compared with other deposits. The slow cooling rates in the deposits fabricated at 350 W, 10 g/min, 10 mm/s resulted in coarse dendritic/grain structures due to high energy input of 70 J/mm2. In line with our observations, Espana et al. demonstrated that high solidification rates associated with LENS™ processing refine Si eutectic features of Al–Si alloy, which eliminated the detrimental effect of porosity on thermal conductivity of the alloy. Reference España, Balla and Bandyopadhyay16 Similarly, extremely fine reaction products have been reported during laser-assisted in situ synthesis of TiB–TiN reinforced Ti alloy composite coatings by tailoring energy input. Reference Das, Balla, Basu, Manna, Sampath Kumar and Bandyopadhyay17 The XRD analysis of deposits is compared with that of as-received CoCrMo alloy powder in Fig. 3. All coatings were found to retain feed stock powder phases except the peaks of deposits were broader than feed stock powder peaks. The peak broadening could be due to residual stresses. Additionally, relatively high (200) peak in the deposits, compared to as-received powder, indicate presence of some preferred solidification direction. Directional solidification of materials during LENS™ processing has also been reported earlier Reference Balla, Bandyopadhyay, Bose and Bandyopadhyay18 and is primarily due to directional heat loss through the substrate.
XRD pattern of as-received CoCrMo powder and laser deposits (P1: 200 W, 5 g/min, 10 mm/s; P2: 200 W, 10 g/min, 20 mm/s; P3: 350 W, 5 g/min, 20 mm/s; P4: 350 W, 10 g/min, 10 mm/s).

The summary of hardness tests performed on laser-processed CoCrMo alloy deposits is shown in Table II. The hardness of laser-deposited CoCrMo alloy was found to vary between 430 and 446 HV, which is comparable with that of equivalent wrought alloy. Reference Ortega-Saenz, Hernandez-Rodriguez, Ventura-Sobrevilla, Michalczewski, Smolik and Szczerek19 The data indicate that laser process parameters had little influence on the hardness of CoCrMo alloy deposits. However, highest hardness was observed on the deposits prepared at 350 W, 5 g/min, 20 mm/s (P3).
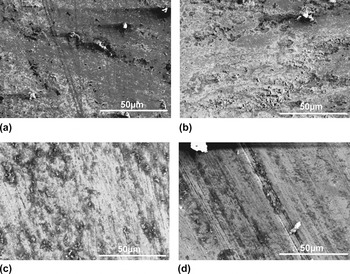
Wear data of CoCrMo alloy deposits tested at different normal loads and sliding speeds is presented in Table II. Under present test conditions, lowest wear rates were found in P2 and P3 deposits processed at 200 W, 10 g/min, 20 mm/s and 350 W, 5 g/min, 20 mm/s, respectively. Other two deposits exhibited relatively high wear rates between 3.0 and 4.8 mm3/Nm. We believe that finer microstructural features of P2 and P3 deposits (due to low energy input) compared to P1 and P4 deposits could have resulted in observed improvement in the tribological properties. All deposits exhibited marginal decrease in the wear rate with increasing normal load at sliding speed of 1047 mm/s. However, at high speed of 1571 mm/s the wear rate increased considerably with normal load. At 10 N load increasing the sliding speed increased the wear rate while at 20 N mixed trend was observed. Increase in the wear rate with normal load at low sliding speed is intuitive. However, at 20 N normal load under dry testing the heat generation would be very high leading to stick-slip type friction which could have resulted in observed mixed trends in wear rates at high sliding speed. The morphology of wear tracks are presented in Fig. 4. In all deposits the wear tracks were deep, showed smearing and some adhered particles/chips [Figs. 4(a) and 4(b)]. However, deposits prepared at 350 W, 10 g/min, 10 mm/s (P4) showed some scratches that were deep and aligned in the direction of sliding [Fig. 4(d)]. Among the deposits tested, the wear tracks of P3 deposits (350 W, 5 g/min, 20 mm/s) was relatively shallow and smooth as shown in Fig. 4(c). Uniform distribution of carbides in P3 deposits [Fig. 2(c)] also supports its high wear resistance.
Typical wear track morphologies of laser-processed CoCrMo alloy deposits tested at 10 N and 1047 mm/s. (a) 200 W, 5 g/min, 10 mm/s (P1), (b) 200 W, 10 g/min, 20 mm/s (P2), (c) 350 W, 5 g/min, 20 mm/s (P3), (d) 350 W, 10 g/min, 10 mm/s (P4).

Electrochemical behavior of laser-deposited CoCrMo alloy deposits was analyzed in 3.5% NaCl solution to determine the influence of laser processing on their corrosion performance. Generally it is known that a material will have low tendency to corrode if E corr value tends to positive with small I corr. From the experimental results shown in Table II, it is clear that the P1 deposits (200 W, 5 g/min, 10 mm/s) should have highest corrosion resistance due to its positive E corr (28.85 ± 1.24 mV versus SCE) and deposits prepared at 200 W, 10 g/min, 20 mm/s (P2) with lowest I corr of 0.013 ± 0.01 µA/cm2. To determine best process parameter combination for high corrosion resistance (combined influence of E corr and I corr) Grey analysis was used, which is widely used method to convert multivariate problems in to a single responsive problem. Reference Roy and Sahoo20 The criterion for E corr is ‘higher the better’ and for I corr it is ‘lower the better’ for generation of Grey relation grade. From this analysis it was found that highest corrosion resistance in CoCrMo alloy deposits can be obtained using 200 W laser power, 5 g/min powder feed rate, and a scan velocity of 10 mm/s (P1).
The ANOVA and Grey analysis on hardness, wear resistance, and corrosion data revealed that the process parameters have strong influence on deposit properties. The contribution percentage of laser processing parameters on the deposit properties is shown in Table III. Laser scan velocity is found to have the strongest influence on deposits hardness, wear rate, and corrosion resistance compared with other two process parameters namely laser power and powder feed rate. As shown in Table III, the tribological performance of the deposits was primarily dictated by scan velocity presumably due to its relatively stronger influence on solidification cooling rates compared to laser power during deposition. However, for electrochemical performance, the laser power has been shown to have 72% contribution followed by scan velocity with 25% contribution. This could be due to strong dependence of dissolution followed by reprecipitation of carbides on laser power during laser deposition, which controls the concentration of Cr in the matrix thereby altering the electrochemical response of CoCrMo alloy deposits.
IV. CONCLUSIONS
Defect-free CoCrMo alloy deposits have been prepared using LENS™. The scale of microstructural features strongly dependent on laser energy input and laser deposition is found to retain feed stock powder phases. Grey analysis showed that the lowest wear rate in the range of 1.80 and 3.60 mm3/Nm can be achieved in CoCrMo alloy deposits prepared at 350 W, 5 g/min, 20 mm/s depending on the normal load and sliding speed. The best electrochemical performance with E corr and I corr of 28.85 ± 1.24 mV versus SCE and 0.103 ± 0.08 µA/cm2, respectively, was observed in the deposits fabricated at 200 W laser power, 5 g/min powder feed rate, and scan velocity of 10 mm/s.
ACKNOWLEDGMENTS
One of the authors (Kedar Mallik Mantrala) sincerely thanks the Director, CSIR-Central Glass & Ceramic Research Institute (CGCRI), Kolkata for providing necessary permission to carry out some of the experimental work at CSIR-CGCRI. The financial support received from Council of Scientific and Industrial Research (CSIR), New Delhi to establish LENS™ facility at CSIR-CGCRI is greatly acknowledged.