Implications
Pododermatitis in rabbits is one of the causes for culling in commercial production. Rabbits with advanced lesions might be euthanized, but also those whose lesions are less severe can have compromised welfare. Thus, the development of detailed scores, which might help to detect pododermatitis in early stages, is needed in order to treat them and avoid welfare problems. In addition, these scores could be directly applied by the farmers, and a general pododermatitis state of each farm could be known.
Introduction
Pododermatitis in rabbits is a skin disease in which wounds appear on the middle joints of the animal's hind feet. It usually appears in breeding animals or overweight animals (Terril et al., Reference Terril, Clemons and Wagner1992) and only sporadically appears in young rabbits (Drescher and Schlender-Böbbis, Reference Drescher and Schlender-Böbbis1996). In addition, it is also influenced by the housing climate (Rommers and Meijerhof, Reference Rommers and Meijerhof1996) and cage material (Harvey, Reference Harvey1995). The wounds may be colonized by Staphylococcus aureus or Pasteurella multocida, which can increase the severity of the lesion (European Food Safety Authority (EFSA), 2005). It can be a cause of chronic suffering (EFSA, 2005), especially if the lesions are severe and such lesions are responsible of 3.6% of annual cumulative incidence of culling in females and males in Spain (Rosell and de la Fuente, Reference Rosell and de la Fuente2009a) and 16.5% in Europe (EFSA, 2005). Thus, these lesions can have an important impact on rabbits’ welfare. Moreover, there is an economic interest in pododermatitis due to a decrease in the productivity of affected does, increasing sterility, newborn mortality and increased culling rate (EFSA, 2005).
In other species such as broilers or turkeys, different scoring systems have been developed and they are usually based on the size and severity of the lesions (Ekstrand et al., Reference Ekstrand, Carpenter, Andersson and Algers1998; Martrenchar et al., Reference Martrenchar, Boilletot, Huonnic and Pol2002). Pagazaurtundua and Warriss (Reference Pagazaurtundua and Warriss2006) elaborated a score for footpad dermatitis in broilers based on the percentage of undersurface of the foot affected by lesions. The Scientific Committee on Animal Health and Welfare of the European Commission (SCAHAW, 2000) states that the subjective nature of the scoring systems makes comparisons between studies difficult, and objective measurement systems are recommended. In the case of rabbits, few scoring systems to assess pododermatitis have been described (Drescher and Schlender-Böbbis, Reference Drescher and Schlender-Böbbis1996; Rommers and Meijerhof, Reference Rommers and Meijerhof1996), and thus there is a need for developing a more detailed scoring system. Some authors have developed methods using image analysis to measure lesion size in dairy cattle (Leach et al., Reference Leach, Logue, Randall and Kempson1998), and others have tried to estimate the severity of the lesions based on size, appearance or combinations of both (Greenough et al., Reference Greenough, Vermunt, McKinnon, Fathy, Berg and Cohen1990). Using size to establish a score may be interesting but, because pododermatitis in rabbits is different from that observed in broilers or cattle, other parameters should be considered in order to achieve a reliable score. This means that aspects such as size, color or the presence of blood, among others, must be considered to define how severely an animal is affected.
As Byrd-Bredbenner et al. (Reference Byrd-Bredbenner, Abbot and Cussler2008) defined, ‘cluster analysis can be used to characterize segments of populations by creating groups or clusters of individuals’. Thus, objects in a given cluster tend to be similar to each other, and objects in different clusters tend to be different (SAS, 2009).
The aim of the current study was to develop a reliable scoring system through clustering methods to evaluate pododermatitis in farmed rabbits. This score should define the lesion according to a number of different criteria, while avoiding a high number of scoring levels.
Material and methods
General overview
To develop a pododermatitis scoring system in breeding does, the following steps were taken. Photos of rabbit does were studied and described in detail in terms of their pododermatitis severity. The resulting database was then subjected to clustering methods in order to obtain homogeneous clusters. Finally, these clusters were used to obtain a comprehensive description of the final score.
Pododermatitis assessment
In this work, 1367 photos of commercial does’ feet were observed. All the does belonged to the synthetic line V of the Universitat Politècnica de València (Baselga, Reference Baselga2002) and had between 1 and 14 parturitions. In addition, they came from a rabbitry located in Castellon (Spain) and animals were housed in individual 60 × 40 × 32 cm3 wire cages under natural ventilation. The photos were taken on 4 consecutive days and each photo was assessed by two different observers previously trained in pododermatitis assessment using photos.
The presence or absence of any type of lesion was recorded and any photo with no lesion (noted by any of the observers) was deleted.
The remaining 911 photos of feet that presented any type of lesion were described in detail, considering the following aspects of the lesions (see Supplementary Figure S1 for details of the photos for each observation):
• Color (seven categories): white, yellow, brown, black, red, pink, grey or any combination of these.
• Size (three categories): small (lesion approximately up to 5% of the foot surface), medium (5.1% to 15%) or large (>15%).
• Skin chaps (four categories). They were classified as:
– No skin chaps
– Spots: dark stain on the skin, which is likely to degenerate into fissures later on
– Typical: the skin opens up and a fissure with wet edges is created
– Dry: the skin is already open and the fissure has dried edges.
• Ulcers (four categories). It was considered an ulcer whenever there was an open wound with dried or fresh blood, classified as follows:
– No ulcers
– Small ulcer relative to the size of the whole lesion
– Medium ulcer relative to the size of the whole lesion
– Large ulcer relative to the size of the whole lesion.
• Shape (three categories):
– Typical: rectangular or circular in the center of the foot
– Long: a narrow line from the center to the heel
– Wide: lesion extends from the center to the side of the foot.
• Appearance (five categories):
– Typical: only hyperkeratosis is present
– Exudative: when the footpad was discharging or appeared putrid
– Raw: when the foot had sections of skin missing
– Opening: when the skin was starting to break
– Opened: when the skin was already broken (i.e. presence of wounds, not referred to as chaps).
• Blood in the lesion (three categories):
– No blood
– Presence of blood
– Presence of dried blood.
Variable transformation
The methodology proposed by Cole-Rodgers et al. (Reference Cole-Rodgers, Smith and Bosland1997) was adopted to make the analysis possible, as the original database had variables with more than one category. All traits were transformed into binary variables by transforming each category into 1/√k, with ‘k’ being the number of categories of each variable.
Statistical analysis
Inter-observer reliability
The percentage of agreement and kappa coefficient were calculated for the data collected by the two observers. The kappa coefficient is defined as a measure of agreement between observers, but beyond the agreement expected by chance, and it is considered the ‘true’ agreement (Cohen, Reference Cohen1960; Sim and Wright, Reference Sim and Wright2005).
Cluster analysis
In this work, the number of categories will be defined statistically after lesions assessment, whereas traditionally, the number of categories of this type of scores is defined before the observations (e.g. Rommers and Meijerhof, Reference Rommers and Meijerhof1996).
Hierarchical clustering using the Cluster procedure from the SAS System (SAS, 2009) was developed with Ward's minimum-variance method (Ward, Reference Ward1963) including all the variables in the model. The number of clusters was defined using a dendogram (obtained by the Tree procedure of the SAS System, SAS, 2009) and three statistics: the cubic clustering criterion (CCC), pseudo F-test and pseudo t 2-test. The dendogram is a tree graph that can be used to examine how clusters are merged. The vertical axis gives the squared Euclidean distance at which any two clusters are joined and the observations are spaced along the horizontal axis (Schonlau, Reference Schonlau2004). Regarding the three statistics for estimating the number of clusters, there has to be consensus between them. That is, local peaks of the CCC and pseudo-F, combined with a low value of the pseudo-t 2 statistic and a larger pseudo-t 2 for the next cluster fusion (SAS, 2009).
The next step was to carry out non-hierarchical clustering using the Fastclus procedure from the SAS System. With this procedure, a segregative clustering analysis was developed and each observation was classified into one of the optimum number of clusters previously defined by the Cluster procedure (SAS, 2009). Finally, a canonical discriminant analysis was developed through the Candisc procedure from the SAS System (SAS, 2009).
Description of the clusters and score definition
Once the clusters were established, the following step consisted of analyzing the characteristics of each cluster to establish how clusters differed from one another. These analyses were performed with the Freq procedure from SAS System (SAS, 2009), with the output dataset from the cluster analysis.
Results and discussion
Inter-observer reliability
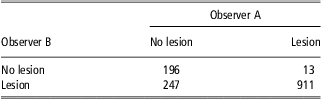
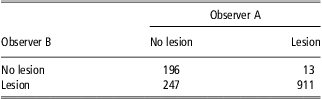
The percentage of agreement between observers was 80.98% and is summarized in Table 1. The kappa coefficient was 0.497, which according to Landis and Koch (Reference Landis and Koch1977) is considered as moderate agreement. To our knowledge, the quality of the photos assessed (mainly the hair of the feet or the focusing of the photos) could cause a lower value of the kappa coefficient than expected.
Contingency table for the two observers’ results of prevalence of pododermatitis in 1367 does’ legs
Cluster analysis
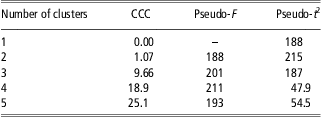
The tree diagram resulting from the cluster analysis is shown in Supplementary Figure S2. Moving upward in the diagram, the assessed lesions are less closely related. These procedures allowed all the lesions observed in the four different clusters to be gathered according to the dendogram shown in the Supplementary Figure S2, and CCC, the pseudo F- and pseudo t 2-tests shown in Table 2. Clusters are composed of elements that are the most similar while being the most different from elements belonging to other clusters. Four clusters gave the combined optimum values of CCC, pseudo-F and pseudo-t 2 values.
Display of the last five generations of the cluster history
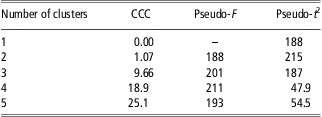
CCC = Cubic Clustering Criterion; Pseudo-F, pseudo-t 2 = statistics for estimating the number of clusters.
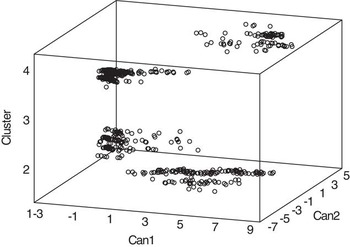
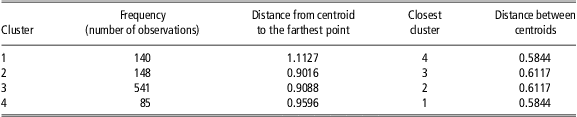
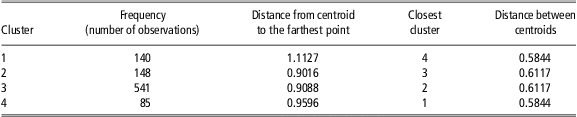
These four clusters are shown in Figure 1 and the summary of the cluster analysis is presented in Table 3. As can be observed in this table, the largest cluster is cluster 3 and the smallest cluster is cluster 4. Distance between centroids (the point whose coordinates are equal to the average values of the variables for the observations in that cluster, SAS, 2009) refers to the inter-cluster variability and clusters 2 and 3 are thus the most different. Distance from this centroid to the farthest individual inside a cluster refers to the intra-cluster variability and the four clusters present a similar homogeneity, although cluster 1 is slightly more heterogeneous. Moreover, Figure 1 shows the graphic interpretation of the clusters, and discriminant analysis helps to know which variables are most important in the differentiation of the clusters. To this regard, all the variables are important in the formation of the clusters, except for the grey color and raw aspect (P = 0.4025 and P = 0.2383, respectively).
Diagram of the four groups that comprise all the observations. Can1 and Can2 = canonical variables computed during the clustering procedure.

Cluster analysis summary
Description of the clusters and definition of the score
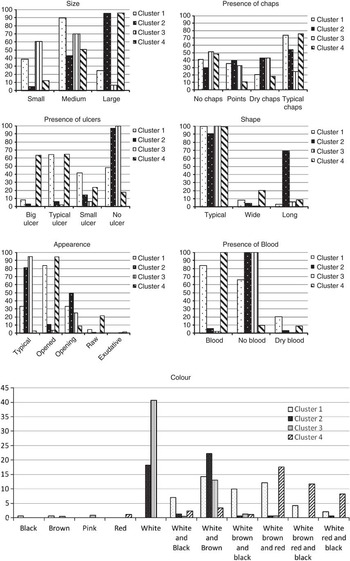
The following step was the description of each cluster with the frequency procedure; the results are shown in Figure 2. These graphs enable the frequency of each variable in the four clusters to be determined, which will assist in reaching the final score. In general, each cluster presents different features and the severity of the lesions included in them can be observed. For example, the exudative or putrid variable is mainly present in individuals in cluster 4, while those lesions in which blood was not present are predominantly in clusters 2 and 3. In summary, the characteristics of each cluster are detailed as follows:
Frequency of the studied items in each cluster.

• Cluster 1: lesion of medium size, typical chaps, open wounds, medium or small ulcers and with presence of blood (regardless it is dry or not).
• Cluster 2: large lesion, with dried chaps, without any type of ulcer, long or typical shape, hyperkeratosis (typical appearance), wounds starting to open and absence of blood.
• Cluster 3: small lesion, without chaps or dry chaps, without ulcers and blood. Only hyperkeratosis.
• Cluster 4: large lesions, with typical chaps and opened wounds, medium and big ulcers, with presence of blood and putrid or exudative aspect.
Consequently, the animals with the mildest form of lesions are those in cluster 3, the worst are those in cluster 4 and clusters 1 and 2 have intermediate values for most factors.
The fact that these results come from a combination of several factors must be considered. Thus, some of them might be more helpful in the classification of a lesion than others. For example, the color of the lesion appears not to be a very useful tool, given the wide variation in classifications. Nevertheless, in Figure 2 it can be observed that the lesions in which black, red and brown (colors related to the presence of blood) were observed are mainly classified in clusters 1 and 4.
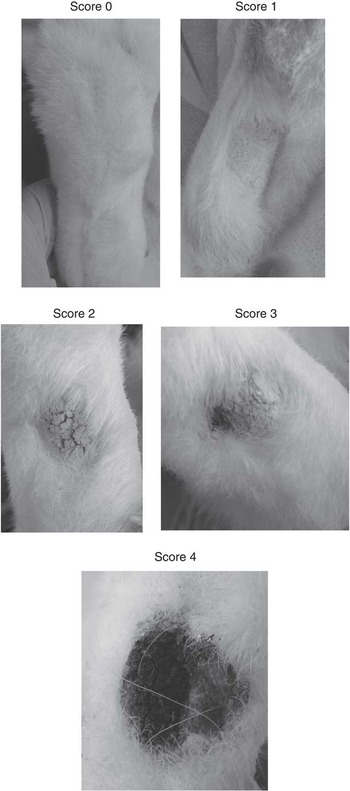
According to these aspects, a scoring system for pododermatitis in rabbits can be defined as follows (see Figure 3 for an example of each level):
Example of the each score.

• Score 0: foot without any type of lesion, well furred footpad.
• Score 1: hyperkeratosis. Small lesions, skin with absence of chaps or dry chaps, without any ulcer, wound or blood (equivalent to cluster 3).
• Score 2: hyperkeratosis and skin with dried chaps, which may be starting to open and spots appear, without any type of ulcer, and absence of blood (cluster 2). Any lesion qualified as long or large is included in this cluster, regardless of the presence of chaps.
• Score 3: typical chaps, wounds opened, medium or small ulcers (related to the size of the whole lesion) and with presence of blood (regardless it is dry or not; cluster 1).
• Score 4: open chaps and wounds, medium and large ulcers, with presence of blood and putrid or exudative aspect (cluster 4).
This score has one level more than suggested by Rommers and Meijerhof (Reference Rommers and Meijerhof1996) and more details are considered. This level of detail may help to make the scoring system more reliable as it takes the different characteristics into account in the different stages of the lesions. It has also been observed that pododermatitis in rabbits is not as homogeneous as footpad dermatitis in broilers, for example, so scores that are only based on the size (Pagazaurtundua and Warriss, Reference Pagazaurtundua and Warriss2006) do not analyze the problem deeply enough, as there are many aspects that would not be considered.
Some authors state that plantar hyperkeratosis (score 1) is an extremely early stage of pododermatitis where the welfare impact is less clear (Welfare Quality, 2009) and do not consider it a disorder (Rosell and de la Fuente, Reference Rosell and de la Fuente2009b). In our opinion, this early stage should be taken into account when developing a score in order to enable preventive actions to be taken. On the other hand, according to the severity of the lesion, animals scoring 4 have severely compromised welfare, and this severe infection or deep ulceration may be difficult or impossible to cure (Harvey, Reference Harvey1995). In addition, it has to be considered that the welfare of does with score 3 is also compromised and scores lower than 3 indicate a risk of lesions developing into higher scores and hence, reduced welfare. Thus, these animals should be closely monitored and treated if necessary.
When scoring systems are being developed and applied in practice, auditors must be allowed to use a consistent scoring method and minimize discrepancies in the assessment of different farms (Webster et al., Reference Webster, Fairchild, Cummings and Stayer2008). If the system has a high number of levels, differences between categories might be subtle enough to make the scoring difficult and slow (Webster et al., Reference Webster, Fairchild, Cummings and Stayer2008). Simpler ones are recommended (a 3 or 4 points scale), without taking into account score 0, as they would probably increase the inter-assessor repeatability as the definitions of the score are more precise (Welfare Quality, 2009). This is the case of the scoring system proposed in this study, as there are four different levels of lesions, which was proposed for broilers by Welfare Quality (2009).
Conclusions
In this work, cluster analysis provided a more precise description of different stages of pododermatitis in rabbits, leading to a better scoring system. This classification maximizes dissimilarity between the clusters, and allows a simple and reliable 5-point scoring system to assess pododermatitis in rabbits to be developed. This scoring system has practical implications, given that animals scoring 4 would be candidates for culling in commercial breeding farms and animals scoring 3 should be closely monitored, as their welfare is also compromised.
Acknowledgments
The authors wish to thank Esther Nebot for taking the photos and her help with organization of the data.
Supplementary materials
For supplementary materials referred to in this article, please visit http://dx.doi.org/doi:10.1017/S1751731112002509