Introduction
There is a considerable body of evidence that identifies women as reporting higher levels of depression across most of the adult lifespan (Bebbington, Reference Bebbington1998; Piccinelli and Wilkinson, Reference Piccinelli and Wilkinson2000). In late life, the evidence for these gender differences is mixed. Whilst there is evidence that gender differences disappear (Barefoot et al., Reference Barefoot, Mortensen, Helms, Avlund and Schroll2001; van't Veer-Tazelaar et al., Reference van't Veer-Tazelaar2008; Pachana et al., Reference Pachana, McLaughlin, Leung, Byrne and Dobson2012), other studies purport that these differences persist into late life (Osborn et al., Reference Osborn2002; Zunzunegui et al., Reference Zunzunegui2007). It has been suggested that the disparity in these findings can be attributed to a range of study design effects (Burns et al., Reference Burns, Butterworth, Windsor, Luszcz, Ross and Anstey2012a). Indeed, of those studies cited, those studies that indicated that gender differences remained in old age typically had larger samples. Furthermore, attrition of participants, due to their advanced age, has made obtaining accurate estimates of within-person change in depression in older adults problematic (Snowdon, Reference Snowdon2001). There is also some evidence to suggest that these contrasting findings of late-life depression may be compounded by changes in depressive symptomology that reflects increases in sub-syndromal depression and not a level of symptomology that would reflect clinical depression (Bergdahl et al., Reference Bergdahl2005; Steffens et al., Reference Steffens, Fisher, Langa, Potter and Plassman2009). It is suggested that rates of sub-syndromal depression in late life are almost three times those with clinical depression (VanItallie, Reference VanItallie2005).
A confounding issue in delineating the course of late-life depression is the impact of impending death. Depression is associated with higher risk of mortality and higher levels of depression are reported in the years prior to death (Saz and Dewey, Reference Saz and Dewey2001; Anstey and Luszcz, Reference Anstey and Luszcz2002). There is evidence that decline in well-being, including depression, is more substantial when utilizing a distance-to-death metric rather than chronological age time metric (Gerstorf et al., Reference Gerstorf, Ram, Rocke, Lindenberger and Smith2008b; Reference Gerstorf2010). However, there is only limited evidence to describe the extent to which gender differences in depression are maintained in the years approaching death (Anstey and Luszcz, Reference Anstey and Luszcz2002). Indeed, in contrast with those findings that indicate women as being at greater risk of depression, Anstey and Luszcz Reference Anstey and Luszcz(2002) demonstrated that men with incident depression were most vulnerable to mortality. Whether gender differences in the trajectories of both probable depression and depressive symptomology are similarly indicated over a distance-to-death metric remains to be explored.
The current study utilizes the Dynamic Analyses to Optimise Ageing (DYNOPTA) project (Anstey et al., Reference Anstey2010) to compare gender differences in depression over time in a sample of older adults who had died. Specifically, we compare gender differences in the trajectories of depression over age and distance-to-death metrics. Our comparisons utilize measures of depression operationalized as both probable depression and depressive symptomology. Finally, the role of physical health has been implicated as an important confounding issue in describing the relationship between mental health and mortality (Batterham et al., Reference Batterham, Christensen and Mackinnon2012). Consequently, we will control for self-rated health (SRH) status in exploring changes in probable depression and depressive symptomology. SRH was introduced into social and medical research as a cost-efficient alternative to clinical assessments of health status (Maddox, Reference Maddox1999). Reflecting respondents’ rating of their general health, SRH has become an important component in the measurement of overall health status in both clinical and epidemiological research. Associations between SRH with chronic illness, number of physical symptoms, somatization, hypochondriasis, functional disability, and physicians’ health ratings have been reported (Barsky et al., Reference Barsky, Cleary and Klerman1992). Poor SRH is a strong predictor of stroke, functional decline, nursing home entry, falls, driving cessation, increased health service utilization, and mortality (Blaum et al., Reference Blaum, Liang and Liu1994; Lee and Shinkai, Reference Lee and Shinkai2003; Anstey et al., Reference Anstey, von Sanden and Luszcz2006a; Reference Anstey, Windsor, Luszcz and Andrews2006b).
Aims
This study will therefore be guided by three aims. First, we will evaluate whether age or a distance-to-death metric best reflect changes in depressive symptomology and probable depression for both males and females in a sample of older decedents. Second, we will compare the differences in trajectories of depressive symptomology and probable depression between males and females. Third, we will examine whether changes in age and/or mortality-related depressive symptomology and probable depression are accounted for by co-varying SRH.
Methods
Participants
Data for these analyses were drawn from the DYNOPTA project (Anstey et al., Reference Anstey2010). The DYNOPTA project pools data from nine Australian longitudinal studies of aging and comprises the Australian Longitudinal Study of Ageing (ALSA), the Australian Longitudinal Study of Women's Health (ALSWH), the Australian Diabetes, Obesity and Lifestyle study (AusDiab), the Blue Mountains Eye Study (BMES), the Canberra Longitudinal Study (CLS), the Household, Income and Labour Dynamics in Australia Study (HILDA), the Melbourne Longitudinal Studies on Healthy Ageing (MELSHA), the Personality and Total Health (PATH) through Life Study, and the Sydney Older Person Study (SOPS). The harmonization of existing studies, by pooling data or parallel analysis, is increasingly recognized as an important method that adds value to, and addresses the limitations of, investment in individual longitudinal studies (Piccinin and Hofer, Reference Piccinin, Hofer, Hofer and Alwin2008). Overall, the pooled DYNOPTA dataset comprised 50,652 respondents at baseline. For this study, participants (N = 2,852) were only selected if they reached mortality by the year 2006, which was the last date of mortality information common to all contributing studies. Participants were aged 45–105 years (mean = 73.35 years; SD = 8.97 years) at baseline, were observed for up to 16 years (mean = 7.78 years; SD = 2.97 years) prior to death, and provided between two and four observations (mean = 2.5 observations).
Measures
Depression
Mental health is a key focus of the DYNOPTA project, yet no single depression scale was common to all the contributing studies. The harmonization of a depression scale and creation of a binary variable that reflects “probable depression” has previously been described and examined in the DYNOPTA study (Burns et al., Reference Burns, Byles, Mitchell and Anstey2012b; Reference Burns, Butterworth, Luszcz and Anstey2013). In summary, each contributing study to DYNOPTA included one of four scales that are frequently used to assess depression or affective disorders, each with sound psychometric properties, validity, and clinical utility. These scales included the Mental Health Index from the Short-Form Health Survey-36 (SF-36) used in the ALSWH mid-life and old samples, AusDiab, and HILDA; the Mental Health Components Summary score from the shorter SF-12 used in the PATH study; the Centre for Epidemiological Studies Depression Scale (CESD) used in the ALSA and SOPS studies; and the Psychogeriatric Assessment Scales (PAS) used in the CLS and MELSHA studies. We standardized each of these scales to form a continuous measure of depressive symptomology and then defined a common cut-point to identify those DYNOPTA respondents with likely or probable depression by considering the various cut-points for the individual scales reported in the literature that have been validated to external criteria (Burns et al., Reference Burns, Butterworth, Windsor, Luszcz, Ross and Anstey2012a). The study was approved by the Human Research Ethics Committee at The Australian National University.
Time
Two time metrics were utilized: the first, age, reflects the number of years since baseline measurement and is annualized to reflect increasing chronological age, and the second, distance-to-death, reflects the number of years from an observation point to the year of death.
Covariates
Our models adjusted for demographic characteristics including baseline age, health, education, partner status, and residential status. SRH was measured using the global health item from the SF-36, which requires participants to describe their general health on a five-point rating scale from “1: excellent” to “5: poor.” SRH was recoded into a binary variable to reflect “excellent/good” (the reference category) and “fair/poor” SRH. The SF-36 SRH item loads onto a general health subscale which subsequently reports stronger associations with the Physical Health Component Score. Replication of the SF-36 factor structure in the DYNOPTA study has previously been validated (Bartsch et al., Reference Bartsch, Butterworth, Byles, Mitchell, Shaw and Anstey2011). Education was classified into three levels relating to the extent of school and tertiary education participants reported: “no post-school education” (the reference category); “post-school non-tertiary education;” “post-school tertiary education.” Participants’ partner status was classified into two categories: “partnered” (the reference category) or not partnered.” Residential status was classified as either “living in the community” (the reference category) or in “residential care home.” SRH, partner status, and residential status were included as time-varying covariates. Finally, due to the source of our data being elicited from a harmonization project, we adjusted analyses for a series of dummy codes for each contributing study to the DYNOPTA project.
Statistical analysis
Statistical analyses were undertaken in STATA v.10. We utilized mixed models with random intercept and slopes to examine differences in the change of depressive symptomology between gender, over age, and distance-to-death metrics. For the analysis of probable depression, we utilized a random intercept logistic regression model to derive estimates of probable depression. Both analytical methods employ maximum likelihood estimation. All analyses were stratified by gender and adjusted for age, partner status, residential status, education, SRH, and an identifier of contributing study. The inclusion of quadratic time metric effects, in all analyses, did not improve model fit and were therefore excluded from the results reported here.
Results
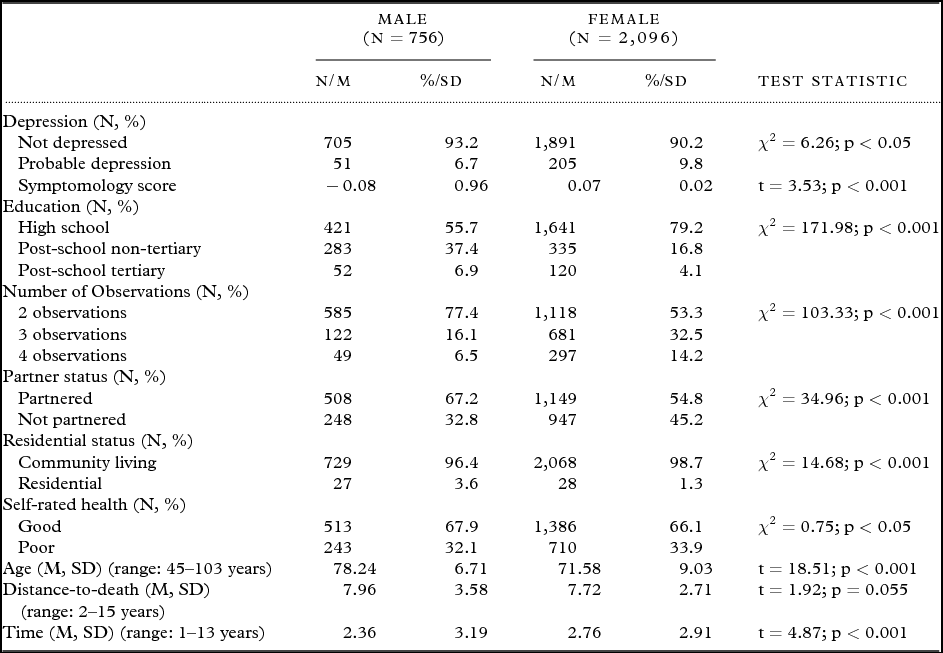
A comparison of the baseline covariates between male and female participants is reported in Table 1. A number of significant differences were observed. At baseline, males were more likely to be educated post high school, partnered, living in residential care, older, and to have good SRH. Due to the nature of the contributing longitudinal studies of aging, attrition past the second observation, particularly for males, was observed. Gender differences in depression were observed; male participants were less likely to report probable depression and reported lower levels of depressive symptomology at baseline.
Sample descriptive statistics by gender at baseline

Depressive symptomology
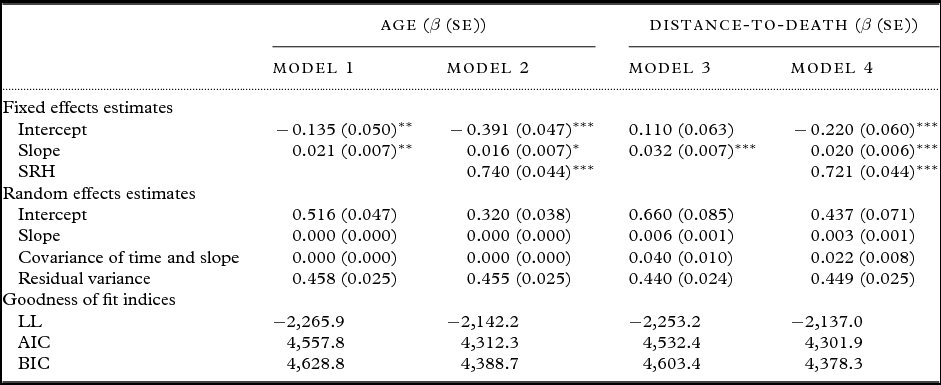
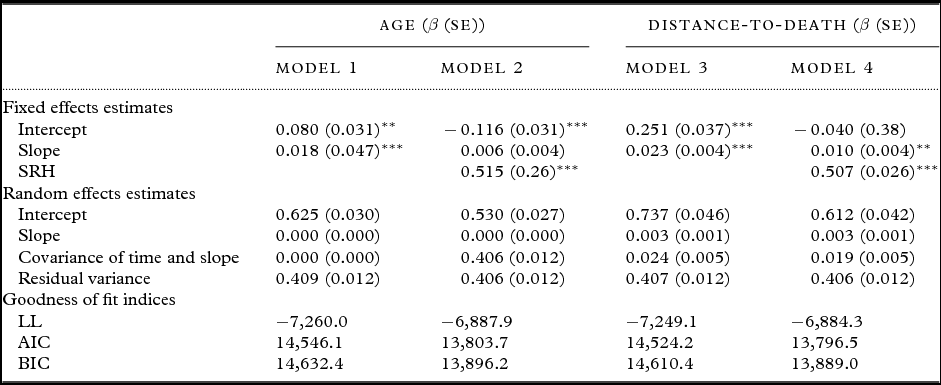
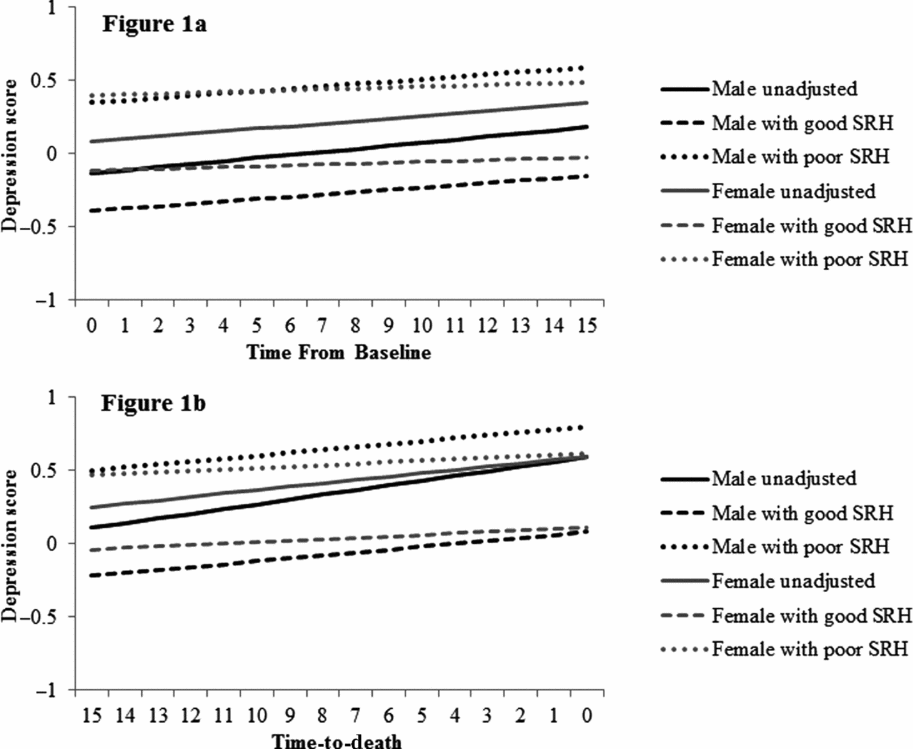
We compared changes in levels of depressive symptomology between male (Table 2) and female (Table 3) participants over two time metrics. Over an age metric, results indicated a small increase in depressive symptomology over time for both male (β = 0.021; SE = 0.007; p < 0.01) and female (β = 0.018; SE = 0.005; p < 0.001) participants, suggesting increasing levels of depressive symptomology with increasing age. Subsequently adjusting for SRH improved model fit, however small increases in depressive symptomology over increasing age were now only estimated for males (β = 0.016; SE = 0.007; p < 0.05). Changes in depressive symptomology over a distance-to-death metric were also reported for both male (β = 0.032; SE = 0.007; p < 0.001) and female (β = 0.023; SE = 0.004; p < 0.001) participants, indicating an increase in depressive symptomology for each year approaching death. Similar to those analyses that utilized an age metric, adjusting for SRH improved model fit for the models that utilized a distance-to-death metric. However, increases in depressive symptomology were estimated for both male (β = 0.020; SE = 0.006; p < 0.001) and female (β = 0.010; SE = 0.004; p < 0.01) participants. A visual comparison of goodness of fit indices, whereby smaller values reflect better fitting models, indicates that those models that utilized a distance-to-death metric are a better method for describing change in depressive symptomology for both males and females. Of particular importance, we note that most of the variance in depressive symptomology was accounted for at the intercept indicating little variance in how individuals changed their symptomology over both time metrics. For both time metrics, males were estimated to have lower intercepts, but a greater increase in rates of change in depressive symptomology compared to females. Most notable is the influence of poor health status on depressive symptomology where rates of change in depressive symptomology were attenuated after adjusting for SRH, particularly for female participants (see Figures 1a and b).
Changes in level of depressive symptomology over time for males
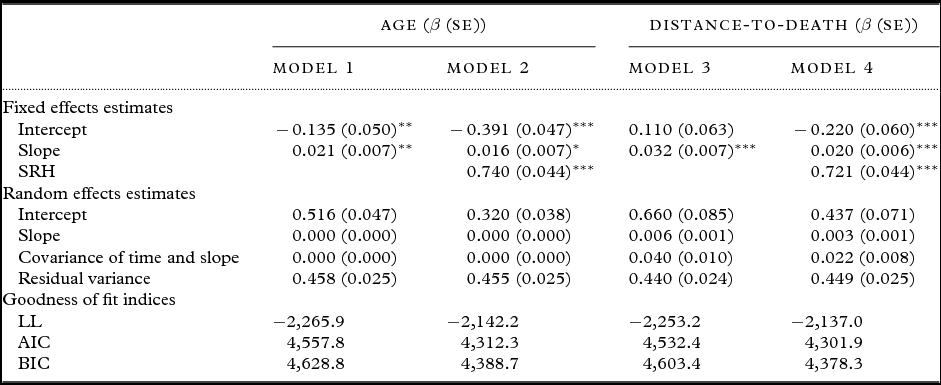
Notes: *p < 0.05; **p < 0.01; ***p < 0.001. Model 1 and 3 estimates residualized for baseline age, baseline partner status, education, residential status, self-rated health, and time-varying partner status and residential status. Model 2 = Model 1 and self-rated health; Model 4 = Model 3 and self-rated health.
SRH = self-rated health; LL = log-likelihood value; AIC = Akaike information criteria; BIC = Bayesian information criteria.
Changes in level of depressive symptomology over time for females
Notes: *p < 0.05; **p < 0.01; ***p < 0.001. Model 1 and 3 estimates residualized for baseline age, baseline partner status, education, residential status, self-rated health, and time-varying partner status and residential status. Model 2 = Model 1 and self-rated health. Model 4 = Model 3 and self-rated health.
SRH = self-rated health; LL = log-likelihood value; AIC = Akaike information criteria; BIC = Bayesian information criteria.
Probable depression
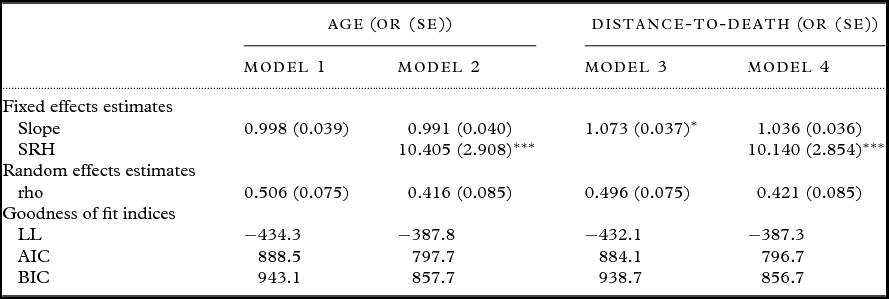
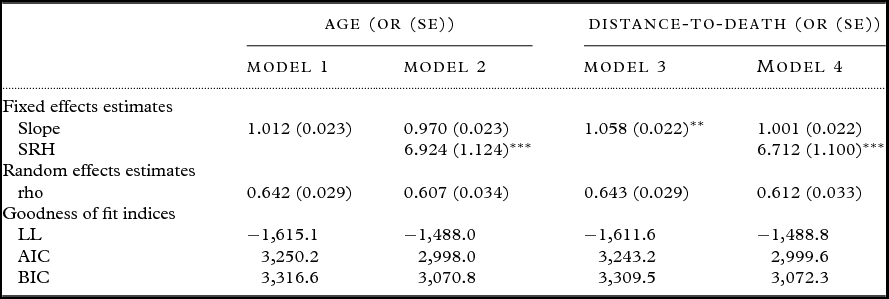
We repeated our analyses by replacing our continuous depression measure with a binary measure that reflected probable depression (Tables 4 and 5). Unlike our earlier analysis of the changes in depressive symptomology over the age metric, the likelihood of participants reporting probable depression was stable over time for both males and females. Both male (OR = 1.073; SE = 0.037; p < 0.05) and female (OR = 1.058; SE = 0.022; p < 0.01) participants reported increased likelihood of reporting probable depression in the years approaching mortality in models unadjusted for SRH. However, these effects appeared to be accounted for with the inclusion of SRH which was itself a significant predictor of probable depression for male and female participants across both time metrics. A visual comparison of goodness of fit indices indicated little change in model fit between models that utilized either distance-to-death or age metrics.
Changes in level of depression likelihood over time for males
Notes: *p < 0.05; **p < 0.01; ***p < 0.001. Model 1 and 3 estimates residualized for baseline age, baseline partner status, education, residential status, self-rated health, and time-varying partner status and residential status. Model 2 = Model 1 and self-rated health. Model 4 = Model 3 and self-rated health.
SRH = self-rated health; LL = log-likelihood value; AIC = Akaike information criteria; BIC = Bayesian information criteria.
Changes in level of depression likelihood over time for females
Notes: *p < 0.05; **p < 0.01; ***p < 0.001. Model 1 and 3 estimates residualized for baseline age, baseline partner status, education, residential status, self-rated health, and time-varying partner status and residential status. Model 2 = Model 1 and self-rated health. Model 4 = Model 3 and self-rated health.
SRH = self-rated health; LL = log-likelihood value; AIC = Akaike information criteria; BIC = Bayesian information criteria.
Discussion
In this study, we compared trajectories of probable depression and depressive symptomology over age and distance-to-death metrics between males and females in a sample of older adults who had died. For analyses of both probable depression and depressive symptomology, comparison of goodness of fit indices supports an increasing body of evidence that suggests that change in late-life mental health is best interpreted in the context of time to mortality rather than as an aging process (Gerstorf et al., Reference Gerstorf, Ram, Estabrook, Schupp, Wagner and Lindenberger2008a; Reference Gerstorf2010). Overall, there was no evidence for increased likelihood of probable depression with increasing age. Whilst there was limited support for the increased likelihood of probable depression in the years leading to death, this effect was accounted for by SRH. The evidence for an increase in depressive symptomology with increasing age and approaching mortality was more clear and substantive. Whilst increases in depressive symptomology with increasing age were reported, the increase in depressive symptomology in those models that utilized a distance-to-death metric was more marked. However, adjusting for SRH significantly accounted for much of this effect, particularly for females. These findings suggest that late-life depressive symptomology may be strongly influenced by comorbid physical health conditions. Alternatively, a common-cause hypothesis may posit that declines in both physical and mental health states may reflect deterioration in other underlying organic processes which are mortality-related (Anstey et al., Reference Anstey, Hofer and Luszcz2003).
Whilst our results confirm earlier findings in relation to gender differences in depression (Bebbington, Reference Bebbington1998; Anstey and Luszcz, Reference Anstey and Luszcz2002), we also present new findings on gender differences in the trajectories of late-life depression, particularly in relation to the changes that occur in the years leading to mortality. In fully adjusted models, female participants reported higher levels of depressive symptomology, but males reported increases at a rate twice that of females such that over distance-to-death there are no apparent sex differences in the year preceding death (see Figure 1b). This supports prior research that identified incident depression as a greater risk for mortality amongst men (Anstey and Luszcz, Reference Anstey and Luszcz2002). This pattern of increasing depressive symptomology, particularly in our older male participants, confirms findings relating to the increase in rates of suicide in older men (Mitty and Flores, Reference Mitty and Flores2008), a pattern that is well established in Australian national prevalence rates (ABS, 2012). Indeed, there is evidence that increased depression in late life is a major risk factor for suicide (Conwell, Reference Conwell1992). It remains to be determined whether these changes in depressive symptomology in the years preceding death for men are an artifact of approaching death or a decline in other health-mortality-related conditions which might manifest themselves in increased depression, or whether increased depression is itself a risk factor for early mortality. That the effect for increasing depressive symptomology is particularly noticeable amongst males warrants further attention. Whilst it is established that females generally report higher levels of depression or symptomology, it appears that the context of increasing proximity to death is adversely affecting males more so than for females and supports some prior findings (Anstey and Luszcz, Reference Anstey and Luszcz2002). The reasons remain unclear. It may be that males are more vulnerable to late-life changes in physical, social, and cognitive functioning, or it could be associated with a loss of identity in late life, particularly as many of these older males would have centered a significant weight to their images of self-worth and identity in their working lives.
We do acknowledge a number of limitations of this study. Primarily, these relate to our measure of depression and the nature of the pooled dataset. First, we lacked data on clinical diagnosis of depression and relied on a harmonized measure of four mental health scales that were standardized across a number of independently designed population surveys. Depression and our covariates were harmonized so as to remain comparable across studies; the need to rescale responses onto a common metric may have resulted in a loss of variability compared to the original data, possibly reducing the precision of our estimates. The pooled DYNOPTA dataset includes studies with both narrow and broad age-ranges, which when coupled with baseline years that span the 1990s, results in the aggregation of differing birth cohorts. It is possible that younger birth cohorts experience different late-life depression trajectories compared to older birth cohorts. However, confounds that were potentially introduced by study differences were minimized by aligning measures on a common scale and adjusting for study effects in our analyses.
Despite these limitations, these findings add important information to the delineation of the course of late-life depression and approaching death. We have identified the utility of observing mental health changes over a distance-to-death metric rather than an age (distance-from-birth) metric. First, we have demonstrated that changes in mental health in late life are mostly unrelated to age and more closely related to one's death. Second, we show that much of the mental health change that occurs in the years leading to death could be explained by other co-morbid health conditions. There is some evidence that increased depression in the years preceding mortality is related to morbidity and associated functional limitations (Batterham et al., Reference Batterham, Christensen and Mackinnon2012), and whilst our results are adjusted for SRH, these issues remain to be more fully explored. It is likely that there is a complex association between physical health, depression, suicide, and mortality, which remains to be explored. Over the time-to-death metric, the impact of poor SRH was a particular vulnerability for males in this study (see Figure 1b). Significantly, the DYNOPTA project incorporates a large population-based sample on which data were available for up to 4 observations for 16 years from death; indeed, we specifically excluded those participants who only provided depression data at baseline. Importantly, our estimates are adjusted for baseline education, age, and time-varying partner status, residential status, and SRH. However, future research should extend our findings to determine how within-person change in these covariates moderates the trajectories of late-life depression and whether their impact is invariant between gender groups.
To conclude, context is important to understanding late-life changes in depressive symptomology; mortality is more important than increasing age. Whilst changes in probable depression were not observed in fully adjusted models for either male or female participants, increasing levels of depressive symptomology in the years approaching death were still reported. Over both time metrics, females reported higher levels of depressive of symptomology and probable depression, although it was the male participants who reported higher rates of change. Overall, our findings show that males report increasing levels of depressive symptomology approaching death, particularly when they experience poor physical health. This may have particular significance for aged care and health service provision; whilst such services for older people in the later years of their lives often focus on their physical health needs, clinicians need to be aware of the associated mental health needs and design services to address overall health and well-being.
Conflict of interest
None.
Description of authors’ roles
All authors have read and approved the final version of this paper. Specifically, Burns formulated the research question, determined the analytical methods, and undertook the statistical analysis, and led the writing of the paper. Luszcz supervised the data collection, formulated the research question, and contributed to writing the paper. Kiely and Butterworth contributed to the analytical method and analyses, and helped in writing the paper. Browning, Mitchell, and Anstey supervised the data collection and contributed to writing the paper.
Acknowledgments
The data on which this research is based were drawn from several Australian longitudinal studies including: the Australian Longitudinal Study of Ageing (ALSA), the Australian Longitudinal Study of Women's Health (ALSWH), the Australian Diabetes, Obesity and Lifestyle Study (AusDiab), the Blue Mountains Eye Study (BMES), the Canberra Longitudinal Study (CLS), the Household, Income and Labour Dynamics in Australia study (HILDA), the Melbourne Longitudinal Studies on Healthy Ageing (MELSHA), the Personality and Total Health (PATH) through Life Study , and the Sydney Older Person Study (SOPS). These studies were pooled and harmonized for the Dynamic Analyses to Optimise Ageing (DYNOPTA) project. DYNOPTA was funded by the National Health and Medical Research Council (NHMRC grant no. 410215). All studies thank the participants for volunteering their time to be involved in the respective studies. Details of all studies contributing data to DYNOPTA, including individual study leaders and funding sources, are available on the DYNOPTA website (http://dynopta.anu.edu.au). The findings and views reported in this paper are those of the author(s) and not those of the original studies, or their respective funding agencies. Burns is supported by the Australian Research Council Centre of Excellence in Population Ageing Research (project no.: CE110001029). Anstey is supported by an NHMRC Research Fellowship (no. 366756).