

Balanced development and growth have been at the center of the discourse of all governments in Lebanon since the end of the civil war in 1990. Yet the country has seen growing inequality and disparities in growth rates and development across regions. In attempting to reconcile these two facts, we examine the allocation of public resources and find that the discourse of balanced development has been primarily rhetorical and that public funds have been channeled along a vector remarkably consistent with political concern for sectarian balance. To our knowledge, this is the first quantified instantiation of this finding of concordance between the disbursement of public funds and the sectarian composition of the Lebanese population and one that is specifically concerned with a realm of public decision making that economists, political scientists, and public-policy analysts would hope is governed by better practice and sounder policy.
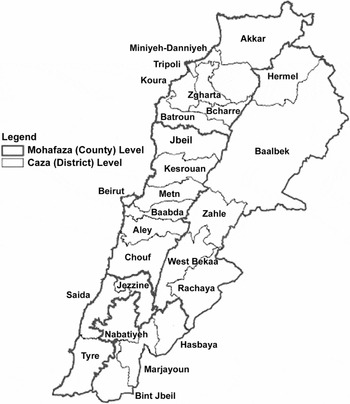
The purpose of this article is twofold. First, we aim to evaluate the records of executive branches of government that are involved in public social spending in terms of their ability to respond to need and to address it. Second, we attempt to uncover the criteria underlying the distribution of public social spending. Thus, the article looks at the spending records of the ministries of health, education, and social affairs, disaggregated by caza (district). (See Figure 1 for a map of Lebanon's cazas along with its larger regions or mohafazas.) The allocation of funds across sectors and districts is then evaluated according to a vector of those socioeconomic characteristics of each locality thought to be of relevance if the allocation were primarily concerned with balanced development and with economic and social justice.
A political map of Lebanon. Mohafazas and cazas (clockwise from top): North Lebanon (Akkar, Batroun, Bcharre, Koura, Miniyeh-Danniyeh, Trablous [Tripoli], Zgharta); Bekaa (Baalbek, Hermel, West Bekaa, Rachaya, Zahle); Nabatiyeh (Nabatiyeh, Bint Jbeil, Hasbaya, Marjayoun); South Lebanon (Tyre [Sur]), Jezzine, Saida); Mount Lebanon (Aley, Baabda, Chouf, Jbeil [Byblos], Kesrouan, Metn); Beirut (Beirut). From European Commission, “Lebanon 34 Day War: Fact Finding Mission and Preliminary Damage Assessment,” EuropeAid Cooperation Office, October 2006. Copyright European Commission 2006. Reprinted with permission.

Balanced development and capacity building has been the dominant paradigm in development thought for over a decade. The arguments in favor of making balanced growth a priority are numerous and range from the positive economicFootnote 1 to the ethicalFootnote 2 and political.Footnote 3 For example, there are efficiency gains to balanced development related to higher marginal returns on investment in education and health in the peripheries, avoiding the costs of overcrowding urban centers, and increasing returns due to possible complementarities between different regions. In other words, evidence on decreasing marginal returns to investments in education and health suggests that there are efficiency gains from increasing investment in underserved areas. Diminishing marginal gains from education and health notwithstanding, an allocation of development assistance that favors urban centers, which already receive a larger share of public spending, might carry additional costs of overcrowding urban centers. Finally, there is reason to believe that there may be external gains from regional complementarities when development is more balanced so that the expansion of one region may have positive spillover effects on neighboring regions. A strategy of balanced development uses gains from these complementarities optimally. Similarly, a “gains from trade” argument could be made in favor of developing regions according to their comparative advantages and reducing transport costs between them.Footnote 4 There is also evidence linking income and asset inequality to lower overall life expectancyFootnote 5 and lower overall growth rates.Footnote 6 The findings in the political economy literature relating inequality in income and development to greater violenceFootnote 7 and political instabilityFootnote 8 also provide motivation for balanced growth.
It is not difficult to define unbalanced development as development that does not assure equitable levels of growth and prosperity. Defining balanced development is more of a challenge because there are disparities across regions owing to intrinsic differences in geographical characteristics, population densities, and scale economies. To examine these issues, we use the data from two surveys of household living conditions, undertaken in 1997 and 2004 by the United Nations Development Programme (UNDP) and the Lebanese Central Administration of Statistics (CAS), to identify and evaluate the needs, at the disaggregated caza level, of each locality and within each sector.Footnote 9 This allows us to assess the rationality and effectiveness of spending according to the needs we identified as well as the extent to which public spending since 1995 has deviated from the benchmark based on the identified needs. We find that the vector of needs bears little relation to the allocation of public funds whether the spending is on health or on education. We also find that regional poverty indices seem to be independent of the distribution of government social-assistance expenditures.
We use voting records to estimate the sectarian composition of each administrative unit in the country. When compared with the geographical distribution of public spending, we find a striking conformity between the sectarian composition of the population and each sect's estimated share of public spending. The finding is consistent with a one-man one-dollar spending scheme. However, we further claim that the logic of the disbursement of public funds and the mechanism underlying the observed one-man one-dollar distribution rule—a rule with primacy over health, education, and infrastructure needs and imbalances across regions—is that distribution be balanced across sects.
Power sharing on the basis of confessional identity has been the rule of governance in Lebanon since the mid-19th century. The succession of Lebanese republics, from the first republic established under French Mandate in 1926 to the second republic at independence in 1943 and the Taʾif republic, which brought an end to the civil war in 1990, has seen only amendments to the relative weights accorded each sect, never a departure from the principle of sectarian quotas in governance. Our findings are consistent with a reading of the postwar power-sharing agreement crystallized in the Taʾif Accords (the de facto new constitution of Lebanon) that sees it as only further entrenching confessionalism as a cornerstone of public decision making in Lebanon.Footnote 10 Confessional balance and confessional representation are reproduced and further institutionalized in the new constitution as amended by the Taʾif Accords, which only managed to alter the sectarian quotas of representation, not to reduce confessionalism.
The tools available to policymakers to achieve balanced development and poverty alleviation include targeting mechanisms, which determine the allocation of public transfers and investments according to geographic location, beneficiary characteristics (proxy-means testing), or specific incidents (where beneficiaries are people adversely affected by a particular event). There has been little systematic targeting in existing programs in Lebanon, compounded by a deficiency in standard data on poverty and social indicators, weak coordination and overlapping mandates across different programs, and weak safety nets that provide little shock absorption. This article will evaluate the effectiveness of public assistance in alleviating poverty in Lebanon, keeping in mind that the failure of an allocation of public expenditures to benefit its target population does not constitute sufficient evidence that the targeting criteria are being subordinated to other prerogatives and may instead be the result of a weakness in the targeting scheme itself or an indication of inherent differences across regions that are difficult to overcome. In this respect, it should be noted that poverty alleviation only came to the forefront of the official development plan of the Lebanese government in the mid-1990s. The priorities of the governments of the early period after the civil war centered instead on reconstruction and rehabilitation.
The next section provides an overview of the evolution of public expenditures since the early 1990s, and the following section maps geographically disaggregated measures of various social and development indicators of poverty, health, and education against disaggregated measures of government spending in each of these sectors. The next section compares public expenditures with the sectarian distribution across cazas and shows a striking conformity in the allocation of resources across confessional groups.
PUBLIC EXPENDITURE IN LEBANON: AN OVERVIEW
Although infrastructure and public spending were distributed across all Lebanese regions during the mandates of the first two presidents after independence, it was only with the government of General Fouad Chehab (1958–64) that the slogan of “balanced development” was officially adopted and the reduction of regional inequality became a stated priority. A fact-finding effort was conducted to assess the extent of disparities in development, and the “macrocephalic domination” of Beirut as the center of the country was confirmed.Footnote 11 In the mid-1960s, the Ministry of Planning embarked on a nationwide project of development that included paved access, drinking water, and electricity for all Lebanese villages.Footnote 12 However, although the indicators of development show improvements for most Lebanese regions in the early 1970s, the disparities among regions remained unchanged. In the 1970s, the focus of development plans shifted to address problems related to the chaotic growth of the capital and the sprawling poverty belt around it.
Balanced Development in the Postwar Era
Following the end of the civil war in 1990, the Lebanese economy saw an unprecedented increase in government expenditures: spending expanded from U.S. $1.3 billion in 1992 to above U.S. $7 billion in 2003, an almost threefold increase in real terms. According to the World Bank, between 1990 and 2005 a total amount of U.S. $10.3 billion was spent on capital expenditures (equivalent to U.S. $643 million per year), U.S. $67.5 billion was spent on current expenditures (or U.S. $4.2 billion per year), and cumulated public debt reached U.S. $38.4 billion (U.S. $2.4 billion per year).Footnote 13
Yet the effectiveness of public spending has been widely contested, because the surge in expenditures during the reconstruction period has not yielded the expected results in terms of socioeconomic development. Regional disparities have been accentuated, project quality has deteriorated, and the public deficit has worsened. One can even argue that public-goods provision in Lebanon has become a tool for nepotism and rent seeking in the absence of effective control and supervision. Checks and balances are replaced with reciprocal political consent and politicians tolerating each others’ misdeeds. The proliferation of corruption in the provision of public goods and services has been facilitated by the scale of the projects involved, the large number of intermediaries, and the numerous stages of execution.Footnote 14 In addition to corruption and rent seeking, public-goods provision has been characterized by negligence and inefficiency. The work of public institutions is often wasteful due to overlapping mandates and duplication. In the last few years, there has been a consensus that some public entities in Lebanon are redundant and should be eliminated.
The central government plays a key role in social policies through two main channels: 1) the office of the prime minister and six key ministries (health, education, social affairs, labor, the interior, and the displaced) whose ministerial portfolios are directly related to social development and welfare, and 2) public entities attached to these ministries with a variety of activities and mandates. Institutions with a direct social mandate are especially prone to redundancy. Many such government bodies—which include the Council of Development and Reconstruction (CDR), the Council of the South, and the Central Fund for the Displaced—share common goals and purposes, and unless there is coordination among them, much of their work is duplicated.
As for the social sector, Lebanon has been hampered by the absence of a social-policy framework, weak coordination and governance, politically influenced targeting of development aid, and lack of reliable data (on poverty and also on the outcomes of interventions, including ex-post evaluations). As a result, the distribution of social expenditures by mohafaza, as will be shown in the following section, is not consistent with the regional distribution of deprived populations.
THE EVOLUTION OF SOCIAL AND DEVELOPMENT INDICATORS DURING THE LAST FIFTEEN YEARS
Lebanon has a high rate of social-sector spending: in nominal terms, according to the World Bank, it stood at 21 percent of the gross domestic product (GDP) in 2004, with more than 70 percent of that coming from the private sector.Footnote 15 The figures of the Ministry of Finance put public social spending (defined as the spending of the ministries of education, health, and social affairs as well as expenditures channeled through other agencies) at 6.75 percent of GDP in 2006 and 35 percent of primary expenditures. When pensions and end-of-service indemnities are included, total social expenditures come to 8 percent of GDP and 38 percent of government primary expenditures in 2006.Footnote 16 However, these elevated levels of spending are not commensurate with outcomes. Herrera and Pang find that Lebanon uses close to 25 percent more public spending to produce the same health outcomes as best-practice countries and 13 percent more public spending for the same educational output as best-practice countries.Footnote 17 In other words, input efficiency (excess public input for a given level of public and private output) is close to 79 percent to 87 percent for educationFootnote 18 and 71 percent to 75 percent for health.Footnote 19 When these figures are scaled to the relative size of the private sector (which in Lebanon is unusually high for health spending and accounts for much of the health-sector outputs), the health outcomes attributable to public inputs are further reduced.Footnote 20
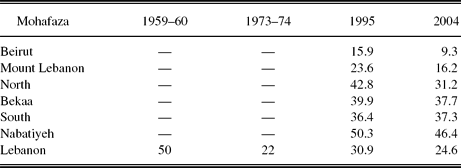
Public social-goods provision in the postwar era has also not been commensurate with regional needs. Chaaban and Gebara show that despite the decrease in the national level of poverty from 1995 to 2004, important divergences remain across regions.Footnote 21Table 1 provides a comparison of the poverty rates by mohafaza between 1995 and 2004, where the poverty rate is calculated as the fraction of households with “unsatisfied basic needs” according to the UNDP definition. The table shows that Beirut saw the highest decrease in poverty, from 15.9 percent in 1995 to 9.3 percent in 2004,Footnote 22 while the mohafaza of Nabatiyeh still bears a rate of poverty of 46.4 percent in 2004, five times that of Beirut. As for the other regions, the situation has not improved much since 1995: rates of deprivation in the North, the South, and the Bekaa were still above 30 percent of households in 2004. Although there is little confidence in the quality of data on poverty rates reported for the earlier time periods (1959–60 and 1973–74), the main lesson to take away from the table is that the evolution of the poverty rate in the decade from the mid-1990s to the mid-2000s shows disparities across regions.
Poverty rates (%) by mohafaza
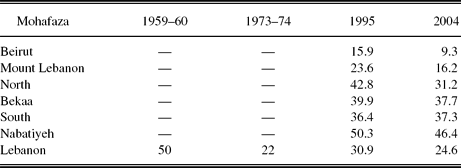
Source: UNDP and CAS, “Living Conditions of Households” (Beirut: UNDP, 1997); Ghassan Dibeh, “The Political Economy of Postwar Reconstruction in Lebanon” (2005), UNU-WIDER Research Papers, http://works.bepress.com/ghassan_dibeh/ (accessed 18 June 2010). Data for 1995 and 2004 use the unsatisfied basic needs methodology for computing poverty levels, and data for the previous years rely on income estimates.
The UNDP's 2007 study of poverty, growth, and income distribution in Lebanon, which uses the more conventional measure of expenditure poverty, shows a further polarization of the distribution of incomes within each mohafaza over the last few years: poverty rates are shown to decrease between 1997 and 2004 in all but the poorest mohafaza, North Lebanon. Thus, the North not only starts as the poorest county but is also the one to show the only increase in poverty rates. Furthermore, within the remaining districts, poverty rates decrease by the largest proportional margin in Beirut, which already started as the richest governorate. Since 2004, poverty rates have shown a slight increase in all mohafazas, which is proportionally larger in North Lebanon.Footnote 23
The increase in the level of public spending has been coupled with a declining quality of essential public goods and services such as public health, education, and security, especially in peripheral districts. Total social and capital spending is not commensurate with aggregate outcomes, such as poverty reduction, nor is it on par with sectoral-development outcomes in health, education, and public works, as will be illustrated. Using the 1997 and 2004 living conditions surveys conducted by the UNDP and CAS, as well as data from the CDR and the World Bank, we provide evidence of the deterioration of the quality and coverage of these public goods.Footnote 24
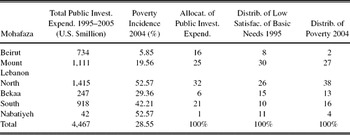
Table 2 summarizes our main findings. Between 1995 and 2005, total public spending on infrastructure projects related to social outcomes stood at U.S. $4.4 billion. The measure we use for total spending by the CDR excludes projects that are national by nature (airports, highways, spending on the Lebanese University). Spending did not follow regional poverty indicators, as measured by the satisfaction of basic needs index developed by the UNDP: in 1995, Beirut received 16 percent of total public spending even though it was home to only 8 percent of households with a low satisfaction of basic needs. Conversely, 11 percent of needy households live in Nabatiyeh, which only gets 1 percent of total public spending. The following sections explore the inefficiency of public spending with relation to specific social-development indicators.
Investment expenditures and poverty across mohafazas, 1995–2005

Source: UNDP and CAS, “Mapping of Living Conditions” (Beirut: UNDP, 2004); UNDP, “Executive Summary of the ‘Poverty, Growth & Inequality’ Report” (Beirut: UNDP, 2007). Poverty is expenditure based.
The Health Sector
Data published in the UNDP 1997 and 2004 living conditions surveys show that public-health spending failed to reduce health problems and improve medical coverage according to a number of important health metrics. Approximately 53.2 percent of households in 2004 were not covered by medical insurance, a figure only slightly lower than the 58 percent noncoverage rate in 1995. The proportion insured among the elderly (above sixty years of age) is still very low (11.8% in 2004); shockingly, this proportion is a third of what it was in 1995 (37.4%). The proportion of households with at least one chronic disease doubled between 1995 and 2004 (from 8.8% to 17.4%).Footnote 25
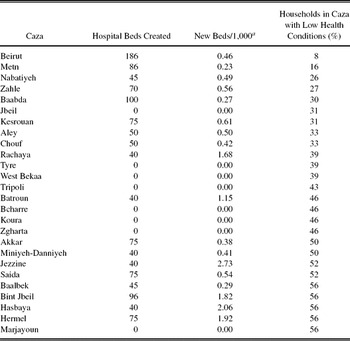
Using data on public projects published by the CDR and compiled in Lebanese Contractor magazine, Chaoul examines the efficiency and fairness of public health services.Footnote 26Table 3 shows the average number of hospital beds created during the period from 1996 to 2005 at the caza level. Comparing this figure with the 2004 health conditions by caza provided by the UNDP reveals a patent divergence between public health spending and most cazas’ needs in terms of health services and medical coverage. Cazas such as Bcharre, Koura, and Marjayoun received no new health expenditures during the period from 1996 to 2005 despite the high incidence of households with low health conditions in these cazas.
Public hospitals beds created in 1996–2005 versus health conditions

aAssuming 1996 population.
Source: Sandra Chaoul, “Corruption in the Provision of Public Expenditures: New Evidence from Lebanon” (master's thesis, American University of Beirut, 2007). The low health condition index is based on UNDP's Unsatisfied Basic Needs approach.
The Education Sector
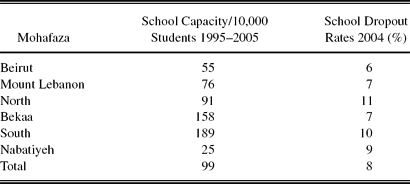
The recent study of poverty and inequality in Lebanon conducted by the UNDP confirms that education is strongly associated with lower levels of poverty. Indicators in the education sector suggest low internal efficiency of Lebanon's public expenditures on education. Although the general illiteracy rate has decreased from 11.6 percent in 1995 to 8.8 percent in 2004, it has expanded in the Bekaa from 13.5 percent to 14.6 percent and continues at a high rate of 14.2 percent in Nabatiyeh.Footnote 27Table 4 reports regional data across mohafazas and shows that school capacity created for every 10,000 students from 1995 to 2005 was blind to the variance in the school dropout rate: the North, which is the mohafaza with the highest school dropout rate, saw scant investment in new school capacity compared to other governorates (the Bekaa and the South) with less of a retention problem.
Education needs and expenditures by mohafaza
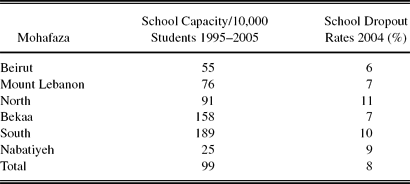
Source: Sandra Chaoul, “Corruption in the Provision of Public Expenditures: New Evidence from Lebanon” (master's thesis, American University of Beirut, 2007).
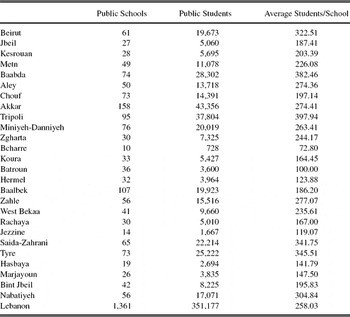
Chaoul details the number of schools and the number of students by caza for the year 2001 (see Table 5).Footnote 28Table 5 also shows that the number and distribution of public schools across cazas show a high variability in the number of students enrolled per school. Baalbek and Beirut have roughly the same number of public-school students, but Baalbek has 75 percent more schools than Beirut.Footnote 29 These figures do not control for school size, and the subsequent analysis does so by estimating school capacity per 1,000 students.
Number of public schools and students by caza for 2001–02

Source: Sandra Chaoul, “Corruption in the Provision of Public Expenditures: New Evidence from Lebanon” (master's thesis, American University of Beirut, 2007).
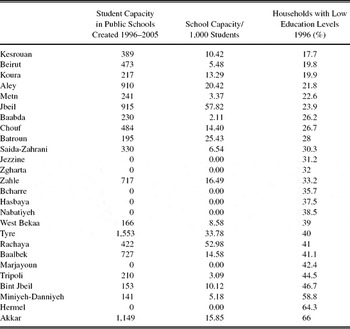
Using data published by the CDR on public projects implemented in the period from 1996 to 2005, Chaoul compares the capacity of schools built during this period with the relative education needs by caza (see Table 6).Footnote 30 Results show that Bcharre, Hermel, Marjayoun, Hasbaya, and Nabatiyeh did not receive any sizeable education expenditure during the period between 1996 and 2005, although the percentage of households with low education status is considerable in these cazas. Table 6 suggests that the geographical allocation of education resources is rarely driven by equity concerns or socioeconomic criteria but rather by other considerations. The regional variation in the fraction of the population with unsatisfied education needs is wide and points to the imbalance in access to public social services in Lebanon. More alarming is the fact that the decade of spending between 1996 and 2005 did not aim to remedy the disparities in educational needs across geographical areas. Far from addressing the unequal distribution of public-education resources, investment spending on public education may have exacerbated the problem in some cases.
Capacity of schools created in 1996–2005 versus education conditions by caza

Source: Sandra Chaoul, “Corruption in the Provision of Public Expenditures: New Evidence from Lebanon” (master's thesis, American University of Beirut, 2007).
Social Expenditures
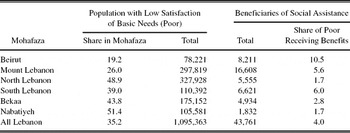
The Ministry of Social Affairs (MOSA) mostly provides support to vulnerable populations (orphans, the elderly, the disabled, etc.), encompassing on average 35,000 cases per year, through transfers to nongovernmental organizations (NGOs).Footnote 31 In addition, it supports the creation of social-development centers as well as social and health centers run in partnership with NGOs. A total of 360,000 individuals benefited from these services in 1998, but the regional balance appears uneven because most of the beneficiaries are from the relatively wealthier region of Beirut. Based on the living conditions index from MOSA–UNDP, the World Bank estimates that 10 percent of the poor benefited from MOSA services in Beirut in contrast to less than 2 percent in the Nabatiyeh and North Lebanon regions (see Table 7). There were 4.1 and 3.6 social and health centers per 10,000 poor people in the regions of South Lebanon and Beirut, respectively, but only 1.4 and 1.6 in the Bekaa and North Lebanon regions.Footnote 32
Beneficiaries allocation among mohafazas

Source: World Bank, “Lebanon Public Expenditure Reform Priorities for Fiscal Adjustment, Growth and Poverty Alleviation,” The World Bank (2005) Report No. 32857-LB. Washington, D.C.
A variety of security funds, most of which are private, provide sickness and maternity insurance policies, family allowances, and end-of-service indemnity. Private funds provide total or partial insurance coverage to about 12 percent of the population. One semipublic fund, the National Social Security Fund, covers about 30 percent of the population by providing insurance primarily to employees in the formal sector and contracted staff in the public sector. The geographic coverage of these funds is once again uneven; the majority of the beneficiaries live in Beirut and Mount Lebanon. According to the household living conditions survey of the UNDP and CAS, there is some evidence to suggest that the uninsured are more likely to be elderly, unemployed, or from a low-income district.Footnote 33 Another program that has a social-assistance component is the producers’ subsidy for certain crops (wheat, sugar beet, tobacco). In total, it is believed that around 30,000 small farmers, mostly from the Bekaa Valley and the South, benefit from such assistance.Footnote 34
Other Sectors
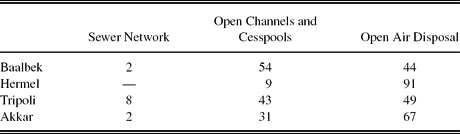
In addition to health, education, and social expenditures, capital spending has proven to be inefficient. The quality of public utilities is still inadequate: electricity blackouts are periodic (most households use a private generator to supplement the public supply of electricity), distant regions suffer from an insufficient supply of water, and some cazas (Hermel, Baalbek, Akkar) lack a proper sewage and sanitary system (see Table 8).
Village access to sanitation facilities in underserved areas (%) in 1997
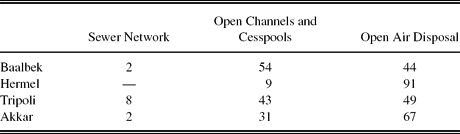
Source: Sandra Chaoul, “Corruption in the Provision of Public Expenditures: New Evidence from Lebanon” (master's thesis, American University of Beirut, 2007).
According to the World Bank, consolidated public-investment expenditures constitute almost 3 percent of GDP.Footnote 35 Out of the total, roughly one-fourth is funded externally by subsidized loans and the rest is financed locally. Naturally, domestically funded capital expenditures cost more because interest rates on the domestic public debt are nearly double those incurred on foreign loans. Moreover, the report shows that in spite of U.S. $8.5 billion spent between 1992 and 2003, the number of projects that have not yet been completed remains large. An estimated U.S. $1.2 billion was spent by the end of 2003 on foreign-funded projects that had not been completed, as confirmed by project statistics released by Lebanese Contractor magazine. Projects are often delayed and their costs and budgets consistently revised upward during the years of their execution. In addition, the government has failed to follow up on sizeable investments in roads with upkeep and maintenance spending. (Spending on highways totaled U.S. $453 million between 1996 and 2005, and spending on roads and bridges amounted to approximately U.S. $690 million for the same period, according to Lebanese Contractor.Footnote 36)
All available indicators show an obvious deficiency in public infrastructure, with an even more pronounced underperformance in regions outside Beirut. The World Bank's “Doing Business Lebanon 2010” study highlights some of the major obstacles facing firms with regard to public-goods provision: it takes firms an average of twelve days to acquire a mainline telephone connection, twelve days to get an electrical connection, and fourteen days to obtain a water connection.Footnote 37 Electrical outages, interruption in telecommunications, and insufficient water supply acutely undermine a firm's ability to perform and compete, generating losses between 4 percent and 12 percent of annual total sales. According to the 2004 living-conditions survey, only 21.1 percent of households report that tap water is always available during the summer, the proportion in Nabatiyeh being only 4.7 percent. Nationally, 14.2 percent of households report that electricity is always available during the year, with a high of 97 percent in Beirut and a proportion not greater than 5 percent for all other regions.Footnote 38
AN EVALUATION OF THE EFFICIENCY OF THE CURRENT EXPENDITURE SYSTEM
There is thus ample evidence to suggest that the geographical allocation of public resources in Lebanon is driven neither by equity nor by efficiency considerations. The regional variation in the percentage of the population with unsatisfied basic needs is wide and points to an imbalance in access to public social services in Lebanon. Furthermore, this disparity in access has worsened over the last decade. The allocation of funds has neither been proportional to need nor led to a balanced reduction effect in regional poverty rates.
Dibeh argues that the reconstruction program in Lebanon did attempt a form of redistribution that was mostly based on region.Footnote 39 This regional redistribution, encoded under the necessity of achieving “balanced development” in the Taʾif Accords, was reflected in late Prime Minister Rafiq Hariri's economic development plan during his first tenure in office (the so-called Horizon 2000 Plan, which was never fully implemented) and has continued to be central in development plans adopted by successive governments, including the recently adopted Social Action Plan. The aim of balanced development across Lebanon's regions was furthered in the 1990s with the creation of two main funds: the Council of the South, which channeled development aid to the South of Lebanon, and the Displaced Fund, which was entrusted with resource allocation for the return of war refugees to their previous dwellings, mainly in Mount Lebanon. Dibeh argues that such redistributional mechanisms played a very important role in the rebuilding of the physical, political, and social capacities of the regions, the reintegration of the population, and the legitimization of the postwar authority. However, he stresses that sectarian redistribution in the postwar period came at the expense of redistribution among income groups.Footnote 40 The Appendix presents an analytical discussion of the optimal determinants of public-expenditure allocation, based on public economic theory.
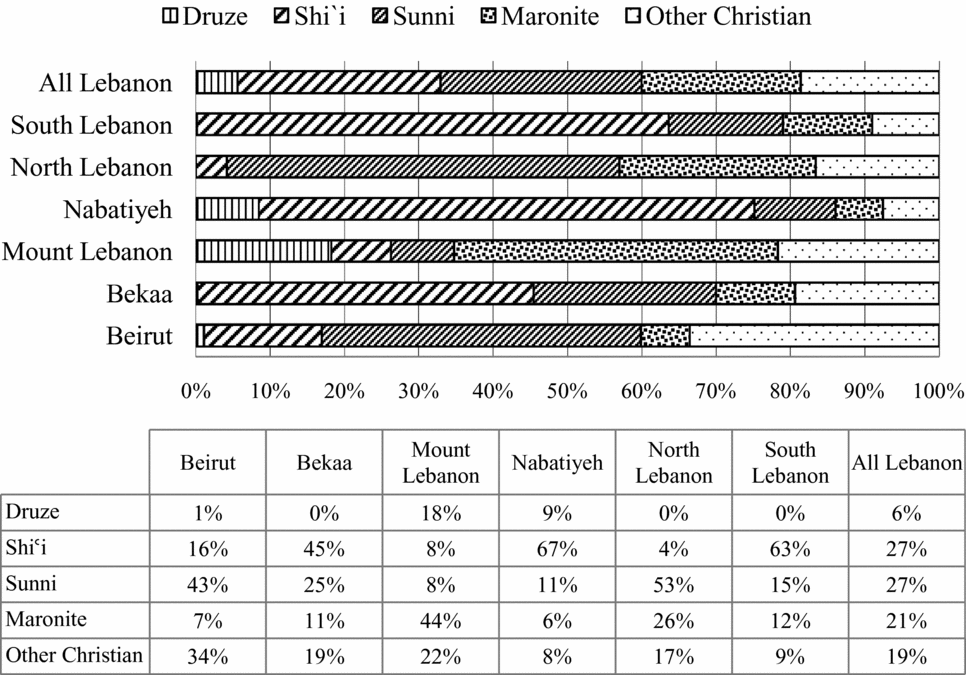
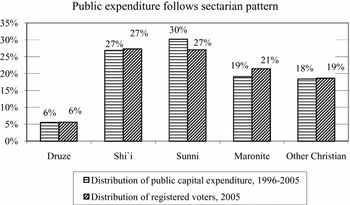
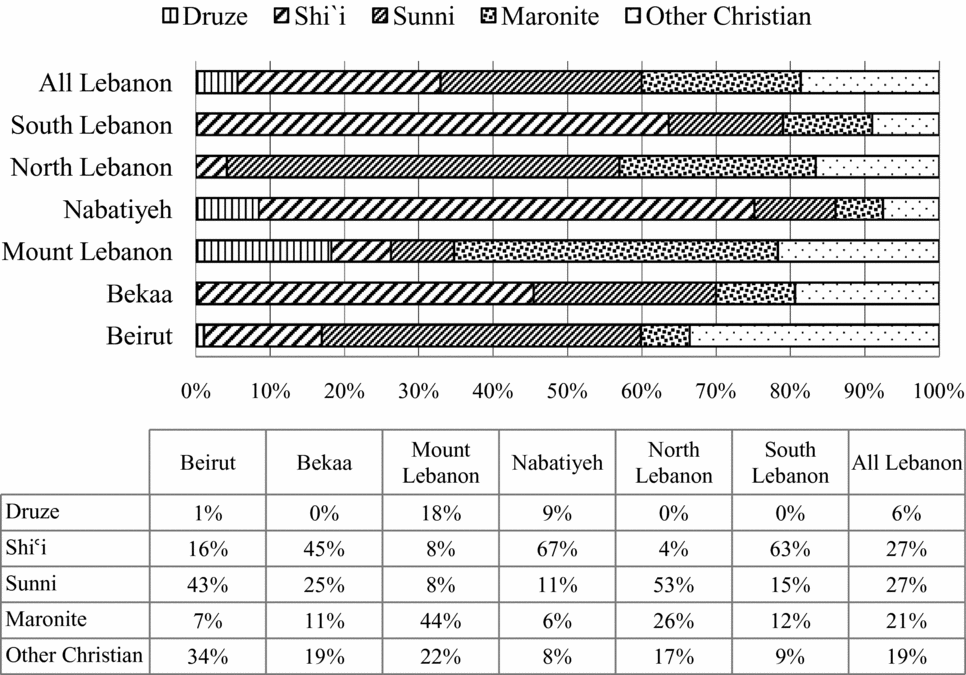
The objective of “balanced development” across income groups could be hindered by considerations other than need, good policy, and economic wisdom. What, then, really determines the allocation of public expenditures across regions in Lebanon? To answer this question, we compute, based on data from Chaoul and Lebanese Contractor magazine, total public capital expenditure received by each caza during the period from 1996 to 2005. Then, using the voter-registry database from the Ministry of Interior, we compute the confessional distribution of the population in each caza by simply computing the ratio of each confession's registered voters to total voters in a given caza (Figure 2 highlights the distribution of confessions in each mohafaza). This allows us to obtain a close approximation of the distribution of public expenditure across Lebanese confessions. Figure 3 summarizes our findings and shows a striking pattern: the distribution of cumulative public expenditures from 1996 to 2005 closely mirrors the distribution of sects in Lebanon. Public resources are being allocated according to a political vector that maintains a sectarian balance regardless of development prerogatives or basic economic need. Thus, although Table 1 generally and Tables 3, 5, and 8 more specifically would lead us to expect a distribution of expenditures across confessional groups, reflecting the higher incidence of poverty in the South and Nabatiyeh, we observe instead an allocation of funds constrained by sectarian divisions. The possible reasons explaining this fact are outlined in what follows.
The sectarian composition of each mohafaza (%). From the voter-registry data set, Ministry of Interior of Lebanon, 2005.
Public expenditure versus sectarian distribution of registered voters in Lebanon. Authors’ calculations based on Sandra Chaoul, “Corruption in the Provision of Public Expenditures: New Evidence from Lebanon” (master's thesis, American University of Beirut, 2007) and voter-registry data set, Ministry of Interior of Lebanon.

The values reported in Figure 3 are calculated using the geographical distribution of total public-investment expenditures across mohafazasFootnote 41 and the sectarian breakdown of registered voters in each mohafaza. The pattern we observe in Figure 3 is indicative of an underlying systematic allocation scheme of funds across mohafazas that could account for the uniformity of the two distributions (of public expenditures across sects and of sectarian composition of voters). The geographical allocation criterion that could generate the pattern we observe in Figure 3 is a “demographic” distribution of public expenditures, where the dollar share of each mohafaza is solely determined by the mohafaza's relative demographic size (the one-man one-dollar scheme).Footnote 42
This hypothesized allocation scheme is plausible: one can see why, for political reasons, and given the latent competition for public spending across sects, the sectarian race for bigger shares of public expenditures is resolved by prorating public monies to the relative size of confessional groups. Thus no mohafaza is able to attract more public funds than its population size justifies regardless of the mohafaza's need for public spending. These results are consistent with other estimates of the sectarian composition of Lebanon, most of which put the figures for the proportions of the four major sects very close to the estimates given previously. Held puts the proportion of Maronites at 19 percent.Footnote 43 Faour's calculations, using the age breakdown of the population of mohafazas in combination with data on eligible voters in the 2005 election, estimate the proportion of Maronites to be 22.5 percent and of Sunnis and Shiʿa to each constitute 28.1 percent of the population.Footnote 44
Figure 3 presents a different perspective on Dibeh's assertion that the “sectarian distribution of state funds took outright and open channels,”Footnote 45 the most ostensible examples being the Council of the South, the Fund for the Displaced, and the Greater Beirut Public Works Council, dominated respectively by Shiʿa, Druze, and Sunnis. Between 1993 and 2004, roughly U.S. $850 million was disbursed to the Council of the South and around U.S. $1.2 billion to the Fund for the Displaced.Footnote 46 These findings confirm observations and conjectures that are common in the fiscal and political economic literature on postwar Lebanon, which suggest that the so-called Third Republic established by the Taʾif Accords reinforced sectarian rifts by focusing reform on power sharing and confessional redistribution rather than the creation of a secular citizenry.Footnote 47 One observer notes that the choice between the accumulation of physical and social capital on the one hand and spending on military and security forces on the other defines the tradeoff intrinsic to fiscal policy in a regime with a narrow base of support in a multiethnic or multireligious society. In the extreme case, incentive structures may push the regime to choose a pure security-seeking and politically repressive state that causes social capital depletion.Footnote 48
CONCLUSION
Our aim in this article has been twofold. Our first aim was to evaluate the effectiveness of the successive Lebanese postwar governments’ public-spending programs at addressing the country's basic needs in poverty alleviation, education, public health, and big infrastructure projects. Once that record was established and socioeconomic need and balanced growth were shown not to be the primary prerogatives of the decade of public spending from the mid-1990s to the mid-2000s, our second aim was to explore frameworks that are better able to account for the distribution of public spending than is the framework of socioeconomic parity and equitable growth.
A preliminary analysis of the poverty, education, and public-health profile of the country by administrative region with the spending record of the governments between 1994 and 2004 has shown that the distribution of public funds has been at best blind to socioeconomic priorities and at worst a cause of greater disparities in education and health development indicators across various Lebanese regions. Using election data on the confessional distribution of voters to approximate the sectarian composition of cazas, we are able to estimate the share of public funds allocated to four of the major sects in the country. Each sect's share of public expenditures bears a striking resemblance to the sectarian distribution of the country and closely mirrors the distribution of funds that we would expect if allocation were completely blind to socioeconomic objectives and exclusively determined instead by a rule of sectarian balance regardless of need or economic logic.
Experience and scholarship concur that allocating resources according to indicators of objective outcomes is both more effective at bringing about the desired outcomes and a more efficient means of achieving balanced development than an allocation based on characteristics unrelated to development outcomes. It is more effective because honing in on the desired outcome is more likely to effect it, and it is more efficient because of decreasing marginal returns. Short of aligning disbursement criteria of public funds with needs, a menu of more realistic second-best solutions merits consideration. Rationalization of the expenditure profile is hampered by the overlay, in the executive structure of the government, of various entities with duplicated mandates and spheres of authority. Thus a streamlining of roles and authorities would allow for a clearer division of the budget across sectors and a more effective means of targeting outcomes.
Insofar as a citizen's state is responsible for securing basic economic rights and correcting skewed economic realities in favor of a more equitable distribution of resources and opportunities, the performance of the Lebanese state has so far fallen short of adopting a role that both fosters and responds to its subjects as citizens. Instead, the Lebanese experience has been tainted by the constraint of confessional balance that allows sectarian identity to supersede citizenship in the scheme of resource allocation.
APPENDIX
Studies of the allocation of public-consumption expenditure, which follow the tradition of consumer-demand theory, start from the premise that the government decides the allocation of public expenditure at the second stage of an optimization program.Footnote 49 In this stage, the program maximizes a utility function defined over the set of public services consumed by the electorate,

subject to the standard budget constraint that the sum of expenditures on individual public services equals a given total,
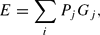
which is taken to be exogenous; Pj denotes the unit cost of service j, and i refers to the population index.
Solving the maximization problem yields a system of demand equations for the real volume of each public service as functions of the vector of unit costs of such services, the total size of expenditure, and a vector of various indicators of social need, for example, as reflected in the demographic composition of the population, denoted by O. The typical optimal public-service demand equation for a given population group is expressed as

Ideally, the allocation Gi should be proportional to social needs in the vector O. However, this allocation usually departs from this position as political and other considerations interfere with the allocation decision. In our analysis, we illustrate how concern for confessionalism would enter the equation by incorporating another variable into Equation 3, namely, that of maintaining a sectarian balance in the access to public resources.Footnote 50