I. Introduction
Wine markets throughout the world have been hit by two major shocks in recent years. The first is the global financial crisis (GFC), which brought substantial changes in bilateral real exchange rates (RERs) and—due to the fall in income and wealth—a temporary decline in the quantity and quality of wine demanded in traditional markets. The second is the rapid economic growth in China (and other emerging Asian economies), which slowed only slightly when high-income economies went into recession after 2007. Because Asia's emerging economies are natural resource–poor, their rapid industrialization and economic growth have strengthened primary product prices and hence the RERs of natural resource–rich countries such as Australia. And because their income growth has led to a burgeoning middle class and enriched their elite, the demand for wine in Asia has surged. It has grown especially rapidly in China, leading to an increase in the U.S. dollar value of its wine imports of about 50 percent per year in both 2006–2009 and 2009–2012. That in turn has stimulated vineyard expansion and rapid growth in wine production in China, although not enough to match domestic demand growth. The wine industry in those Southern Hemisphere countries whose RERs strengthened has been hurt by that appreciation but helped by the growth in Asian wine import demand.
These recent shocks to the world economy matter to grape growers and winemakers in both the Old World and the New World far more than most past shocks. This is partly because of the move by most countries to flexible exchange rates since the 1980s and partly because in the past two decades the wine industry has become more globalized than ever. The share of global wine production exported has more than doubled between 1989 and 2009, rising from 15 percent (which was already above its peak in the first globalization wave a century earlier) to 32 percent, and it reached 41 percent in 2012. In the four biggest European wine-exporting countries, their export propensity rose over the two decades to 2009 from 20 to 35 percent, while for New World exporters it rose from just 4 percent to 37 percent (Anderson and Nelgen, Reference Anderson and Nelgen2011). In 2012, those shares reached 49 and 42 percent, respectively, according to OIV (2013). Moreover, these exporters are much more exposed now than in the past to import competition in their domestic market.
In the wake of these global shocks, the wine industry in numerous countries is struggling to anticipate where the world's wine markets are headed in the next few years. A formal model of economic behavior in those markets can assist in analyzing recent or prospective changes. The purpose of this paper is to use a revised, expanded, and updated version of the model of the world's wine markets developed by Wittwer et al. (Reference Wittwer, Berger and Anderson2003) to project those markets to 2018. Because RERs have played a dominant role in the fortunes of some countries' wine markets in recent years, we first incorporate those changes to 2011 before considering two alternative paths over the 2011–2018 period for RERs: no change, and a halfway return to 2009 rates. In both scenarios, we assume a return to the pre-GFC gradual trend toward premium wines and away from nonpremium wines. Because growth in China's imports dominates the trade picture in both scenarios, another scenario is included in which we alter three variables that dampen China's import demand, to indicate the degree of sensitivity of results to our assumptions concerning those variables.
The paper begins in Section II by documenting an important consequence of the two changes in the world economy mentioned above (the global financial crisis and the rapid increase in Asia's share of global income and trade), namely, their impact on nominal and real exchange rates. Section III then outlines the revised model of the world's wine markets and the way in which changes in real exchange rates and other variables are applied as shocks. (Details of the model are included in the Appendix.) The model's simulation results of the effects of the dramatic exchange rate changes between 2007 and 2011 on producer prices are summarized in Section IV. Prospective changes to grape and wine markets by 2018 are then simulated for our two alternative paths for real exchange rates over the next five years (no change, and a halfway return to 2009 rates) and for a variation on projected conditions in the Chinese market, results of which are summarized in Section V. Section VI draws out implications of the findings for wine markets and their participants in the years ahead.
II. Exchange Rate Changes, 2007 to 2011
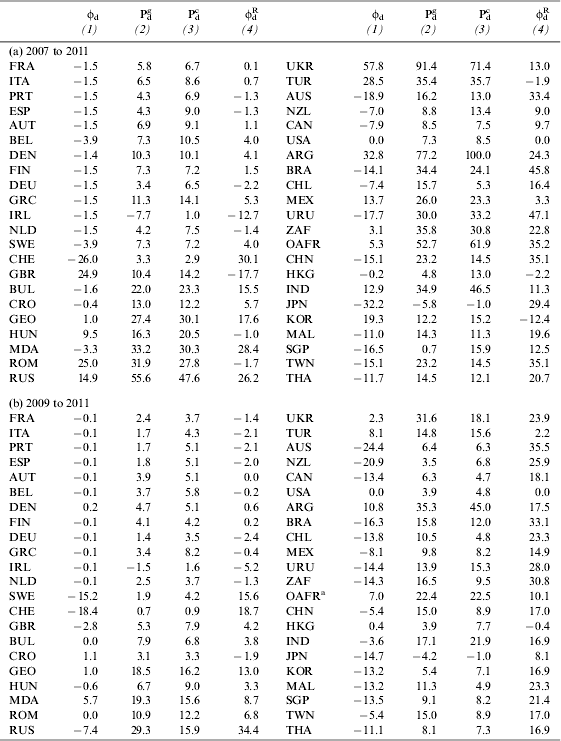
The shocks given to depict the changes between 2007 and 2011 in the international competitiveness of key countries in global wine markets are shown in the first three columns of Appendix Table 1(a). Column (1) shows nominal exchange rates relative to the U.S. dollar, ϕ d, column (2) shows the price of the gross domestic product (GDP), P dg, and column (3) shows the price of consumer goods, P dc.Footnote 1 Column (4) shows the real exchange rate movement relative to the U.S. currency, ϕ dR. As outlined in the Appendix, this endogenous variable is calculated as: ϕ dR=P dg/[Pg “USA” *ϕ d]
The fourth column of Appendix Table 1(a) provides observed changes in international competitiveness in 44 key wine-producing and wine-consuming countries between 2007 and 2011. It is clear that both rapidly growing East Asia (i.e., mainland China, Taiwan, and, to a lesser extent, Japan and Southeast Asia) and that region's natural resource–rich trading partners (notably Australia among the significant wine-exporting countries) appreciated their real exchange rates heavily against the U.S. dollar (by 17–35 percent). Real exchange rates of other New World wine exporters (Argentina, Chile, New Zealand, South Africa) appreciated almost as much. By contrast, the British pound depreciated heavily against the U.S. dollar (by 18 percent), while in other West European countries—both wine-exporting and wine-importing—real exchange rates remained close to the U.S. dollar during that period in real terms.
The effect of these real exchange rate changes over that five-year period is analyzed first, leaving aside all other influences on the world's wine markets during that time. To model that, we shock our global wine markets model with those RER changes. The results are presented in Section IV below, preceded in Section III with an outline of the model and its database, where we also lay out the RER assumptions for the prospective analysis to 2018.
III. Revised Model of the World's Wine Markets and Its Database
We have revised and updated a model of the world's wine markets that was first published by Wittwer et al. (Reference Wittwer, Berger and Anderson2003). As explained in the Appendix, several significant enhancements have been made to that original model. Wine markets have been disaggregated into five types, namely, nonpremium (including bulk), commercial-premium, superpremium and iconic still wines, and sparkling wine.Footnote 2 There are two types of grapes, premium and nonpremium. Nonpremium wine uses nonpremium grapes exclusively, superpremium and iconic wines use premium grapes exclusively, and commercial-premium and sparkling wines use both types of grapes. The world is divided into 44 individual countries and seven composite regions.
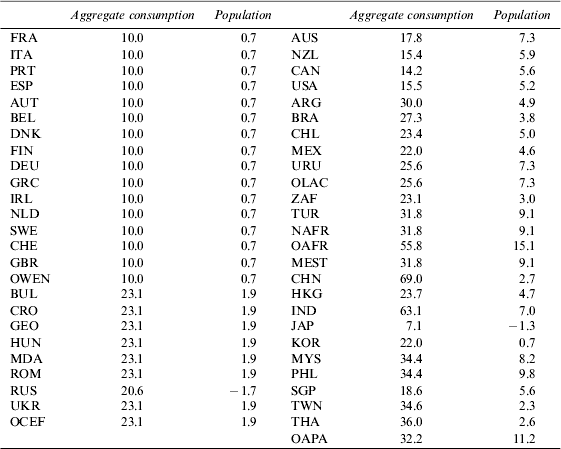
The model's database is calibrated initially to 2009, based on the comprehensive volume and value data and trade and excise tax data provided in Anderson and Nelgen (Reference Anderson and Nelgen2011). It is projected forward in two steps. The first step involves using actual aggregate national consumption and population growth between 2009 and 2011 (the most recent year for which data were available for all countries when the study began), together with the changes in real exchange rates reported in Appendix Table 1(b). The second step assumes aggregate national consumption and population grow from 2011 to 2018 at the rates shown in Appendix Table 2 and that real exchange rates over that period either (a) remain at their 2011 levels or (b) return halfway to their 2009 rates (except for China, whose RER is assumed to continue to appreciate slightly, by 2 percent per year between 2011 and 2018). In each of those steps, a number of additional assumptions are made concerning preferences, technologies, and capital stocks.
Concerning preferences, there is assumed to be a considerable swing towards all wine types in China, as more Chinese achieve middle-class incomes. Because aggregate wine consumption is projected by the major commodity forecasters to rise by 70 percent over that seven-year period, we calibrate the increase in China's consumption to that in the most likely of our scenarios in which exchange rates revert halfway back from 2011 to 2009 rates. That implies a rise in per capita consumption from 1.0 to 1.6 liters per year. This may be too conservative. Per-capita wine consumption grew faster than that in several West European wine-importing countries in recent decades, and Vinexpo claims that China's 2012 consumption was already 1.4 liters per year. Because the middle class in China currently numbers around 250 million and is growing at 10 million per year (Barton et al., Reference Barton, Chen and Jin2013; Kharas, Reference Kharas2010) and because grape wine still accounts for only 4 percent of alcohol consumption by China's 1.1 million adults, large increases in the volume of wine demanded are not unreasonable to expect. However, if China's income growth were to grow more slowly than we assume and if that meant that China's RER did not continue to appreciate slightly, wine import growth would be slower. For the rest of the world, the long-term trend preference swing away from nonpremium wines is assumed to continue now that recession in the North Atlantic economies has bottomed out.
Both grape and wine industry total factor productivity is assumed to grow at 1 percent per year everywhere, while grape and wine industry capital is assumed to grow, net of depreciation, at 1.5 percent per year in China but zero elsewhere. This means that China's production rises by about one-sixth, one-quarter, and one-third for nonpremium, commercial-premium, and superpremium wines between 2011 and 2018—which in aggregate is less than half that needed to keep up with the modeled growth in China's consumption. Of course, if China's wine production from domestic grapes were to grow faster than we assume in our base scenario, wine imports would increase less.
Given the uncertainty associated with several dimensions of developments in China's wine markets, we also compare the more likely of our two main scenarios to 2018 (in which RERs for all but China revert halfway back from 2011 to 2009 rates—call it Alternative 1) with a third scenario (call it Alternative 2) in which three dimensions are altered: China's aggregate expenditure growth during 2011–2018 is reduced by one-quarter (from 7.5 to 5.6 percent per year),Footnote 3 its RER does not change from 2011 instead of appreciating at 2 percent per year over that period, and its grape and wine industry capital is assumed to grow at 3 instead of 1.5 percent per year. Each of those three changes ensures a smaller increase in China's wine imports by 2018 in this Alternative 2 scenario. However, this should be considered very much a lower-bound projection because, even if China's GDP growth, industrialization, and infrastructure spending were to slow more than assumed in our Base and Alternative 1 scenarios, and there were less conspicuous extravagance and iconic gift-giving by business and government, Chinese households nonetheless are being encouraged to reduce their extraordinarily high savings rates and consume more of their income. In addition, grape wine is encouraged as an alternative to the dominant alcoholic beverages of (barley-based) beer and (rice-based) spirits because of its perceived health benefits and because it does not undermine food security by diminishing foodgrain supplies.
This global model has supply and demand equations and hence quantities and prices for each of the grape and wine products and for a single composite of all other products in each country. Grapes are not assumed to be traded internationally, but other products are both exported and imported. Each market is assumed to have cleared before any shock and to find a new market-clearing outcome following any exogenously introduced shock. An enhancement of importance to the present study is the inclusion of exchange rate variables explicitly in the model. This enables us to distinguish between price impacts as observed in local currency units from those observed in U.S. dollars, as described in the previous section. All prices are expressed in real (2009) terms.
IV. Impacts of Exchange Rate Movements on Competitiveness, 2007 to 2011
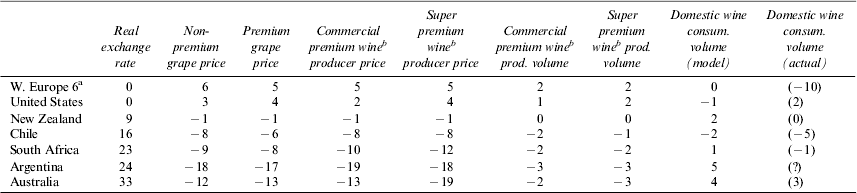
Major exchange rate changes occurred after 2007, so we first backcast the model from its 2009 base to 2007 and then shock it by just the changes in RERs that actually occurred between 2007 and 2011, as reported in Appendix Table 1(a). The first column of Table 1 summarizes those actual RER changes in key wine-exporting and wine-importing countries. If there were no other shocks to the world's wine markets over this 2007–11 period, what would those RER changes lead one to expect? Australia, for example, experienced the largest real appreciation among the wine exporters, so its wineries are among the ones to have been affected most adversely: receiving fewer Australian dollars for their exports and facing more foreign competition in their home market, so depressing their grape and wine prices. As for wine-importing countries, those whose real exchange rates appreciated most (notably China and Japan) would be expected to import more wine, all other things being equal. Meanwhile, for those experiencing a real depreciation, most notably the United Kingdom, wine imports would be expected to fall.
Estimated Impact of 2007–2011 Changes in Real Exchange Rates on Domestic Prices (in Real Local Currency) and Quantities of Wine – Main Exporters (changes in percent)

Source: Authors' model results.
a France, Italy, Spain, Portugal, Germany and Austria.b Commercial-premium wines are defined by Anderson and Nelgen (Reference Anderson and Nelgen2011) as those between US$2.50 and $7.50 per liter pre-tax wholesale or at a country's border.
Estimated Impact of 2007–2011 Changes in Real Exchange Rates on Domestic Prices (in Real Local Currency) and Quantities of Wine – Main Importers (changes in percent)

Source: Authors' model results.
a Commercial-premium wines are defined by Anderson and Nelgen (Reference Anderson and Nelgen2011) as those between US$2.50 and $7.50 per liter pre-tax wholesale or at a country's border; b Other W. Europe (Belgium, Denmark, Finland, Ireland, the Netherlands, Sweden and Switzerland).
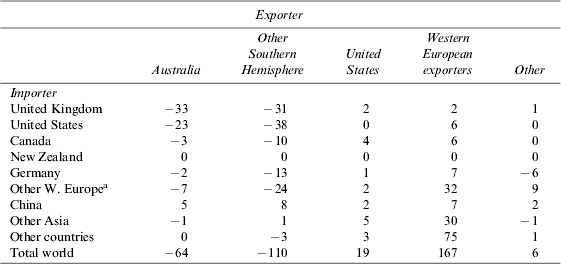
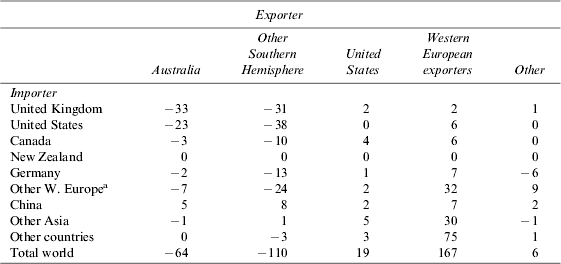
That is indeed what is shown in the other columns of Table 1, and the impacts of those shocks on bilateral wine trade volumes are summarized in Table 2. Specifically, the RER changes are responsible for declines in grape and wine production in the Southern Hemisphere, where RERs appreciated, and for slight production increases in the United States and Europe, where RERs changed relatively little.
Impact of Real Exchange Rate Changes on Export Volume of Wine-Exporting Countries 2007 to 2011 (in million liters)
Source: Authors' model results.
a Other W. Europe (Belgium, Denmark, Finland, Ireland, the Netherlands, Sweden and Switzerland).
Because Australia had the largest appreciation of all wine-exporting countries over that period, its winemakers, and hence grape growers are estimated to have suffered among the largest reductions in domestic prices in real local currency terms from this shock: winegrape and commercial premium wine producer prices are reduced by one-eighth and superpremium wine prices by one-fifth. Large price reductions are estimated for Argentina, too (although its numbers are less reliable because the official underrecording of inflation required us to use a secondary source for consumer price index (CPI) changes, Cavallo, Reference Cavallo2013). Associated with those local currency price reductions are declines in the volume of Australia's and Argentina's wine production as a result of RER changes. Those output changes over this five-year period are smaller than the price declines, though, reflecting the low elasticity of supply response to producer price downturns that are incorporated into the model. As seen in Table 1, real prices in domestic currency terms decline in the other Southern Hemisphere countries as well, but by less than two-thirds as much as in Australia and Argentina. Furthermore, real grape and wine prices (again in domestic currency terms) rise in the United States and Western Europe, by between 2 and 5 percent, so output in those regions is estimated to have been boosted by recent RER movements. In short, those exchange rate shocks have been a major contributor to the decline in the international competitiveness of Southern Hemisphere wine producers since 2007.
The trade consequences of that set of exchange rate shocks also depend on how it affects wine consumption. Because of lower prices for both domestic and imported wines, Australian consumption is estimated to have been boosted by 4 percent because of these RER changes—which is close to the proportional change in actual consumption during that period (see last two columns of Table 1a). This suggests that the net effect on domestic consumption of all other influences over the period 2007–11 was close to zero.
In Europe's key wine-exporting countries and in the United States, by contrast, the rise in wine prices would have reduced domestic wine consumption in the absence of other influences. Other influences evidently were not absent, however. In the United States, wine consumption actually rose by 2 percent over that period, perhaps as the economy there began to recover from the global financial crisis in 2011. In Western Europe's wine-exporting countries, by contrast, it fell by 10 percent, perhaps because in 2011 those economies were still recovering from the financial crisis.
Estimated changes in consumption in wine-importing countries are shown in Table 1b. The 18 percent real depreciation of the British pound against the U.S. dollar on its own caused the consumer price of wine in that market to rise to the point that estimated wine consumption fell 4 percent, which is less than the actual decrease over that period of 7 percent. Discrepancies arise when there is a nontrivial net effect of economic changes other than in RERs. For the UK, that would have been the income drop that resulted from the financial crisis during that period. In the case of China, its rapid income growth and increasing absorption of Western tastes meant that there was a substantial increase in wine demand there between 2007 and 2011, so observed wine consumption grew by 22 percent over that period despite almost no contribution (0.2 percent) from RER changes. As in the UK, other countries that went into recession had incomes fall between 2007 and 2011, which affected wine consumption. For example, Japan's actual wine consumption declined 2 percent even though RER changes on their own are estimated to have induced a 10 percent increase.
The negative impact on consumption of the real depreciation in the United Kingdom is bad news for all wine-exporting countries, but the impact is even worse for Australia (which was the second-most-important supplier in volume terms of wine to the UK market after Italy, and third in value terms after France and Italy). The first set of rows of Table 2 shows the impact on the UK's import volumes by country of origin. Australia and other Southern Hemisphere countries (most notably, South Africa) are the standout losers in this scenario, with annual demand for their wine falling by an estimated 64 ML—half of which is borne by Australia. By contrast, annual sales by the Old World and the United States to the UK are slightly higher (by 2ML each) as a consequence of RER movements between 2007 and 2011, as are Old World sales to North America and Western Europe—again at the expense of sales from the Southern Hemisphere.
That is, the modeled reduction in wine consumption in Europe and the United States is borne almost entirely by Australian and other Southern Hemisphere producers, whose wines become more expensive than domestically produced or Old World wines in the U.S. market. That set of RER shocks reduces the Southern Hemisphere's share of U.S. total wine consumption from 21 to 18 percent. The pattern of impact on bilateral wine trades with Canada, Germany, and other Western European wine-importing countries is not quite as severe, but in all those cases Australian and other Southern Hemisphere producers lose out to U.S. and Old World suppliers.
China remains the market in which wine exporters anticipate the highest rate of import growth in the future. China's renminbi appreciated in real terms more than most major currencies did between 2007 and 2011, the effect of which in isolation would be for China to increase its share of global wine consumption. Table 1b shows that real local currency prices of wine in China fell by one-sixth due to observed RER movements. This caused increased imports of wine from all sources, with increases from both the New World (15 ML including the United States) and Old World (7 ML) reported in Table 2. Those imports substituted for domestic wine, whose consumption is discouraged by the real appreciation. As for other Asian markets and the rest of the world, Southern Hemisphere producers again lose while the U.S. and Old World wine exporters gain.
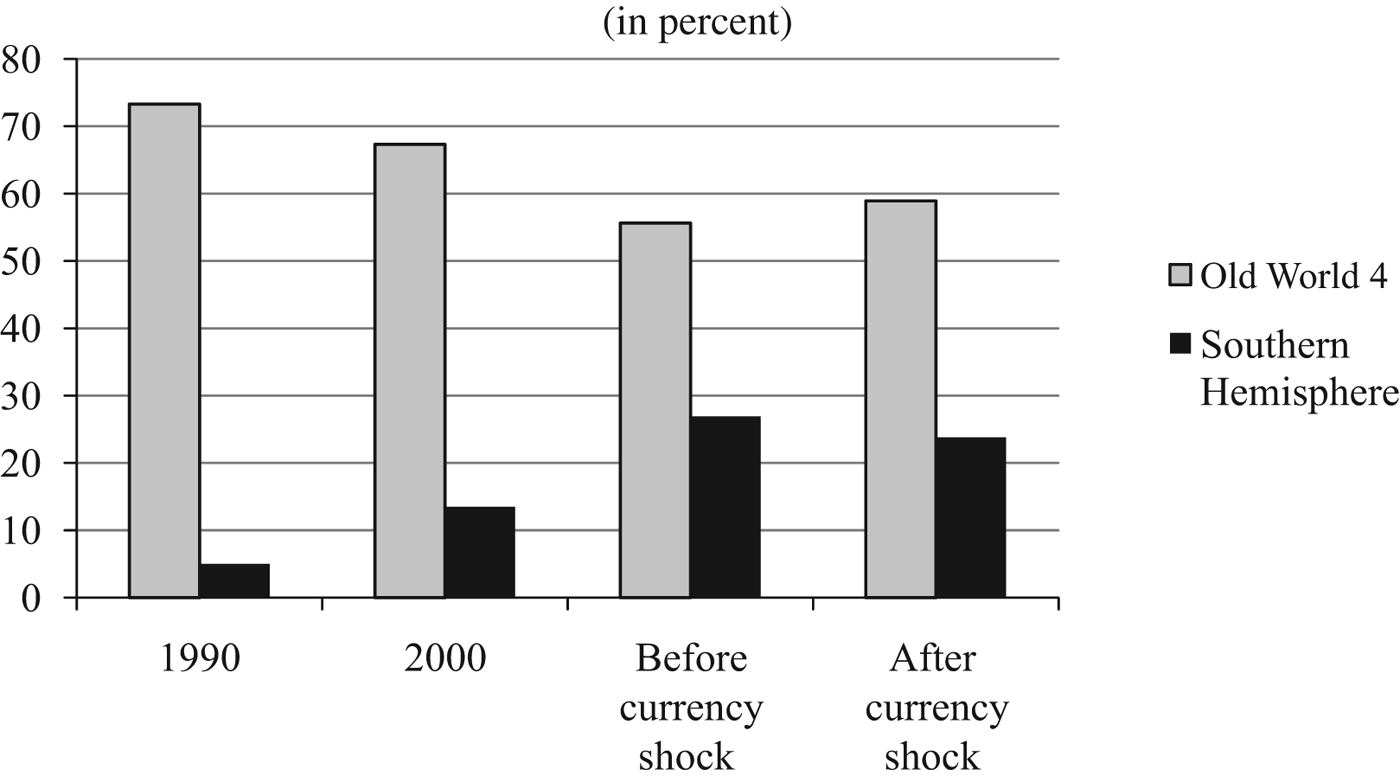
In aggregate, RER movements over the 2007–2011 period are estimated to have reduced Australia's annual wine exports by 64 ML. This is one-third of the loss to all Southern Hemisphere exporters of 174 ML, and it contrasts with estimated export gains of 19 ML to the United States and 167 ML to Western Europe's key wine-exporting countries (last row of Table 2). This has reversed somewhat the massive gains of the Southern Hemisphere exporters at the expense of the Old World over the past two decades (Figure 1). It also strengthened the competitiveness of the US wine industry relative to other New World wine producers in both the U.S. and European markets.
Clearly, Australia is the country whose wine trade has been most adversely affected by real currency changes since 2007. In addition to losing export sales, however, it has also seen a considerable increase in imports. One-third of the estimated extra imports due to currency changes are from New Zealand, because of the greater real appreciation of the Australian dollar compared with the New Zealand dollar. The bracketed numbers in Table 3 show that New Zealand's additional penetration of the Australian market is especially strong in the superpremium category (predominately Sauvignon Blanc and Pinot Noir), while France's is predominantly in sparkling wine and Italy's in commercial-premium wines.
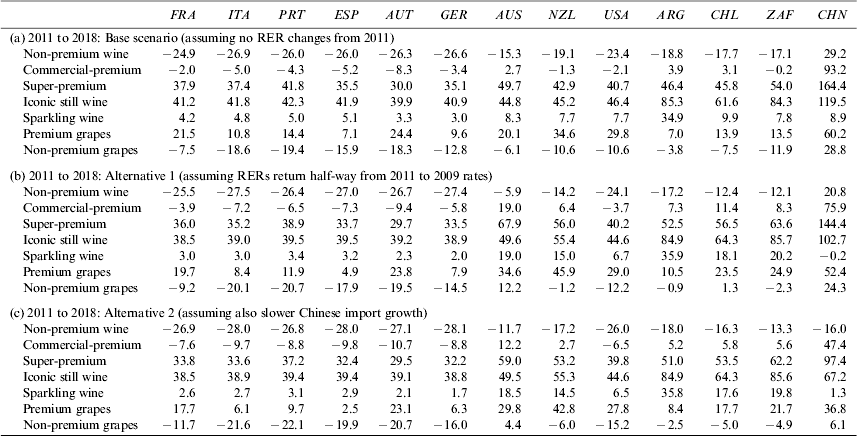
Projected Real Producer Price Changes, in Local Currency, 2011 to 2018 (changes in percent)
Source: Authors' model results.
How do the modeled outcomes compare with observed export changes in Australia? Historic data indicate that between 2006–2007 and 2010–2011, the volume of Australia's wine exports fell only slightly, from 768 ML to 727 ML; but, in domestic currency terms, exports dropped from almost AUD2.9 billion to just under AUD2.0 billion over that period (www.wineaustralia.com). Therefore, the modeled effect of RER changes slightly overstates the drop in the volume of wine exports, but the modeled drop in value—shown in Table 3—is very close to the observed change.
These results suggest that RER changes go a long way toward explaining why market shares and producer prices have changed so much for some New World wine-exporting countries in recent years and in particular the improvement in competitiveness of the United States and European Union and the decline for Australian and other Southern Hemisphere exporters between 2007 and 2011. This only slightly reverses the trend of the previous 15 years, though (Figure 1). Nor does it necessarily mean that the era in which Australian and other Southern Hemisphere exporters have gradually increased their share of global wine exports is over. After all, RER changes can easily reverse—and indeed did in mid-2013. We turn now to consider the period to 2018, and in particular to examine how much a half-reversal of RER changes in 2009–2011 would affect wine exporters.
Shares in Global Wine Export Volume, 1990, 2000, and Before and After Real Exchange Rate Changes During 2007–2011
V. Projecting Global Wine Markets to 2018
To project global wine markets forward, it is important first to update the model's 2009 baseline with known data. Sufficient data were available globally to calibrate the model to 2011 when the study began, so we project the model to that year first using actual aggregate national consumption and population growth together with actual changes in RERs between 2009 and 2011 and assumed changes in preferences, technologies, and capital stocks as described. After this new baseline is in place, the second step is to assume that aggregate national consumption and population grow from 2011 to 2018 at the rates shown in Appendix Table 2 and that preferences, technologies, and capital stocks continue to change as described above and that RERs over that period either remain at their 2011 levels (our Base Scenario) or return halfway to their 2009 rates (except for China) as reported in Appendix Table 1(b).Footnote 4 The latter RER changes began to happen in mid-2013, so this (our Alternative 1) scenario is more likely to be representative of the real world by 2018 than our Base Scenario. A third scenario (our Alternative 2) presents a lower-bound projection of what might happen to Chinese wine import demand if China's economy slowed by one-quarter, its RER ceased to appreciate, and simultaneously its domestic grape and wine production capital grew twice as fast.
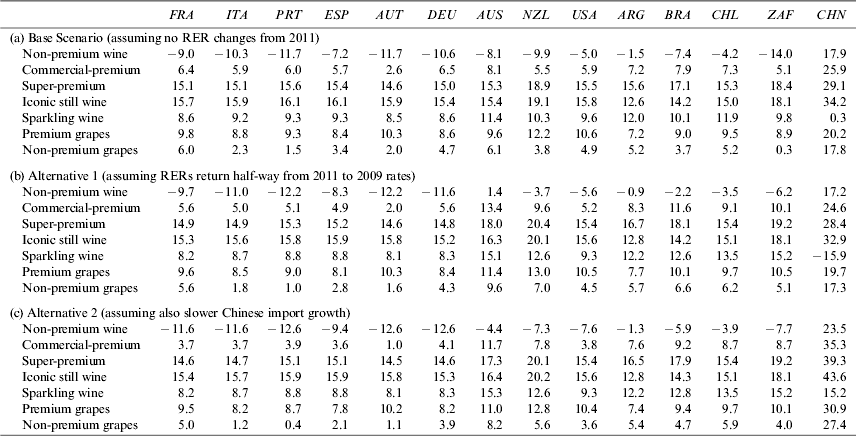
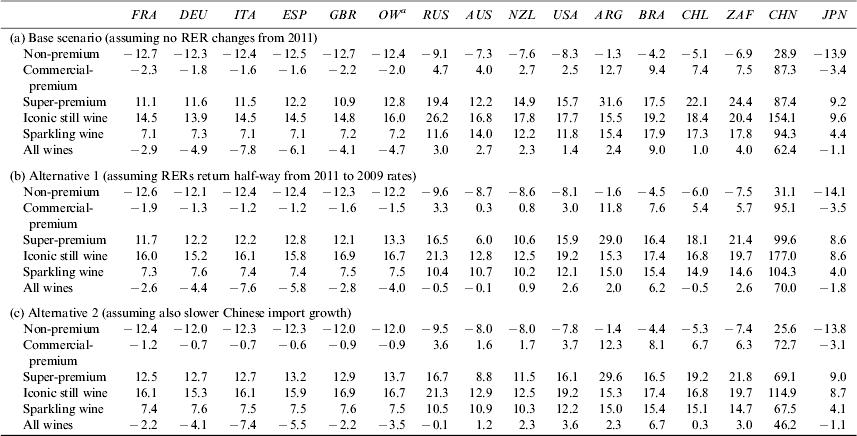
The impacts of those three scenarios on real producer prices in the sector, in local currency units, are reported for the world's main wine-producing countries in Table 3. For the period to 2018, Australia's nonpremium grape and wine prices are projected to fall further if real exchange rates do not change from their 2011 levels, while superpremium and iconic still wine prices are projected to rise by more than 40 percent (Table 3a). If, however, RERs were to return halfway to what they were in 2009, real prices in Australia in local currency terms would rise above 2011 levels for all grape and premium wine types (Table 3b). The extent of those rises would be somewhat but not substantially less if China's import growth were to be slower as in the Alternative 2 scenario (Table 3c). Similar changes are shown for the other wine-exporting countries in the Base scenario, because that involves no RER or other country-specific changes: price changes for commercial-premium are minimal, and for superpremium wines the increases are in the 30–50 percent range.Footnote 5
Given the assumptions that all countries enjoy productivity growth of 1 percent per year and that there is a taste swing against nonpremium wine, it is not surprising that all major suppliers are projected to expand their output of all wine types except nonpremium in the Base scenario. In the Alternative 1 scenario with the reversal in RER trends, however, those output increases would be greater in the Southern Hemisphere and less elsewhere (compare Tables 4a and 4b). If China's import growth were much slower, as in the Alternative 2 scenario, the increases would be up to one percentage point less except in China, where, by assumption in this scenario, its grape and wine capital and hence output would grow faster (Table 4c).
Projected Grape and Wine Output Volume Changes, 2011 to 2018 (in percent)
Source: Authors' model results
The income, population, and preference changes together mean that consumption volumes grow over the period to 2018 for all but nonpremium wine, but least so for commercial-premium. The percentage increases are similar in the three scenarios, but slightly less in the Alternative 1 scenario (altered currencies) and slightly more in the Alternative 2 scenario—except for China, where the differences are in the opposite direction (Table 5). This is consistent with the differences in local currency consumer price changes.
Changes in Quantities of Wine Consumed, 2011 to 2018 (in percent)
Source: Authors' model results.
a Belgium, Denmark, Finland, Ireland, the Netherlands, Sweden, and Switzerland.
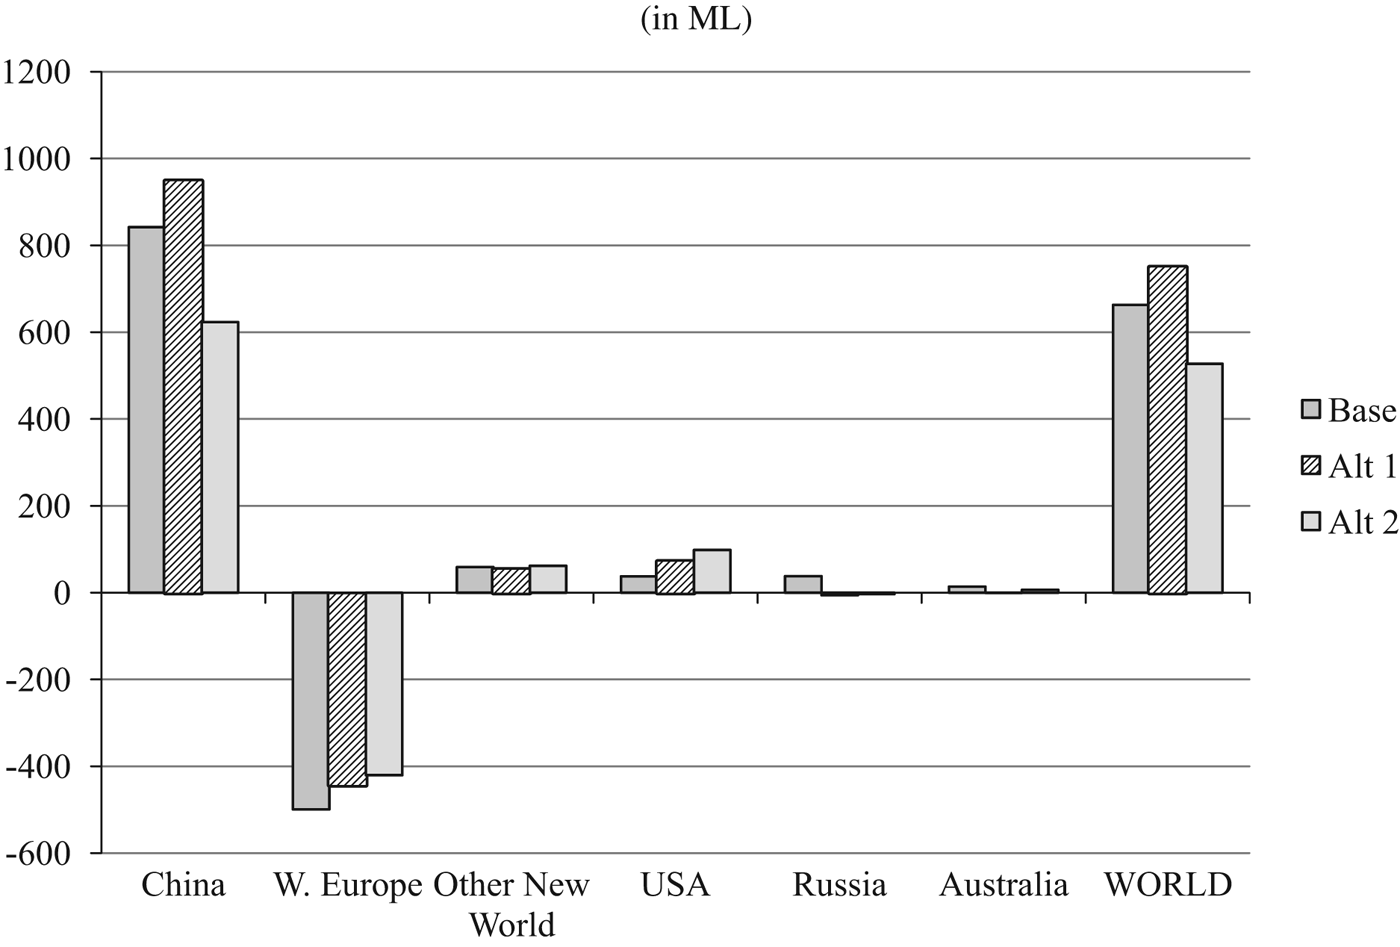
What is even more striking is the concentration of consumption growth and declines, as shown in Figure 2. In all scenarios, growth is concentrated in China, while there are substantial declines in aggregate consumption in the Old World, where the declining nonpremium wine segment is still substantial.
Changes in consumption of all wines, 2011 to 2018
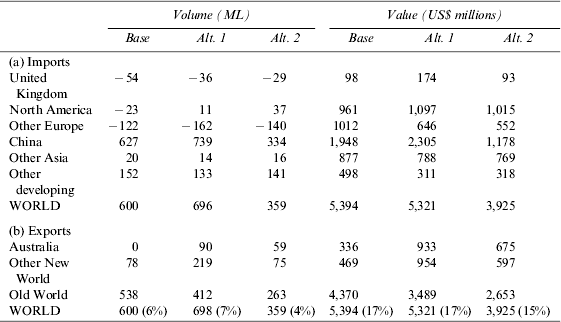
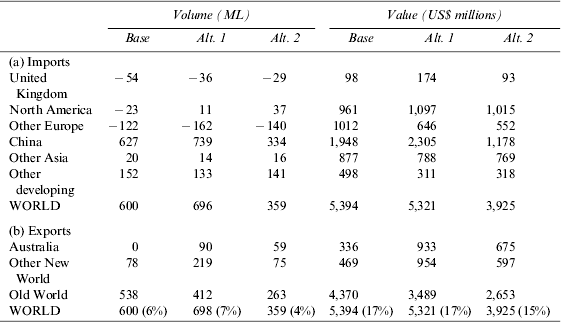
When this scenario is combined with the changes projected in production, it is possible to get a picture of what is projected to happen to wine trade. Table 6 provides projections for the main wine-trading regions. In terms of volume, world trade expands 6 percent by 2018 in the Base Scenario, and 7 percent in the Alternative 1 scenario in which RERs change. Virtually all of that increase in those two scenarios is due to China's import growth. In the Alternative 2 scenario, in which China imports less, global trade also expands less (by only 4 percent). In terms of the real value of global trade, however, the upgrading of demand elsewhere means that China accounts for a smaller proportion of the growth in global import value, namely 36, 43, and 30 percent in the Base, Alternative 1, and Alternative 2 scenarios, respectively. In all three scenarios, the value of global wine trade rises by about one-sixth (last row of Table 6).
Projected Change in Global Wine Import and Export Volumes and values, 2011 to 2018
Source: Authors' model results.
It is not surprising that China is such a dominant force in these projections, given the dramatic growth in its wine consumption over the past dozen years (Figure 3), the expectation of continued high growth in its income over the next five years (albeit somewhat slower than in the past five years), and the assumption that China's winegrape production growth cannot keep pace with domestic demand growth. As a result, China's share of consumption imported falls from its 2009 level of 85 percent to 57, 54, and 67 percent in 2018 the Base, Alternative 1, and Alternative 2 scenarios.
China's Increasing Dominance in Asian Wine Consumption, 2000 to 2012
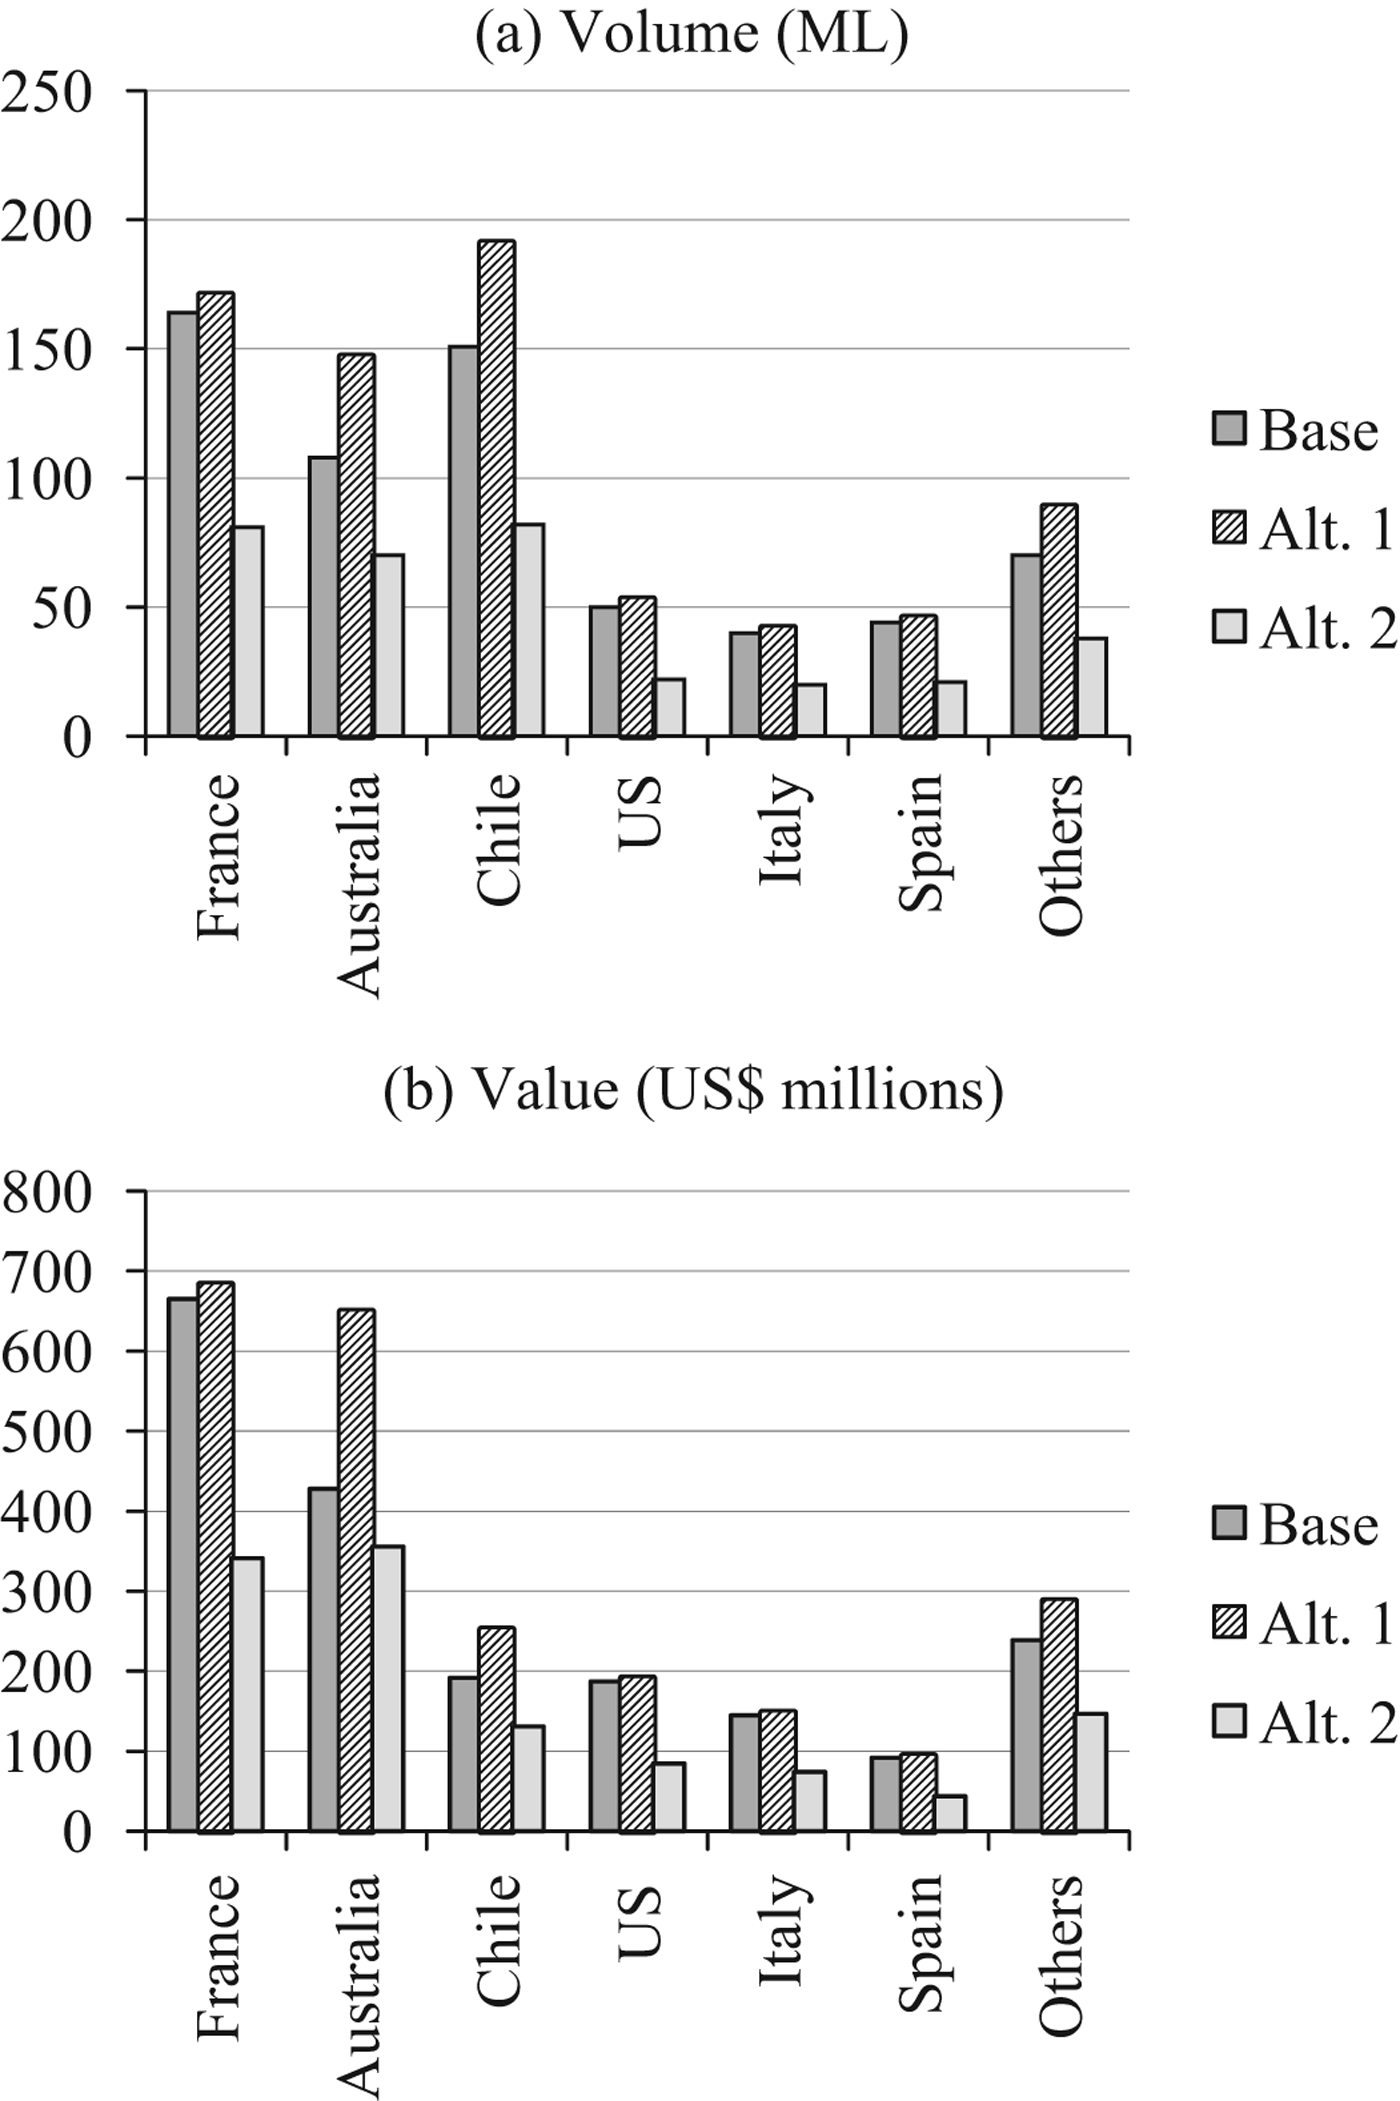
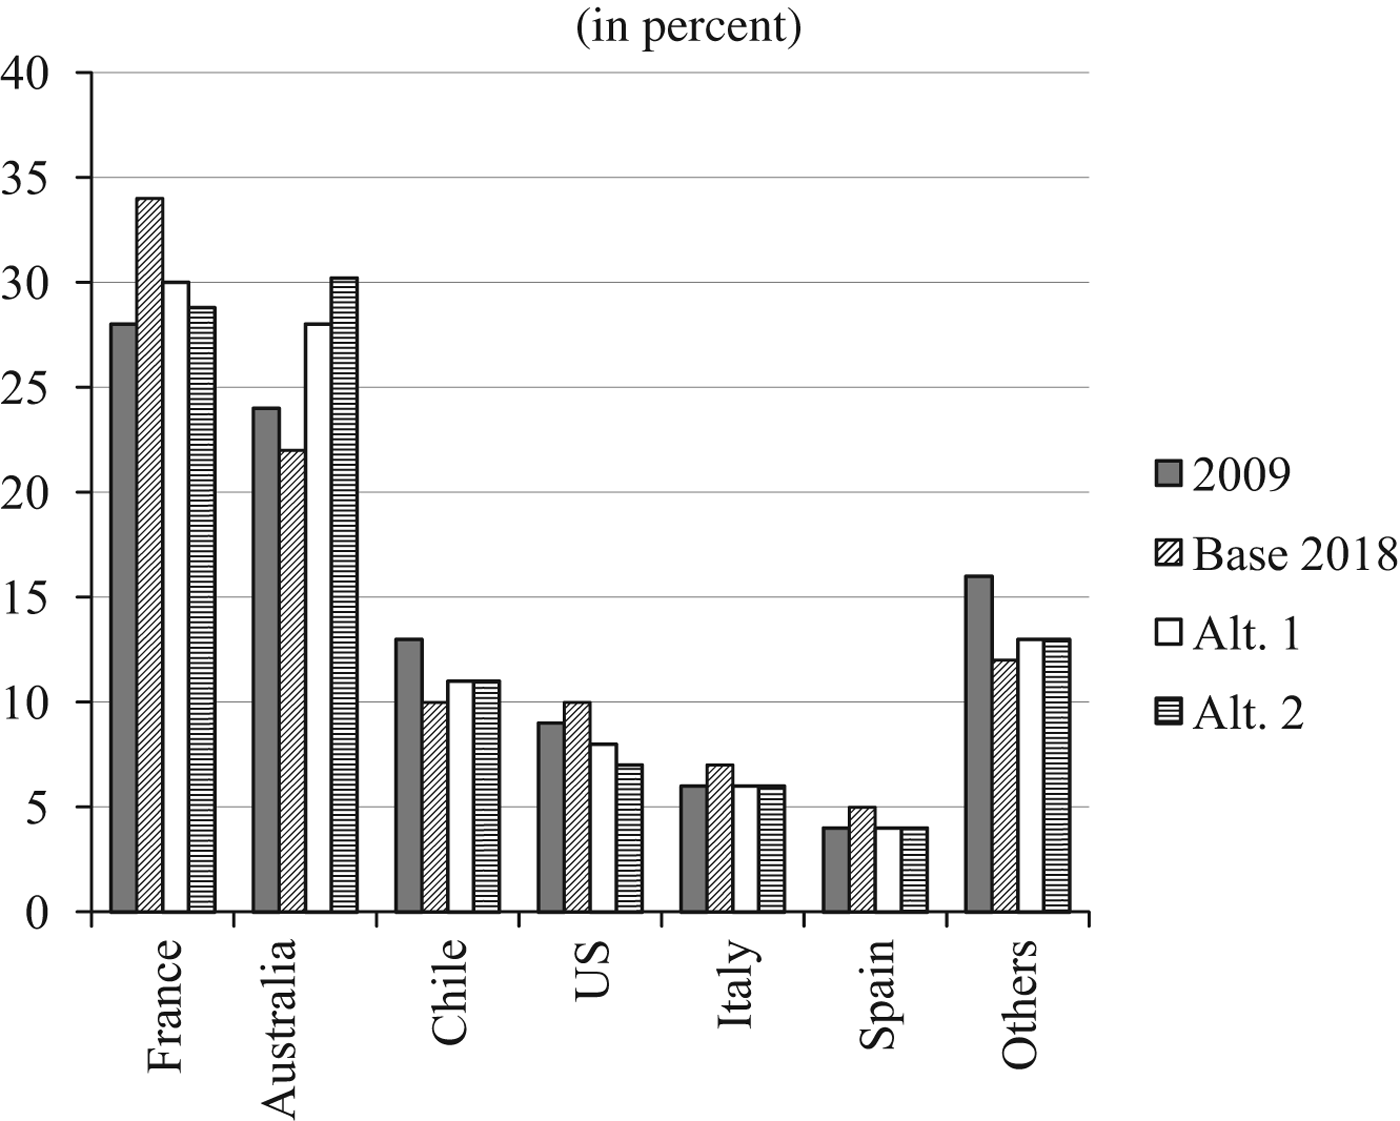
France is projected to become even more dominant in imports by China in the Base Scenario, in which exchange rates remain at 2011 levels. However, in the more likely Alternative 1 scenario with a reversal of recent exchange rate movements, the increase in China's imports from Australia is almost the same as that of France in value terms—and they lose equally if China's import growth slows further as in Alternative 2 (Figure 4a). In volume terms, it is Chile that enjoys the greatest increase in sales to China in the two Alternative scenarios (Figure 4b). The impacts of these changes on the shares of different exporters in sales to China are summarized in Figure 5. In the Base Scenario, France increases the dominance it had in 2009, in the Alternative 1 scenario Australia almost catches France, and in the Alternative 2 case Australia slightly overtakes France. Meanwhile, all other exporters' shares remain less than half those of Australia and France (Figure 5).
Change in China's Imports, by Source, 2011–2018
Shares of China's Wine Import Value, by Source, 2009 and 2018
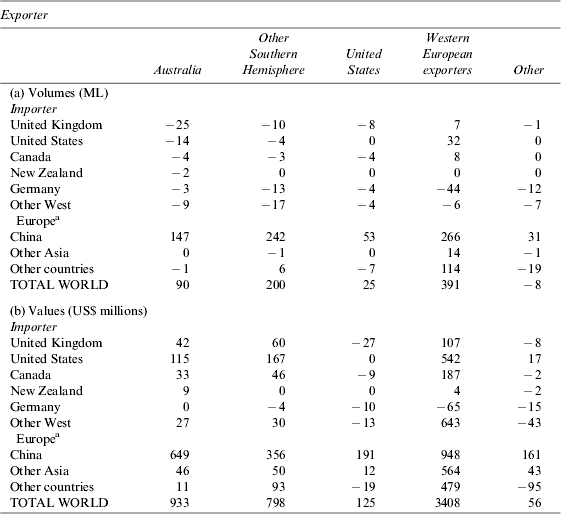
Projected bilateral trade changes more generally are summarized in Table 7 for the most likely (Alternative 1) scenario. All major wine-producing regions benefit from China's burgeoning demands. In volume terms, that is slightly at the expense of growth in their exports to other regions, although not in value terms because of the modeled upgrading of quality in those other markets. For Australia and Other Southern Hemisphere exporters, growth in real export values in local currency terms will be even larger than in the U.S. dollar terms shown in Table 7 due to the modeled real depreciation of the currencies of this group. For example, Australia's export value growth of US$933 million converts to an Australian dollar increase of A$1.36 billion. Australia's projected volume growth in this scenario is an extra 21ML of wine per year exported to China during 2011 to 2018. That should be manageable, as it is the same rate of increase in Australia's sales to the United States during the first decade of this century.
Changes in Export Volumes and Values of Wine-Exporting Countries in the Alternative 1 Scenario, 2011 to 2018
Source: Authors' model results.
a Other West Europe=Belgium, Denmark, Finland, Ireland, the Netherlands, Sweden, and Switzerland.
VI. Summary and Implications for Wine Markets and their Participants
The above results suggest that RER changes over the period 2007 to 2011 altered substantially the global wine export shares of the Old World and United States versus the Southern Hemisphere's New World exporters and especially Australia. This development reversed somewhat the massive gains of the latter group at the expense of the Old World over the past two decades (Figure 1). The exchange rate changes also strengthened the competitiveness of the U.S. wine industry, relative to other New World wine producers, in both the U.S. and European markets. Given those results, it is not surprising that the comparison between scenarios involving no RER changes from 2011 versus a halfway return to 2009 RERs suggests that there would be a reversal in international competitiveness of the various exporting countries.Footnote 6
The projections to 2018 reveal an even more striking prospect, however. It has to do with the continuing growth of China's net imports. China has already become by far the most important wine-consuming country in Asia (Figure 3) and, with a projected extra 620–940 ML to be added by 2018 to its consumption of 1,630 ML in 2011, that dominance is becoming even greater. Because China's domestic production is projected to increase by “only” about 210–290 ML by 2018, its net imports are projected to rise by between 330 and 740 ML.
This modeling exercise suggests not only that RER changes go a long way toward explaining why market shares and producer prices have changed so much for New World wine-exporting countries in recent years—especially the decline in competitiveness for Australia and the improvement for the United States—but also that exchange rates are capable of playing a major role in the years ahead. But on top of that, the above projections point to the enormous speed with which China may become a dominant market for wine exporters. Although the recent and projected rates of increase in per-capita wine consumption in China are no higher than what occurred in several northwestern European countries in earlier decades, it is the sheer size of China's adult population of 1.1 billion—and the fact that grape wine still accounts for only 4 percent of Chinese alcohol consumption—that makes this import growth opportunity unprecedented. It would be somewhat smaller if China's own winegrape production increases faster, as in the Alternative 2 scenario, but certainly in as short a period as the next five years that is unlikely to be able to reduce the growth in China's wine imports very much, especially at the premium end of the spectrum.
Of course, these projections are not predictions. Where exchange rates move and how fast various countries' wine producers take advantage of the projected market growth opportunities in Asia will be key determinants of the actual changes in market shares over the coming years. Not all segments of the industry are projected to benefit, with nonpremium producers facing falling prices if demand for their product continues to dwindle as projected above. But exporting firms that are willing to invest sufficiently in building relationships with their Chinese importer/distributor—or in going into grape growing or winemaking in China may well enjoy long-term benefits from such investments.
Appendix:
Revised Model of the World's Wine Markets
A model of the world's wine markets was first published by Wittwer et al. (Reference Wittwer, Berger and Anderson2003). That model has since been much revised and updated. Several significant enhancements have been made to that original model (which is still solved using GEMPACK software; see Harrison and Pearson, Reference Harrison and Pearson1996). Wine types have been disaggregated from the original two to five types: non-premium (including bulk), commercial-premium, superpremium and iconic still wines, and sparkling wine. As in the original model, there are two types of grapes, premium and nonpremium. Nonpremium wine uses nonpremium grapes exclusively, superpremium and iconic wines use premium grapes exclusively, and commercial-premium and sparkling wines use both types of grapes. As for the model's regional dimension, the number of countries and country groups has expanded from 10 in the original model to 51: 44 individual countries and 7 composite regions. The model's database is calibrated to 2009, based on the data provided in Anderson and Nelgen (Reference Anderson and Nelgen2011, especially Sections V, VI, and VII).
Cumulative Changes in Exchange Rates and Prices Relative to the US dollar, 2007–11 (in percent)
Cumulative Consumption and Population Growth, 2011 to 2018 (in percent)
The model has supply and demand equations and hence quantities and prices for each of the grape and wine products and for a single composite of all other products. Grapes are not assumed to be traded internationally, but other products are both exported and imported. The model also includes excise and import taxes on each of the wine products and value-added taxes on all products. Each market is assumed to be in equilibrium before any shock and to find a new equilibrium following any exogenously introduced shock.
An enhancement of importance to the present study is the inclusion of exchange rate variables in the model. This enables us to distinguish between price impacts observed in the local currency from those observed in U.S. dollars.
Model Equations
In the model, the grape and wine sectors minimize costs of intermediate inputs subject to weak constant elasticity of substitution (CES) between inputs. We assume that no intermediate inputs are imported from other countries. Intermediate demands are specified as follows:
 $$X_{id}^c = f\,(X1_{id}, CES[P_{id}^c /P1_{id} ])$$
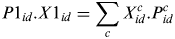 $$P1_{id}. X1_{id} = \sum\limits_c {X_{id}^c. P_{id}^c} $$
where X idc is the quantity demanded of commodity c by grape or wine industry i in region d, P idc is the corresponding price, and X1id and P1id are the respective intermediate composite quantities and prices.
Two primary factors are employed in the sector: labor (the quantity of which is endogenous with perfectly elastic supply) and capital. Capital is usually treated as exogenous in quantity, with rates of return bearing all the adjustment in the various scenarios. This reflects the fact that both grapes (a perennial crop) and wine plant capacity adjust slowly to market signals:
 $$L_{id} = f\,(F_{id}, CES[W1_{id} /PF_{id} ])$$
 $$K_{id} = f(F_{id}, CES(R_{id} /PF_{id} ])$$
 $$PF_{id}. F_{id} = LL1_{id}. W1_{id} + K_{id}. R_{id} $$
Grape and wine producers are assumed to minimize costs subject to CES substitution between capital and labor. Equations (3) to (5) show primary factor demands for the labor composite L1 id and capital K id subject to a composite factor demand F id by industry i in region d. The factor prices are W1 id for composite labor, R id for capital rentals, and PF id for composite prices.
The composite factor demand F id is proportional to total output Q id subject to a primary-factor using technology A id. Hence
 $$F_{id} = Q_{id}. A_{id} $$
The perfectly competitive zero pure profit condition is that total revenue, valued at the output price P i0s multiplied by Q id, equals the total production cost:
 $$P_i^{0s}. Q_{id} = \sum\limits_c {P_{id}^c. X1_{id}^c} + \sum\limits_o {W_{id}^o. L_{id}^o} + R_{id}. K_{id} $$
Household demands follow a linear expenditure system in each region. We reduce the optimizing problem for household consumption of each commodity, subject to a budget constraint, to equations describing subsistence and discretionary demands. Aggregate subsistence expenditure WSUB d depends only on consumer prices P3 cd for each commodity, and the number of households N, as per capita subsistence quantities XSUB cd subject to given preferences are constant.
 $$WSUB_d = \sum\limits_c {P3_{cd}. XSUB_{cd}. N_d} $$
Discretionary expenditures for each commodity (the left-hand side of equation (9) are determined by the marginal budget share (β cd) of aggregate discretionary expenditure. This aggregate is the bracketed term on the right-hand side of equation (9), where W3TOT d is aggregate nominal expenditure:
 $$P3_{cd} (X3_{cd} - XSUB_{cd}. N_d ) = \beta _{cd} (W3TOT_d - WSUB_d )$$
Because real aggregate consumption is usually exogenous in our partial equilibrium simulations, the linear expenditure system determines the consumption shares of individual final commodities (i.e., the five wine types plus a composite of all other consumption items), driven by changes in relative prices as faced by domestic consumers. The income elasticity of demand for each commodity is equal to the marginal budget share divided by the expenditure share. This varies from 0.5 for nonpremium wine to 2.5 for iconic still wine. The income elasticity of demand for other consumption is very close to 1.0, because wine accounts for an average of only 0.3 percent of aggregate expenditure globally and no more than 1.1 percent in any country (Anderson and Nelgen, Reference Anderson and Nelgen2011, table 166).
A new feature of our revised model of world wine markets is the inclusion of nominal exchange rates. These appear directly in the equation linking retail prices (P3cds) to producer prices by country of origin (P c0s), where c denotes the wine type:
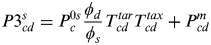 $$P3_{cd}^s = P_c^{0s} \displaystyle{{\mathop \phi \nolimits_d} \over {\mathop \phi \nolimits_s}} T_{cd}^{tar} T_{cd}^{tax} + P_{cd}^m $$
The exchange rates in the consuming (wine-importing) and producing (wine-exporting) regions are ϕ d and ϕ s respectively, expressed as local currency units per U.S. dollar. T cdtar is the power of the tariff in the consuming region and T cdtax the power of the domestic consumption (or excise) tax over and above any generic value-added or goods and services tax. P cdm is the price of margin m, assumed to be locally supplied, nontradable, and therefore unaffected by the exchange rate.
A given level of consumption for wine type c (X3 cd) is satisfied using the Armington assumption, in which wine from different countries of origin are imperfectly substitutable. First, domestic wine is imperfectly substitutable with a composite of imports:
 $$X3_{cd}^{ss} = f\,(X3_{cd}, CES(P3_{cd}^{ss} /P3_{cd} ))\quad ss = {\rm domestic},\,{\rm imports}$$
Imports by origin (X3cds) are determined in a second CES equation:
 $$X3_{cd}^s = f\,(X3_{cd}^{ss = \quot imports\quot}, CES(P3_{cd}^s /P3_{cd}^{ss = \quot imports\quot} ))$$
Shocks to International Competitiveness
The focus of the present study is how changes in international competitiveness affect the world's wine markets. A crucial part of this exercise is explaining how prices determined outside the grape and wine markets influence these markets. Because the model is partial equilibrium, in order to depict the impacts of changes in international competitiveness, outside price changes need to be imposed as shocks on the model. The price of intermediate inputs shown in equations (1) and (2) is set equal to the price of GDP (P dg) multiplied by a shifter F dc.
 $$P_{id}^c = F_d^c P_d^g $$
If no specific price observations are available, the shifter F dc remains exogenous and unshocked, with the change in price being determined by a shock to the price of GDP. If observations are available for specific input price movements, the shifter F dc becomes endogenous, with P idc now exogenous and shocked.
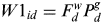 $$W1_{id} = F_d^w P_d^g $$
Wage rates are treated similarly. In equation (14), if the wage shifter F dw is exogenous, changes in wage rates W1id are determined by changes in the price of GDP. If wage rate data are available, F dw becomes endogenous and wage rates are shocked directly.
 $$P_{cd}^m = F_d^m P_d^g $$
The prices of trade and transport margins are also determined by the price of GDP if the shifter F dm in equation (15) is exogenous.
Changes in international competitiveness depend on changes in relative price levels and changes in nominal exchange rates. In equation (16), ϕ sR denotes real exchange rate movements relative to the U.S. dollar in wine-exporting regions (and for wine-importing countries simply replace the subscript s with d):
 $$\phi _s^R = P_s^g /[P_{" USA"} ^g *\phi _s ]$$
In equation (16), the nominal exchange rate for the United States is always unchanged, because nominal and real exchange rates are expressed in terms of U.S. currency.
We calculate real producer prices, P i ,loc0s, as the producer price divided by the GDP deflator P sg:
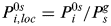 $$P_{i,loc}^{0s} = P_i^{0s} /P_s^g $$
P3cds is converted to local currency prices in equation (10). To obtain real price changes in local currency terms, we deflate source-specific P3cds and source-composite P3cd wine consumption prices by CPI (P dc):
 $$P3_{cd,loc}^s = P3_{cd}^s /P_d^c $$
and
 $$P3_{cd,loc} = P3_{cd} /P_d^c $$
Model Calibration to Market Conditions
This revised model of the world's wine markets is calibrated to market conditions in 2009, as detailed in Anderson and Nelgen (Reference Anderson and Nelgen2011, Section VI). This was only one vintage after the beginning of the global financial crisis and is assumed to provide a reasonable wine market benchmark against which to examine the impact of the major changes in real exchange rate changes since 2007.
Estimating the Effects of Exchange Rate Shocks, 2007 to 2011
The model enables us to ascribe shocks to depict changes in international competitiveness with information up to 2011 (the most recent year for which full data were available when this analysis began), from which it is then possible to project further ahead. Consumer price changes for the period 2007 to 2011 are available for each region from the World Bank (2012). Consumer prices are relevant because if in a scenario wine prices rise/fall relative to CPI in a given country, the quantity of wine consumed will decrease/increase for a given level of real aggregate household expenditure. Ideally, we would like to obtain nominal wage growth, producer price indexes, and margin prices for each country. If wage observations are available, F dw in equation (14) is made endogenous and wages are shocked directly. If more specific producer price indexes are available, we could make F dc in equation (13) endogenous and shock the indexes directly. And if we have margin price data, F dm becomes endogenous in equation (15) so as to shock margin prices directly. In the absence of more specific price data, each of the shifters in equations (13), (14), and (15) remains exogenous so the GDP price acts as a proxy.