1. Introduction
Detonation waves propagating in uniform media have been researched extensively (Radulescu et al. Reference Radulescu, Sharpe, Law and Lee2007; Taylor et al. Reference Taylor, Kessler, Gamezo and Oran2013; Sow, Lau-Chapdelaine & Radulescu Reference Sow, Lau-Chapdelaine and Radulescu2021; Taileb, Melguizo-Gavilanes & Chinnayya 2021; Watanabe et al. 2023). However, in real-world scenarios such as industrial accidents and detonation engines, these waves tend to propagate through non-uniform media. For instance, in severe nuclear reactor accidents, the interaction between molten corium and water releases hydrogen, forming a stratified, semi-confined layer of hydrogen–air mixture (Kuznetsov et al. Reference Kuznetsov, Yanez, Grune, Friedrich and Jordan2015). In rotating detonation engines, detonation waves propagate circumferentially within an annular combustion chamber (Fujii et al. Reference Fujii, Kumazawa, Matsuo, Nakagami, Matsuoka and Kasahara2017; Shi et al. Reference Shi, Fan, Shen, Wen, Shang and Hu2023). To cool the high-temperature walls of the combustion chamber, a thin and non-reactive gas film is introduced, creating stratified reactive and non-reactive media. Therefore, investigating the effects of such heterogeneity and understanding the mechanisms of detonation propagation in these conditions is crucial for improving industrial safety and advancing the application of detonation propulsion systems.
The detonation of gaseous reactants within an inert gas boundary was found to be similar to the detonation of a condensed explosive within a non-rigid container. Consequently, Sommers & Morrison (Reference Sommers and Morrison1962) conducted experiments using stratified inert/reactive gases to explain some intriguing phenomena observed in condensed explosive experiments. They discovered that the acoustic impedance ratio between the inert gas and the explosive influences the propagation characteristics of the detonation. The inert gas with a high acoustic impedance, akin to a solid wall, can promote stable detonation, whereas a low acoustic gas, which provides poor confinement, can lead to detonation decoupling. Later, Dabora, Nicholls & Morrison (Reference Dabora, Nicholls and Morrison1965) found that using nitrogen as the non-reactive layer can decrease the velocity of a gaseous detonation. The extent of this velocity reduction depends on the channel width and the ratio of the mixture density to the inert gas density.
Numerical simulations are increasingly used to investigate the behaviour of detonation waves propagating in stratified media (Reynaud, Virot & Chinnayya Reference Reynaud, Virot and Chinnayya2017; Mi et al. Reference Mi, Higgins, Kiyanda, Ng and Nikiforakis2018; Chiquete, Short & Quirk Reference Chiquete, Short and Quirk2019; Taileb, Melguizo-Gavilanes & Chinnayya Reference Taileb, Melguizo-Gavilanes and Chinnayya2020; Maxwell & Melguizo-Gavilanes Reference Maxwell and Melguizo-Gavilanes2022; Menezes, Ciccarelli & Chapdelaine Reference Menezes, Ciccarelli and Chapdelaine2023; Wang, Weng & Zhang Reference Wang, Weng and Zhang2023). Researchers have focused on whether detonation waves confined by a non-reactive gas layer can propagate continuously, and the failure mechanisms of detonation. Several key factors have been identified, including the critical height of the reactive layer, cell pattern, wave front curvature, and acoustic impedance ratio of the non-reactive to the reactive layer. Reynaud et al. (Reference Reynaud, Virot and Chinnayya2017) controlled cell regularity by varying the activation energy, and found that velocity deficit increases with cell irregularity. They also noted that detonation fails when the reactive layer height is reduced below a critical minimum value. Mi et al. (Reference Mi, Higgins, Kiyanda, Ng and Nikiforakis2018) demonstrated that using spatially concentrated energy sources with inert gas between them can reduce the minimum reactive layer height. Chiquete et al. (Reference Chiquete, Short and Quirk2019) determined that the global curvature of the detonation front, caused by yielding confinement, primarily drives both cellular pattern evolution and eventual detonation front stabilisation. Maxwell & Melguizo-Gavilanes (Reference Maxwell and Melguizo-Gavilanes2022) used a large eddy simulation approach to show that transverse waves associated with the detonation front’s cellular structure significantly contribute to shock–turbulent mixing zone growth, and promote continuous detonation wave propagation. Menezes, Ciccarelli & Chapdelaine (Reference Menezes, Ciccarelli and Chapdelaine2023) found that generating triple points along the diffuse layer interface supports detonation propagation. Wang et al. (Reference Wang, Weng and Zhang2023) also elucidated the effects of transverse waves and triple points on detonation propagation through simulations of kerosene/air two-phase detonation bounded by nitrogen gas.
Most of the aforementioned numerical studies of gaseous detonation utilised a simplified single-step chemical reaction model. However, Taileb et al. (Reference Taileb, Melguizo-Gavilanes and Chinnayya2020) investigated the effects of various reaction models – single-step, three-step chain-branching, and detailed chemistry models – on the flow structure and quenching limits of detonations in reactive layers bounded by an inert gas. Their results indicated that macroscopic characteristics of layered detonations, such as velocities, cell irregularity and leading shock dynamics, are similar across the three models, while the detailed chemistry model provides a better agreement with experimental results for critical reaction layer thickness. They attributed the discrepancies to the omission of certain physical mechanisms in the simplified reaction model, such as constant molecular weight and specific heat ratios.
Further, Houim & Fievisohn (Reference Houim and Fievisohn2017) investigated the influence of acoustic impedance ratios between inert and reactive gases in detail. Their results revealed that an interesting wave dynamic structure forms when the acoustic impedance of the inert gas is sufficiently low. This structure includes a detached shock in the inert gas, along with a series of oblique shock waves (OSWs) and slip lines in the reactants. Similar detached shock structures have been observed in numerical simulations of rotating detonation engine combustors (Uemura et al. Reference Uemura, Hayashi, Asahara, Tsuboi and Yamada2013; Shi et al. 2023), in studies on the interaction between detonation waves and boundary layers (Cai et al. Reference Cai, Liang, Deiterding, Mahmoudi and Sun2018; Peng & Deiterding Reference Peng and Deiterding2023), and even in the propagation of OSWs through solids (Brown & Ravichandran Reference Brown and Ravichandran2014). Most studies suggest that inert gas adjacent to the wall interferes with the detonation wave, causing bending of the wave front and a reduction in detonation velocity, which becomes lower than the theoretical velocity predicted by the Chapman–Jouguet (CJ) criterion (Chapman Reference Chapman1899; Jouguet Reference Jouguet1905).
Recently, Cheevers et al. (Reference Cheevers, Yang, Raut, Hong and Radulescu2023) proposed a novel experimental technique, making a significant contribution to the study of detonation propagation in a reactive gas layer weakly confined by combustion products. Their experiments also observed a similar detached shock configuration, confirming that the distinctive double shock reflection interaction is a real phenomenon, not merely an artefact of numerical simulations. Remarkably, they discovered that this configuration could exhibit a velocity higher than the CJ speed. This finding is particularly intriguing because it suggests that a strong detonation wave, with a speed exceeding the CJ speed, can be achieved in a straight channel without the assistance of a piston to compress the fluid behind the detonation wave. However, most works were unable to provide a satisfactory mechanism to explain this phenomenon, nor did they clarify under what conditions such a high-speed detonation wave could arise.
Motivated by the above questions, our current study investigates detonation waves propagating in a confined channel with symmetrical non-reactive layers along the upper and lower walls. We employ a detailed chemical reaction model, which more accurately captures real flow-reaction conditions compared to simplified reaction models. First, we examine how the properties of the non-reactive layers – specifically, their temperature and molecular weight – affect detonation wave propagation. Several modes of detonation wave propagation are identified. Subsequently, we introduce a dimensionless parameter related to the speed of sound and the specific heat ratio, which helps to unify the detonation wave propagation behaviour under different conditions. Finally, we present a theoretical explanation for the presence of strong detonation waves.
2. Physical model and simulation method
The schematic of the computational model is shown in figure 1, where a reactive medium is sandwiched between two symmetrical non-reactive layers attached to the walls. The upper, lower and left-hand boundaries are modelled as slip walls. The computational domain is initially divided into two zones. The non-uniform zone consists of reactive and non-reactive gases with a fixed pressure P I = P R = 105 Pa, a fixed temperature T R = 300 K for the reactive layer, and a variable temperature T I for the non-reactive layer. The reactive medium is a premixed stoichiometric H2–air mixture. The non-reactive gas consists of nitrogen (N2) or varying proportions of argon (Ar) and helium (He), which exhibit contrasting molecular weights (Ar has high molecular weight; He has low molecular weight). This composition enables the exploration of a wide range of average molecular weights in the non-reactive gas mixtures. The ignition zone (0 ≤ x ≤ 2 mm) is located on the left-hand side of the domain, featuring a high pressure P 0 = 5 × 10⁶ Pa and a high temperature T 0 = 3000 K. They can directly initiate detonation waves. Additionally, the thicknesses of the reactive layer and non-reactive layer are denoted by H R and H I , respectively. In this study, these thicknesses are fixed at H R = 4 mm and H I = 0.5 mm. The grid size Δx is 10 μm. The detailed grid independence verification can be found in Appendix A.
Schematic of the computational model.

In this study, an inviscid assumption is employed, consistent with previous research focusing on the analysis of non-reactive layers (Reynaud, Virot & Chinnayya Reference Reynaud, Virot and Chinnayya2017; Mi et al. Reference Mi, Higgins, Kiyanda, Ng and Nikiforakis2018; Chiquete, Short & Quirk Reference Chiquete, Short and Quirk2019). Additionally, this assumption is commonly used in other types of detonation simulations, such as oblique detonation (Teng et al. Reference Teng, Tian, Zhang, Zhou and Ng2021; Zhang, Liu & Wen Reference Zhang, Liu and Wen2022), rotating detonation (Yan, Teng & Ng Reference Yan, Teng and Ng2021; Chen et al. Reference Chen, Si, Wu, Hu and Zhu2023), and various other forms of detonation (Shi, Uy & Wen Reference Shi, Uy and Wen2020; Yuan et al. Reference Yuan, Yan, Zhou and Ng2021). The two-dimensional Euler equations, coupled with a detailed chemical reaction model, are solved numerically. The governing equations are
 \begin{equation} \frac{\partial \boldsymbol{U}}{\partial t}+\frac{\partial \boldsymbol{F}}{\partial x}+\frac{\partial \boldsymbol{G}}{\partial y}=\boldsymbol{S}, \end{equation}
where
 \begin{equation} \boldsymbol{U}=\left[\begin{array}{c} \rho _{1}\\ \rho _{2}\\ \vdots \\ \rho _{{n}}\\ \rho u\\ \rho v\\ e \end{array}\right],\quad\boldsymbol{F}=\left[\begin{array}{c} \rho _{1}u\\ \rho _{2}u\\ \vdots \\ \rho _{{n}}u\\ \rho u^{2}+p\\ \rho uv\\ \left(e+p\right)u \end{array}\right],\quad\boldsymbol{G}=\left[\begin{array}{c} \rho _{1}v\\ \rho _{2}v\\ \vdots \\ \rho _{{n}}v\\ \rho uv\\ \rho v^{2}+p\\ \left(e+p\right)v \end{array}\right],\quad\boldsymbol{S}=\left[\begin{array}{c} \omega _{1}\\ \omega _{2}\\ \vdots \\ \omega _{{n}}\\ 0\\ 0\\ 0 \end{array}\right]. \end{equation}
The subscript i (i = 1, 2,
 $\ldots$
n) represents the ith species;
 $\omega_{i}$
denotes the mass production rate per unit volume for species i; p represents the pressure; u and v are the velocity components in the x-direction and y-direction, respectively. The density
 $\rho$
and total specific energy e can be calculated as
 \begin{equation} \rho =\sum _{i=1}^{n}\rho _{{i}},\quad e=\rho h-p+\tfrac{1}{2}\rho \left(u^{2}+v^{2}\right), \end{equation}
where h is the specific enthalpy. The specific enthalpy h and the equation of state are expressed as
 \begin{equation} h=\sum _{i=1}^{n}\frac{\rho _{{i}}h_{{i}}}{\rho },\quad p=\sum _{i=1}^{n}\rho _{{i}}\frac{R_{{u}}}{W_{{i}}}T, \end{equation}
where R u is the universal gas constant, W i is the molecular weight of species i, and T is the temperature of the fluid.
To solve the governing equations, a second-order dispersion-controlled dissipation scheme (Jiang Reference Jiang2004) combined with a second-order Runge–Kutta algorithm is employed. The thermodynamic properties of the chemical species are evaluated using nine-coefficient NASA polynomial representations (McBride, Zehe & Gordon Reference McBride, Zehe and Gordon2002). The H2–air elementary reaction model proposed by Burke et al. (Reference Burke, Chaos, Ju, Dryer and Klippenstein2012) is utilised to describe the chemical reaction process. Notably, the selected reaction model includes 13 species (H2, O2, H, O, OH, HO2, H2O2, H2O, N2, Ar, He, CO, CO2) and 27 chemical reaction equations; however, the species CO and CO2 are excluded from this study.
3. Results and discussion
3.1. Detonation wave in a uniform H2–air mixture
Before studying the detonation wave propagation in stratified non-reactive/reactive media, we first investigate the detonation wave in a channel filled with a uniform, stoichiometric H2–air mixture. The temperature field, density gradient magnitude and numerical soot foil are shown in figure 2. The numerical soot foil represents the local maximum pressure and is commonly used to depict the trajectory of triple points on the wave front. The local pressure maximum, widely used by numerous researchers, simulates the soot foil pattern generated in experiments when detonation waves sweep across a wall. Therefore, this method is commonly referred to as ‘numerical soot foil’ in detonation simulations (Gamezo, Desbordes & Oran Reference Gamezo, Desbordes and Oran1999; Gavrikov, Efimenko & Dorofeev Reference Gavrikov, Efimenko and Dorofeev2000; Radulescu & Maxwell Reference Radulescu and Maxwell2011). The leading shock wave propagates forwards and compresses the premixed gas, causing an increase in temperature and pressure. When the temperature behind the leading shock wave exceeds the ignition temperature of the reactive medium, the chemical reaction is activated. For detonation combustion, this process is typically very rapid. As shown in figure 2(a), the temperature of the pre-compressed gas, indicated by the green band, forms only a thin layer, illustrating that the leading shock wave and the reaction front are tightly coupled. The wave front structure is notably more complex than an ideal planar detonation wave, with transverse waves evident behind the wave front, as clearly identified by the density gradient magnitude in figure 2(b). High density gradient magnitudes indicate the presence of triple points on the front. Figure 2(c) displays the cell structure formed by these triple points. There are five cells along the channel diameter, and these cells are relatively regular. Overall, although dynamic triple points are present on the wave front, the flow field of the detonation wave propagating in the H2–air mixture remains relatively uniform.
(a) Temperature field, (b) density gradient magnitude and (c) numerical soot foil for detonation propagation in a channel with stoichiometric H2–air.

(a) Detonation velocity plots and (b) PDF distribution of V ins for detonation propagation in a channel with stoichiometric H2–air.

As one of the key characteristics of detonation waves, the detonation velocity is studied in detail. Figure 3(a) shows the instantaneous velocity V ins of the detonation wave as it propagates to a specific position, represented by the black solid line. Sample points are taken every 1000 computational steps, corresponding to a flow time of approximately 0.6 μs. The red solid line represents the average velocity V ave , calculated using the formula V ave = (x 1−x 0)/(t 1−t 0), where x 0 is the location coordinate of the detonation wave (at least 25 times the length of the ignition zone to minimise the influence of the initiation zone); t 0 is the time when the detonation wave first reaches x 0, and t 1 is the time when the detonation wave reaches the location x 1. As observed, the average velocity converges to a constant value, indicating that the detonation wave has fully developed and reached a stable state. Furthermore, the numerical average velocity is in close agreement with the theoretical CJ velocity (V CJ = 1979.33 m s−1), which validates the credibility of our in-house code. Due to the dynamic nature of the triple points on the wave front, the instantaneous velocity fluctuates around the CJ value. Figure 3(b) shows the probability density function (PDF) of V ins . The instantaneous velocity fluctuates between 1500 and 2600 m s−1, with the distribution being asymmetric.
3.2. Effects of non-reactive layer temperature
3.2.1. The detonation modes when T I = 300, 600, 900 and 1200 K
To compare the effects of the temperature of non-reactive layers on the detonation wave propagation modes, we have plotted the temperature and density gradient fields at different inert layer temperatures T I in figure 4. The left-hand column shows the temperature field, while the right-hand column presents the density gradient. A comparison between figures 2(a) and 4(a) indicates that when a non-reactive layer is introduced, even if its temperature is as low as 300 K (identical to the reactive layer temperature T R ), it still significantly affects the detonation wave’s flow field. The detonation wave front becomes considerably distorted, and the post-wave flow field exhibits marked non-uniformity, with a series of vortex structures similar to those observed in interface instability studies (Collins & Jacobs Reference Collins and Jacobs2002; Liu et al. Reference Liu, Liang, Ding, Liu and Luo2018; Liang et al. Reference Liang, Zhai, Ding and Luo2019). The presence of vortex entrainment effects causes a significant amount of non-reactive gas to be drawn into the detonation products. However, the number of triple points on the wave front, as shown in figure 4(a), is greatly reduced.
Temperature fields (left-hand column) and density gradient magnitudes (right-hand column) of (a,e) T I = 300 K, (b,f) T I = 600 K, (c,g) T I = 900 K, and (d,h) T I = 1200 K.

It is generally believed that transverse waves dominate the formation of triple points on the wave front. When the transverse waves collide with solid walls, new counter-propagating transverse waves are generated, creating more complex triple points. However, when a low-temperature non-reactive gas layer is present near the wall, the kinetic energy of the transverse waves is dissipated upon collision, making it difficult to generate new transverse waves, thereby reducing the number of triple points on the detonation wave front, as illustrated in figure 4(a).
When the temperature T I is increased to 600 K, as shown in figure 4(b), the detonation wave front becomes straighter, but a more complex triple point structure emerges. This is primarily because the increased temperature leads to a rise in the speed of sound within the non-reactive layer, making it behave more like a rigid body. When the transverse waves collide with this layer, stronger transverse waves are generated, thereby increasing the number of triple points. The results in figures 4(c) and 4(d) further confirm this trend, showing that as T I increases, the number of triple points on the detonation wave front significantly increases, supporting the aforementioned hypothesis.
In addition to affecting the number of triple points, the temperature of the non-reactive layer also has a significant effect on the overall shape of the detonation wave front. For detonation waves in uniform mixtures, as shown in figure 2(b), although there are multiple triple points, the wave front remains planar. However, the introduction of the non-reactive gas layer causes the wave front to bend, and this curvature changes with T I . As depicted in the density gradient fields in figures 4(e–h), when T I = 300 K, the detonation wave front exhibits a convex shape in the middle, with concave surfaces on both sides. As the temperature increases, the shock front within the non-reactive layer gradually protrudes, creating a wave configuration with a concave centre and convex sides (see figure 4 h).
An increase in the temperature of the non-reactive layer leads to a higher speed of sound. The OSWs induced by the high-pressure detonation products interact with the wall, resulting in a Mach reflection, eventually causing the shock to detach (Uemura et al. Reference Uemura, Hayashi, Asahara, Tsuboi and Yamada2013; Shi et al. 2023). Therefore, following previous terminology, the forward-protruding shock waves in the non-reactive layer are referred to as detached shock waves (DSWs) in this study. The wave system between the two DSWs consists of a detonation wave. This observation aligns with an earlier qualitative experimental study (Cheevers et al. Reference Cheevers, Yang, Raut, Hong and Radulescu2023) and numerical simulation (Houim & Fievisohn Reference Houim and Fievisohn2017), further demonstrating the reliability of the numerical simulations presented in this work.
The cell size is a key parameter in detonation wave dynamics, whose influence on the macroscopic behaviour of the detonation wave is self-evident. Thus we recorded the local maximum pressure values at different time steps, and present the results in figure 5. Figure 5 displays the results of numerical soot foils under four different T I conditions. As T I increases, the number of detonation cells gradually increases from 1 to 5, while the size of the cells decreases accordingly.
Numerical soot foils of (a) T I = 300 K, (b) T I = 600 K, (c) T I = 900 K and (d) T I = 1200 K.

For cases with higher T I , as seen in figures 5(c) and 5(d), the triple point tracks of the detonation wave are confined to the H2–air mixture region (enclosed by the white dashed box), with no such tracks observed within the non-reactive gas layer. Typically, the regularity of detonation cells reflects the stability of detonation waves, which is primarily determined by the coupling between shock waves and heat release (Ng & Lee Reference Ng and Lee2003; Ng et al. Reference Ng, Radulescu, Higgins, Nikiforakis and Lee2005; Chavez, Chatelain & Lacoste Reference Rojas Chavez, Chatelain and Lacoste2023). The cell structures in the figure undergo a non-monotonic transition from regular to irregular and then back to regular patterns, suggesting that the introduction of the non-reactive gas layer not only alters the morphology of the detonation wave front but also affects the coupling between the flow and heat release processes.
Another key parameter of detonation waves is their propagation speed. Figure 6 presents the variation of detonation wave speed over time under different T I conditions. The black curve represents the instantaneous velocity of the detonation front, while the red solid line indicates the local average velocity, with the relevant definitions provided in § 3.1. When T I = 300 K, the detonation wave speed is significantly lower than the result for the uniform mixture (see figure 3 a), suggesting that the presence of a non-reactive layer at this temperature weakens the detonation wave. However, as the temperature T I increases, the average detonation wave propagation speed V ave gradually rises, approaching the result shown in figure 3(a) when T I = 900 K. At T I = 1200 K, the detonation wave propagation speed reaches approximately 2150 m s−1, significantly exceeding the theoretical CJ detonation wave speed (V CJ = 1979.33 m s−1), indicating the occurrence of a ‘strong detonation’.
Propagation velocity evolutions of the detonation wave for (a) T I = 300 K, (b) T I = 600 K, (c) T I = 900 K, and (d) T I = 1200 K.

Strong detonations are typically observed in piston-driven detonation studies, where the piston speed exceeds the velocity of fluid particle at the CJ planar, thereby amplifying the leading shock through compression waves or sound waves induced by the piston, resulting in a strong detonation (Sharpe & Falle Reference Sharpe and Falle2000; Daimon & Matsuo Reference Daimon and Matsuo2004; Romick, Aslam & Powers Reference Romick, Aslam and Powers2015). However, in this study, the downstream of the detonation wave involves a solid wall, and there is no high-speed piston movement. The high propagation speed of the detonation wave in this case suggests non-ideal effects in detonation flow, the details of which will be discussed further in § 3.5.
3.2.2. The detonation modes when T I = 1500 and 2100 K
Continuously increasing the temperature of the non-reactive layer is not a practical approach for most industrial applications, including rotating detonation engines, as excessively high temperatures near the wall are generally undesirable. However, in the spirit of exploring the fluid dynamics under extreme conditions, we further increased T I to 1500 K. Figure 7 displays the temperature field, density gradient magnitude and numerical soot foil for T I = 1500 K. Comparing figures 4 and 7, it can be observed that as the temperature T I increases, the DSW/OSW connection structure broadens in the direction perpendicular to detonation propagation, while the length of the central normal detonation wave (NDW) decreases. Simultaneously, the distance between the DSW in the non-reactive layer and the NDW in the reactive layer expands along the detonation propagation direction. Furthermore, the surface of the central NDW becomes smoother compared to figure 4(a−d), indicating the disappearance of triple points on the NDW front. Additionally, figure 7(a) clearly demonstrates that the post-DSW flow temperature approaches or exceeds that of the post-NDW flow.
(a) Temperature field, (b) density gradient magnitude, (c) numerical soot foil, and (d) the local enlarged diagram for the case T I = 1500 K.

To illustrate the complexity of the detonation front, figure 7(d) provides a local enlargement of the wave front. Here, media interface (MI) refers to the contact surface between the reactive and non-reactive layers. After being compressed by the DSW, the high-temperature, high-pressure flow in the non-reactive layer expands laterally, causing the MI to deflect towards the detonation wave side and inducing an OSW. This OSW interacts with the NDW, resulting in a reflected oblique detonation wave (RODW) that intersects the MI. Regarding propagation velocity, the experimental study by Cheevers et al. (Reference Cheevers, Yang, Raut, Hong and Radulescu2023) demonstrated that the NDW/OSW/DSW structure can propagate at velocities exceeding the CJ speed. However, due to limitations in measurement techniques and the length of the experimental section, it remains uncertain whether such structures achieve a steady state. In this study, the transient and average velocities presented in figure 8 confirm that the detonation wave attains a steady state. The instantaneous velocity fluctuates regularly around the average velocity with a small amplitude, ranging from approximately 2430 to 2450 m s−1.
Propagation velocity evolutions of the detonation wave for T I = 1500 K.

When the temperature T I reaches 2100 K, the detonation wave eventually becomes decoupled. Figure 9 presents the temperature fields at various times, with the white solid lines indicating the distribution of the product H2O (mass fraction), thereby reflecting the extent of the chemical reaction. Initially, the detonation wave exhibits a planar mode with Mach reflection, as shown in figure 9(a). However, the wave has not yet fully stabilised. As time progresses, the distance between the DSW in the non-reactive layer and the NDW in the reactive layer increases, leading to a shortening of the Mach stem, i.e. the height of the NDW, as observed in figure 9(b). This is followed by a transition from Mach to regular reflections, as illustrated in figure 9(c). Over time, the reflected OSW (ROSW) gradually detaches from the flame front, as shown in figures 9(d) and 9(e). Eventually, the absence of further H2O production behind the ROSW indicates a complete decoupling from the flame front, as depicted in figure 9(f). The primary cause of this decoupling is the increasing distance between the DSW and the intersection of the two OSWs, which reduces the incident angle of the OSWs. This reduction in angle diminishes the intensity of the ROSW, subsequently lowering the post-ROSW temperature below the ignition threshold.
Time-dependent transient temperature fields of T I = 2100 K (white solid lines indicate H2O mass fraction distribution).

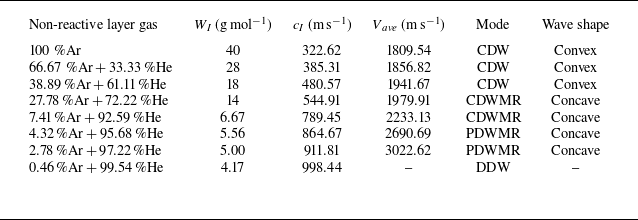
This subsection provides a detailed investigation into the effect of symmetric non-reactive layer temperature on detonation wave behaviour. To compare the differences among the cases, table 1 presents the non-reactive layer temperature, sound speed and detonation wave velocity for each case involving non-reactive layers. It can be observed that as T I increases, both the sound speed in the non-reactive layer and the detonation wave propagation speed increase rapidly. When T I reaches 2100 K, the detonation wave fails to form. Four different propagation modes are identified based on the shape of the wave front, considering variations in the temperature T I of the non-reactive layer. These modes include the cellular detonation wave (CDW), cellular detonation wave with Mach reflection (CDWMR), planar detonation wave with Mach reflection (PDWMR), and decoupled detonation wave (DDW). Among these, the CDW is characterised by a convex wave front, while the detonation waves that exhibit Mach reflection (such as CDWMR and PDWMR) possess concave wave fronts.
Propagation modes of the detonation wave for different non-reactive layer temperatures T I .

3.3. Effects of non-reactive layer properties (molecular weight)
The speed of sound within non-reactive gas layers critically influences how detonation waves travel through channels. This speed is affected not only by temperature but also by the gas’s molecular weight. In § 3.2, N2, which has a molecular weight 28 g mol−1, was used. In this subsection, however, a binary mixture of Ar and He is proposed for the non-reactive layer. By varying the molar ratio between Ar and He, we aim to modify the binary mixture’s molecular weight and explore its effect on the detonation wave’s propagation patterns. Table 2 provides details on molecular weights, corresponding speeds of sound, and detonation wave propagation modes under various molar ratios. As the He content increases, the mixture’s total molecular weight decreases, leading to a gradual rise in sound speed. Consequently, the propagation mode of the detonation wave changes from CDW to CDWMR and PDWMR modes, ultimately leading to decoupling.
Propagation modes of the detonation wave for different non-reactive layer molecular weights.

To illustrate the detailed effects of non-reactive layer properties on wave systems within the detonation wave flow field, figure 10 presents the detonation wave temperature fields corresponding to varying molecular weights W I of the non-reactive gas. The diagrams demonstrate that the shape of the wave front changes from ‘convex’ to ‘concave’ as W I decreases. For high W I values, figures 10(a) and 10(b) show a convex wave front, with the interface between the reactive and non-reactive layers curling backwards. As W I decreases, figures 10(c) and 10(d) reveal a slight concave curvature in the wave front, along with a forward curling of the interface. For W I = 6.67 g mol−1, the concave shape becomes more pronounced, as shown in figure 10(e), where an OSW forms between the DSW and the NDW. Surface instabilities are still present on the Mach stem in the reactive layer. When W I further decreases to 5.56 or 5.0 g mol−1, as depicted in figures 10(f) and 10(g), the detonation wave front becomes notably smoother, and the height of the NDW gradually diminishes. Ultimately, at W I = 4.17 g mol−1, as shown in figure 10(h), the Mach stem of the detonation wave disappears, and the ROSW becomes decoupled from the chemical reactions, preventing the formation of a stable detonation wave. This behaviour is consistent with the effects observed when the non-reactive layer temperature T I is increased.
Temperature fields for different molecular weights W I (in g mol−1): (a) 40, (b) 28, (c) 18, (d) 14, (e) 6.67, (f) 5.56, (g) 5.00 and (h) 4.17.

Numerical soot foils for different molecular weights W I (in g mol−1): (a) 40, (b) 28, (c) 18, (d) 14, (e) 6.67, (f) 5.56, (g) 5.00 and (h) 4.17.

Similarly, the numerical soot foils presented in figure 11 demonstrate that reducing W I has a similar effect to increasing T I . The cell size decreases as W I decreases, as illustrated in figure 11(a–e). When W I is reduced to 5.56 g mol−1, the cell structure completely vanishes, as shown in figure 11(f). As W I decreases, the penetration capability of the transverse waves weakens. The trajectory of the triple points in figure 11(a–c) shows that at higher W I values, the transverse wave can fully penetrate the non-reactive layer. However, when W I reaches 14 g mol−1, only a portion of the transverse waves can penetrate the non-reactive layer. As W I decreases further to 6.67 g mol−1, a stable OSW forms between the reactive and non-reactive layers, effectively blocking the transverse wave propagation from the reactive layer to the non-reactive layer. For W I values 5.56 and 5 g mol−1, steady Mach reflection on the wave front is observed. For a sufficiently low W I , the detonation corresponds to a DDW mode and becomes decoupled in the end, as illustrated in figure 11(h). Adjusting W I leads to the identification of four different propagation modes, similar to the effect of varying T I , as summarised in table 2.
3.4. Formation mechanism of wave front shapes
By increasing the temperature T
I
or decreasing the molecular weight W
I
of the non-reactive gas layer, we observed that the shape of the detonation wave front changes from convex to concave shape. In the case of a convex wave front, the NDW in the reactive layer propagates ahead of the wave structures in the non-reactive layer, as illustrated in figure 12(a). Conversely, for the concave wave front, shown in figure 12(b), the DSW in the non-reactive layer is in front of the NDW in the reactive layer. Notably, the convex wave front is dynamically evolving, as triple points continuously move along the wave front. To quantify the degree of convexity or concavity of the wave front, a parameter
 $\delta$
x is introduced:
 $\delta$
x = x
1 − x
2, where x
1 represents the x-coordinate of the detonation wave front at the centreline of the reactive layer, and x
2 denotes the x-coordinate of the shock wave front at the wall of the non-reactive layer. Clearly, when
 $\delta$
x > 0, the wave front is convex, and when
 $\delta$
x < 0, it is concave.
Schematics of the (a) convex and (b) concave wave fronts.

The shape of the wave front reflects the behaviour of the detonation wave. As seen in tables 1 and 2, the propagation speed of the concave wave front is usually greater than the CJ speed (V CJ = 1979.33 m s−1). To explore how temperature or molecular weight affect the shape of the wave front, the local wave structures schematic of the concave wave front is shown in figure 13. We assume that stable wave fronts in the reactive layer and the non-reactive layer have an average propagation velocity V. Due to the differences of media temperature or molecular weight between the reactive and non-reactive layers, the sound speeds in the two media are usually different, resulting in the difference of the Mach numbers in the two media:
Local wave structures of the ‘concave’ wave front.

 \begin{equation} M_{{I}}=\frac{V}{c_{{I}}},\quad M_{{R}}=\frac{V}{c_{{R}}}, \end{equation}
where c I and c R are the sonic speeds of non-reactive and reactive layers, respectively, and M I and M R represent the Mach number of non-reactive and reactive layers, respectively.
Based on above discussions of the flow field wave systems, it is evident that the DSW is not entirely planar, particularly around MI. For simplicity in our analysis, we initially consider the DSW to be a normal shock wave (NSW). With this assumption, the gas pressures p 2I behind the DSW and p 2R behind the OSW can be described as
 \begin{align} &\qquad \left(\frac{p_{2}}{p_{1}}\right)_{{I}}=1+\frac{2\gamma _{{I}}}{\gamma _{{I}}+1}\left(M_{{I}}^{2}-1\right), \end{align}
 \begin{align} &\left(\frac{p_{2}}{p_{1}}\right)_{{R}}=1+\frac{2\gamma _{{R}}}{\gamma _{{R}}+1}\left(M_{{R}}^{2}\sin ^{2}\beta _{{R}}-1\right), \end{align}
where
 $\gamma$
I
and
 $\gamma$
R
denote the specific heat ratios of gas in non-reactive and reactive layers, and
 $\beta$
R
is the angle of the OSW, as shown in figure 13.
Given that the leading shock wave in the non-reactive layer is not exactly an NSW but rather exhibits a slight curvature, the downstream gas pressure after the DSW is expected to fall below the theoretical predictions of (3.2). Additionally, the influence of expansion waves could further diminish the pressures following both the DSW and the OSW. As a result, the pressures p
2I
and p
2R
are not strictly equivalent, necessitating the use of a corrective parameter. To accurately establish the pressure matching relationship, a modified parameter
 $\alpha$
is introduced to ensure that p
2I
and p
2R
adhere to the designated relational formula:
 \begin{equation} \left(\frac{p_{2}}{p_{1}}\right)_{{R}}=\alpha \left(\frac{p_{2}}{p_{1}}\right)_{{I}}. \end{equation}
The introduction of the parameter
 $\alpha$
accounts for two key factors: first, the DSW is a curved shock wave, and second, the DSW exhibits expansion effects. By resolving (3.2)−(3.4), the wave angle
 $\beta$
R
can be determined as
 \begin{equation} \beta _{{R}}=\arcsin \left(\sqrt{\alpha \, \frac{\gamma _{{I}}\left(\gamma _{{R}}+1\right)}{\gamma _{{R}}\left(\gamma _{{I}}+1\right)}\frac{M_{{I}}^{2}}{M_{{R}}^{2}}-\alpha \, \frac{\gamma _{{I}}\left(\gamma _{{R}}+1\right)}{\gamma _{{R}}\left(\gamma _{{I}}+1\right)}\frac{1}{M_{{R}}^{2}}+\frac{1}{M_{{R}}^{2}}+\frac{\left(\alpha -1\right)\left(\gamma _{{R}}+1\right)}{2\gamma _{{R}}M_{{R}}^{2}}}\right). \end{equation}
Considering that M R > 4 (the Mach number of a gaseous detonation wave is typically greater than 4), the three terms on the right-hand side inside the square root in (3.5) are usually much smaller than 1.0 and can be neglected. Therefore, (3.5) can be simplified as
 \begin{equation} \beta _{{R}}\approx \arcsin \left(\sqrt{\alpha \, \frac{\gamma _{{I}}\left(\gamma _{{R}}+1\right)}{\gamma _{{R}}\left(\gamma _{{I}}+1\right)}}\,\frac{M_{{I}}}{M_{{R}}}\right), \end{equation}
and substituting (3.1) into (3.6), we can derive
 \begin{equation} \beta _{{R}}\approx \arcsin \left(\sqrt{\alpha \, \frac{\gamma _{{I}}\left(\gamma _{{R}}+1\right)}{\gamma _{{R}}\left(\gamma _{{I}}+1\right)}}\,\frac{c_{{R}}}{c_{{I}}}\right). \end{equation}
Previous studies using simplified reaction models (Houim & Fievisohn Reference Houim and Fievisohn2017; Menezes, Ciccarelli & Chapdelaine Reference Menezes, Ciccarelli and Chapdelaine2023) assumed that the gas specific heat ratio of the non-reactive layer is equal to that of the reactive layer, i.e.
 $\gamma$
I
=
 $\gamma$
R
. However, the specific heat ratio of some gases varies with temperature in practice. For instance, the specific heat ratio of N2 decreases as the temperature increases. Similarly, the specific heat ratios of binary mixtures of Ar and He also differ from the reactive mixture. The detailed reaction model more accurately simulates the variation in specific heat ratio with temperature and molecular weight compared to simplified reaction models. For low temperature, the specific heat ratios of reactive layer of non-reactive layer gases are relatively close. But for high temperature (T> 1000 K), the assumption
 $\gamma$
I
≈
 $\gamma$
R
will no longer hold. Therefore, the effect of specific heat ratio should be considered. Given that
 $\beta$
R
is approximately equal to arcsin (
 $\eta$
), the expression for
 $\eta$
should be
 \begin{equation} \eta =\sqrt{\alpha \, \frac{\gamma _{{I}}\left(\gamma _{{R}}+1\right)}{\gamma _{{R}}\left(\gamma _{{I}}+1\right)}}\,\frac{c_{{R}}}{c_{{I}}}. \end{equation}
For a concave wave front to maintain its shape in figure 13, the theoretical angle
 $\beta$
R
should be less than 90°. Thus it is crucial that
 $\eta$
< 1 for maintaining a concave shape; exceeding this value results in a convex front. To evaluate whether the dimensionless parameter
 $\eta$
effectively differentiates the wave front shape of detonation waves across various non-reactive gas conditions, we set
 $\alpha$
to 1.0 and express both temperature and molecular weight as the unified dimensionless parameter
 $\eta$
. Figure 14 illustrates the relationship between
 $\delta$
x and
 $\eta$
; here,
 $\delta$
x> 0 indicates a convex wave front, while
 $\delta$
x< 0 indicates a concave one. The black line tracks changes in temperature T
I
, and the red line shows changes in molecular weight W
I
.
The convex–concave degree
 $\delta$
x versus dimensionless control parameter
 $\eta$
for
 $\alpha$
= 1.0.

Figure 14 clearly illustrates that when
 $\eta$
is used as the horizontal axis, the variations in
 $\delta$
x – induced by changes in temperature and molecular weight – are aligned onto a single unified curve. This demonstrates that the different physical parameters, temperature and molecular weight, can converge in their influence on wave dynamics by means of the dimensionless parameter. In the non-reactive layer, an increase in temperature increases the sound speed, mirroring the effect of a reduced molecular weight, both of which lead to a decrease in
 $\eta$
. When
 $\eta$
is decreased, the
 $\delta$
x value initially exhibits a linear trend but then sharply drops, signifying a transition in the detonation wave front from a convex to a concave shape, as shown in figure 14. This consistent pattern across both curves highlights the critical influence of non-reactive layer conditions – specifically, temperature and molecular weight – on detonation wave dynamics, primarily by altering the specific heat ratio and sound speed. These parameters have a significant effect on wave propagation and reflection behaviours.
3.5. Discussion on overdriven detonation wave
To test whether the dimensionless parameter
 $\eta$
can effectively normalise the detonation wave propagation velocity, figure 15 illustrates the relationship between V
ave
/V
CJ
and
 $\eta$
under different conditions of T
I
and W
I
. The figure plots the average detonation velocities against
 $\eta$
, where V
CJ
represents the theoretical speed of one-dimensional CJ detonation waves. The data show that variations in T
I
and W
I
produce similar velocity profiles, underscoring the central role of
 $\eta$
in governing both the wave pattern and speed of detonations. Specifically, when
 $\eta$
> 0.7, the ratio V
ave
/V
CJ
decreases almost linearly; below 0.7, it drops exponentially with the increase of
 $\eta$
.
The dimensionless propagation velocity V
ave
/V
CJ
as a function of
 $\eta$
for
 $\alpha$
= 1.0.

During the linear stage, the ratio falls below 1, indicating an underdriven state of detonation, a phenomenon widely discussed in the literature (Xiao et al. Reference Xiao, Sow, Maxwell and Radulescu2021; Wen et al. Reference Wen, Fan, Xu and Wang2023; Meng et al. Reference Meng, Xu, Zhang and Zhang2024; Watanabe et al. 2024). Conversely, in the exponential stage, V ave /V CJ exceeds 1, sometimes approaching double V CJ , marking a transition to an overdriven or strong detonation regime. This significant increase in velocity is rarely explored in previous studies. Compared to the results shown in figure 14, it can be concluded that the propagation velocity of convex wave systems is lower than the theoretical CJ speed, while the concave systems surpass it. Generally, the velocity deficit observed in convex systems can be attributed to the expansion effects of high-pressure products, which results in a portion of the chemical energy being unable to support detonation propagation.
Despite these observations, the dynamics of strong detonations in straight channels remains insufficiently explored. A comparison between figures 14 and 15 reveals that both the flow structures (figure 14) and velocities (figure 15) can be normalised by the parameter
 $\eta$
, indicating a significant correlation between flow structure and velocity. This suggests that
 $\eta$
plays a pivotal role in unifying these phenomena, and the one-dimensional, constant-area Zeldovich-von Neumann-Döring model falls short in explaining the emergence of strong detonations. Figure 16 focuses on detonation modes with Mach reflection, presenting local temperature and pressure fields of W
I
= 5 g mol−1 in § 3.3. This figure provides detailed visualisations of the flow structures, where the speed of sound is represented by white solid lines, and the streamlines are depicted as black arrows.
Local (a) temperature and (b) pressure fields of W I = 5 g mol−1. Black solid lines are streamlines; white solid lines are sonic speed lines.

Two symmetrical streamlines labelled 1, and two symmetrical streamlines labelled 2 – i.e. four streamlines in total – divide the entire flow field into five different zones. Due to the symmetry of the flow field, we focus on analysing only half of it. The flow regions behind the DSW, OSW and NDW are referred to as zones I, II and III, respectively. Specifically, zone I lies between the wall and streamline 1, while zone II is located between streamlines 1 and 2. In zone II, there exists an OSW and an RODW. The inflow is first compressed by the OSW, and then ignited by the RODW. Zone III, situated between the two symmetric streamlines 2, forms a flow channel that initially contracts and then expands. Notably, when the reactive medium passes through the NDW, the flow channel narrows from cross-sectional area A 1 to area A 2.
As shown in figure 16(b), the contraction of the flow in zone III is caused primarily by the compression occurring in zone II. When the inflow is compressed by the OSW and ROSW, a local high-pressure region forms, which further compresses the detonation products. This results in a progressive narrowing, followed by the subsequent expansion of the flow area in zone III, with the smallest cross-sectional size occurring near the sonic line. Typically, in detonation waves without a non-reactive gas layer, the streamlines behind the leading wave remain parallel, with no convergence, and the detonation wave propagation speed V CJ is determined using the CJ criterion. However, in the flow scenario depicted in figure 16, the conventional assumptions of the constant-area flow are no longer applied.
To explain the high propagation speed of the detonation wave observed in figure 16, we have developed a one-dimensional model of detonation flow with a variable cross-sectional area. As illustrated by the flow details in figure 16, a contractive stream tube (A 1 > A 2) appears in zone III, corresponding to the schematic diagram in figure 17. In this model, A 1 represents the area at the leading shock where the chemical reaction initiates, while A 2 denotes the area at the CJ plane, where heat release is fully completed. At cross-section A 2, the flow velocity of the detonation products relative to the detonation wave reaches the local speed of sound.
Schematic of detonation flow with a variable cross-sectional area.

In contrast, a reverse process, involving an expansive stream tube (A 1 < A 2), is more commonly observed, and the related theory has been used to explain velocity deficits in detonation waves (Dabora, Nicholls & Morrison Reference Dabora, Nicholls and Morrison1965). By integrating the theory of stream tube expansion, we have developed a stream tube contraction theory in this study. To describe the flow process depicted in figure 17, an ideal gas flow model has been employed, and the governing equations for mass, momentum and energy conservation are, respectively,
 \begin{align} &\qquad\qquad\qquad \rho _{{A}1}u_{{A}1}=\rho _{{A}2}u_{{A}2}\left(1-\xi \right), \end{align}
 \begin{align} &p_{{A}1}+\rho _{{A}1}u_{{A}1}^{2}-\int _{0}^{\xi }p\,{\rm d}\xi =\left(p_{{A}2}+\rho _{{A}2}u_{{A}2}^{2}\right)\left(1-\xi \right), \end{align}
 \begin{align} &\quad\qquad\qquad h_{{A}1}+\frac{u_{{A}1}^{2}}{2}+Q=h_{{A}2}+\frac{u_{{A}2}^{2}}{2},\, \end{align}
where
 \begin{align} h_{{A}1}=c_{{p}1}T_{{A}1},\quad h_{{A}2}=c_{{p}2}T_{{A}2}, \end{align}
where the subscript
 $A1$
denotes the parameters at position A
1, while the subscript A2 denotes the parameters at position A
2. Here,
 $\rho$
, u, p and h correspond to the density, velocity, pressure and specific enthalpy of the fluid, respectively, and c
p1 and c
p2 denote the specific heat at constant pressure of positions A
1 and A
2, respectively. Besides, Q is the total chemical heat release, and
 $\xi$
represents the contraction percentage in the area of each stream tube:
 \begin{equation} \xi =1-\frac{A_{2}}{A_{1}}. \end{equation}
To evaluate the integral term in (3.10), a pressure distribution of post-leading shock along the tube is required. Here, it can be simplified as
 \begin{equation} \int _{0}^{\xi }p\,{\rm d}\xi =\varepsilon p_{{A}2}\xi . \end{equation}
In the case of a one-dimensional detonation wave with a constant cross-sectional area, the pressure ratio between the von Neumann peak pressure at the leading shock and the CJ point pressure at the sonic point is approximately 2. Therefore, the value of
 $\varepsilon$
is between 1 and 2. For a specific value of
 $\varepsilon$
, Hirschfelder & Curtiss (Reference Hirschefelder and Curtiss1958) calculated the pressure distribution within the reaction zone of a detonation wave, obtaining a value
 $\varepsilon$
= 1.13, which will be used in our study. The Mach number at position A
1 can be described as
 \begin{equation} M_{{A}1}=\frac{u_{{A}1}}{\sqrt{\dfrac{\gamma _{{A}1}p_{{A}1}}{\rho _{{A}1}}}}. \end{equation}
Combining (3.9)–(3.15), we can obtain
 \begin{align} 2\left(1+\frac{Q}{c_{{p}1}T_{{A}1}}\right)&=\left(\frac{\gamma _{{A}2}}{\gamma _{{A}1}}\right)^{2}\left(\frac{\gamma _{{A}1}-1}{\gamma _{{A}2}^{2}-1}\right)\left[\frac{1}{1+\dfrac{\varepsilon \xi }{\left(1+\gamma _{{A}2}\right)\left(1-\xi \right)}}\right]^{2}\frac{\left(\gamma _{{A}1}M_{{A}1}^{2}+1\right)^{2}}{M_{{A}1}^{2}}\nonumber \\&\quad -\left(\gamma _{{A}1}-1\right)M_{{A}1}^{2}. \end{align}
To simplify the above equation, a new parameter
 $\psi$
is introduced:
 \begin{equation} \psi =\left[\frac{1}{1+\dfrac{\varepsilon \xi }{\left(1+\gamma _{{A}2}\right)\left(1-\xi \right)}}\right]^{2}-1. \end{equation}
Thus (3.16) can be reduced to
 \begin{equation} 2\left[\frac{Q}{c_{{p}1}T_{{A}1}}-\frac{\gamma _{{A}1}-\gamma _{{A}2}}{\gamma _{{A}1}\left(\gamma _{{A}2}-1\right)}\right]\frac{\gamma _{{A}2}^{2}-1}{\gamma _{{A}1}-1}=\frac{\left(M_{{A}1}^{2}-\dfrac{\gamma _{{A}2}}{\gamma _{{A}1}}\right)^{2}}{M_{{A}1}^{2}}+\frac{\psi \gamma _{{A}2}^{2}\left(M_{{A}1}^{2}+\dfrac{1}{\gamma _{{A}1}}\right)^{2}}{M_{{A}1}^{2}}, \end{equation}
where M A1 is greater than 4 for a detonation wave in H2–air mixture with temperature 300 K. When M A1 is large, minor terms become negligible, allowing for further simplification:
 \begin{equation} 2\left[\frac{Q}{c_{{p}1}T_{{A}1}}-\frac{\gamma _{{A}1}-\gamma _{{A}2}}{\gamma _{{A}1}\left(\gamma _{{A}2}-1\right)}\right]\frac{\gamma _{{A}2}^{2}-1}{\gamma _{{A}1}-1}=M_{{A}1}^{2}\left(1+\psi \gamma _{{A}2}^{2}\right). \end{equation}
This equation reveals that the left-hand side primarily concerns the properties of the fuel–air mixture and the conditions of the combustion products, whereas the right-hand side accounts for variations in the cross-sectional area. A new parameter, K, is introduced to represent the left-hand side:
 \begin{equation} K=2\left[\frac{Q}{c_{{p}1}T_{{A}1}}-\frac{\gamma _{{A}1}-\gamma _{{A}2}}{\gamma _{{A}1}\left(\gamma _{{A}2}-1\right)}\right]\frac{\gamma _{{A}2}^{2}-1}{\gamma _{{A}1}-1}. \end{equation}
Consequently, the propagation Mach number of the detonation wave can be articulated as
 \begin{equation} M_{{A}1}=\sqrt{\frac{K}{1+\psi \gamma _{{A}2}^{2}}}. \end{equation}
It is necessary to point out that when
 $\xi$
= 0, the parameter
 $\psi$
is zero. The value M
A1 (
 $\xi$
= 0) represents the CJ detonation velocity. Hence the ratio of the propagation speed of a detonation wave with any given
 $\xi$
to the CJ detonation velocity can be denoted as
 \begin{equation} \frac{V_{{A}1}\left(\xi \right)}{V_{{A}1}\left(\xi =0\right)}=\frac{M_{{A}1}\left(\xi \right)}{M_{{A}1}\left(\xi =0\right)}=\sqrt{\frac{1}{1+\psi \gamma _{{A}2}^{2}}}. \end{equation}
Finally, the velocity ratio of the cases varying area can be denoted by (3.22), which is just a function depending on variable
 $\xi$
. To validate the analysis presented, we plot the detonation wave propagation speeds derived from numerical simulations with the corresponding theoretical predictions on a single chart, as shown in figure 18. The red line represents the theoretical results, while the black circles represent numerical results. From the figure, with the increase of
 $\xi$
, the average velocity rises accordingly. The length of the error bar indicates error range ±3 %. From the comparison, the error between numerical and theoretical results is within 3 %, implying the accuracy of the theoretical model.
Comparison of numerical and theoretical detonation velocities at different area contraction rates. (CFD: Computational Fluid Dynamics.)

In the model presented in our study, a key focus is on the contraction effect observed after inflow across the detonation wave’s leading shock front. This effect significantly influences the wave’s propagation speed. Conventionally, one-dimensional detonation waves with constant cross-sections presume that the flow area remains unchanged post leading shock, which is foundational in calculating the CJ speed under ideal conditions. However, detonation waves usually deviate from this ideal state in practical scenarios, such as when the high-energy explosives encased in metallic cause the post-shock flow to expand laterally. This lateral expansion increases the volume of reaction zone products, raising the downstream speed of sound area, and diminishing the propulsive energy from combustion, leading to reduced wave speeds; this phenomenon is corroborated by several studies (Banks et al. Reference Banks, Henshaw, Schwendeman and Kapila2008; Schoch et al. Reference Schoch, Nikiforakis, Lee and Saurel2013; Chiquete & Short Reference Chiquete and Short2019; Sugiyama et al. Reference Sugiyama, Homae, Matsumura and Wakabayashi2020).
In the specific scenarios discussed in this paper, the detonation wave is flanked by upper and lower non-reactive gas layers, bounded externally by a rigid wall. An increase in the speed of sound or
 $\eta$
in these non-reactive layers prompts the interactions between the OSWs and the rigid wall, leading to the formation of a DSW. This DSW situates ahead of the main detonation front, triggering an OSW that compresses the fluid within the combustion zone (illustrated in figure 16). This flow area contraction enhances the concentration of chemical reaction energy, which in turn propels the leading shock to greater speeds. Consequently, the ratio A
2/A
1 illustrated in (3.22) becomes critical in governing the detonation wave’s propagation speed, which accelerates as A
2/A
1 diminishes (i.e.
 $\xi$
increases).
4. Conclusions
Detonation waves propagating in channels filled with uniform reactive media have been studied extensively, while research on detonation waves in inhomogeneous reactive media remains relatively limited. This study focuses on the propagation behaviour of detonation waves in a channel filled with inhomogeneous, stratified media, where a premixed stoichiometric H2–air mixture is surrounded by two layers of symmetrical non-reactive gas near the upper and lower walls. By solving a detailed chemical reaction model, the effects of the properties of the non-reactive gas layers on detonation behaviour are thoroughly investigated.
The results reveal two key characteristics as the temperature of the non-reactive layer increases or its molecular weight decreases. First, the detonation wave propagation speed gradually increases, even exceeding the theoretical detonation velocity predicted by the CJ criterion. Second, the shape of the wave front changes significantly, from ‘convex’ to ‘concave’. For the concave wave front, a detached shock emerges in the non-reactive layer and propagates ahead of the detonation wave in the reactive layer. These features are markedly different from those observed in detonation waves propagating in homogeneous reactive media. Notably, although temperature and molecular weight are different physical quantities, their effects on detonation behaviour are nearly identical. To investigate the underlying mechanisms, we analysed wave front morphology and introduced a dimensionless parameter
 $\eta$
, defined as the ratio of the sound speeds in the reactive and non-reactive layers, accounting for variations in specific heat ratio. By comparing cases with different gas molecular weights and temperatures in the non-reactive layer, we found that the relationship between the average convex–concave degree and the dimensionless parameter
 $\eta$
is consistent across cases. Additionally,
 $\eta$
allows for the detonation velocities under different non-reactive layer conditions to be unified onto a single curve, making it a key parameter controlling detonation propagation behaviour.
To explain why the propagation velocity of detonation waves with Mach reflection exceeds the CJ detonation velocity of the reactive layer, a detonation wave contraction model is developed. This model suggests that the heat release process behind the leading shock of the detonation wave is compressed by the flow behind the RODW (or ROSW) induced by the detached shock, causing streamlines to contract. As a result, the flow area at the CJ plane is smaller than at the leading shock, leading to a detonation speed that exceeds the theoretical CJ velocity. The numerical simulation results closely match the theoretical values, confirming the validity of the modified model. In addition to enhancing the understanding of detonation waves in inhomogeneous reactive media, these findings are anticipated to provide valuable insights for detonation control and safety measures. Specifically, non-reactive layers characterised by low temperatures or high molecular weights can attenuate the intensity of detonation waves within reactive layers, and reduce detonation velocity. However, under conditions of extremely high temperatures or extremely low molecular weights, the DDW propagation mode emerges, leading to decoupled detonation. This phenomenon presents a novel approach for suppressing the initiation and propagation of detonation waves.
While existing experimental evidence from studies by Sommers & Morrison (Reference Sommers and Morrison1962) and Cheevers et al. (Reference Cheevers, Yang, Raut, Hong and Radulescu2023) employing various mixtures (a H2−O2 mixture with low equivalence ratio approximately 0.269 bounded by He, and a stoichiometric C2H4−O2 mixture bounded by its products, respectively) has revealed similar wave front propagation patterns, extrapolating these findings to reactive gas systems necessitates further investigation. The fundamental mechanism discussed in this study – where the convex–concave characteristics of wave fronts are governed by the dimensionless parameter
 $\eta$
– suggests that these observed trends may exhibit broader applicability across different gas mixtures. However, comprehensive validation through additional experimental and computational studies remains imperative. Thus future numerical and experimental investigations could employ hydrocarbon fuels (e.g. CH4, C2H4 or C2H2) as reactive media, given their distinct reaction kinetics compared to hydrogen-based systems. Furthermore, non-reactive media could incorporate higher molecular weight gases such as sulphur hexafluoride (SF6), a compound widely utilised in industrial and scientific applications, with molecular weight 146 g mol−1 – significantly exceeding that of argon (40 g mol−1). The introduction of such high molecular weight species may reveal novel phenomena in detonation wave propagation through stratified media, potentially expanding the understanding of these complex interactions. Additionally, employing other types of stratified media with varying reactivity or layered combustion properties could further validate the broader applicability of the proposed model and findings.
Acknowledgements
This research was supported by the National Natural Science Foundation of China (nos 12202014, 12072353, 12132017).
Declaration of interests
The authors report no conflict of interest.
Appendix A. Grid movement method and independence verification
A grid movement technique is employed to improve the computational efficiency and reduce the computational cost, as shown in figure 19(a). When the detonation wave propagates to a position
 $d=100\,\Delta x$
from the right boundary of the computational domain, the computational domain represented by the blue dashed box moves d/2 downstream. Simultaneously, the d/2-long part to the right-hand boundary of the new computational domain is assigned as initial value. The d value in all cases is less than one-tenth of the overall computational domain length. Such a small moving distance can fully avoid the potential influence of the truncated part on the detonation wave (Taileb, Melguizo-Gavilanes & Chinnayya Reference Taileb, Melguizo-Gavilanes and Chinnayya2021; Xi et al. Reference Xi, Teng, Chen and Yang2022). This has also been illustrated in our previous work (Li, Yang & Wang Reference Li, Yang and Wang2024).
(a) Schematic of mesh movement, and numerical cell diagrams of different grid levels: (b) I, (c) II, (d) III.

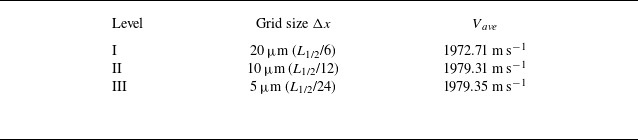
For the verification of grid independence, three types of grid resolution listed in table 3 are utilised. The average propagation velocity (V Ave ) of the detonation wave gradually converges towards the theoretical value (1979.33 m s−1) as the grid size decreases. Upon observing the cell diagrams in figures 19(b) and 19(c), it is evident that the cell structure appears blurry at coarse grid level I. However, with a smaller grid size at level II, the cell outline becomes clearer, and weak wave structures within the cell are well captured. At the smallest grid size level III, the cell structure becomes even clearer. Nevertheless, there is almost no difference between the cell diagrams of levels II and III. Additionally, it should be noted that grid sizes 20 μm, 10 μm and 5 μm correspond to L 1/2/6, L 1/2/12 and L 1/2/24, respectively, where L 1/2 represents the half-reaction-zone length. Lu, Kaplan & Oran (Reference Lu, Kaplan and Oran2021) have indicated that the release heat zone length L hr is approximately half of L 1/2, i.e. Δx = L hr /6 in our study. According to the study of Choi, Ma & Yang (Reference Choi, Ma and Yang2008), for accurate simulation of detonation cell structures, it is recommended that the release heat zone should include at least five grids (i.e. L 1/2 = 10 Δx). Reynaud, Taileb & Chinnayya (Reference Reynaud, Taileb and Chinnayya2020) examined the impact of various numerical resolutions, L 1/2 = 10 Δx, 30 Δx, 60 Δx. They also demonstrated that the shape of the detonation front is not affected by the increase in mesh resolution. This can satisfy the main research purpose of our paper. Therefore, the grid size Δx = 10 μm is adopted in our study, considering both computational accuracy and cost.
Three types of grid sizes used in simulations.