

Introduction
With population aging (ABS, 1998), there is an increasing need for accurate information on rates of depression in the older population. Consequently, debate about the prevalence of depression across adulthood and into old age has become increasingly relevant for national health policy (Snowdon, Reference Snowdon2001a). One major review has indicated no clear association between depression and old age (Jorm, Reference Jorm2000), though recent projections of depression prevalence range between 11% and 27%, greater than those typically observed in the total population (Stek et al., Reference Stek2004; Bergdahl et al., Reference Bergdahl2005; Steffens et al., Reference Steffens2009). In contrast, larger epidemiological studies typically report declining prevalence of depression with increasing age (Korten and Henderson, Reference Korten and Henderson2000; Blazer and Hybels, Reference Blazer and Hybels2005). Limitations of these studies have been proffered. For instance, lower reports of depression in late life can be attributed to selection and survival mechanisms (Henderson, Reference Henderson1994). Further, many prevalence estimates are derived from studies that implement cross-sectional designs, and a failure to (1) sample sufficient numbers of older participants, (2) discriminate between “young-old” and “old-old,” and (3) discriminate between reports from those living in the community and those living in residential homes (Lyness et al., Reference Lyness1995; Beekman et al., Reference Beekman1999; Jorm, Reference Jorm2000; Chong et al., Reference Chong2001; O'Connor, Reference O'Connor2006; Kessler et al., Reference Kessler2010). Addressing these issues in an Australian context, recent projections have indicated that between 7% and 10% of those aged over 60 years experience rates of depressive symptomology that significantly impacts on quality of life (Pirkis et al., Reference Pirkis2009), rates which do not differ from middle-aged adults (Burns et al., Reference Burns2012). However, a recent 11-year report of older adults indicated an increasing risk of depression for adults over 70 years of age, with increasing prevalence over time (Anstey et al., Reference Anstey2007). The inconsistency in these findings could be attributed to increasing numbers of older adults with subthreshold or subsyndromal depression. In adults aged 65 years and over, the rates of subsyndromal depression have been indicated as almost three times greater than for those with clinical depression (VanItallie, Reference VanItallie2005). However, there are limited data from large-scale studies available to describe the late-life course of subsyndromal depression, and the level of risk associated with subsyndromal-type depression in older adults remains unclear (Snowdon, Reference Snowdon2001a & Reference Snowdon2001b; VanItallie, Reference VanItallie2005). Therefore, the current study seeks to further our knowledge of late-life depression by extending the cross-sectional findings from the Dynamic Analyses to Optimize Ageing (DYNOPTA; Burns et al., in press) to determine the trajectories of late-life depression over a 13-year period. Consequently, we investigate the extent to which the likelihood of reporting probable depression is stable over time in community-living participants from the DYNOPTA study who aged from mid to late life. Furthermore, it is clear that there are important reasons for extending the investigation of late-life depression to consider rates of depressive symptoms. While rates of clinical depression may decline in late life, increasing depressive symptomology can still aversely impact on quality of life. It may be that the purported increase of depression in late life in some studies could be attributed to an underlying increase in subsyndromal depression. Subsequently, we will also investigate the level of increased risk associated with depressive symptomology in older adults over time and compare these findings with the rates of probable depression in the DYNOPTA study.
Methods
Participants
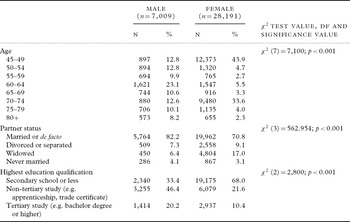
Data for these analyses were drawn from the DYNOPTA project (Anstey et al., Reference Anstey2010). The DYNOPTA project pools data from nine Australian longitudinal studies of aging and comprises the Australian Longitudinal Study of Ageing (ALSA), the Australian Longitudinal Study of Women's Health (ALSWH), the Australian Diabetes, Obesity and Lifestyle study (AusDiab), the Blue Mountains Eye Study (BMES), the Canberra Longitudinal Study (CLS), the Household Income and Labour Dynamics in Australia Study (HILDA), the Melbourne Longitudinal Study of Healthy Ageing (MELSHA), the PATH Through Life Study (PATH), and the Sydney Older Person Study (SOPS). The harmonization of existing studies, by pooling data or parallel analysis, is increasingly recognized as an important method that adds value to, and addresses the limitations of, investment in individual longitudinal studies (Piccinin and Hofer, Reference Piccinin, Hofer, Hofer and Alwin2008). Overall, the pooled DYNOPTA dataset comprised 50,652 respondents at baseline, which occurred between 1990 and 2001. For this study, participants (N = 35,200) were aged 45–103 at baseline, were observed for up to 13 years (Mean = 3.20 years; SD = 2.95 years), reporting up to five observations (Mode = 3), and were living in the community (i.e. not in aged-care facilities) at all measurement occasions (Table 1).
Sample descriptive statistics

Measures
Depression
Mental health is a key focus of the DYNOPTA project, yet no single depression scale was common to all the contributing studies. The harmonization of a depression scale and creation of a binary variable that reflects “probable depression” has previously been described (Burns et al., Reference Burns2012). In summary, each contributing study to DYNOPTA included one of four scales that are frequently used to assess depression or affective disorders (Burns et al., in press), each with sound psychometric properties, validity, and clinical utility. These scales included the Mental Health Index from the Short-Form Health Survey-36 (SF-36) used in the ALSWH mid and old samples, AusDiab and HILDA; the Mental Health Components Summary score from the shorter SF-12 used in the PATH study; the Centre for Epidemiological Studies Depression Scale (CESD) used in the ALSA and SOPS studies; and the Psychogeriatric Assessment Scales (PAS) used in the CLS and MELSHA studies. We computed a continuous measure of depressive symptomology by standardizing each of the contributing scales in turn, converting each of the continuous measures into z-scores with a mean of 0 and a standard deviation of 1; the assumption being that the underlying distribution would be consistent between contributing studies. The distributions were adjusted for sex and age. We then defined a common cut-point on this harmonized scale to identify those DYNOPTA respondents with likely or probable depression by considering the various cut-points for the individual scales reported in the literature that have been validated to external criteria (Burns et al., in press). The study was approved by the Human Research Ethics Committee at The Australian National University.
Covariates
Our models adjusted for demographic characteristics including age, education, partner status, and time in study.
Age
Due to smaller frequency in the age-gender cell sizes for the oldest age groups over time, we aggregated chronological age into five-year age groups (e.g. 45–49 years (the reference category); 50–54 years through 80 plus years).
Education
Education was classified into three levels relating to the extent of school and tertiary education participants reported: No Post-School Education (the reference category), Post-School Non-Tertiary Education, Post-School Tertiary Education.
Partner status
Participant partner status was classified into four categories: Married or De facto (the reference category), Divorced or Separated, Widowed, Never Married.
Time
Time was measured as years since baseline measurement.
Statistical analysis
Multilevel analyses, which employ Maximum Likelihood Estimation, were undertaken in STATA v.10. We first utilized logistic regression to derive estimates of probable depression over 13 years. We then utilized a linear regression model to determine the association between increasing age and a continuous measure of depressive symptomology over 13 years. Analyses were stratified by gender due to the larger number of females in the sample which would reduce the power to detect gender differences in reports of depression and depressive symptomology. This may also be particularly problematic since higher rates of depression are typically reported in females. Analyses were adjusted for age, partner status, education, and contributing study.
Results
Testing stability of depression probabilities in DYNOPTA over time
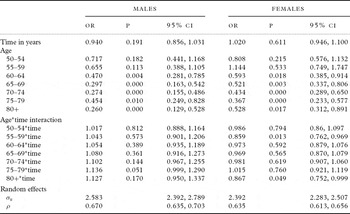
Results (Table 2) indicated no difference in the likelihood of probable depression over time for males (OR = 0.940; p = 0.191) or females (OR = 1.020; p = 0.611). For both males and females, older age at baseline was associated with declining risk of probable depression. The inclusion of age by time interactions indicated no significant effects, suggesting that the likelihood of reporting probable depression did not vary over time for individuals of different ages. Indeed, a likelihood-ratio test indicated the inclusion of these interactions as not improving model fit over a model that excluded these effects for both males (LR χ2 (7) = 6.855; p = 0.445) or females (LR χ2 (7) = 11.98; p = 0.101). Thus, older adults report lower likelihood of depression in contrast to those in midlife, a finding that was consistent over time.
Predictors of likelihood of reporting probable depression over a 13-year period

Analyses adjusted for Partner Status and Education; Partner Status reference: Married or De facto; Education Reference: Secondary School or Less; Age reference 45–49 year olds.
Testing stability of depressive symptomology in DYNOPTA over time
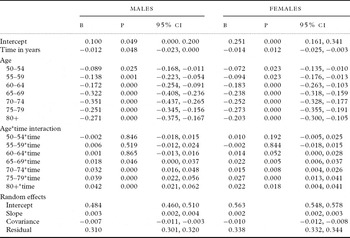
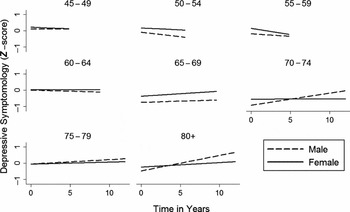
We extended our analyses of probable depression to compare the stability of a continuous measure of depressive symptomology over time. Similar to the results for probable depression, older adults reported lower levels of depressive symptomology at baseline. However, in contrast to these earlier results, a small but statistically significant negative effect for time indicated declining depressive symptomology as individuals aged, for both males (β = –0.012; p < 0.05) and females (β = –0.014; p < 0.05; Table 3). Also in contrast with our earlier analyses of probable depression, the inclusion of age by time interactions indicated differences in how age groups changed over time for both males and females. An increase in depressive symptomology over time was reported for those males aged over 70 years at baseline, and for those females aged 65 years and older at baseline. Likelihood-ratio tests indicated that the inclusion of these age by time interactions, for both males (LR χ2 (7) = 58.86; p < 0.001) and females (LR χ2 (7) = 21.97; p = 0.002), reported significant improvement in model fit, suggesting that increasing depressive symptomology with increasing age in late life best describes the observed data. Model implied fixed effects estimates were plotted to more clearly show the differences in trajectories for males and females by 5-year age group (Figure 1). For males, inspection of these estimates suggests a curvilinear association between increasing age and increasing depressive symptomology with more substantive rates of change in the older age groups. For females, the change in depressive symptomology appears to be less substantive and confirms the differences in the size of effects reported for males and females (Table 3).
Predictors of depressive symptomology over a 13-year period

Analyses adjusted for Partner Status and Education; Partner Status reference: Married or De facto; Education Reference: Secondary School or Less; Age reference 45–49 year olds.
A comparison of the model estimates of change in depressive symptomology for males and females by 5-year age group.

Discussion
The aim of this paper was to evaluate the stability of longitudinal estimates of probable depression in older Australians over time and to compare these changes with a measure of depressive symptomology by following 35,200 adults, aged 45–103 years, for up to 13 years. Of note, older adults reported lower likelihood of reporting probable depression, a finding that was consistent over time. The stability for likelihood of reporting probable depression over time was identified for both gender and for adults in all age groups. In contrast, analyses indicated a small decline in levels of depressive symptomology reported over time. Also, while older adults reported lower levels of depressive symptomology at baseline, they also reported increases in levels of depressive symptomology as they aged, contrary to the overall main effect. This finding was consistent for both gender, but was particularly pronounced for older males. Overall, this leads us to conclude that while there is an indicative trend for increasing levels of symptomology as older adults age, these effects are not substantive enough to increase above the threshold that would reflect probable depression. This finding is important since depressive symptomology, which can have deleterious effects on well-being and quality of life, does increase with increasing age in older adults but fails to reach a prescribed level at which clinical interventions may be sought and utilized. Simply, older adults may shy away from the stigma associated with seeking out help for their increasing symptomology and health professionals may fail to recognize this increase in depressive symptomology as an indicator of an increasing likelihood of subsequent depression, rather associating such increases as normative of the aging process.
Although this study lacked a clinical assessment, DYNOPTA's sample size increases the robustness of our findings. Further, each of the contributing studies had incorporated depression inventories that are validated measures of depression against clinical mental health criteria. Moreover, trends over time measured on the same scale are likely to reflect the true patterns of change in depressive symptoms and address limitations of confounding by multiple measurements at different observations.
There are a number of important findings with implications for interpreting the course of depression within individuals over time. Contrary to previous epidemiological studies (Korten and Henderson, Reference Korten and Henderson2000; Blazer and Hybels, Reference Blazer and Hybels2005; Burns et al., in press), we have demonstrated that although the likelihood of reporting probable depression prevalence is stable over time, age differences are reported; older adults report decreased likelihood of reporting probable depression. It is not difficult to propose reasons for these age effects. Middle-aged adults are at a time where they are balancing career development with growing family demands, while the decline of probable depression for those aged in their 50s and early 60s can be explained in terms of adults whose own children are approaching adulthood, easing the financial and emotional burdens on these adults who are now approaching retirement. An increase in the rate of depressive symptomology from age 65, in comparison with those aged 45, could be attributed to a corresponding increase in poor physical health as a consequence of normal age-related disease. As a significant indicator of the value of longitudinal data, Burns et al.'s (in press) earlier cross-sectional analysis of DYNOPTA failed to identify associations between age and likelihood of reporting depression. This demonstrates the importance of large population-based longitudinal research with the inclusion of substantial numbers of older adults to examine trajectories of change in depressive symptoms within individuals and the limitations of making inferences about the process of aging from cross-sectional studies. However, given the strength of the DYNOPTA data, there is still limited follow-up, spaced assessment, and relatively small number of very old respondents in comparison with mid-aged and young-old. Therefore, these analyses may still lack the sensitivity and scope of data to follow individuals across time to the point where the trend of increased symptoms translates into “caseness” of probable depression. In terms of the debate between epidemiologists and clinicians regarding the prevalence of depression in old age, our results appear to provide evidence to support both sides. Consequently, further analyses should seek to investigate transitions that may impact on mental health outcomes in late life, such as deteriorating physical health, frailty, death of spouse and friends, or relocation to residential care, that may impact on our determining the course of late-life depression.
Using a large pooled dataset, we have identified probable depression rates to be stable over time and that older adults are at reduced likelihood of reporting probable depression. Thought this finding must be framed within the context that older adults, in particular males, do report increases in depressive symptomology over time. We therefore conclude that although the likelihood of “depression” is stable over time, older adults are reporting increases in the level of depressive symptomology that may reflect a subsyndromal form of depression, as they age. This increased depressive symptomology over time which may adversely impact on their quality of life (Snowdon, Reference Snowdon2001b; VanItallie, Reference VanItallie2005). By utilizing a large epidemiological database, these results provide some clarification for the source of the conflicting evidence regarding late-life depression.
Conflict of interest
None.
Description of authors’ roles
R. A. Burns led the paper, designed the method, analyzed and interpreted the data, drafted and revised the paper; P. Butterworth designed the method, interpreted the data, drafted and revised the paper; M. Luszcz contributed to designing the method, interpreted the data, and drafted and revised the paper; K. J. Anstey contributed to designing the method, interpreted the data, and drafted and revised the paper. All authors approved the final version of the paper.
Acknowledgments
This work was supported by a National Health and Mental Medical Research Council grant (# 410215). The data on which this research is based were drawn from several Australian longitudinal studies including: the ALSA, the ALSWH, the AusDiab, the BMES, the CLS, the HILDA, the MELSHA, the PATH, and the SOPS. These studies were pooled and harmonized for the DYNOPTA project. All studies would like to thank the participants for volunteering their time to be involved in the respective studies. Details of all studies contributing data to DYNOPTA, including individual study leaders and funding sources, are available on the DYNOPTA website (http://DYNOPTA.anu.edu.au). The findings and views reported in this paper are those of the author(s) and not those of the original studies or their respective funding agencies. Anstey is funded by an NHMRC Fellowship #1002560. Butterworth is funded by an NHMRC Fellowship #525410.