In political science, urban politics is a well-established subfield. And more recently, suburban political behavior has received a fair amount of attention (Gainsborough 2001; 2005; McKee and Shaw 2003; Oliver 2001). But with a few exceptions (see Francia and Baumgartner 2005–2006; Gimpel and Karnes 2006), the political behavior of rural residents has been conspicuously absent thus far in a growing literature on the political role of place.1
A focus on place in studying political behavior is not the norm, but it is becoming more prevalent. Some recent scholarship examines place as an explanatory variable, considering it as a contextual effect on political behavior such as in the case of redistricting (Ansolabehere et al. 2000; Desposato and Petrocik 2003). Others have looked specifically at whether there are differences in the vote choice of persons depending on where they live (Gainsborough 2001; 2005; McKee and Shaw 2003).
Frank's (2004) book does not focus specifically on rural voters. Instead, Frank posits that the growth of conservatism among white working class voters amounts to a political absurdity because these voters would be better served if they voted for the party (Democratic) that advanced their economic interests as opposed to being enamored with a party (Republican) that hoodwinks them by placing the political fight squarely on values issues and thus distracting voters from economic concerns. It is implicit however, given the depictions of many of the settings in Kansas described by Frank (2004, 59–66), that he considers rural/small town voters to comprise a large portion of the voters aligned with the Republican Party. I take no position on the merits of Frank's argument, but for a quite spirited debate see the exchange between Frank (2005) and Bartels (2006).
To be sure, scholars have ventured into the red state/blue state debate (Abramowitz and Saunders 2005; Bartels 2006; Fiorina et al. 2006; Francia and Baumgartner 2005–2006), but no one has focused specifically on the contribution of rural voters in shaping recent presidential outcomes.3
The polling firm of Greenberg Quinlan Rosner Research conducted a series of polls targeting rural voters in battleground states in the 2004 presidential election for the Center for Rural Strategies (www.ruralstrategies.org/8055/polling2.html) and wrote a very informative report on rural voters for the W. K. Kellogg Foundation titled, “The Message from Rural America: The Rural Vote in 2004.” The report is available through the W. K. Kellogg Foundation web site (www.wkkf.org).
Data are the rural percentage of the Republican two-party vote calculated by the author from American National Election Studies (ANES). Throughout this study the ANES data are used to classify voters as urban—respondents who live in central cities and suburban areas—and rural—respondents who live in rural, small town, and outlying and adjacent areas. Although there is considerable political variation among urban residents (i.e., between city dwellers and suburbanites, see Gainsborough 2005), and among rural residents, the aim of this study is to document the growing political divide between rural and urban voters.
In this paper I present data on historical presidential voting patterns (1952–2004) to show that the growing divide between rural and urban voters has widened because the North-South sectional cleavage among rural voters has narrowed. In fact, southern rural support of Republican presidential candidates in recent elections has surpassed the support offered by northern rural voters. And in the South, in the 2000 and 2004 elections, rural voters were substantially more Republican than urban voters—a remarkable development in American politics when one considers that southern rural voters were the most loyal Democrats during the history of the one-party Democratic Solid South. Placed in the red state/blue state context in the 2000 and 2004 elections, it is apparent that the polarization of rural and urban voters contributed to lopsided election outcomes in these states, whereas the most competitive states exhibited no rural-urban divide in vote choice. In the 2000 and 2004 presidential elections, rural-urban polarization reached unprecedented levels because of a national surge in the rural Republican vote.
Rural versus Urban and North versus South, 1854–1948
Two of the most historically significant political divisions in American politics concern the role of place: (1) rural versus urban and (2) North versus South.5
The South includes Alabama, Arkansas, Florida, Georgia, Louisiana, Mississippi, North Carolina, South Carolina, Tennessee, Texas, and Virginia—the North is all the remaining states.
In 1854 the Republican Party was born and it was born a sectional party—a northern party whose raison d'être was the opposition of slavery, which had the potential to spread because of the popular sovereignty provision outlined in the recently passed Kansas-Nebraska Act (Gould 2003). The Republican Party came to dominate the North from the outbreak of the Civil War until the end of Reconstruction in 1877. Northerners of native stock, protestant, and primarily rural, formed the base of the GOP.
After Reconstruction, as the Democratic Party regained traction in the North, it grew its base of support from Catholic immigrants who settled in the burgeoning cities fueling the industrial revolution. And even though the 1896 presidential election had the effect of strengthening Republican support among rural and urban dwellers alike, rural areas still cast a larger percentage of Republican votes (Key 1955). In the North, the rural-urban cleavage was widened again at the turn of the twentieth century and especially in the 1928 presidential election, when Al Smith, the urban, Catholic, and “wet” Democratic candidate drew strong support from urban areas while pushing rural areas strongly in favor of Republican Herbert Hoover (Black and Black 1992; Key 1955; 1959).
The election of Franklin Delano Roosevelt in 1932 made the entire nation overwhelmingly Democratic in presidential elections. But presidential elections during the New Deal era (1932–1948) were unique, “the sole period in American history in which the Solid Democratic South coexisted with sustained majorities in the North, thus producing national Democratic landslides” (Black and Black 1992, 48). Yet even at the height of the New Deal, GOP support in the North continued to exhibit a rural-urban cleavage, especially in the Northeast where rural areas were much more Republican than neighboring central cities (Black and Black 1992; Key 1959). In sum, the rural-urban cleavage in presidential voting in the North began not long after the creation of the Republican Party more than 150 years ago. A party whose historical base was comprised of rural northern voters has recently grown even more rural in its base of political supporters through the addition of rural southerners.
The South, defined as the 11 secession states, came out of America's great sectional crisis vanquished, destroyed, and extremely bitter toward the North for its handling of military occupation during the years of Reconstruction (1865–1876). A memorable quote of future House Speaker Sam Rayburn, expresses the depths of opposition to the Republican Party: “I will never vote for the electors of a Party which sent the carpetbagger and the scalawag to the prostrate South with saber and sword to crush the white civilization to the earth” (Black and Black 2002, 41). In the 1890s, when Democrats had reclaimed control of the southern political system, the Democratic Party became a bastion of white supremacy, which used the government's monopoly of force to institutionalize the Jim Crow system of social, economic, and political apartheid (Woodward 2002). As Key ([1949] 1996) argued so convincingly, in the South the Democratic Party was highly fractious at the local and state levels, but the racial question was settled, and at the national level southern Democratic unity on the race issue was absolute.
During the one-party Democratic Solid South (1890s–1948),6
The Democratic Solid South persisted long after 1948 in congressional elections, and state and local contests (see Black and Black 2002), but after 1948, the Republican Party had split the South in presidential elections.
Based on the 1950 census, the rural population was 52% in the South and 31% in the North. In the 2000 census the rural population was 27% in the South and 19% in the North. In 1950 only three southern states were majority urban: Florida, Louisiana, and Texas. By 2000, only Mississippi remained a majority rural southern state (data calculated by the author from the U.S. Census Bureau: www.census.gov).
During the Democratic Solid South, because the Democratic Party was the only game in town, the rural-urban cleavage typically manifested itself in state and local Democratic primaries. In presidential elections, not only was it uncommon for a significant rural-urban cleavage to emerge, but when it did, such as in the 1928 presidential election, rural southerners were more Democratic than urban southerners (Black and Black 1992). Indeed, when there was a presidential election that divided rural and urban southerners, greater Democratic loyalty was consistently exhibited by rural southerners (Black and Black 1992)—the antithesis of the rural-urban cleavage found in the North.8
Rural white southerners were historically the most reactionary with respect to the race issue and thus the Democratic Party became a bulwark against the potential for African-American political empowerment (Key [1949] 1996). Particularly in rural counties in the Deep South where blacks often outnumbered whites, Democratic loyalty among southern whites was the most fervent and the enforcement of the Jim Crow system of segregation was the most severe. During the Solid South, the voting behavior of rural whites confirmed the racial threat hypothesis that posited whites in closest contact with African Americans would respond by voting for candidates who were militant segregationists. Since the demise of the Solid South, and particularly in urban areas of the “New South,” the racial threat hypothesis has been disconfirmed (see Voss 1996).
The 1948 presidential contest dealt a fatal blow to the Solid South in presidential elections because President Harry Truman's pro-civil rights agenda stoked an immediate backlash in the form of the Dixiecrat Revolt (States' Rights Democratic Party). The Dixiecrat movement was an intra-party dispute. The party's presidential candidate, Strom Thurmond, had no intentions of forming an alliance with the GOP, rather the Dixiecrat Revolt was justified as a means to preserve the segregationist principles of the Democratic Party (Frederickson 2001). The most diehard supporters of the States' Rights Democratic Party were rural southerners in the Deep South states of Alabama, Louisiana, Mississippi, and South Carolina.9
In these states the Dixiecrats won the battle to have its party's presidential and vice presidential nominees on the ballot as the official Democratic Party (Frederickson 2001).
In historical perspective, then, the rural-urban cleavage in presidential voting has taken a different form depending on the North-South sectional cleavage. In the North, compared to their urban counterparts, rural voters have consistently been more supportive of the Republican Party. In the South, prior to the 1950s, the rural-urban cleavage rarely manifested itself with respect to vote choice in presidential elections because the Democratic Party reigned supreme. However, in those atypical elections when a southern rural-urban cleavage emerged, rural southerners were more supportive of Democratic presidential candidates.
Of course, the enduring legacy of the Civil War was the forging of a partisan North-South sectional cleavage. Northern voters, no matter urban or rural, have historically been more Republican than southern voters, who, no matter urban or rural, have been overwhelmingly Democratic. By the 2000 and 2004 presidential elections, however, among rural voters, not only did the sectional cleavage narrow, but rural southerners became more Republican than rural northerners. Data on presidential elections from 1952 to 2004 reveal the remarkable evolution of rural-urban voting patterns within the North-South sectional context.
A Rural House No Longer Divided, 1952–2004
It is fortuitous that the American National Elections Studies (ANES) provided a variable to identify a respondent's state for the 1952 presidential election because, with the single exception of 1928, it was the first post-Reconstruction election in which the GOP made considerable inroads in the South. With use of ANES data, the figures presented in this section highlight the changing pattern of political behavior among rural and urban voters in presidential elections from 1952 through 2004.10
In order to account for the sample size for urban and rural voters, see the appendix for a table that shows the statistical significance for correlations between the presidential vote and a voter's location for each presidential election from 1952 to 2004.
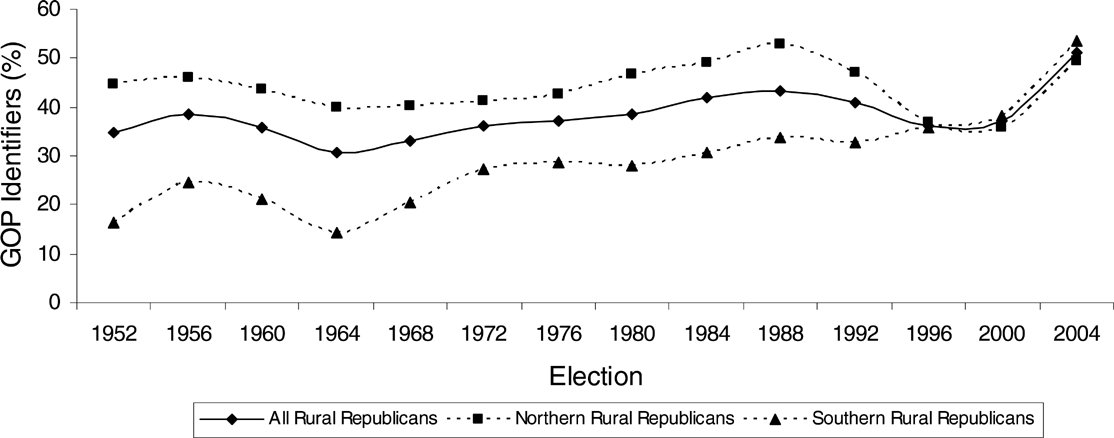
First, because partisanship is an enduring political characteristic usually resistant to sudden alteration (Campbell et al. 1960; Green et al. 2002), the long-term pattern of partisanship shows strong evidence of political change among rural voters. To this end, Figure 1 documents the percentage of rural respondents who identify with the Republican Party11
The percentage of Republican identifiers includes strong Republicans, weak Republicans, and independent Republicans divided by all respondents who classified themselves on the seven-point scale for partisanship.

Rural Republicans by Region, 1952–2004
Note: Data were compiled by the author from the American National Election Studies (ANES) cumulative file (1948–2000), and the 2004 ANES (2000 is the last year that the cumulative file provides prepared data for the Urban/Rural variable). The percentage of Republican identifiers includes strong Republicans, weak Republicans, and independent Republicans divided by all respondents who classified themselves on the seven-point scale for partisanship.
The eye-catching finding in Figure 1 is just how far apart the percentage of rural Republican identifiers is according to region in 1952, contrasted with the confluence of northern and southern rural Republicans in 1996, and finally the upward trajectory of the percentage of all rural Republican identifiers in 2000 and 2004. In 1952, the North-South gap in rural Republican identification was at its widest, 28 percentage points (44.6% Republican for rural northerners, 16.5% Republican for rural southerners). By 2004, the North-South gap in rural Republican identification is just 4 percentage points and now rural southerners (53.6% Republican) are slightly more Republican than rural northerners (49.6% Republican). It must be inconceivable for the oldest generation of southerners to contemplate that a majority of rural southerners are now Republicans. As a result of several factors like party positioning, the impact of the civil rights movement, economic advancement, and generational change (Black and Black 2002; Carmines and Stimson 1989; Green et al. 2002; Shafer and Johnston 2006; Sundquist 1983)—the rise of the Republican Party in the South has closed the partisan divide between southern and northern rural voters. In sectional terms, the rural house is no longer divided, northern and southern rural voters have finally bridged the great North-South gap and are now moving in unison toward the Republican Party.
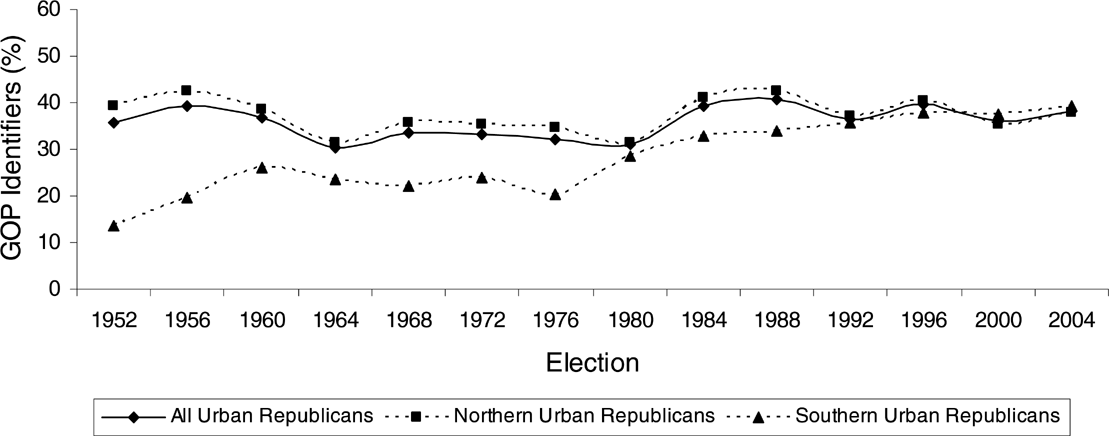
Among urban Republican identifiers, there is also a considerable North-South gap, but it is never as wide as the rural sectional gap. The distance between northern and southern urban Republicans closes briefly in 1980, breaks apart again, and then converges in a lasting way from 1992 onward. Notice that there is no trend in favor of increased Republican identification. According to the data in Figure 2, the national percentage of urban Republicans was 35.7% in 1952 and 38.2% in 2004. By comparison, with the strong movement of rural southerners in favor of the GOP, the national percentage of rural Republicans went from 34.9% in 1952 to 51.1% in 2004.

Urban Republicans by Region, 1952–2004
Note: Data were compiled by the author from the American National Election Studies (ANES) cumulative file (1948–2000), and the 2004 ANES (2000 is the last year that the cumulative file provides prepared data for the Urban/Rural variable). The percentage of Republican identifiers includes strong Republicans, weak Republicans, and independent Republicans divided by all respondents who classified themselves on the seven-point scale for partisanship.
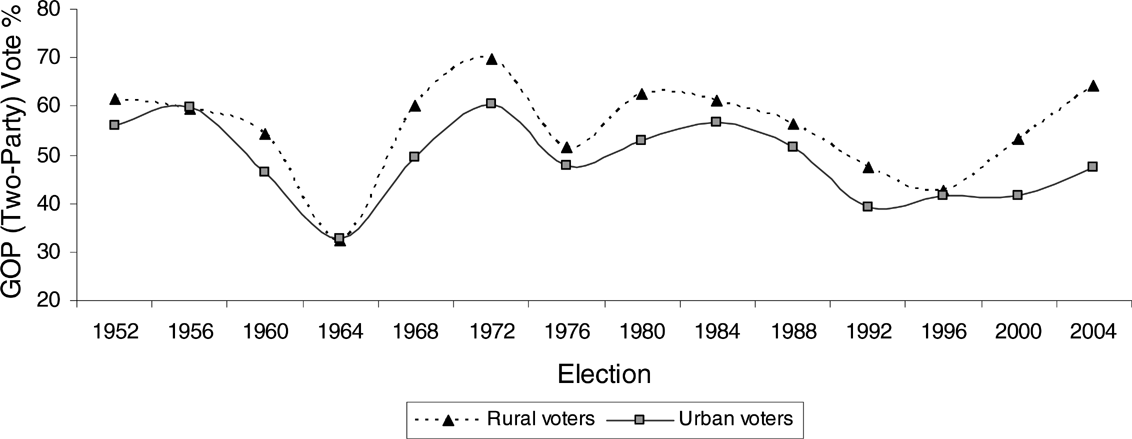
The next three figures document the trend in rural versus urban Republican voting in presidential elections in the nation, the North, and the South, respectively. At the national level, in Figure 3 it is evident that rural voters have consistently cast more Republican votes from 1952 to 2004. The rural Republican vote exceeded the urban Republican vote in every election except for 1956 and 1964. Notice the striking divergence in the rural and urban Republican vote in the 2000 and 2004 elections. Although the rural Republican vote reached its apex in 1972 (69.7%),12
In the North and South, the rural revolt against the Democratic Party in 1972 is not that surprising given the brazen liberalism of Democratic presidential nominee George McGovern.

Rural vs. Urban Republican Presidential Voting, 1952–2004
Note: Data were compiled by the author from the American National Election Studies (ANES) cumulative file (1948–2000), and the 2004 ANES (2000 is the last year that the cumulative file provides prepared data for the Urban/Rural variable).
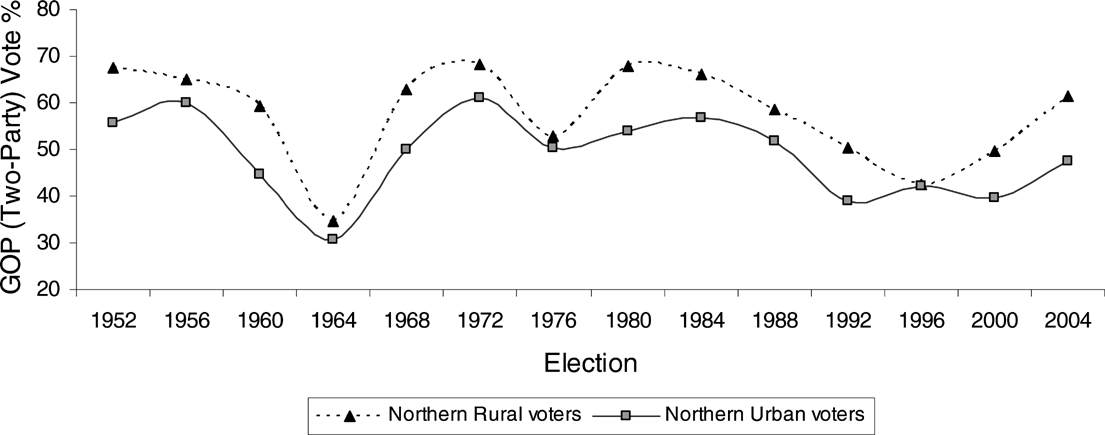
As the next two figures show, the upward movement of the rural Republican vote in the North and South is driving the unprecedented distance between the vote choice of rural and urban voters in the 2000 and 2004 presidential elections. Figure 4 makes it obvious that the historical pattern of a higher Republican vote cast by rural voters is a result of the sizable rural-urban cleavage in the North. Among northern voters, the urban Republican vote never exceeds the rural Republican vote.13
In the 1996 presidential election the rural Republican vote was 42.5% and the urban Republican vote was 42.2%.

Rural vs. Urban Republican Presidential Voting in the North, 1952–2004
Note: Data were compiled by the author from the American National Election Studies (ANES) cumulative file (1948–2000), and the 2004 ANES (2000 is the last year that the cumulative file provides prepared data for the Urban/Rural variable).
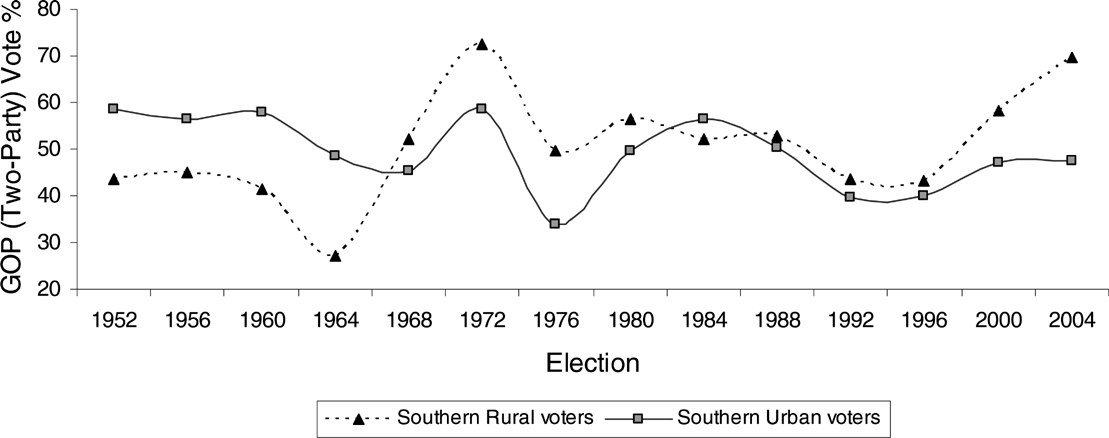
The evolution of the rural-urban cleavage in the South is indicative of the tremendous political transformation the region continues to undergo. Before Richard Nixon honed his “Southern Strategy” in 1968 (Murphy and Gulliver 1971; Phillips 1969), urban southerners were much more supportive of the Republican Party. Before the civil rights movement reached its stride in the 1960s, the economic appeals of the GOP found fertile ground among southerners residing in the rapidly expanding metropolitan centers of the “New South” (see Bartley and Graham 1975; Black and Black 1987; 1992; 2002; Lublin 2004; Shafer and Johnston 2006). From 1968 to 1976, compared to urban southerners, rural southerners were now more supportive of the GOP, and it is no coincidence that the increase in rural Republican support occurred when racial conservatism was openly embraced by Nixon (Black and Black 1992). (See Figure 5.)

Rural vs. Urban Republican Presidential Voting in the South, 1952–2004
Note: Data were compiled by the author from the American National Election Studies (ANES) cumulative file (1948–2000), and the 2004 ANES (2000 is the last year that the cumulative file provides prepared data for the Urban/Rural variable).
In the 1980s, the Republican candidacies of Ronald Reagan and George H. W. Bush garnered roughly equal support among rural and urban southerners. Given the general Republican trend in the South, Clinton's feat of substantially reducing both the rural and urban southern vote in 1992 and 1996 is nothing short of heroic. But the upward surge in the rural Republican vote in the 2000 and 2004 elections is unprecedented. The rural-urban gap in Republican presidential voting in the South reached an all-time high in 2004, at 22 percentage points (69.8% Republican for rural southerners, 47.4% for urban southerners).14
The second largest rural-urban gap in the South was in the 1964 presidential election, but in this case the gap was reversed (48.7% Republican for urban southerners versus 27.2% Republican for rural southerners).
Unlike in the North, where the Republican vote trended upward for both rural and urban voters in 2000 and 2004 (see Figure 4), in the South the urban Republican vote flatlined (47.1% in 2000 and 47.4% in 2004). In addition, consider that in the North the rural Republican vote was 67.5% in 1952 and 61.3% in 2004. The overall downward trend in the rural Republican vote in the North provides a stark contrast to the pattern in the South. In 1952 the rural Republican vote in the South was 43.6% and in 2004 it was 69.8%. Finally, what makes the recent trend in the rural Republican vote in the South all the more impressive is that it now appears that future Republican presidential success may be heavily reliant on rural support—turning the traditional southern rural-urban cleavage on its head.
Placing the Rural-Urban Divide in the Red State vs. Blue State Context
Given all the talk about red states and blue states, how does the contemporary rural-urban divide inform this political discussion?15
See Fiorina et al. (2006) for a more detailed and comprehensive study of the various differences and similarities between red- and blue-state voters in the 2000 and 2004 presidential elections.
American National Election Study, 2000: Pre- and Post-Election Survey (ICPSR 3131), and American National Election Study, 2004: Pre- and Post-Election Survey (ICPSR 4245).
Using the classification scheme presented in Shaw (2007), in the 2000 and 2004 presidential campaigns each major-party candidate has every state coded as either a base state (Democratic or Republican), a lean state (Democratic or Republican), or a battleground state. I collapse these five categories into three, with Democratic base and lean states coded blue, Republican base and lean states coded red, and battleground states coded purple. If there is disagreement on the classification of a state—viewed as a battleground for one candidate and a lean state for the other party—I coded the state purple. In 2000, the blue states are: CA, CT, DC, DE, HI, IL, MA, MD, NJ, NY, RI, and VT; red states are: AK, AL, AZ, CO, GA, ID, IN, KS, KY, LA, MS, MT, NC, ND, NE, NV, OH, OK, SC, SD, TX, UT, VA, and WY; purple states are: AR, FL, IA, ME, MI, MN, MO, NH, NM, OR, PA, TN, WA, WI, and WV. In 2004, the blue states are: CA, CT, DC, DE, HI, IL, MA, MD, NJ, NY, RI, and VT; the red states are: AK, AL, AR, AZ, CO, GA, ID, IN, KS, KY, LA, MS, MT, NC, ND, NE, OK, SC, SD, TN, TX, UT, VA, and WY; the purple states are: FL, IA, ME, MI, MN, MO, NH, NM, NV, OH, OR, PA, WA, WI, and WV.
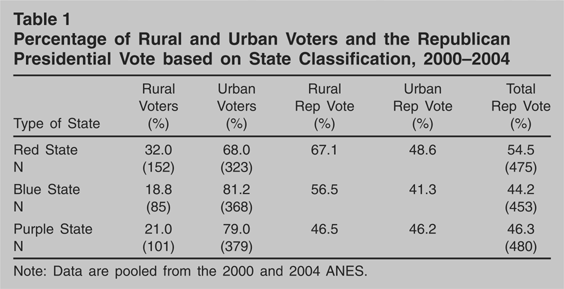
Table 1 presents data on presidential voters in the 2000–2004 elections according to the type of state they resided in, whether they are a rural or urban voter, and the Republican share of the two-party vote. Perhaps it is no surprise that the percentage of rural voters (32%) in red states is significantly higher (p < .05)18
All of the tests of statistical significance based on the data in Table 1 are one-tailed and done by calculating the difference of proportions.
Percentage of Rural and Urban Voters and the Republican Presidential Vote based on State Classification, 2000–2004

A slightly more sophisticated way to assess the influence of place on Republican presidential voting in the red state/blue state context is with the use of multiple regressions. Multivariate analyses will allow us to determine how robust the rural-urban cleavage is when controlling for other factors. Dividing the states into red, blue, and purple (as shown in Table 1), we can now determine if the rural-urban divide persists when estimating the 2000–2004 Republican presidential vote when controlling for region (1 = South, 0 = North), year (1 = 2000, 0 = 2004), and race (1 = African American, 0 = otherwise).
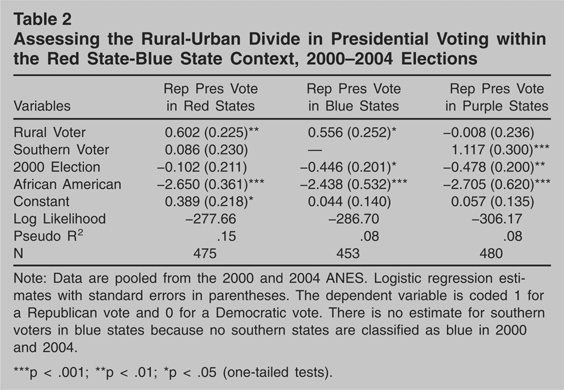
As Table 2 makes evident, after controlling for region, election year, and race, rural voters in red states are decidedly more Republican in their vote choice as compared to urban voters. Notice also that among red-state voters, region has no effect on the likelihood of voting Republican. Among red-state voters in 2000–2004, setting the other variables at their mean values, the probability of voting Republican is .63 for rural voters versus .48 for urban voters. It is also the case in blue states—all of which are located in the North—that rural voters are more likely to vote Republican than are urban voters. For blue-state respondents, setting the control variables at their mean values, the likelihood of voting Republican for a rural voter is .53 versus just .39 for urban voters.
Assessing the Rural-Urban Divide in Presidential Voting within the Red State-Blue State Context, 2000–2004 Elections

Among purple state residents, again we see that the rural-urban divide fails to materialize with regard to vote choice. However, the North vs. South regional cleavage that is not present among red-state voters shows up among purple-state voters. In the most competitive states there is a marked sectional cleavage in vote choice, with voters in southern states much more likely to support the GOP. For purple-state respondents, setting the other variables at their mean values, the probability of voting Republican for southern voters is .68 versus .41 for northern voters. To be sure, in 2000–2004 the vast majority of competitive states were northern (26 out of 30—87%), yet this stark contrast in the voting behavior of southern and northern voters residing in battleground states jibes with the political outcomes in these states. In 2000 and 2004, like all southern states, all four southern purple states were won by the Republican presidential candidate, whereas two-thirds (17 out of 26—65%) of the northern purple states were won by the Democratic presidential candidate.
The simple distinction between rural and urban voters placed in the context of the red vs. blue state framework is additional evidence that the rural-urban divide contributed to massive voter polarization in the last two presidential elections. The higher percentage of rural voters in red states coupled with their strong Republican voting proclivities makes most of these states Republican bastions. By contrast, in blue states the rural-urban split is not quite as large, Republican voting is not as pronounced, and the much lower percentage of rural voters makes most of these states Democratic havens. Finally, it is apparent that in the most competitive states—the purple states—a major reason why these contests are toss-ups is due to the complete absence of a rural-urban voting cleavage.
Conclusion
This research highlights the considerable impact of place on American politics. Its effect is often endogenous because where we live shapes our political attitudes and ultimately our political behavior (Key [1949] 1996). The social networks that exist in rural and urban places are markedly different and this is reflected in the economic, racial, religious, and of course political differences of rural and urban voters (Francia and Baumgartner 2005–2006; Gimpel and Schuknecht 2004). The traditional way of life still exists in most rural settings and the values of these residents provides a sharp contrast with the positions embraced by urbanites (Gimpel and Karnes 2006; Greenberg et al. 2005). Indeed, rural and urban voters live in very different cultures. While it is debatable whether these cultures are at war (Fiorina et al. 2006; Mann 2006), it is not disputed that above or below the Mason-Dixon Line in recent presidential elections the political preferences of rural and urban voters have greatly diverged.
Recent scholarship indicates that as Americans have become more mobile, they have consciously chosen to relocate into communities with politically likeminded neighbors (Oppenheimer 2005). This kind of residential sorting reinforces political similarities within communities and as a result accentuates political differences across dissimilar communities. This finding is of particular importance to the rural-urban polarization exhibited in the 2000 and 2004 presidential elections. Although it is not certain how much the growing political divide between rural and urban voters is attributable to residential sorting, it is now obvious that the narrowing of the North-South sectional cleavage among rural voters has magnified the rural-urban gap.
It is hard to overstate the historical significance of the 2000 and 2004 presidential elections. Despite the decline in the rural percentage of the American electorate,19
According to the ANES data, the rural percentage of the two-party presidential vote was 37.9% in 1952, 31% in 2000, and only 19% in 2004.
Because the overwhelming Republican vote cast by rural residents in 2000 and 2004 was of course given to one candidate, George W. Bush, it remains to be seen whether the same degree of rural support will transfer to the Republican nominee in 2008. At the time of this writing there is no prohibitive presidential favorite for either party, but rural voters will have a disproportionate amount of influence in the early primaries because of a large share of rural residents in these states (i.e., Iowa, New Hampshire, Michigan, and South Carolina). Compared to the leading Democratic contenders (Obama, Clinton, and Edwards), it appears that the GOP has a decided advantage with a stable of candidates (Huckabee, Romney, and Thompson) who possess the conservative credentials so enticing to rural voters. Putting aside 2008 presidential speculation, one thing is now clear. George W. Bush came to power averring that he was “a uniter, not a divider,” but by uniting rural voters, President Bush greatly divided the nation.
Author Bio
Seth C. McKee is assistant professor of political science at the University of South Florida St. Petersburg. His published research focuses on voting behavior, southern politics, political parties, and redistricting. He is the author of the forthcoming book, Republican Ascendancy in Southern U.S. House Elections (Westview Press). He can be reached at: scmckee@stpt.usf.edu.
Appendix
Correlations of the Presidential Vote with Voter Location, 1952–2004