I. Introduction
A study published in this journal, Wang and Prešern (Reference Wang and Prešern2018, hereafter W&P), tried to analyze the effects of training on blind wine tasting accuracy. In this article, Section II summarizes their data collection and analysis methods, Section III points out and addresses one issue with their analysis that is easy to address, Section IV then discusses another issue, which is more difficult and perhaps impossible to address, given the design of their study. Section V concludes by suggesting new, redesigned studies are needed to identify the effects of training on blind wine tasting accuracy.
II. W&P's Study
According to W&P, they recruited 23 students from Oxford University to participate in up to 18 training sessions over a five-week period (W&P, Reference Wang and Prešern2018, p. 386). The training sessions were run under the auspices of the university's blind wine tasting society (W&P, Reference Wang and Prešern2018, p. 384) and occurred in early 2018 before an annual blind wine tasting competition against students from a rival university's blind wine tasting society (W&P, Reference Wang and Prešern2018, p. 385). The sessions were ostensibly training students for that competition (W&P, Reference Wang and Prešern2018, pp. 384–385), although only a handful of students from each university could represent their school in the competition (Quandt, Reference Quandt2018, p. 108), so not all students who were recruited would have ultimately been able to compete.
Some of the recruited students had participated in the blind wine tasting society and competition in previous years. They were “returning team members,” to use W&P's phrase (Reference Wang and Prešern2018, p. 386). Others were new to wine tasting (W&P, Reference Wang and Prešern2018, p. 386). Exactly how returning students were retained and new students were enticed is unclear from W&P's article. Besides a chance to represent their university in a blind wine tasting competition, there may have been other reasons why students attended one or more sessions. They may, for example, have wanted to learn more about wine, develop their palates, or simply drink some wine.
As part of each session, students in attendance tasted several wines in a blind fashion (or masked fashion, to use the more politically-correct phrase). They tasted as few as 10 and as many as 12 wines per session (W&P, Reference Wang and Prešern2018, p. 386).Footnote 1 For each wine, they guessed several attributes, including the dominant grape variety, country, region, and vintage.Footnote 2 Their individual guesses were recorded, creating a panel dataset that could be used to try to study the effect of training on blind wine tasting accuracy.Footnote 3 The panel dataset is unbalanced because not all students attended all sessions, as discussed in more detail later.
To try to assess the accuracy of guesses about wine attributes, W&P analyzed their data as follows. They restricted their analysis to the 15 students who attended at least eight of the 18 sessions.Footnote 4 Their article did not offer a justification for why they restricted their analysis to a subset of students, except that they chose to do so (W&P, Reference Wang and Prešern2018, p. 386). No further justification was offered when they presented their study at a conference, except that not all students attended all sessions (Wang, Reference Wang2018). For brevity, I will hereafter refer to those 15 students as the “subset of students.”
Next, for each wine attribute and each training session, W&P calculated what they called the “average number of correct answers” for guesses about a given attribute (such as grape variety) for the wines at a given session (W&P, Reference Wang and Prešern2018, p. 386). W&P calculated that average across any students who were in the subset of students and in attendance at a given session. That is to say, they calculated it as the total number of correct guesses of a given attribute by any student in the subset who attended a given session, on the one hand, all over the total number of students in the subset who attended the given session, on the other hand. The maximum possible value of that statistic is the number of wines tasted at a session.Footnote 5
Finally, for each wine attribute, they examined whether there was an association between the “average number of correct answers” at a session and the total number of days that had passed since the first training session. The text of their article examined that association using Pearson's product-moment correlation coefficient (see sec. 2.B. of their article).Footnote 6 If there was a positive correlation, W&P took that as evidence that training improved accuracy (W&P, Reference Wang and Prešern2018, p. 388). They reported there was a positive correlation for only one of the four attributes, specifically, grape variety. For that attribute, the size of the correlation was 0.21, according to W&P (Reference Wang and Prešern2018, p. 388). That correlation is positive, but not statistically significantly different than zero at conventional levels (p-value = 0.40).Footnote 7 That correlation is also small, at least according to Cohen's (Reference Cohen1992) rules of thumb for interpreting the effect size of a Pearson correlation coefficient.Footnote 8
Although it is not the focus of this article, I can parenthetically note I was unable to exactly replicate the Pearson correlation coefficients reported by W&P when using the dataset they provided for replication purposes. For the grape variety attribute, I found a correlation of 0.24, which is not exactly the same as the 0.21 they reported, but it is similar, still not statistically significant at conventional levels (p-value = 0.33), and still small according to Cohen's rules of thumb. For the country, region, and vintage attributes, I found correlations of −0.11, −0.10, and + 0.07, respectively. They reported correlations of −0.01, −0.02, and −0.16, in contrast. My failure to replicate (or “verify” to use Clemens’ (Reference Clemens2017) proposed parlance) could be due to the fact that W&P reported recruiting 23 students (W&P, Reference Wang and Prešern2018, p. 386), yet the dataset they provided was for only 22 students. It is unclear whether W&P's results were based on 22 students and, if so or if not, what happened with the 23rd student in the real world or in their dataset. That said, W&P's results and my attempted replication yield a similar conclusion: Grape variety is the attribute with a Pearson correlation coefficient that is closest to being (though still not) significantly positive.
If it is momentarily assumed their analysis reveals the effect of training on blind wine tasting accuracy, then it seems that training has little, no, or even negative effects on accuracy. Those small benefits came at a large cost. The cost of the bottles of wine used for the 18 training sessions was about £3,250 in total.Footnote 9 The cost of the sessions was even larger after accounting for other explicit costs (which could have included the cost of space in which to conduct the trainings, glassware, palate cleansers or any other food served along with the wines, etc.) and the opportunity costs of the time of the trainees and trainers. Each session lasted around two to three hours (Wang, Reference Wang2018).
III. One Issue
Whether W&P's study reveals the effect of training on accuracy is unclear because of two issues with their study. One of those issues, which is the focus of this section, is that any association between the passage of calendar time and the “average number of correct answers” cannot be conflated with any association between training and accuracy. They cannot be conflated for the following three reasons.
First, the number of wines tasted per session varied, so the above-defined “average number of correct answers” per session would have varied for reasons unrelated to the accuracy of students’ guesses. The variation in the number of wines per session was at most only two wines, yet that variation nevertheless introduces spuriousness to W&P's preferred measure of accuracy.
Second and more seriously, different sessions had different wines. Those wines may have differed in terms of the ease or difficulty with which students of any given level of expertise could have identified the wines’ attributes. If the training regimen started with relatively easy wines before advancing to more difficult ones, then a time trend to the “average number of correct answers” per session would not necessarily be expected; it would only be expected that any students who missed earlier training sessions would tend to be less accurate if those sessions were actually training students to be more accurate. Even if there was not a time trend to the difficulty of the wines tasted, anytime students tended to correctly (or incorrectly) identify a wine's attribute, regardless of the amount of prior training they had received, then that reveals more about the ease (or difficulty) of identifying that wine's attribute rather than any effect of training.
Third and perhaps most seriously, different students attended different sessions. Those students may have differed in terms of their time-invariant ability to identify wine attributes; for example, any returning team members who had already achieved their peak performance should have done consistently better than any unmotivated students who were simply there to drink some wine. Students definitely differed in terms of the number of previous training sessions they had attended; there was no session (except the first one) in which all the participants at the session had attended the same number of prior sessions that year, even among W&P's subset of 15 students. Whether or not additional training led to a time-varying ability to identify wine attributes is the crucial question. To the extent different students had different time-invariant abilities and/or time-varying abilities, the “average number of correct answers” for a session would have depended on which students showed up to that session.
For those three reasons, it is unclear whether W&P's analysis reveals the effect of training on accuracy. Yet the fact that students with different amounts of training attended some of the same sessions and tasted some of the same wines introduces the possibility of using W&P's data to identify the effects of training on accuracy. If attendance at sessions was random, then for any given attribute, the effect of training on the probability that a student correctly identified that given attribute of a wine could be estimated by running a regression such as the logit regression

where i indexes participants, s indexes sessions, w indexes the wines, p isw is the probability that the i-th participant who attended the s-th session correctly identifies the given attribute of the w-th wine tasted at that session, n is is the number of previous sessions that the i-th participant attended as of the s-th session, β is the associated logit coefficient, X is any additional covariates, and ε isw is assumed to be white noise. To address the above-noted issues with students potentially having time-invariant abilities and wines potentially having taster-invariant ease or difficulty of identification, participant-specific and wine-specific fixed effects can be added as covariates. Of note, if attendance at sessions was non-random, then the estimated β coefficient would generally not be the true effect of training on accuracy, which is a point I will return to in the next section but ignore for now.
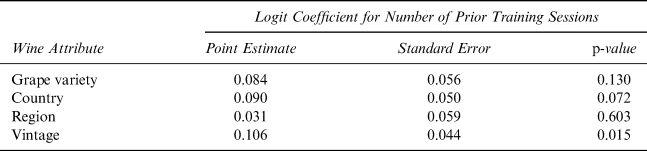
Results for the regression in Equation (1) applied separately to each wine attribute are reported in Table 1. The nonlinear nature of the logit model (or any model of probabilities that is not a linear probability model) means the estimated β coefficient cannot be directly interpreted as the estimated marginal effect of a training session. However, for a logit model, the maximum possible marginal effect of a continuous variable is always one-fourth of the variable's corresponding coefficient (see, e.g., Ronek Reference Ronek1991, p. 515). To be clear about the sense in which that is the maximum, for the logit regression in Equation (1), the marginal effect of a change in n is on the probability p isw can be expressed as

That expression reaches its maximum when p isw is one-half or, equivalently, p isw(1 – p isw) is one-fourth. For probabilities higher or lower than 50%, the marginal effect is smaller (Ronek, Reference Ronek1991). Using that one-fourth rule for interpreting the coefficients assures that the effects implied by the regression results could not be understated and could only be overstated.
Logit Regression Results

Note: This table shows, for the logit regression in Equation (1) applied separately to each of the four wine attributes, the estimated β coefficient on the number of prior training sessions. Participant-specific and wine-specific fixed effects were included for each regression. The standard errors were cluster robust with clustering by participant.
The results in Table 1 and the one-fourth rule imply that that one additional training session has the following effects. There is at most a 2.1% increase in the probability of identifying a wine's dominant grape variety (se = 1.4, p-value = 0.13), a 2.2% increase for its country of origin (se = 1.2, p-value = 0.07), a 0.8% increase for its region (se = 1.5, p-value = 0.60), and a 2.7% increase for its vintage (se = 1.1, p-value = 0.02).
In terms of the statistical significance of those effects: None are significant at the 1% confidence level; only one (for vintage) is significant at the 5% confidence level; and another (for country) is significant at the 10% confidence level.
In terms of their substantive significance: If the probability of correctly identifying an attribute of a wine is essentially zero, then any non-zero increase in the probability could be considered non-trivial. Of course, in that case, training would only raise the probability from a trivial to slightly less trivial value. The more optimistic someone is about how well blind tasting should work, the smaller the effects of training appear.Footnote 10 Also recall that the above-estimated effects are the maximum possible ones; the effects would generally be smaller.
In summary, the regression results suggest that, if a student attended one of the two- to three-hour training sessions in which they tasted 10 to 12 wines that cost an average of about £15 per bottle, then they would see at most around a 2% increase in their probability of identifying a given attribute of a wine. From that, one could justifiably conclude that, if training works, it does not seem to work well because its benefits are small and its costs are large. Even that conclusion may be overly charitable, however, due to another issue with W&P's study to which I now turn.
IV. The Other Issue
Variation in the amount of training students received introduces the possibility of identifying the effect of training, yet if that variation was non-random, then the estimates presented earlier would generally not be the true effects of training. The question then becomes whether assignment to training sessions was random and, if not, what if anything can be done about it?
W&P's article does not explain why some students attended more sessions than others. In personal correspondence, the authors explained that it was up to students whether they attended a session or not; the only qualification was that not all of the students could be accommodated at some sessions, so space was sometimes allocated on a first come, first served basis (personal correspondence with Qian Wang on June 4, 2019). The students who participated in a training session were therefore motivated to not only show up to that session, but also show up before spaces filled up. Another potential qualification, pointed out by Wang (Reference Wang2018), is that some students missed sessions because of exams and illness. Those factors seem somewhat beyond a student's control, although students with enough motivation would attend sessions in spite of such things. Unmotivated students would fail to attend when more minor forces impinged upon them. Thus, at least generally speaking, students who attended more sessions self-selected into doing so.
When self-selecting into (and out of) attendance, students made different choices. Their records of attendance can be summarized as follows. The vast majority of students recruited to the study started towards the beginning of the 18 sessions. Specifically, 20 of the 22 students for whom data are available attended at least the first session (on Saturday, January 13, 2018) or one of the three sessions the week after that. For the other two students, one did not attend until the fifth session in the second week (on Friday, January 26th) while another did not attend until the 12th session in the second-to-last week (on Wednesday, February 7th).
Although almost all of the students started at the beginning, many and possibly most did not make it to the end. Three students never showed up again after attending the first session. Five students were no-shows after the 13th session in the second-to-last week of training. Six students did not show up to any of the four sessions in the last week. Ten students did not show up to either of the last two sessions (which were on a Friday and Saturday). And 12 students did not show up to the final session. Attrition cannot be definitively distinguished from irregular attendance, but it appears that more than one-quarter of their subjects (i.e., 6 of the 22) dropped out by the last week and up to 55% (i.e., 12 of the 22) dropped out by the last session. A rule-of-thumb for studies is that, if the attrition rate is greater than 20%, results may be unreliable (Schulz and Grimes, Reference Schulz and Grimes2002, p. 784). Some journals refuse to publish studies with attrition rates higher than that (Schulz and Grimes, Reference Schulz and Grimes2002, p. 784).
Regardless of whether students were dropping out of the study or simply showing up irregularly, by the end of the 18 sessions, two students had attended all 18, three had attended only one (the first one), and the average number of sessions attended per student was about 10 with a standard deviation of about six.
Such self-selection into treatment is not unique to W&P's study. The conventional approach to try to address that is the instrumental variables (IV) approach. For W&P's study, applying an IV approach would require at least one variable that affects whether a student attends a session, but does not affect whether a student at the session correctly identifies the wines. If such a variable could be found, then it could be used to try to control for self-selection.Footnote 11 However, suitable variables are often difficult or impossible to find. Even if a variable proves to be strongly associated with treatment, it cannot be proven or disproven that the variable only affects the outcome of interest through its effect on treatment. The extent to which a potential IV seems agreeable or disagreeable can therefore be based on the extent to which the conclusions it yields seem agreeable or disagreeable. The conclusions offered by IV approaches are also often neither very robust nor very different from the conclusions offered by more naive approaches, as Young (Reference Young2019) has recently shown.
Here I will not attempt to find an agreeable IV or otherwise control for self-selection because there is no obvious way to do so.Footnote 12 Instead, I will consider the possible consequences of self-selection on the estimates presented earlier. Those estimates could be biased downwards, understating the true effect of training on accuracy. If training eventually yields diminishing returns, and if students who self-selected into the study and into more training sessions were already past the point of diminishing returns, then a more representative group of people may have seen bigger gains. Some students in W&P's study had already been trained in previous years, as noted earlier.
Yet even if it is accepted for the sake of argument that some students with the strongest attendance may have already reached a point of diminishing returns to training, there are reasons why the estimates presented earlier could be biased upwards, overstating the true effect of training on accuracy:
(1) Although a less experienced group of people may have had more potential to improve their accuracy (if only by learning some grape varieties, countries, regions, or vintages to guess), they may not have had as much motivation to achieve that potential as the students who self-selected into stronger attendance. Those students were obviously highly motivated to attend more sessions and presumably highly motivated to improve their accuracy.
(2) If students who were new to blind wine tasting joined W&P's study because they hoped to eventually represent their university in the blind wine tasting competition, then whether they were making progress towards that goal or not could have determined whether they continued to show up to the sessions or not. Students who did not demonstrate large gains may have been disabused of the notion that they would be able to compete. If those students stopped showing up, and if only newer students with larger gains kept showing up, then the estimated effects of training would be biased upwards.
(3) If new or returning students joined W&P's study because they hoped to develop or continue to develop their ability to accurately guess the attributes of a wine (independent of whether they hoped to compete in the competition), then students who saw negative, no, or small gains from the training sessions would justifiably stop showing up. The sessions were costly to students, if only in terms of their time and energy. If the benefits did not outweigh the costs, they should stop going. Only those with large enough gains would continue to attend sessions, again biasing the estimated effects of training upward.
(4) Students who self-selected into attending more training sessions presumably self-selected into training between sessions. Indeed, when the captain of Oxford University's blind wine tasting team was interviewed on a sports show, he was shown training in his home (Real Sports with Bryant Gumbel, 2019). The authors of W&P also revealed in personal correspondence that they organized more than 18 tastings in early 2018, but only 18 were accounted for in their study because the other tastings involved wines that were somehow unlike the ones likely to show up in the interuniversity competition (personal correspondence with Qian Wang on June 5, 2019).Footnote 13 Students who showed up to more of the 18 training sessions presumably showed up to more of those other tastings, too. The above-presented estimates of the effect of one of the 18 training sessions could therefore be overstating their effect, conflating it with the effects of the other sessions organized by W&P and independent training. The cost of obtaining those benefits would be understated without accounting for the cost of that additional training.
V. Conclusion
This article focused on two issues with W&P's study. The first issue relates to the fact that, when W&P analyzed their data, they conflated the passage of calendar time with the amount of training received by participants. Those cannot be conflated because, for any given session, participants in attendance had received different amounts of training. By the end of the study, in particular, some participants had received as much training as possible by attending all 18 sessions, others received the minimum required to be considered part of the study by showing up to only one session, and as much as slightly more than one-half the participants (again, 55%) had stopped attending sessions.
The second issue also relates to W&P's data analysis, in some sense, yet in a more fundamental sense, it is an issue with the design of their study. The amount of training received by participants was non-random because participants self-selected into (and out of) attendance. Such self-selection into treatment is not unique to W&P's study, but they did not address it in the design of their study or analysis of their data. I made no attempt to address selection in my analysis of their data, either, given there is no obvious way (at least to me) to do so. I did, however, estimate the effect of training on accuracy without controlling for self-selection, found it to be small, and argued that self-selection may bias the estimated effect upward, so the actual effect may be smaller still. I also argued those small benefits came at a large cost.
Overall, further work is needed to address whether there is an effect of training on accuracy and, if so, whether it is big or small, cheap or costly, and so on and so forth. Further reanalysis of W&P's same dataset could be undertaken, perhaps, although the search for variables to use as part of an IV or similar approach may prove fruitless. New studies better designed to address the questions W&P (Reference Wang and Prešern2018) tried to address may be needed.
A potential experimental design is as follows. People cannot be forced to participate in a blind wine tasting, so there will always be self-election to some extent. Yet a tasting could be held in which participants are randomly assigned to either a treatment group that is trained or a control group that is not. W&P's article did not describe exactly how they used their tastings to train students, but part of the training presumably involved telling students the true attributes of each wine they tasted. A modified version of that approach would be to hold a session that begins with a blind wine tasting during which participants try to guess the wines’ attributes. The treatment group would then be informed of the true attributes of each wine. To conclude the session, another blind wine training would be conducted during which participants again try to guess wines' attributes (perhaps from a list of possible alternatives so that everyone is guessing from the same universe of possibilities). If one such session has no detectable effects, then the effect of multiple sessions could be studied, although as I argued in this article, if participants are attending on an irregular basis or dropping out altogether, then it cannot be presumed they are randomly doing so.
Supplementary Material
For supplementary material accompanying this paper visit https://doi.org/10.1017/jwe.2019.25.