I. INTRODUCTION
The concept of plasma-based physical vapor deposition (PVD) is today widely used for depositing thin films. PVD is a general term describing how films are deposited by the condensation of a vaporized form of a material onto any surface. The vapor of the thin film material is created by physical means from a solid deposition source. One such PVD method is sputter deposition,Reference Ohring1 which has proven to be a robust and upscalable coating method. The most commonly used tool for sputter deposition is magnetron sputtering,Reference Penning2, Reference Thornton, Penfold, Vossen and Kern3 which essentially is a diode sputtering configuration where a magnet pack is placed behind the target (cathode) to better confine the plasma close to the sputtering region.
High-power impulse magnetron sputtering (HiPIMS) or sometimes referred to as high power pulsed magnetron sputtering (HPPMS) introduced by Kouznetsov et al.Reference Kouznetsov, Macák, Schneider, Helmersson and Petrov4 in 1999 is a promising technique for improving magnetron sputtering by the addition of pulsed power technology.Reference Helmersson, Lattemann, Bohlmark, Ehiasarian and Gudmundsson5 To distinguish this technique from other pulsed magnetron processes, we use a similar definition as that of AndersReference Anders6: HiPIMS is pulsed magnetron sputtering, where the peak power exceeds the time-averaged power by typically two orders of magnitude. In addition, the HiPIMS technology has recently been industrially upscaled by several big coating companies under various acronyms, which is a promising first step toward implementing it in common thin film processes. The interest of this technique has thus increased tremendously during the last 10 years, also shown by the steady increase of publications, reaching about 50 peer-reviewed scientific articles published in 2010 according to ISI Web of Science.
The main feature of HiPIMS is the combination of sputtering from standard magnetrons using pulsed plasma discharges, where the aim is to generate a highly ionized plasma with large quantities of ionized sputtered material.Reference Bohlmark, Lattemann, Gudmundsson, Ehiasarian, Aranda Gonzalvo, Brenning and Helmersson7 The high degree of ionization of the sputtered species has been shown to lead to the growth of smooth and dense elemental filmsReference Samuelsson, Lundin, Jensen, Raadu, Gudmundsson and Helmersson8 as well as reactively deposited compound filmsReference Sittinger, Ruske, Werner, Jacobs, Szyszka and Christie9, Reference Lattemann, Helmersson and Greene10 and enable control over their phase composition,Reference Konstantinidis, Dauchot and Hecq11 microstructure,Reference Alami, Eklund, Andersson, Lattemann, Wallin, Bohlmark, Persson and Helmersson12 as well as mechanicalReference Paulitsch, Mayrhofer, Mitterer, Münz and Schenkel13 and opticalReference Sittinger, Ruske, Werner, Jacobs, Szyszka and Christie9, Reference Konstantinidis, Dauchot and Hecq11 properties. It has also been reported to be beneficial in terms of improving film adhesion,Reference Ehiasarian, Wen and Petrov14 enabling deposition of uniform films on complex-shaped substrates,Reference Alami, Persson, Music, Gudmundsson, Bohlmark and Helmersson15, Reference Aijaz, Lundin, Larsson and Helmersson16 and having a decreased deposition temperature.Reference Wallin, Selinder, Elfwing and Helmersson17 In summary, it is clear that the perspective of having advantages like the ones mentioned above is more than enough reason to continue developing new ionized sputtering techniques such as HiPIMS.
In this review, we have chosen to focus on the differences in process conditions as well as resulting thin film characteristics between HiPIMS and commonly used industrial PVD techniques, such as direct current magnetron sputtering (DCMS), radio frequency (RF) magnetron sputtering, and cathodic arc evaporation. The aim has been to provide a good introduction to this novel technique for PVD process engineers and researchers on thin films, who are familiar with the sputtering basics, without any claims on completely covering the whole field of HiPIMS. More details on the fundamentals and applications of HiPIMS can be found in the review articles by Helmersson et al.,Reference Helmersson, Lattemann, Bohlmark, Ehiasarian and Gudmundsson5 Sarakinos et al.,Reference Sarakinos, Alami and Konstantinidis18 and Anders.Reference Anders6 Furthermore, it should also be brought to the readers’ attention that parts of the current review concerning thin film processing are based on a recent review paper by Sarakinos et al.Reference Sarakinos, Alami and Konstantinidis18 Moreover, in this work, much attention has been paid to different industrially relevant material systems owing to the fact that they are after all the ultimate goal of any thin film deposition process.
II. PROCESS CONDITIONS
A. How to create a highly ionized discharge
In glow discharge processes such as magnetron sputtering, it is often difficult to achieve a large fraction of ionized sputtered material reaching the substrate.Reference Christou and Barber19–Reference Konstantinidis, Ricard, Ganciu, Dauchot, Ranea and Hecq21 When the deposition flux consists of more ions than neutrals, the process is referred to as ionized PVD or IPVD.Reference Helmersson, Lattemann, Bohlmark, Ehiasarian and Gudmundsson5 There are a few different IPVD techniques available today, such as postvaporization ionization using a secondary plasma generated by, for example, an RF coil placed in the deposition chamber to create ions that can be accelerated to the substrate surface when applying a negative bias.Reference Nouvellon, Konstantinidis, Dauchot, Wautelet, Jouan, Ricard and Hecq22 Another technique is the previously mentioned cathodic arc evaporation (see references Reference Johnson, Vossen and Kern23 and 24), which uses the fact that very localized, extremely high current discharges can create a dense plasma resulting in a high degree of ionization around a particular spot. A third possibility is the use of hollow cathode magnetron sputtering.Reference Wang and Cohen25, Reference Klawuhn, D’Couto, Ashtiani, Rymer, Biberger and Levy26 The hollow cathode traps electrons in a hollow cylinder or between two parallel plates. It works like two electrostatic mirrors reflecting electrons between the sheaths until they are thermalized through collisions, thus increasing the plasma density and the probability of ionizing any material passing through.Reference Söderström27
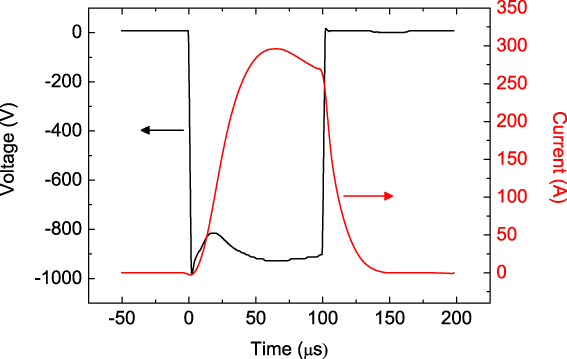
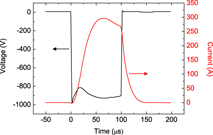
Another approach to IPVD is to use HiPIMS, which is the focus of the present review. HiPIMS can be set up on a conventional magnetron sputtering system by changing power supplies making it possible to deliver high power pulses to the magnetron in the range of a few kilowatts per square centimeter while keeping the time-averaged power on a DCMS level of typically watts per square centimeter to avoid damaging the magnetron.Reference Sarakinos, Alami and Konstantinidis18 Such a HiPIMS discharge pulse is shown in Fig. 1. The length of the pulse is often kept in the range 10–500 μsReference Konstantinidis, Dauchot, Ganciu, Ricard and Hecq28, Reference Lundin, Brenning, Jädernäs, Larsson, Wallin, Lattemann, Raadu and Helmersson29 with a pulse frequency from tens of hertz to kilohertz.Reference Helmersson, Lattemann, Bohlmark, Ehiasarian and Gudmundsson5, Reference Wallin and Helmersson30 The applied voltage during the pulse in most HiPIMS processes is usually around 500–1000 V, and the peak current density (peak discharge current/target area) reaches at most a few amperes per square centimeter (see Ref. Reference Alami, Sarakinos, Uslu and Wuttig31).
Voltage and current characteristic for a typical high-power impulse magnetron sputtering (HiPIMS) discharge pulse. This discharge was generated using a 6’’ Cu target at 1.33 Pa Ar pressure. The peak current density is about 1.6 A cm−2.

B. Plasma conditions
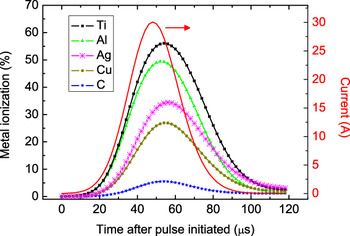
The mechanism of transferring a process gas to a HiPIMS plasma can be seen as the analog of dielectric breakdown in an insulating solid, where the dielectrics will start conducting current at a critical voltage. In the case of the process gas it starts with free electrons, caused by background radiation or thermal energy, being accelerated toward the anode (chamber walls or the ground shield of the magnetron) by an electric field, created by the voltage difference applied between the cathode (target) and anode. The accelerated electrons will gain energy and eventually collide with neutral gas atoms, which in some cases will lead to ionization and the release of two free electrons per ionized atom (electron impact ionization). These two electrons can now collide with two other neutrals, whereas any gas ion present will be accelerated and collide with the cathode releasing, among other particles, electrons (referred to as secondary electrons). Eventually, this process leads to the breakdown of the process gas resulting in a plasma. Through the use of very high applied instantaneous power densities to the magnetron, there will be a tremendous increase of charge carriers in front of the target during the HiPIMS pulse. In numbers this means that for the HiPIMS discharge, the electron density in the ionization region close to the target surface is on the order of 1018–1019 m-3.Reference Gudmundsson, Sigurjonsson, Larsson, Lundin and Helmersson32, Reference Bohlmark, Gudmundsson, Alami, Lattemann and Helmersson33 For an electron density around 1019 m-3, the ionization mean free path of a sputtered metal atom is about 1 cm, whereas for an electron density of 1017 m-3, commonly observed in a DCMS discharge, the ionization mean free path is ∼50 cm for typical discharge conditions.Reference Gudmundsson34 Thus, given the high electron density in the HiPIMS discharge a significant fraction of the sputtered material is thereby ionized, which also has been verified in a great number of publications.Reference Kouznetsov, Macák, Schneider, Helmersson and Petrov4, Reference Vlcek, Kudlacek, Burcalova and Musil35–Reference Macák, Kouznetsov, Schneider, Helmersson and Petrov37 Worth pointing out is that there are substantial differences in the degree of ionization of the sputtered material depending on what target material is used (from a couple of percent to almost fully ionizedReference Bohlmark, Alami, Christou, Ehiasarian and Helmersson36, Reference DeKoven, Ward, Weiss, Christie, Scholl, Sproul, Tomasel and Anders38). The reason for this behavior is mainly related to the fact that the ionization potential is material dependent and for metals used in magnetron sputtering commonly found in the range E IP = 5.99 eV (Al) to E IP = 11.26 eV (C), meaning that Al is more easily ionized than C. In plasma discharge modeling by both HopwoodReference Hopwood and Hopwood39 and Samuelsson et al.,Reference Samuelsson, Lundin, Jensen, Raadu, Gudmundsson and Helmersson8 these trends are clearly shown and in Fig. 2, one such example is illustrated for HiPIMS using a 100 μs discharge pulse of −880 V and 30 A peak current (corresponding to a peak current density of about 1.5 A cm−2). As a reference, for DCMS discharges the degree of ionization is found to be 5% or less.Reference Hopwood and Hopwood39, Reference Rossnagel and Hopwood40 Further discussions on the impact of a high degree of ionization of the sputtered material on the thin film growth will be given in Section III. Before continuing, a word of caution should be given regarding ionization, since there is occasionally some misunderstanding concerning reported values of the ionization of sputtered material, which often has to do with the fact that the degree of ionization of sputtered material (in the plasma), ni/(ni + nn), is not of the same value as the ionized flux fraction (flux of material reaching the substrate), Γi/(Γi + Γn). This is because the ion flux is governed by the electron temperature, T e, and the neutral flux by the gas temperature, T g. For partially ionized plasma discharges, such as the HiPIMS discharge, T e is often significantly larger than T g (in HiPIMS the dense process gas, n Ar ∼ 1020 m-3, is far from being completely ionized thus affecting T g). This means that the ion flux fraction is larger than the degree of ionized metal and therefore it is not uncommon to find that although the degree of ionization only reaches about 50%, the ionized flux fraction at the substrate can be more than 90%.Reference Samuelsson, Lundin, Jensen, Raadu, Gudmundsson and Helmersson8
A comparison of the evolution of the degree of metal ionization for different target materials from a global plasma model. The discharge current peaks at about 30 A at ∼50 μs into the pulse (the peak current density is about 1.5 A cm−2). A 100 μs square voltage pulsed of −880 V was used in the modeling (from Samuelsson et al.Reference Samuelsson, Lundin, Jensen, Raadu, Gudmundsson and Helmersson8 with permission from Elsevier).

The HiPIMS plasma has also shown the presence of multiply charged ions for various target materials,Reference Bohlmark, Lattemann, Gudmundsson, Ehiasarian, Aranda Gonzalvo, Brenning and Helmersson7, Reference Vlcek, Kudlacek, Burcalova and Musil41–Reference Andersson, Ehiasarian and Anders44 which is rarely found in other types of magnetron discharges but often found in cathodic arc discharges.Reference Rosén, Anders, Mráz and Schneider45 One implication of having this type of ions is that they enable sustained self-sputtering,Reference Anders6 meaning that they will sputter enough material for continued ionization and release enough secondary electrons to keep the plasma burning assuming that enough sputtered metal ions can be attracted back to the target. For high yield materials such as Cu this has led to the onset of self-sputtering regimes characterized by a second increase of the discharge current beyond the value of the initial peak current, if the pulse is sustained for a long enough time in combination with high negative discharge voltages.Reference Anders, Andersson and Ehiasarian43, Reference Anders46 The singly ionized sputtered atoms cannot contribute to this process, since they often do not exceed the ionization energy threshold required for the release of secondary electrons into the plasma. This has led to the possibility that HiPIMS processes can be run without the use of a process gas, which opens up the field of ultraclean sputtering.Reference Andersson and Anders47 Having multiply charged ions in the plasma might also lead to a high energy bombardment of the growing film, since ions will be accelerated in the plasma sheath between the bulk plasma and the substrate. An applied substrate bias of −50 V will, for example, accelerate a doubly charged ion to 100 eV, which might lead to implantation of the primary (incoming) species.Reference Wei, Zhong-Quan, Ye and De-Ming48 This in turn may induce compressive stress as the bombarding species are distorting the lattice of the sputtered films,Reference Ohring1 which might cause the film to peel off. Therefore, one has to take care when running a process containing these types of ions.
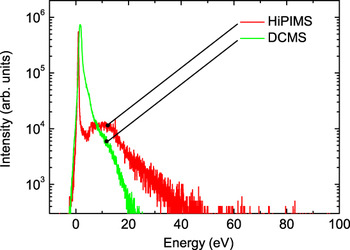
Moreover, the metal ions generated in the HiPIMS plasma are found to be highly energetic.Reference Bohlmark, Lattemann, Gudmundsson, Ehiasarian, Aranda Gonzalvo, Brenning and Helmersson7 From ion-energy measurements in HiPIMS discharges, it has been found that the average ion energy in the bulk plasma during the discharge pulse is around 20 eV without the use of any substrate bias.Reference Bohlmark, Lattemann, Gudmundsson, Ehiasarian, Aranda Gonzalvo, Brenning and Helmersson7, Reference Lundin, Larsson, Wallin, Lattemann, Brenning and Helmersson49 As it turns out, ion energies in the range of 20–30 eV have been shown to have a densifying effect on thin films,Reference Eriksson, Ghafoor, Schäfers, Gullikson and Birch50 which is a very fortunate result and will be explored further in Section III C dealing with thin film growth. In Fig. 3, the ion-energy distributions for HiPIMS and DCMS for Ti+ ions are compared. In the case of HiPIMS, a high energy part around 10–15 eV is clearly detected followed by a high energy tail. Last, from measurements by Hecimovic and EhisarianReference Hecimovic and Ehiasarian51, Reference Hecimovic and Ehiasarian52 on the ion-energy distribution for various metals as well as for Ar, it is also seen that ions are long-lived in the HiPIMS discharge and in some cases present during the entire pulse-off time (up to 10 ms), although there is an exponential ion density decrease. The ion energy and life span of ions are found to depend strongly on collisions of the sputtered flux with the surrounding gas and as such depends on the target material, where light elements, such as C and Al, lose more energy in collisions with Ar atoms and thereby have a shorter lifetime than heavy elements, for example, Nb.Reference Hecimovic and Ehiasarian51, Reference Hecimovic and Ehiasarian52 The implications of having ion bombardment of the thin film during the off-time of the HiPIMS pulse have so far not been investigated. One should also bear in mind that deposition takes place during the pulse-off time because of the time needed for sputtered material to reach the substrate.
Comparison between Ti+ ion-energy distributions from HiPIMS and direct current magnetron sputtering (DCMS) measured at 0.80 Pa Ar under equivalent process conditions at the same average power. The distributions have been normalized to fit into one single plot. Reprinted from Lundin et al.Reference Lundin, Larsson, Wallin, Lattemann, Brenning and Helmersson49 with permission from the Institute of Physics.

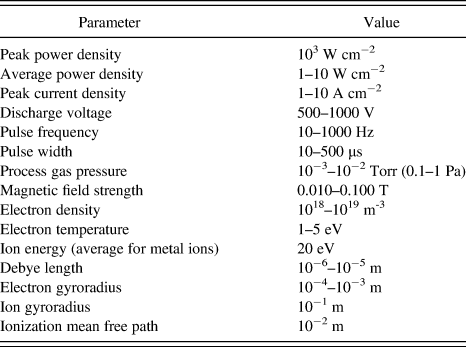
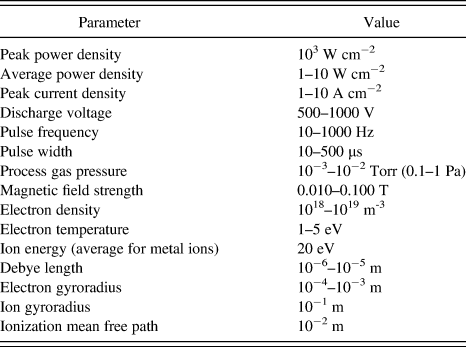
Table I sums up a few important parameters for the HiPIMS process. They are not to be seen as exact values but rather a help to determine what type of discharge one is dealing with.
A summary of important parameters for the high-power impulse magnetron sputtering discharge. The plasma parameters are obtained from the dense plasma region a few centimeters from the target, where the ionization is expected to be the strongest (ionization region).
Another important aspect of having an energetic flux of ions bombarding the substrate is the total energy flux, which affects the growing film. Furthermore, the heating due to energetic particle bombardment might melt thermally sensitive substrates, such as plastics. Comparative studies of the energy flux in HiPIMS and DCMS have shown that the total energy flux is of the same orderReference Leroy, Konstantinidis, Mahieu, Snyders and Depla53 or lowerReference Lundin, Stahl, Kersten and Helmersson54, Reference West, Kelly, Barker, Mishra and Bradley55 in the case of HiPIMS sputtering. This difference can be explained by the lower deposition rate for HiPIMS resulting in fewer bombarding particles per time unit (see Section II D). As an example, taking the lower deposition rate into account in the case of Ti sputtering using HiPIMS and DCMS, it has been concluded that ∼90% more energy per incoming particle is deposited on the substrate in the HiPIMS case.Reference Lundin, Stahl, Kersten and Helmersson54 Furthermore, from absolute temperature measurements at the substrate position during a HiPIMS process, it was found that the maximum equilibrium temperature reached about 70 °C.Reference Lundin, Stahl, Kersten and Helmersson54 Although having an intense metal ion bombardment, this is well below the limit for several thermally sensitive substrates, which are thermally stable up to around 150 °C (Kapton).Reference Lundin, Stahl, Kersten and Helmersson54 In this example, the average power was 500 W on a 6’’ Ti target and a peak current density of about 1.5 A cm−2.
C. Gas dynamics
During the transport of both metal neutrals and ions, there is a certain probability that these particles will collide with the neutral gas background. These collisions lead to heating of the gas followed by expansion (decrease in gas density in front of the target) in a process that is called gas rarefaction. It has extensively been investigated in magnetron discharges both experimentally and theoreticallyReference Hoffman56–Reference Kolev and Bogaerts60 during the last three decades. The loss of process gas results in a reduction of ions available for sputtering (often Ar ions) leading to a reduced deposition rate as well as a reduction of plasma density, which means that the desired IPVD properties will be lost.Reference Lundin, Brenning, Jädernäs, Larsson, Wallin, Lattemann, Raadu and Helmersson29
The reduction of gas density would not be much of a problem if the refill process would be fast enough. Unfortunately, this does not seem to be the case in all types of magnetron discharges,Reference Lundin, Brenning, Jädernäs, Larsson, Wallin, Lattemann, Raadu and Helmersson29 and it is believed to be particularly serious in HiPIMS due to the high peak power densities,Reference Kadlec61 which is further investigated and discussed in more detail in Ref. Reference Lundin, Brenning, Jädernäs, Larsson, Wallin, Lattemann, Raadu and Helmersson29. Also, a fraction of reflected gas neutrals moving away from the target surface will collide with the neutral background and thereby enhance the gas rarefaction. Last, note that neutral gas atoms are also rapidly lost through direct ionization during the HiPIMS pulse.Reference Lundin, Brenning, Jädernäs, Larsson, Wallin, Lattemann, Raadu and Helmersson29 This is a process, where gas ions arriving at the target become neutralized and reflected in the sputtering event, but are energetic enough to pass quickly through the near-cathode region and thus effectively drain the ionization region of process gas. To what extent it affects the overall gas depletion remains to be investigated. Conditions leading to loss of process gas will be discussed in Section II E regarding different pulse configurations.
D. Deposition rate
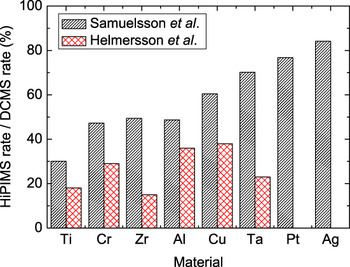
The lower deposition rate for HiPIMS compared to DCMS for the same average power is a drawback and is one of the most discussed topics in this field of research. In a recent report by Samuelsson et al.,Reference Samuelsson, Lundin, Jensen, Raadu, Gudmundsson and Helmersson8 it was found that the rates are typically in the range of 30–80% compared to DCMS depending on target material. In Fig. 4, reported deposition rates are given for various target materials based on the data from Helmersson et al.Reference Helmersson, Lattemann, Alami, Bohlmark, Ehiasarian and Gudmundsson62 and Samuelsson et al.Reference Samuelsson, Lundin, Jensen, Raadu, Gudmundsson and Helmersson8 The most common explanation to the reduction in deposition rate stems from a work by Christie,Reference Christie63 where back-attraction of metal ions to the target followed by self-sputtering causes a reduction in the amount of sputtered particles reaching the substrate. Controlling and optimizing the potential profile in the cathode region will, therefore, greatly affect the number of metal ions incident on the target surface,Reference Poolcharuansin and Bradley64 which so far has not been fully explored. Gas rarefaction, which was discussed in the previous section, is also likely to affect the deposition rate in HiPIMS processes. In addition, Konstantinidis et al.Reference Konstantinidis, Dauchot, Ganciu and Hecq65 found that the amount of ions reaching the substrate is increased by increasing the plasma conductivity, which was seen by creating a secondary plasma between the magnetron and the substrate using an external inductive coil. Furthermore, Bugaev et al.Reference Bugaev, Koval, Sochugov and Zakharov66 and Bohlmark et al.Reference Bohlmark, Östbye, Lattemann, Ljungcrantz, Rosell and Helmersson67 showed that the magnetic confinement of the sputtered material affected the deposition rate. In a recent publication by Mishra et al.,Reference Mishra, Kelly and Bradley68 it is reported that the deposition rate at the substrate position could be increased six times by weakening the magnetic field strength at the target surface by ∼33%. Emmerlich et al.Reference Emmerlich, Mráz, Snyders, Jiang and Schneider69 highlighted the nonlinear energy dependence of the sputtering yield, meaning that it does not make sense to compare HiPIMS and DCMS deposition rates for the same average power, if not taking this dependence into account. When comparing with experimental results, they saw trends confirming their experiments, but it could not fully explain the differences. Another possibility is a recently discovered fast charged particle transport operating in pulsed plasma discharges such as HiPIMS.Reference Brenning, Merlino, Lundin, Raadu and Helmersson70, Reference Lundin, Helmersson, Kirkpatrick, Rohde and Brenning71 It results in an increase of ions being transported parallel to the target surface and lost to the walls instead of arriving at the substrate position, and thus reducing the deposition rate.Reference Lundin, Larsson, Wallin, Lattemann, Brenning and Helmersson49 Ongoing work on plasma modeling of HiPIMS discharges, where one can arbitrarily turn on and off mechanisms believed to affect the deposition rate, will most likely shed more light on the subject.Reference Brenning, Huo, Lundin, Raadu, Vitelaru, Stancu, Minea and Helmersson72 Last, it should be pointed out that there are many situations where the quality of the coating is far more important than the deposition rate and one should, as always, be careful when making these comparisons based on only one or a few properties.
Relative deposition rates for HiPIMS as compared to DCMS for various metal targets deposited at approximately the same average power. In the study by Samuelsson et al.,Reference Samuelsson, Lundin, Jensen, Raadu, Gudmundsson and Helmersson8 the depositions were carried out at 0.67 Pa Ar pressure at a HiPIMS peak current density of 1.5 A cm−2. In the study by Helmersson et al.,Reference Helmersson, Lattemann, Alami, Bohlmark, Ehiasarian and Gudmundsson62 the process conditions could not be found (Data taken from Helmersson et al.Reference Helmersson, Lattemann, Alami, Bohlmark, Ehiasarian and Gudmundsson62 and Samuelsson et al.Reference Samuelsson, Lundin, Jensen, Raadu, Gudmundsson and Helmersson8 with permission from Elsevier).

E. Pulse configuration
Often the question regarding what type of HiPIMS pulse to use arises. One answer is that it depends on what one wants to achieve in the deposition process. Below is a short summary of what process conditions that should be expected for a given pulse-type. In all cases, we assume that the above definition of HiPIMS still holds, meaning that we still are working with a considerable peak power density compared to the average power.
(1) tpulse < 50 μs: In short pulses, Ar ions are the dominant sputtering particles.Reference Lundin, Brenning, Jädernäs, Larsson, Wallin, Lattemann, Raadu and Helmersson29 Konstantinidis et al.Reference Konstantinidis, Dauchot, Ganciu, Ricard and Hecq28 have shown that by decreasing the pulse length it is possible to increase the deposition rate, where ∼70% of the DCMS deposition rate is achieved for 5 μs pulses in the case of Ti compared to ∼20% of the DCMS deposition rate for 20 μs pulses, mainly due to less self-sputtering for short pulses. At the same time there is a tradeoff with the degree of ionization, where the highest reported values are found for the 20 μs pulses.Reference Konstantinidis, Dauchot, Ganciu, Ricard and Hecq28 It is also reported that shorter pulses have beneficial consequences for reactive HiPIMS processes,Reference Aiempanakit, Kubart, Larssron, Sarakinos, Jensen and Helmersson73 which are discussed in more detail in Section II F.
(2) tpulse ∼ 50–200 μs: The most commonly used pulse width is ∼80–100 μs, which is enough time to develop high peak currents leading to many of the desired properties discussed in this work. As the pulse is prolonged, it is more likely that a fraction of the ionized sputtered material is attracted back to the target surface and will participate in the sputtering process (self-sputtering).Reference Christie63 This means that less sputtered material will reach the substrate, and the deposition rate is reduced.Reference Lazar, Vlcek and Rezek74
(3) tpulse ∼ 200-500 μs: Here, gas heating leading to dissipation of the gas in front of the target may seriously affect the discharge conditions (see discussion in Section II C), which often leads to a dramatic drop of the discharge currentReference Lundin, Brenning, Jädernäs, Larsson, Wallin, Lattemann, Raadu and Helmersson29, Reference Horwat and Anders75 unless self-sputtering can compensate for the reduction of ions available for sputtering.
(4) tpulse > 500 μs: Longer pulsed regimes, where the discharge is sustained for several milliseconds, have been achieved when using the modulated pulsed power (MPP) technique, where the duty cycle can reach almost 30% compared to 1–10% for conventional HiPIMS discharges.Reference Lin, Moore, Sproul, Mishra, Rees, Wu, Chistyakov and Abraham76 In general, this limits the peak current that can be achieved to avoid damaging the magnetron, which means that the peak plasma density is limited to around 1017–1018 m-3,Reference Meng, Cloud, Jung and Ruzic77 and the degree of metal ionization is found to be lower compared to shorter HiPIMS pulses.Reference Hála, Capek, Zabeida, Klemberg-Sapieha and Martinu78 Still, the perspective of using multiple pulse packets within the same MPP pulse may result in facilitating the ignition of the plasma.Reference Hála, Capek, Zabeida, Klemberg-Sapieha and Martinu78
In addition, the amplitude of the HiPIMS discharge current density is a good indicator for metal ionization, where an increasing discharge current density results in increased ionizationReference Alami, Sarakinos, Uslu and Wuttig31 and also an increased number of multiply charged ions.Reference Ross, Sangines, Treverrow, Bilek and McKenzie79 On the other hand, the applied voltage determines the energy of the sputtering ion, meaning that an increased applied voltage will increase the ion energy and thereby increase the number of sputtered particles. It is important to keep in mind that the sputter yield roughly scales as  ,Reference Emmerlich, Mráz, Snyders, Jiang and Schneider69 where V D is the applied discharge voltage, suggesting that the best choice to increase the deposition rate is not always to increase the applied voltage but, for example, increase the pulse frequency.
F. Reactive HiPIMS
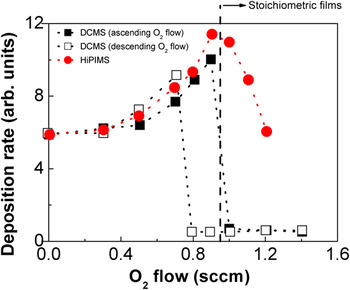
In reactive sputtering processes, a reactive gas (e.g., O2, N2, etc) is used along with the buffer gas to synthesize compound films. Typical for these processes is that the formation of the compound material takes place on the surface of the target (referred to as target coverage or poisoning).Reference Berg and Nyberg80, Reference Depla and De Gryse81 This layer is then sputtered and transported to the substrate to form the compound film. Deposition from a fully covered target (referred to as the compound sputtering mode) allows for growth of stoichiometric compound films, i.e., compound films with sufficient incorporation of the reactive gas atoms.Reference Berg and Nyberg80, Reference Depla and De Gryse81 At these conditions, deposition rates lower than those obtained from an elemental (e.g., metallic) target are commonly achieved.Reference Berg and Nyberg80, Reference Depla and De Gryse81 Growth of stoichiometric compound films with relatively high rates can be facilitated in the intermediate target coverage regime (referred to as transition zone) between the metallic and the compound mode.Reference Berg and Nyberg80, Reference Depla and De Gryse81 In reactive DCMS, the transition sputtering zone is frequently unstable, and a hysteresis in the process parameters (i.e., target voltage, deposition rate, and reactive gas partial pressure) is often observed.Reference Berg and Nyberg80, Reference Depla and De Gryse81 This is particularly pronounced during reactive DCMS of metal oxides.Reference Severin, Kappertz, Kubart, Nyberg, Berg, Pflug, Siemers and Wuttig82 As a consequence, stoichiometric films can only be obtained in the compound sputtering mode,Reference Berg and Nyberg80, Reference Depla and De Gryse81 unless a feedback system for controlling the target coverage is used.Reference Sproul, Graham, Wong, Lopez, Li and Scholl83 Investigations of the process characteristics during reactive HiPIMS of Al2O3,Reference Wallin and Helmersson30, Reference Aiempanakit, Kubart, Larssron, Sarakinos, Jensen and Helmersson73 ZrO2,Reference Sarakinos, Alami, Klever and Wuttig84 and CeO2Reference Aiempanakit, Kubart, Larssron, Sarakinos, Jensen and Helmersson73 have shown that these processes can exhibit a hysteresis-free and stable transition zone at deposition conditions which in the case of DCMS result in hysteresis and an unstable transition zone, see Fig. 5 for Al2O3. The stabilization of the transition zone allows for deposition of stoichiometric films at a lower target coverage when compared to the compound mode in DCMS.Reference Wallin and Helmersson30, Reference Aiempanakit, Kubart, Larssron, Sarakinos, Jensen and Helmersson73, Reference Sarakinos, Alami, Klever and Wuttig84 This has been shown to result in deposition rates similarReference Wallin and Helmersson30 or up to two times higherReference Sarakinos, Alami, Klever and Wuttig84 than those obtained by DCMS. It is worth mentioning that all the studies on reactive HiPIMS have been performed in small-size laboratorial scale deposition systems. The ability of HiPIMS to stabilize the transition zone and suppress/eliminate the hysteresis effect for large industrial size systems has still to be demonstrated.
Deposition rates obtained from an Al target sputtered using DCMS and HiPIMS in an Ar–O2 atmosphere as measured by a quartz crystal microbalance. The filled and hollow squares correspond to the DCMS rate for increasing and decreasing O2 flow, respectively. It is seen that the DCMS process exhibits an unstable transition zone with pronounced hysteresis. On the contrary, the HiPIMS process (filled circles for both increasing and decreasing O2 flow) is stable and hysteresis-free. This behavior allows for a deposition rate similar to that obtained by DCMS (Data taken from Wallin and HelmerssonReference Wallin and Helmersson30).

In general, the stability of the transition zone in reactive sputtering processes is determined by the competition between the formation and the removal (sputtering) of the compound from the target surface.Reference Berg and Nyberg80, Reference Depla and De Gryse81 According to the formalism developed by Berg and Nyberg,Reference Berg and Nyberg80 the steady-state target coverage, ϑt,is equal to
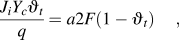
where J i is the ion target current density, Y c the compound sputtering yield, q the elementary charge, a the sticking coefficient of the reactive gas, and F the flux of the reactive gas molecules toward the target. Stabilization of the transition mode can be achieved, if for a certain nominal partial pressure/flow of the reactive gas the term “ ” (removal of the compound) increases and/or the term “a2F(1 – ϑt)” (formation of the compound) decreases. It has been suggested that the pulsed character of the HiPIMS discharge affects both terms in Eq. (1). In addition, the absence of plasma during the pulse-off time results in a limited activation of the reactive species.Reference Depla and De Gryse85 The expected life time of atomic species created during the HiPIMS discharge is ∼2 ms based on the experimental results by Clarenbach et al.Reference Clarenbach, Lorenz, Krämer and Sadeghi86 Under these conditions, relatively high levels of reactive gas exposure are necessary for the formation of the compound on the target surface, i.e., this mechanism leads to lower effective values of the sticking coefficient a in Eq. (1). Furthermore, the high peak target current in HiPIMS results in rarefaction of the neutral species in the target’s vicinity, as discussed in Section II C, which affects not only Ar gas but also the reactive gas.Reference Sarakinos, Alami and Wuttig87, Reference Kubart, Aiempanakit, Andersson, Nyberg, Berg and Helmersson88 The rarefaction implies that the reactive species flux F is lower than the value corresponding to the nominal partial pressure of the reactive gas.Reference Sarakinos, Alami and Wuttig87, Reference Kubart, Aiempanakit, Andersson, Nyberg, Berg and Helmersson88
III. THIN FILM PROCESSING
In magnetron sputtering techniques, variation of the deposition parameters allows for control of the energy transferred to the film-forming species enabling the manipulation of the film properties.Reference Ohring1, Reference Mattox89 Among the various ways used to provide energy to the growing film, bombardment by ionized species is widely used.Reference Hopwood and Hopwood39, Reference Auciello and Kelly90 Numerous studies have shown that during the film growth, the plasma–film interface is affected by the energy of the bombarding ions, their flux, their nature, and their angle of incidence.Reference Petrov, Barna, Hultman and Greene91, Reference Dalla Torre, Gilmer, Windt, Kalyanaraman, Baumann, O’Sullivan, Sapjeta, Díaz de la Rubia and Djafari Rouhani92 These parameters determine the efficiency of the momentum transfer to the film atomsReference Ensiger93 and have been shown to have implications on the film microstructureReference Petrov, Barna, Hultman and Greene91 as well as on mechanical, optical, and electrical properties.Reference Auciello and Kelly90, Reference Tellier and Tosser94, Reference Munoz, Finger, Arenas, Kremer and Moraga95 In HiPIMS, high pulsed ion fluxes are made available at the substrate. In the next sections the effect of the energetic bombardment during HiPIMS on the growth and the properties of elemental and compound films is reviewed.
A. Deposition on complex-shaped substrates
The deposition of homogeneous films on substrates of complex geometry is a requirement for many technological applications, such as metallization of submicrometer patterns in optical and semiconductor devicesReference Weis, Müggenburg, Grosse, Herlitze, Friedrich and Wuttig96, Reference Siemroth and Schülke97 and deposition of thick protective layers on forming tools and turbine blades.Reference Alami, Bolz and Sarakinos98, Reference Schuelke, Witke, Scheibe, Siemroth, Schultrich, Zimmer and Vetter99 In conventional sputtering techniques such as DCMS the deposition flux is highly anisotropicReference Siemroth and Schülke97, Reference Berisch100 leading to inhomogeneous deposition, porosity, and poor coverage on substrate sites located along low flux directions.Reference Siemroth and Schülke97 To alleviate these problems, highly ionized deposition fluxes can be used, since the trajectories of charged species can be manipulated by electric and magnetic fields. Different state-of-the-art attempts to achieve such conditions were discussed in Section II A.
HiPIMS provides an alternative approach to successfully deposit films on complex-shaped substrates. In Fig. 6, scanning electron microscopy (SEM) images of the crosssection of Ta films deposited both by DCMS and HiPIMS on a negatively biased (−50 V) Si substrate clamped on the side of a trench with an area of 1 cm2 and a depth of 2 cm are presented.Reference Alami, Persson, Music, Gudmundsson, Bohlmark and Helmersson15 The SEM images were taken from a position at the middle of the trench as shown in the sketch in Fig. 6. The DCMS grown film exhibits a porous columnar structure with columns tilted from the normal of the Ta/Si interface [Fig. 6(b)], whereas the HiPIMS films are dense with columns growing perpendicularly to the Ta/Si interface [Fig. 6(a)]. This concept has been, for instance, used to deposit homogeneous hard nitride coatings on cutting inserts.Reference Alami, Bolz and Sarakinos98 Smaller features, such as holes of several tens or hundreds of nanometers can also be successfully filledReference Chistyakov, Abraham, Sproul, Moore and Lin101 or homogeneously coated.Reference Kouznetsov, Macák, Schneider, Helmersson and Petrov4 It has to be pointed out here that all studies performed so far concerned deposition of metallic films on biased conductive substrates.
Cross-sectional scanning electron microscope (SEM) images of Ta films grown by (a) HiPIMS and (b) DCMS on a Si substrate clamped on the side of a trench with an area of 1 cm2 and a depth of 2 cm. The HiPIMS deposited film is dense with columns growing perpendicular to the Ta/Si interface. The DCMS deposited films have a porous microstructure with columns inclined toward the flux direction. Reprinted from Alami et al.Reference Alami, Persson, Music, Gudmundsson, Bohlmark and Helmersson15 with permission from the American Institute of Physics.

B. Phase composition tailoring by HiPIMS
The phase composition of films is crucial for their mechanical, electrical, and optical performance. In sputtering processes, relatively low-growth temperatures and high deposition rates result in limited assembly kinetics.Reference Ohring1, Reference Michely and Krug102 This in combination with extremely high cooling rates (1013 Ks-1) during the condensation of the vapor on the substrate leads to nonequilibrium growth.Reference Ohring1, Reference Michely and Krug102 Thus, the variation of both thermodynamic and kinetic conditions during deposition enables tailoring of the phase composition. Numerous studies have demonstrated that energetic ions can be used for this purpose since they can trigger surface and bulk diffusion processes,Reference Ohring1, Reference Michely and Krug102 induce changes in the film structure and chemical composition,Reference Petrov, Adibi, Greene, Hultman and Sundgren103 and cause generation of internal stresses.Reference Janssen and Kamminga104–Reference Davis107
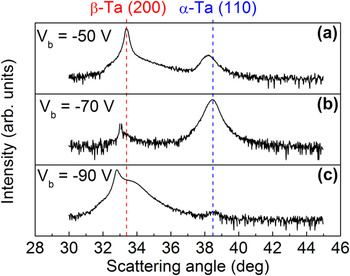
The high fluxes of ionized material available in HiPIMS have been found to allow for control of the phase formation in both elemental and compound films. One example is the control of the phase composition in Ta films.Reference Alami, Eklund, Andersson, Lattemann, Wallin, Bohlmark, Persson and Helmersson12 In this case, tailoring of the phase formation is achieved by controlling the magnitude of the internal stresses.Reference Alami, Eklund, Andersson, Lattemann, Wallin, Bohlmark, Persson and Helmersson12 This process is particularly efficient in HiPIMS discharges owing to the degree of ionization of the Ta vapor of up to 70%.Reference Helmersson, Lattemann, Bohlmark, Ehiasarian and Gudmundsson5 Ta forms both a low resistivity body-centered cubic crystal structure (also known as the α phase) at elevated temperatures and a metastable high resistivity tetragonal phase (β-Ta) at room temperatures.Reference Clevenger, Mutscheller, Harper, Cabral and Barmak108, Reference Face and Prober109 The abundance of Ta+ ions in the deposition flux during the HiPIMS deposition of Ta films implies a more efficient momentum transfer to the growing surface.Reference Alami, Eklund, Andersson, Lattemann, Wallin, Bohlmark, Persson and Helmersson12, Reference Dalla Torre, Gilmer, Windt, Kalyanaraman, Baumann, O’Sullivan, Sapjeta, Díaz de la Rubia and Djafari Rouhani92 This is in contrast to the growth by DCMS, where the majority of the ions in the deposition flux consists of the much lighter Ar+ ions.Reference Christou and Barber19 HiPIMS thus provides tools for better influencing the internal stresses of the growing Ta films and accordingly the possibility to deposit α-Ta films at room temperature (Fig. 7).Reference Alami, Eklund, Andersson, Lattemann, Wallin, Bohlmark, Persson and Helmersson12
X-ray diffraction patterns of Ta films deposited by HiPIMS on Si substrates biased at negative potentials of (a) −50, (b) −70 and (c) −90 V. The bcc α-Ta phase is obtained at −70 V due to the ion bombardment-induced compressive stress. The vertical lines indicate the position of the β-Ta (200) and α-Ta (110) peaks. Data taken from Alami et al.Reference Alami, Eklund, Andersson, Lattemann, Wallin, Bohlmark, Persson and Helmersson12

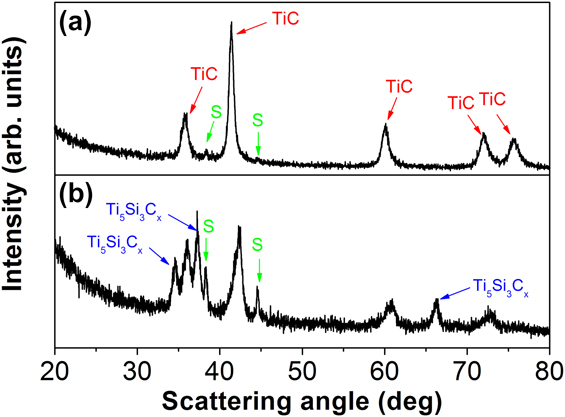
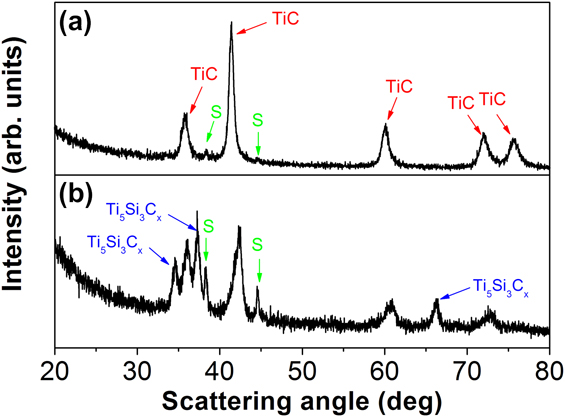
In HiPIMS discharges, part of the ions moves along off-normal, with respect to the target, directionsReference Lundin, Larsson, Wallin, Lattemann, Brenning and Helmersson49 (see Section II D). This anomalous ion transport results in differences in the flux, the energy, and the composition of the deposited and bombarding species as functions of the deposition angle. Moreover, in the case of compound targets, the composition of the material flux along off-normal directions is largely determined by the ionization fraction of the target’s constituent elements.Reference Alami, Eklund, Emmerlich, Wilhelmsson, Jansson, Högberg, Hultman and Helmersson110 This composition is different from that along directions close to the target normal, which is also influenced by the angular distribution of the neutral species. The effect of the deposition angle on the phase composition has been studied for the ternary system Ti–Si–C,Reference Alami, Eklund, Emmerlich, Wilhelmsson, Jansson, Högberg, Hultman and Helmersson110 which can allow for the formation of the so-called MAX phases [M is a transition metal, A is an A-group element (mostly IIIA and IVA), and X is C or N].Reference Barsoum111 The formation of MAX phases is strongly dependent on the relative fractions of the constituent elements, i.e., the chemical composition.Reference Barsoum111 When a ternary Ti–Si–C target is sputtered, light elements like C are favored at the expense of heavier elements, such as Ti and Si, along the target normal.Reference Eklund, Beckers, Jansson, Högberg and Hultman112 On the other hand, substrates placed at an angle of 90° with respect to the target experience a lower flux of C because of the lower ionization degree of C compared to Ti and Si, i.e., predominantly ballistic transport of C in the forward direction.Reference Alami, Eklund, Emmerlich, Wilhelmsson, Jansson, Högberg, Hultman and Helmersson110 Worth pointing out is that with increasing process gas pressure (>2 Pa), more pronounced scattering of light elements to off-normal directions will occur.Reference Alami, Eklund, Emmerlich, Wilhelmsson, Jansson, Högberg, Hultman and Helmersson110 In Fig. 8, the x-ray diffraction patterns of Ti–Si–C films grown from a Ti2SiC3 target employing HiPIMS are presented. The TiC phase is the main constituent for films grown on substrates parallel to the target surface [Fig. 8(a)]. At deposition angle of 90°, the so-called Nowotny’s Ti5Si3Cx phase is also formed, as shown in Fig. 8(b).
X-ray diffraction patterns of Ti–Si–C films deposited on MgO (111) substrates by HiPIMS on substrates oriented (a) parallel and (b) perpendicular with respect to the target surface. Peaks of the TiCx and Ti5Si3Cx phases are indicated by arrows, respectively. S stands for substrate peaks. Data taken from Alami et al.Reference Alami, Eklund, Emmerlich, Wilhelmsson, Jansson, Högberg, Hultman and Helmersson110
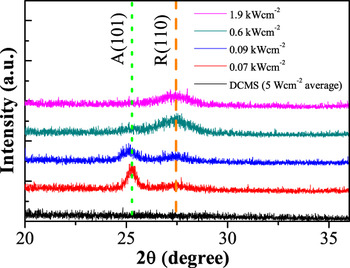
Compound films can also be deposited from elemental targets when a reactive gas is added in the sputtering atmosphere. A typical example of a reactively synthesized material system in which HiPIMS can be used to control the phase composition is TiO2.Reference Konstantinidis, Dauchot and Hecq11, Reference Alami, Sarakinos, Uslu, Klever, Dukwen and Wuttig113–Reference Bandorf, Vergöhl, Giesel, Wallendorf and Mark116 In general, TiO2 films can grow in an amorphous and in two tetragonal crystalline structures; the rutile and the anatase phases, respectively.Reference Wiggins, Nelson and Aita117 The anatase phase exhibits interesting photocatalytic properties,Reference Wiggins, Nelson and Aita117 whereas the rutile phase exhibits one of the highest refractive indices in nature.Reference Wiggins, Nelson and Aita117 Deposition and/or annealing at high temperatures (700–900 °C) have been reported to lead to the formation of the rutile phase.Reference Wiggins, Nelson and Aita117 The anatase phase is generally obtained at lower temperatures,Reference Wiggins, Nelson and Aita117 whereas deposition at room temperature often leads to the formation of amorphous films.Reference Wiggins, Nelson and Aita117 In addition, the energetic bombardment by positively charged ions (facilitated by applying a negative bias voltage on the substrate) can promote the crystallization of TiO2 films at room temperature.Reference Zhou, Zhong, Wu, Yuan, Shu, Li and Xia118 When HiPIMS is used, the rutile phase can be achieved even at room temperature, and the increase of the flux of energetic species toward the growing film favors the formation of the rutile at the expense of the anatase phase.Reference Konstantinidis, Dauchot and Hecq11, Reference Alami, Sarakinos, Uslu, Klever, Dukwen and Wuttig113–Reference Aiempanakit, Helmersson, Aijaz, Larsson, Magnusson, Jensen and Kubart115 This can be, for instance, achieved by increasing the peak target power (or current)Reference Aiempanakit, Helmersson, Aijaz, Larsson, Magnusson, Jensen and Kubart115, Reference Bandorf, Vergöhl, Giesel, Wallendorf and Mark116 (see Fig. 9) or by decreasing the working pressure during deposition.Reference Alami, Sarakinos, Uslu, Klever, Dukwen and Wuttig113, Reference Stranak, Quaas, Wulff, Hubicka, Wrehde, Tichy and Hippler114
X-ray diffraction patterns of TiO2 films grown on Si substrates by HiPIMS at various values of peak target power. The increase of the peak target power and the subsequent resulting increase in the number of ions available during deposition promote the formation of the rutile at the expense of the anatase phase. Adapted from Aiempanakit et al.Reference Aiempanakit, Helmersson, Aijaz, Larsson, Magnusson, Jensen and Kubart115

C. Control of film microstructure and interface engineering
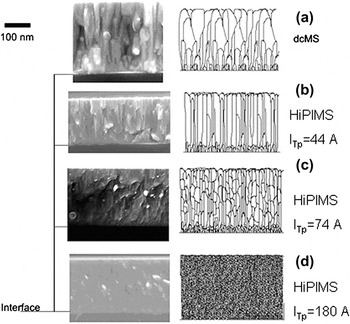
Polycrystalline films grown by PVD techniques exhibit a variety of microstructures with respect to the size, the morphology, and the relative orientation of the crystallites.Reference Petrov, Barna, Hultman and Greene91, Reference Barna and Adamik119 These features have, for instance, implications for the mechanical strengthReference Koehler120 and the electrical conductivityReference Tellier and Tosser94, Reference Munoz, Finger, Arenas, Kremer and Moraga95, Reference van Attekum, Woerlee, Verkade and Hoeben121 of the film. The microstructure is determined primarily by surface and bulk diffusion processes,Reference Petrov, Barna, Hultman and Greene91, Reference Barna and Adamik119 which are controlled by the deposition temperature, the bombardment by energetic species, and the incorporation of impurities that act as inhibitors for the crystal and grain growth.Reference Petrov, Barna, Hultman and Greene91, Reference Barna and Adamik119, Reference Anders122 Deposition at relatively low temperatures (typically lower than 0.4Tm, where Tm is the melting temperature of the deposited material) using state-of-the-art sputtering techniques allows only for surface diffusion to be activated leading to the formation of films with a columnar microstructure and intercolumnar porosity [see Fig. 10(a) for CrN films].Reference Alami, Sarakinos, Uslu and Wuttig31, Reference Petrov, Barna, Hultman and Greene91, Reference Barna and Adamik119 Growth of films using HiPIMS is characterized by high ionic fluxes to the substrate (up to several hundreds of milliamperes per square centimeter) of relatively low energies (several tens of electronvolts), as was discussed in Section II B. These growth conditions trigger and/or enhance surface diffusion leading to film densificationReference Alami, Sarakinos, Uslu and Wuttig31, Reference Greczynski, Jensen, Böhlmark and Hultman123 as shown in Fig. 10(b). Upon increasing the flux of ions available at the substrate (achieved, e.g., by increasing the peak target current), repeated nucleation occursReference Alami, Sarakinos, Uslu and Wuttig31, Reference Ehiasarian, Hovsepian, Hultman and Helmersson124 resulting in suppression of the columnar structure and transition from a dense polycrystalline to a globular nanocrystalline microstructure,Reference Alami, Sarakinos, Uslu and Wuttig31 as shown in Figs. 10(c)–10(d). When high energetic fluxes are not available during growth, globular microstructures are consequence of segregation of impurity phases, which hinder the crystal and grain growth. It is, therefore, evident that the low-energy high-flux ion irradiation during HiPIMS can be used to overcome the characteristically underdense and rough microstructures and obtain morphologies unique for low-temperature sputter deposition.Reference Alami, Sarakinos, Uslu and Wuttig31 This, in turn, allows growth of films with higher hardness,Reference Paulitsch, Mayrhofer, Mitterer, Münz and Schenkel13, Reference Chistyakov, Abraham, Sproul, Moore and Lin101, Reference Ehiasarian, Hovsepian, Hultman and Helmersson124 lower friction coefficient,Reference Paulitsch, Mayrhofer, Mitterer, Münz and Schenkel13, Reference Ehiasarian, Münz, Hultman, Helmersson and Petrov125 and improved scratch and wear as well as corrosion resistance,Reference Paulitsch, Mayrhofer, Mitterer, Münz and Schenkel13, Reference Ehiasarian, Hovsepian, Hultman and Helmersson124 as compared to films deposited by DCMS.
Cross-sectional SEM images of CrN films deposited on Si by (a) DCMS, as well as HiPIMS at a peak target current of (b) 44 A (1.0 A cm−2), (c) 74 A (1.7 A cm−2), and (d) 180 A (4.0 A cm−2). The increase of the peak target current results in a transition of a dense polycrystalline morphology to a nanocrystalline featureless one. The sketches next to each SEM image serve merely as a schematic representation for the reader’s convenience. Results taken from Alami et al.Reference Alami, Sarakinos, Uslu and Wuttig31

The highly ionized fluxes available in HiPIMS in combination with the use of a substrate bias result in ion energies in the order of several hundreds to thousands of electronvolts, which can be used to engineer the film–substrate interface and enhance the film adhesion.Reference Ehiasarian, Wen and Petrov14 Typical example is a CrN/NbN film deposited on steel substrates etched using HiPIMS (pretreatment by Nb+ ions at a substrate bias voltage of −1000 V) exhibited a scratch test critical load (Lc) of 56 N, which was higher than the values of 25 N obtained for films deposited on substrates etched by a DCMS plasma (substrate bias voltage of −1000 V at an Ar pressure of 0.8 Pa),Reference Ehiasarian, Wen and Petrov14 which exhibit a significantly lower ionization degree for both Ar+ and metal ions.Reference Christou and Barber19 It should also be pointed out here that the Lc values achieved on HiPIMS etched substrates are comparable to those for films grown on substrates cleaned using high fluxes of Ar+ ions generated by an external ionization source.Reference Vetter, Michler and Steuernagel126 This fact indicates that HiPIMS can be used as an alternative process to improve the quality of the film–substrate interface and enhance the film adhesion, when no external source for increasing the Ar ionization is available.
IV. SUMMARY AND CONCLUDING REMARKS
In this review on HiPIMS, the fundamental process characteristics as well as the most striking features when using this technique for surface treatment and thin film growth have been discussed. The HiPIMS discharge provides high plasma densities often resulting in a high degree of ionization of the sputtered material, which is shown to affect all types of plasma–wall interactions in a wide variety of plasma applications, such as etching, deposition of thin films, and surface modifications. HiPIMS today is an established IPVD technique within the sputtering community with dedicated sessions at international conferences on sputtering. Successful upscaling and industrialization of the process have been achieved, which has been followed by a continuously growing industrial interest reflected by the increasing number of publications using HiPIMS under industrial conditions. One very important aspect of future work on HiPIMS is the theoretical modeling, which has so far been reasonably successful in verifying experimental results regarding particle transport, gas rarefaction, electrical field and potential distributions, etc. To fully understand the underlying mechanisms operating in the HiPIMS discharge, more work in this area is needed, which ultimately must be connected to the plasma processing to achieve new and better thin films.
ACKNOWLEDGMENTS
The authors gratefully acknowledge Dr. Ante Hecimovic for valuable input. One of the authors (K. Sarakinos) acknowledges the Swedish Research Council (VR) for the financial support through the postdoctoral project 623-2009-7348.