


Introduction
The credibility of election outcomes, and the health of democracy, hinge on the accuracy of vote tallies. Vote counting, however, is generally inaccurate. Whether inaccuracies are small or large, and whether they result from willful malfeasance or from unwitting error, they constitute political dynamite susceptible to exploitation for partisan ends. Disputes over the accuracy of the vote count in the 2000 USA presidential election, for example, had aftereffects that linger in the American political environment to date. In Ecuador’s 2017 presidential elections, arithmetical and numerical inaccuracies in the vote tallies were used by the runner-up to push for a large-scale recount. And, the call to recount “vote by vote, precinct by precinct” after the 2006 presidential elections in Mexico promoted long-lasting mistrust of the electoral system among a large fraction of the citizenry.Footnote 1
Inaccuracies in the vote count, of course, could stem from fraudulent electoral practices (Cantú Reference Cantú2018; Hyde Reference Hyde2007; Myagkov, Ordeshook, and Shakin Reference Myagkov, Ordeshook and Shakin2010; Serra Reference Serra2012; Simpser Reference Simpser2013). But even in a clean election, the imperfect nature of the counting process makes it impossible to guarantee the accuracy of the tally. Machine-based vote counts have been shown to be inaccurate (Alvarez, Katz, and Hill Reference Alvarez, Katz and Hill2009), and the problem is likely graver when human error is potentially involved (Alvarez and Hall Reference Alvarez and Hall2008; Ansolabehere and Reeves Reference Ansolabehere and Reeves2004; Goggin, Byrne, and Gilbert Reference Goggin, Byrne and Gilbert2012). Yet hand-counting is the rule in the vast majority of countries with elections. Out of 105 countries for which the ACE Project collected information on how votes are counted, 85, or 81%, count their votes by hand (Appendix Figure A1). In fact, hand-counting is making a comeback even in places where electronic voting used to be the rule, due to concerns about foreign meddling and hacking.Footnote 2 Nevertheless, we know little about the consequences of inaccurate tallies and about the causes of such inaccuracies when votes are counted by people.
This paper presents what we believe to be the first systematic evidence on the prevalence, the causes, and the consequences of inaccuracies in the hand-counting of votes in mass elections. Our empirical analysis is based on a unique dataset covering the universe of polling stations, poll workers, and party representatives in five national elections in Mexico during 2009–2015. Altogether, we observe over 600,000 polling-station-level tallies, over 1.5 million citizen poll workers and hundreds of thousands of party representatives at the polls. Additionally, we conducted an original survey of citizen attitudes towards the electoral authorities on close to 80,000 citizen poll workers.
Information on inaccuracies is culled from the official document that polling-station workers must fill out by hand, on paper, at the end of Election Day after counting the ballots in their corresponding polling station. This document, known as an acta (which we translate as tally), constitutes the basic input used by the electoral authorities to compute official election results. Our measures of inaccuracies follow the electoral authority’s own definitions of inconsistencies in the vote tallies. An inconsistency is said to exist when two or more fields in the tally that should satisfy an accounting equality fail to do so. In any given polling station, for example, the number of cast ballots plus the number of unused ballots should equal the initial number of ballots.
We find that inconsistencies in vote tallies are remarkably common, being present in more than two out of five actas and in a similar proportion of polling stations.Footnote 3 We find no evidence, however, that tally inconsistencies in the period we study are the result of partisan malfeasance. This is consistent with the viewpoint of the Mexican electoral authorities as well as with the scholarly consensus that Mexican elections have been virtually free of many traditional forms of election fraud since at least 1997 as a result of the major electoral reforms of the mid-1990s.Footnote 4
Even honest mistakes in the tallying of votes, however, can have fateful consequences. As illustrated by the cases of the USA, Ecuador, and Mexico mentioned previously, inaccuracies in vote tallies are often seized upon by losing parties in countries the world over to impugn the credibility of election results and, in some cases, that of electoral authorities themselves. In many countries, inconsistencies provide a legal basis for recount requests, as is the case in Argentina, Austria, Brazil, Chile, Colombia, Denmark, Ecuador, Honduras, Mexico, and Spain among others. Inconsistent tallies have led to major court cases in Armenia, Mali, Mexico, and the USA, to name a few examples (Autheman Reference Autheman2004; Posner Reference Posner2000). Our findings are consistent with these observations: in the elections we study, inaccurate tallies are associated with a 25 percentage point greater probability that votes in the corresponding polling station are recounted. We also find that tally inconsistencies and vote recounts undermine citizen trust in the electoral authorities as impartial arbiters of elections.
What explains variation in the quality of hand-counted vote tallies? Making use of various electoral rules and procedures to identify causality,Footnote 5 we find that more-educated poll workers yield tallies with fewer inconsistencies. An additional year of average educational attainment for the poll-worker team associated with a polling station reduces the extent of inconsistencies in the tally by up to 7%. The arithmetical difficulty of the tallying task, in contrast, renders inconsistencies more likely: the incidence of inconsistencies is about 17% greater when a sum in the acta requires carrying one than when it does not. Finally, tally inconsistencies are proportional to the workload, understood as the number of ballots cast, and therefore counted in a given polling station. The incidence of inconsistencies increases by about 0.2% for every additional ballot cast.
A key contribution of this paper is to direct attention to the issue of the quality of vote tallies in “normal” elections—that is, clean, routine elections where votes are counted by people. The existing literature discusses the quality of tallies in two specific contexts: fraudulent elections (Cantú Reference Cantú2018; Hyde Reference Hyde2007; Mebane Reference Mebane2010; Myagkov, Ordeshook, and Shakin Reference Myagkov, Ordeshook and Shakin2010) and studies of voting technology (e.g., electronic voting machines) (Alvarez, Katz, and Hill Reference Alvarez, Katz and Hill2009; Alvarez and Hall Reference Alvarez and Hall2008; Ansolabehere and Reeves Reference Ansolabehere and Reeves2004). Virtually no attention has been given to the issue of tally quality in the modal case: elections where fraud is not an important issue and votes are counted by hand. We show that the quality of vote tallies varies considerably even within a single country where the administration of elections is centralized, as is the case in Mexico.
A second set of contributions of our analysis is to provide causal evidence showing that the quality of vote tallies is systematically explained by socioeconomic and behavioral factors. Third, we find that low-quality tallies have consequences such as fostering recounts and undermining the public’s trust in the electoral authorities. These findings raise the specter of a double development and democracy curse: countries and regions with low levels of overall development are also more likely to experience low-quality vote tallies, low trust in election results and in democratic institutions, and partisan strife.
Fourth, our results also connect with ongoing debates about voting technology in the growing literature on election science, underscoring the existence of trade-offs between the possibility of electronic hacking by outside actors, on one hand, and the accuracy of “hacking-proof” hand counts on the other (Dee Reference Dee2007; Posner Reference Posner2000). A subset of our results additionally speaks to scholarship on the quality of poll workers. That literature finds that voter satisfaction with poll workers correlates with voter confidence in the fairness of elections and the accuracy of the vote count in the USA (Claassen et al. Reference Claassen, Magleby, Monson and Patterson2008; Hall, Monson, and Patterson Reference Hall, Monson and Patterson2009). Our analysis allows for much stronger causal identification. We provide further discussion of the relevant literature in the Appendix for reasons of space.
Finally, considering the literature on elections more broadly—including both empirical and game-theoretic work—our findings call into question the common assumption that converting cast votes into vote totals is a frictionless process, even in the absence of electoral malfeasance.
Context: The Counting of Votes in Mexican Elections
Mexico experienced electoral authoritarian government for most of the 20th century. After a series of crises, in the 1990s the major political parties negotiated a set of profound reforms to the electoral system that turned Mexico’s regime into a democracy. The reformed system was designed to render partisan manipulation of elections very difficult. Its features included a transparent and reliable list of registered voters, a highly regulated process to select citizens to function as poll workers responsible for counting votes, and an independent bureaucracy charged with organizing elections and producing official electoral results—the Instituto Federal Electoral (now Instituto Nacional Electoral or INE).
Precincts (Secciones) and Polling Stations
The basic unit of Mexico’s electoral geography is the sección electoral (subsequently precinct). Every precinct contains one or more polling stations (henceforth PS), depending on the number of voters registered in the precinct. To provide a sense for the magnitudes: there were 62,692 precincts and 129,238 PSs in the 2012 presidential election. The average precinct covers about 1,200 registered voters. A strictly-enforced maximum of 750 registered voters can be assigned to vote at any given PS. This maximum determines the total number of polling stations needed in an election. Registered citizens are apportioned equally across the PSs in a precinct. For example, in a precinct containing 752 citizens, two PSs will exist, with 376 citizens assigned to each. The first PS in a precinct is known as the básica (basic) PS, the second PS is called contigua 1 (contiguous 1), the third is contigua 2, and so on. Within a given precinct, polling stations are expected to have about the same number of total votes and vote shares across parties because voters are assigned to them in a quasi-random way.
Mexican law requires that votes be tallied by randomly selected citizens who function as polling-station workers (henceforth PW). This is a very challenging logistical feat. Each PS is allocated four acting PWs and three substitute PWs (the number is greater in concurrent elections). To be eligible, a citizen must not work for a political party and must be able to read and write, among other things. The general functions of the PW team for a given PS are to staff the PS during Election Day, to make sure only those eligible to vote at the PS do so, to count the votes by hand after the close of voting, and to fill out the acta that same evening. PWs are trained by INE. The procedure for allocating PWs to PSs is described later in the paper.
Political parties are entitled to send official party representatives to sit at the PSs along with PWs. They can observe the work of the PW, but they have no formal role in the ballot counting or in the filling out of the actas.
Data
We use seven sources of data. The main dataset contains measures of inconsistencies for each PS in the elections of 2009, 2012, and 2015. A second dataset describes the individual citizens who staffed each PS. A third one contains information on official aggregate vote results for every political party at the PS level for each election. A fourth data source describes recounts at the PS level. A fifth one documents the presence of political-party representatives at the PS level. A sixth one is our survey of PWs about attitudes, political behavior, and demographics. Finally, we use sociodemographic data from the 2010 Population Census at the precinct level.Footnote 6 For brevity, we only describe some of these in the main text and provide detailed descriptions of all data sources in the Appendix.
Data on Inconsistencies
For internal purposes, INE collects data on various types of inconsistencies in the PS vote tallies (actas). This is a massive undertaking as it covers tens of thousands of PSs in every election. We observe four numerical measures of inconsistencies in vote tallies at the PS level for the universe of such tallies from the Mexican federal elections of 2009 (legislative, lower house), 2012 (executive and legislative, both houses), and 2015 (legislative, lower house). The following pieces of information constitute the building blocks for the measures of inconsistencies we employ:
• PV (personas que votaron): Total number of votes cast as checked off by the PW on the official voter list for the PS.
• RPPV (representantes de partidos políticos que votaron): Total number of votes cast in the PS by official representatives of political parties. Party representatives can cast a vote even if they are not on the voter list for the PS.
• SV (suma de votantes): Total number of votes cast in the PS, computed by the PW as the sum of PV + RPPV.
• BSU (boletas sacadas de las urnas): Total number of ballots extracted from the ballot box.
• RV (resultados de la votación): The sum of subtotals of votes cast for each of the political parties on the ballot plus write-ins and null ballots.
• BS (boletas sobrantes): The number of ballots that remain unused at the end of Election Day.
• TBE (total de boletas entregadas): The total number of blank ballots provided to the PS before the voting began, computed as the number of voters in the official voter list for the PS plus two ballots for each of the political parties listed on the ballot (since up to two representatives for every party can cast their votes in a PS where they are not registered but work as observers).
If an acta is filled out with no inconsistencies, the following equalities should hold:
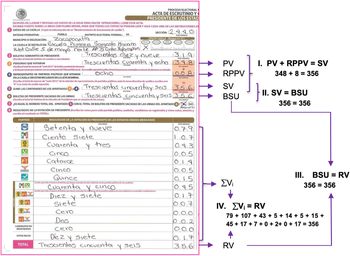
Inconsistency 1: “Correct Sum of Voters.” Meaning that SV = PV + RPPV (the sum of people who voted and party representatives who voted should be algebraically correct. This is just a sum performed by PWs).
Inconsistency 2: “Voters = Ballots.” Meaning that SV = BSU (the number of people and party representatives who voted should equal the number of ballots extracted from the ballot box).
Inconsistency 3: “Votes Cast = Ballots.” Meaning that RV = BSU (the sum of votes for parties, write-ins, and null ballots should equal the number of ballots extracted from the ballot box).
Inconsistency 4: “Ballot Balance.” Meaning that BS = TBE − BSU (the number of unused ballots should equal the total number of ballots provided minus the number of ballots extracted from the ballot box).
We define an inconsistency as a failure of one of the above equalities. These measures of inconsistency were devised by INE. The INE has used them at least since 2012 in order to internally describe the quality of the tallies in national elections. Note that some inconsistencies involve algebraic mistakes while others involve actual numbers of ballots. A sample acta fragment is shown in Figure 1, illustrating the first three of our four measures.Footnote 7
Sample Acta and Corresponding Inconsistency Measures

Effect of Poll-Workers’ Education on Tally Quality: IV Estimates

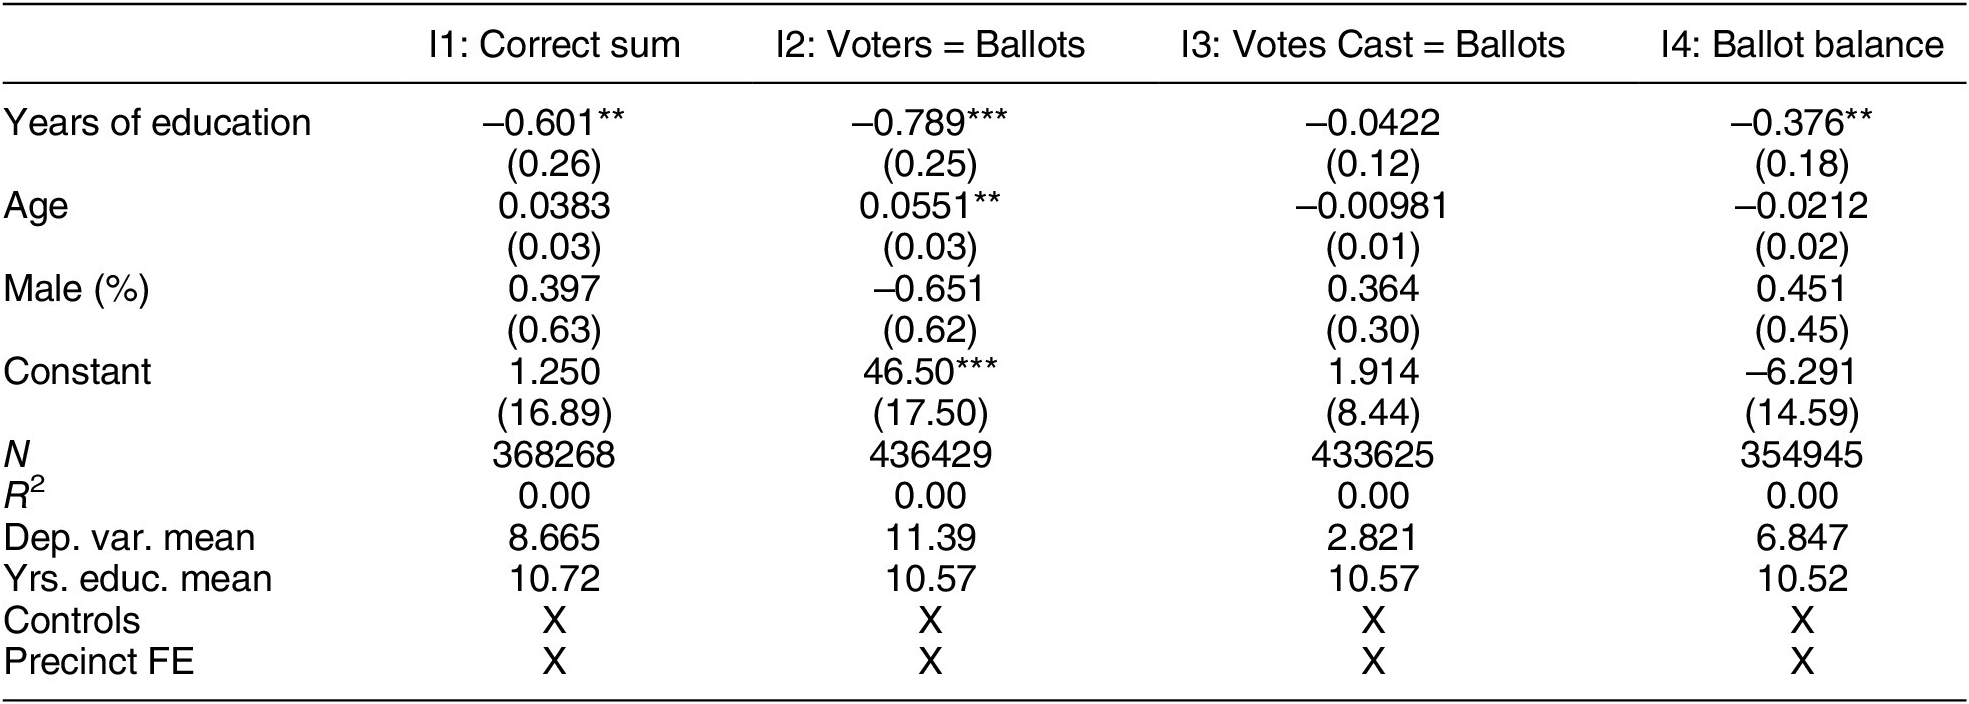
Note: This table presents the instrumental variable estimates for the system defined by Equations 1 and 2. Results from Equation 2 are presented in the Appendix, while this table presents results from Equation 1. The analysis excludes precincts containing only one PS as well as PSs located in atypical precincts containing more than 14 PSs each. Since we include precinct FE, we do not include precinct-level controls. We control for average age, educational attainment, and gender of the PWs in each PS, along with various traits of the INE recruiter for that PS (described in footnote 11). The number of observations varies because of missing values in the dependent variable. Errors are clustered at the precinct–year level. *** p < 0.01, ** p < 0.05, * p < 0.10.
Data on Recounts
Our data indicate whether the votes in a given PS were recounted in each of the federal elections in 2009, 2012, and 2015. There were 34,795, 198,007, and 77,113 tallies recounted in 2009, 2012, and 2015, respectively. These amount to 27.6, 51.1, and 62.5% of the total number of tallies in the corresponding election years.
Other Data
Administrative data on poll workers: For each PW we observe age, gender, and years of education completed. On average, PWs are in their late thirties, close to 42% are male and have completed about 11 to 12 years of education.
Survey of poll workers: The survey, designed by us, elicited basic sociodemographic information and a series of political and nonpolitical attitudes. The survey was fielded in the context of the 2017 local elections in the states of Coahuila, Estado de Mexico, Nayarit, and Veracruz (these were the only states holding elections that year). The survey was distributed to a random sample of 77,000 citizen PWs. The specific questions are described in the notes to Table 4.
Precinct-level administrative data: The INE and INEGI provide a version of the Population Census (2010) at the precinct level. The data cover 66,740 precincts. The basic set of 15 precinct-level control variables that we use in the analysis is drawn from this dataset.
Prevalence and Partisanship of Vote Tally Inconsistencies
Inconsistencies in vote tallies are prevalent, they are a nationwide problem in Mexico, and they do not seem to be going away. Part B of Appendix Table A1 provides descriptive statistics for each of the tally inconsistency measures defined previously. The first four lines describe the average (absolute) discrepancy between the two sides of the corresponding equality. This is a measure of the extent of inconsistency. For example, in the 2012 Presidential elections, equality 2 failed to hold by an average of 10.2 votes. We henceforth refer to these measures as “inconsistencies.” The last four lines in Part B of the table describe the percentage of PSs where the corresponding equality did not hold. This is a measure of the presence of inconsistencies that does not consider their extent. For example, equality 1 failed to hold in 9% of PSs in the 2012 presidential election. Type 2 and 4 inconsistencies are the most common, with around 25–38% of PSs displaying these. There is no indication of temporal trends in either the extent or the presence of inconsistencies at the country level. Appendix Figure A2 displays the geographical distribution of inconsistencies across electoral districts.
As mentioned previously, Mexico’s electoral history makes it necessary to explore whether the inconsistencies we study reflect partisan manipulation or unintentional mistakes.Footnote 8 Some kinds of partisan fraud could in theory result in the kinds of inconsistencies we study. For example, if the cheating party stuffed ballot boxes with extra, pre-marked ballots, then the number of people checked off on the voter list (SV) would be smaller than the number of ballots in the ballot box (BSU), violating the second equality (Voters = Ballots). Many other kinds of electoral manipulation, however, would not result in inconsistencies in the tallies. These include padding the voter lists and tampering with the aggregate vote count. In today’s Mexico, these forms of electoral manipulation have become the exception rather than the rule (Cantú Reference Cantú2014). Electoral manipulation in today’s Mexico takes primarily the form of vote buying and violations of campaign finance (Serra Reference Serra2016). While reprehensible and illegal, vote buying and campaign finance violations are not causes of inconsistencies in the tallies.
The fact that inconsistencies in the tallies are an important cause of recounts could give rise to a mixed set of incentives for political parties and their representatives at the PSs. On one hand, if a party were cheating in a particular PS it might wish to avoid inconsistencies in order to avoid scrutiny. On the other hand, a party that stood to lose in a given PS could benefit from inducing a recount (or, in the limit, an annulment) and therefore would benefit from creating inconsistencies in the tally.Footnote 9
Political parties, however, have very limited means to influence whether or not a tally displays inconsistencies because the tallying is done by nonmilitant citizen PWs selected at random. Political parties have the right to send representatives to every PS to observe the tallying, but these representatives have no formal authority with respect to the PWs and the vote tally. Still they could attempt to informally influence the PW team, for example, in decisions about whether a particular ballot was marked in a valid way or ought to be deemed invalid. They could also check the tally and ask for the PW to resolve any inconsistencies—but there is no obvious way in which a representative could induce inconsistencies in the tally.
To empirically investigate the possibility that inconsistencies might have partisan causes, we run the following set of analyses. First, we check the association between the fraction of the vote that goes to each of the political parties and the extent of inconsistencies. Second, we study the association between the presence of party representatives for specific parties in a given PS and the extent of inconsistencies. Third, we check whether the extent of inconsistencies in a given PS persists over time through different elections. This last analysis tests for the possibility that the influence of political parties on inconsistencies might depend on the local organizational capabilities (the “machine”) of the parties, which should ostensibly persist over the period covered by our data. The full details of these analyses are provided in the Appendix for reasons of space.
We find that the estimated association between the party vote and tally inconsistencies is substantively tiny. For example, an additional 494 inconsistencies of type 1, or 2,048 fewer inconsistencies of type 3, would be required to “generate” one additional vote for the PRD (Partido de la Revolución Democrática) (Tables A4 and A5 in the Appendix). These estimates do not support the hypothesis that inconsistencies reflect partisan electoral malfeasance. We repeat this analysis at the state-election and district-election levels, with similar results (Figure A3). We next find that the presence of political-party representatives at the PS is not an important correlate of inconsistencies. The presence of a PAN (Partido Acción Nacional) representative, for example, is associated with an additional 0.21 inconsistencies of type 1 or 0.25 of type 3, but neither estimate is statistically significant (Table A6). We further find that the presence of party representatives does not moderate the relationship between inconsistencies and the partisan vote (Table A7). Finally, we find that inconsistencies do not persist over time within precincts (Table A8). As is true for any forensic analysis, these results rule out many kinds of malfeasance but not every possible kind. Overall, however, the results, together with the scholarly consensus on the state of contemporary Mexican elections suggest that inconsistencies do not arise out of partisan manipulation but instead primarily reflect honest mistakes. The next section shows some positive evidence in this regard.
Causes of Inconsistencies in Vote Tallies
The evidence so far suggests that inconsistencies in vote tallies do not reflect malfeasance. We therefore look for causes of inconsistencies in factors that could plausibly drive honest mistakes when tallying votes. We find clear causal evidence that the educational attainment of those selected as poll workers, the difficulty of the tallying task, and the workload of the PW increase the incidence of inconsistencies in vote tallies.
Education
Does the quality of vote tallies depend on the education/numeracy of the citizens selected to function as PW? Ex ante, we are agnostic on this point. Lower educational attainment could make it more difficult for poll workers to successfully complete their tallying tasks without mistakes. At the same time, anecdotal evidence has led some INE officials to believe that PWs with lower educational attainment take their vote-tallying tasks more seriously and therefore exert greater effort than their more-educated peers. Simply regressing the extent of inconsistencies on the educational attainment of PWs could potentially be subject to concerns about omitted variable bias. To mitigate this possibility, because the average level of education in the population is likely different across precincts, we focus on variation in educational attainment across PSs within a precinct. In addition, we use an exogenous source of within-precinct variation in the educational attainment of PWs based on the procedure used to allocate PWs across PSs.
The allocation begins with a list of citizens recruited to be PW at a given precinct. These PWs are allocated to the various PSs within their precinct according to a strict rule: The person with the highest educational attainment is named President of the first PS in the precinct (“casilla básica”); the second most-educated person is named President of the second PS (“casilla contigua 1”), and so on. Once all PSs in the precinct have been assigned a President, the next most-highly educated person in the pool is assigned to be Secretary of the first PS; the next one is named Secretary of the second PS, and so forth. The assignment procedure continues until every PS has a full set of PWs (either four or six PWs, plus substitutes, depending on the number of concurrent elections).Footnote 10
This allocation rule has the consequence that the team of PWs assigned to the first polling station (básica) in a precinct has a higher level of educational attainment—both position by position as well as on average—than the PW team assigned to the second polling station (contigua 1), which in turn has a higher level of education than the team assigned to the third polling station (contigua 2), and so on. Figure A4 in the Appendix shows that, indeed, PSs within a precinct are ranked by education. Part (b) in that figure shows that on average, PWs working at first-ranked (básica) polling stations have approximately 0.6 more years of education than second-ranked (contigua 1) polling stations, 0.9 more than third-ranked polling stations, and 1.0 more than fourth-ranked polling stations. Crucially, this variation is entirely due to the allocation rule, and it is therefore plausibly orthogonal to potentially confounding traits of the polling stations. On this basis, we implement the following instrumental-variables strategy:
 $$ AbsNumIn{c}_{pste}^j={X}_{\mathrm{pst}}^{\prime}\alpha +{\beta}^j{S}_{\mathrm{pst}}+{n}_{\mathrm{st}}+{u}_{\mathrm{pst}\mathrm{e}}\kern1.00em $$
and
 $$ {\displaystyle \begin{array}{ccc}{S}_{\mathrm{pst}}={X}_{\mathrm{pst}}^{\prime }{\pi}_0+1\left({B}_{\mathrm{pst}}\right){\pi}_1+{n}_{\mathrm{st}}+{e}_{\mathrm{pst}},& & \end{array}} $$
where j indexes the type of inconsistency,  $$ {S}_{\mathrm{pst}} $$ is the average years of educational attainment of the PW team at PS
 $$ p $$ in precinct
 $$ s $$ in election-year
 $$ t $$,
 $$ {X}_{\mathrm{pst}} $$ is a matrix of covariates that includes the average age and the fraction who are female of the PW team for PS
 $$ p $$ in precinct
 $$ s $$ in election year
 $$ t $$ as well as various traits of the recruiter who recruited and trained the PWs in all PSs in precinct
 $$ s $$,Footnote 11
 $$ 1\left({B}_{\mathrm{pst}}\right) $$ is an indicator that PS
 $$ p $$ in precinct
 $$ s $$ in election year
 $$ t $$ is the first PS (básica), and
 $$ {n}_{\mathrm{st}} $$ are precinct–year dummies. The coefficients of interest are the
 $$ {\beta}^j $$.
The first stage is very strong, as expected, with  $$ {\pi}_1=0.743 $$, a t-statistic above 180, and an F-statistic of 5,871 (Table A9). The reason for this strong first stage, even when errors are clustered at the precinct level, is that the number of observations is very large and the allocation rule is followed strictly. Table 1 displays the second-stage estimates. An additional year of average education in a PS reduces the absolute number of inconsistencies of type 1 by 0.60, of type 2 by 0.79, of type 3 by 0.04, and of type 4 by 0.38. These represent 7, 7, 1, and 5% of the corresponding means. These estimates are statistically significant, except in the case of type-3 inconsistencies. These results imply that selecting PWs with greater educational attainment would result in vote tallies with fewer inconsistencies.Footnote 12
Difficulty
Insofar as education, numeracy, or training matter for the quality of vote tallying, one would expect that more difficult tallies should on average exhibit more inconsistencies than easier ones. To explore this possibility, we construct a measure of the difficulty of the tallying task. One natural measure of tallying difficulty is the arithmetical difficulty of a sum. The first type of inconsistency requires that PWs perform a sum. The sum generally involves a “large” number (i.e., the number of votes cast in a PS, which is usually in the hundreds) and a “small” one (i.e., the number of party representatives who cast votes in the PS, usually smaller than 10). We classify such a sum as “difficult” if it involves carrying one over and as “easy” if it does not.Footnote 13 We construct a dummy variable that takes the value of 1 when the sum that a PW needs to perform is “difficult” and the value of 0 when it is “easy.” Close to 35% of the tallies contain difficult sums.
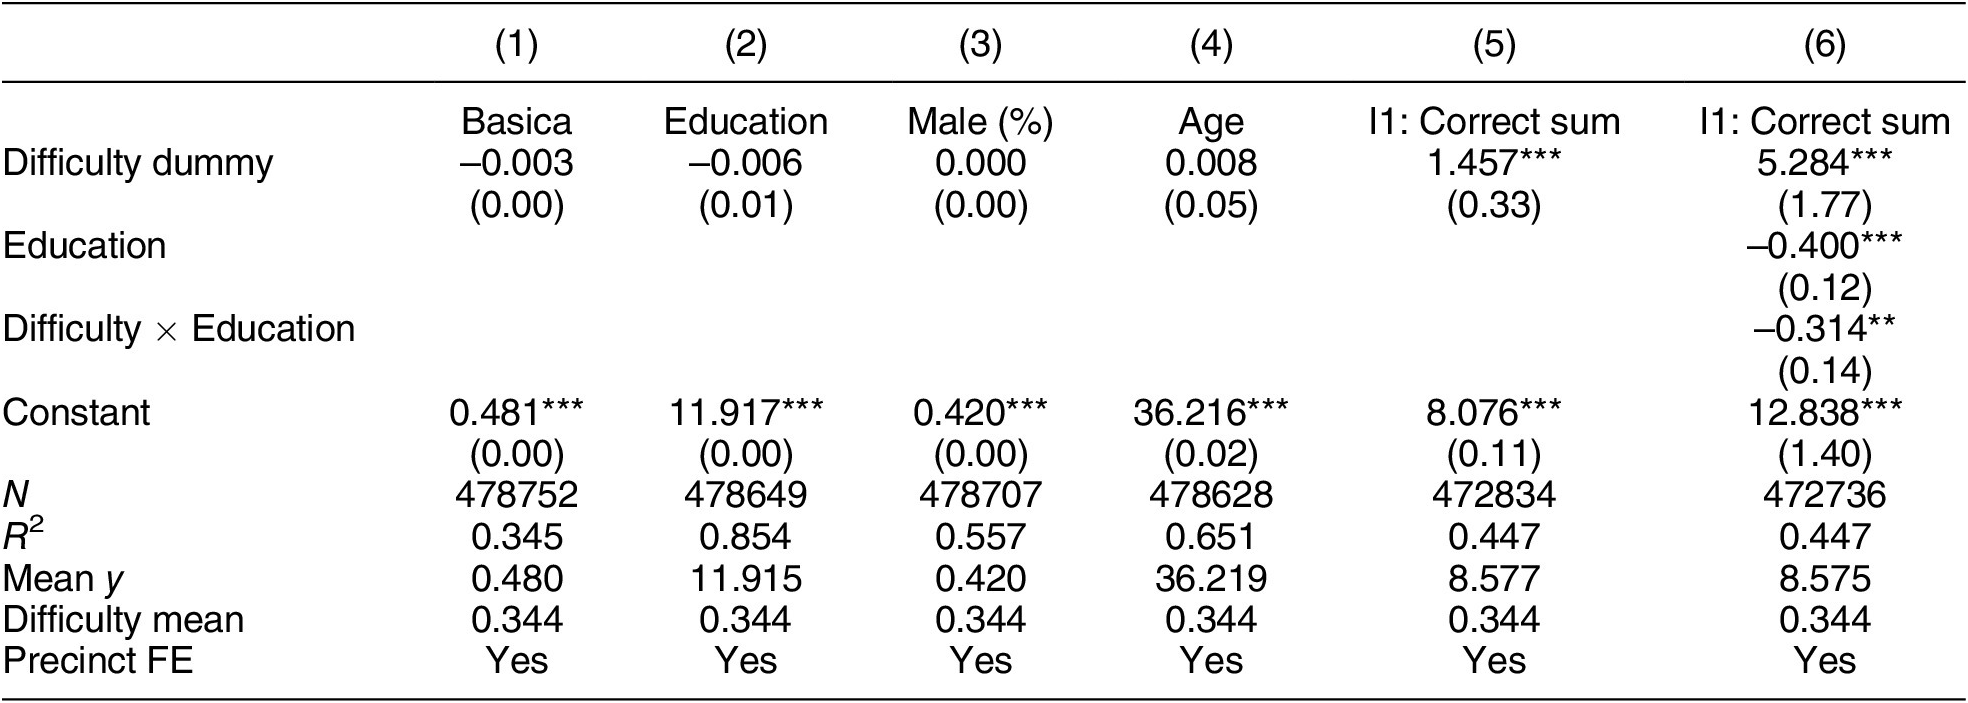
We believe the difficulty of the sum, thus defined, can be regarded as exogenous with respect to inconsistencies in the tally. For one thing, it depends to a large extent on the last digit of the total number of votes cast in a PS. Crucially, whether turnout is low or high should have no bearing on the last digit of the total number of voters. Still, we check for balance on observables between those tallies where the sum in question is difficult versus those where it is easy. Table 2 presents the results of the balance tests. Each of the first four columns represents the regression of a predetermined covariate on the difficulty dummy. These covariates are a dummy indicating whether the PS is the first one (básica) in the precinct or not, the average years of education of PWs in the PS, the share of male PWs within the team at the PS, and the average age of the PW team at the PS. As before, the estimates are based on variation across PSs within a precinct (i.e., they include precinct fixed effects). As expected, there is no difference in any of the covariates between PSs with a difficult versus an easy sum.
Effect of Tallying Difficulty on Tally Quality

Note: Columns 1–4 display balance tests, where a predetermined covariate is regressed on the difficulty dummy:  $$ \mathrm{Predetermine}{d}_{\mathrm{pste}}=\alpha +\upgamma \mathrm{DifficultyDumm}{y}_{\mathrm{pste}}+{n}_{\mathrm{st}}+{\epsilon}_{\mathrm{pste}} $$. Such covariates include an indicator for whether the PS is first-ranked (basica), the average education of PWs at the PS, the fraction of male PWs at the PS, and the average age of PWs at the PS. Variables are indexed by PS
 $$ p $$, precinct
 $$ s $$, election year
 $$ t $$, and election-type
 $$ e $$. The unit of observation is an acta. Columns 5 and 6 show the effect on inconsistencies of type 1; the dependent variable in these two last columns is
 $$ \mathrm{AbsNumIn}{c}_{\mathrm{pste}}^1 $$, the absolute number of inconsistencies of type 1. Standard errors are clustered at the precinct–year level shown in parentheses below coefficient estimates. *** P < 0.01, ** p < 0.05, * p < 0.10.
Column 5 displays the effect of the difficulty indicator on the extent of inconsistencies of type 1 (the type that involves the aforementioned sum). A difficult sum, in comparison with an easy one, increases the extent of inconsistencies by 1.5—that is, 17% of the average extent of inconsistencies of type 1. To further probe whether our measure of difficulty indeed relates to the kinds of skills that presumably correlate with formal education, we study whether the effect of difficulty on inconsistencies is moderated by the education of the PW. In column 6 we interact the difficulty dummy with the average educational attainment of the PW team in the relevant PS. As before, the main effect of average education is negative. The effect of difficulty, however, is a function of education. Every additional year of educational attainment reduces the effect of difficulty on the extent of inconsistencies by 0.31. The coefficient on the difficulty dummy is 5.3, implying that the effect of difficulty on inconsistencies is completely nullified when the average level of educational attainment among PS workers is about 16 to 17 years.
Workload
The final cause of tally quality that we test is the workload faced by poll workers. The issue of workload figures prominently in current debates in Mexico. On Election Day, a PW spends about 12 hours staffing and managing her assigned precinct and then about three additional hours tallying up the votes and filling out the tally forms (Figure A10). The INE is concerned that excessive workload could lower the quality of the vote tallies.Footnote 14 They may be justified: a large literature in psychology and neuroscience shows that attention, self-control, and cognitive function in general are subject to fatigue through mechanisms such as glucose depletion.Footnote 15 In fact, the rule that polling stations should have no more than 750 voters was motivated by the desire to limit workload and reduce PW mistakes, and INE is considering implementing electronic voting to further reduce the burden on PWs.Footnote 16 Academics and policy makers have similarly used a workload argument to support electronic voting,Footnote 17 but unfortunately there seems to exist no quantitative evidence for or against the workload conjecture.
The ideal experiment to test the workload hypothesis would allocate more (or fewer) voters randomly to some polling stations and measure how this translates into more or fewer mistakes in the tally for the PS. We approximate the notional experiment through a natural experiment. Specifically, we exploit the previously mentioned fact that precincts are capped at 750 registered voters by law. If the number of registered voters in a precinct exceeds 750, an additional PS is added and the voters are apportioned equally across all the PSs in that precinct. This rule, therefore, generates a discontinuity in the number of registered voters assigned to each PS at precinct sizes that are multiples of 750 where we can apply a regression discontinuity (RD) methodology. For instance, a precinct with 750 registered voters only has one PS, while a precinct with 751 registered voters has two PSs, respectively, with 375 and 376 registered voters each. This legal cap on PS size is followed strictly (Figure A6).
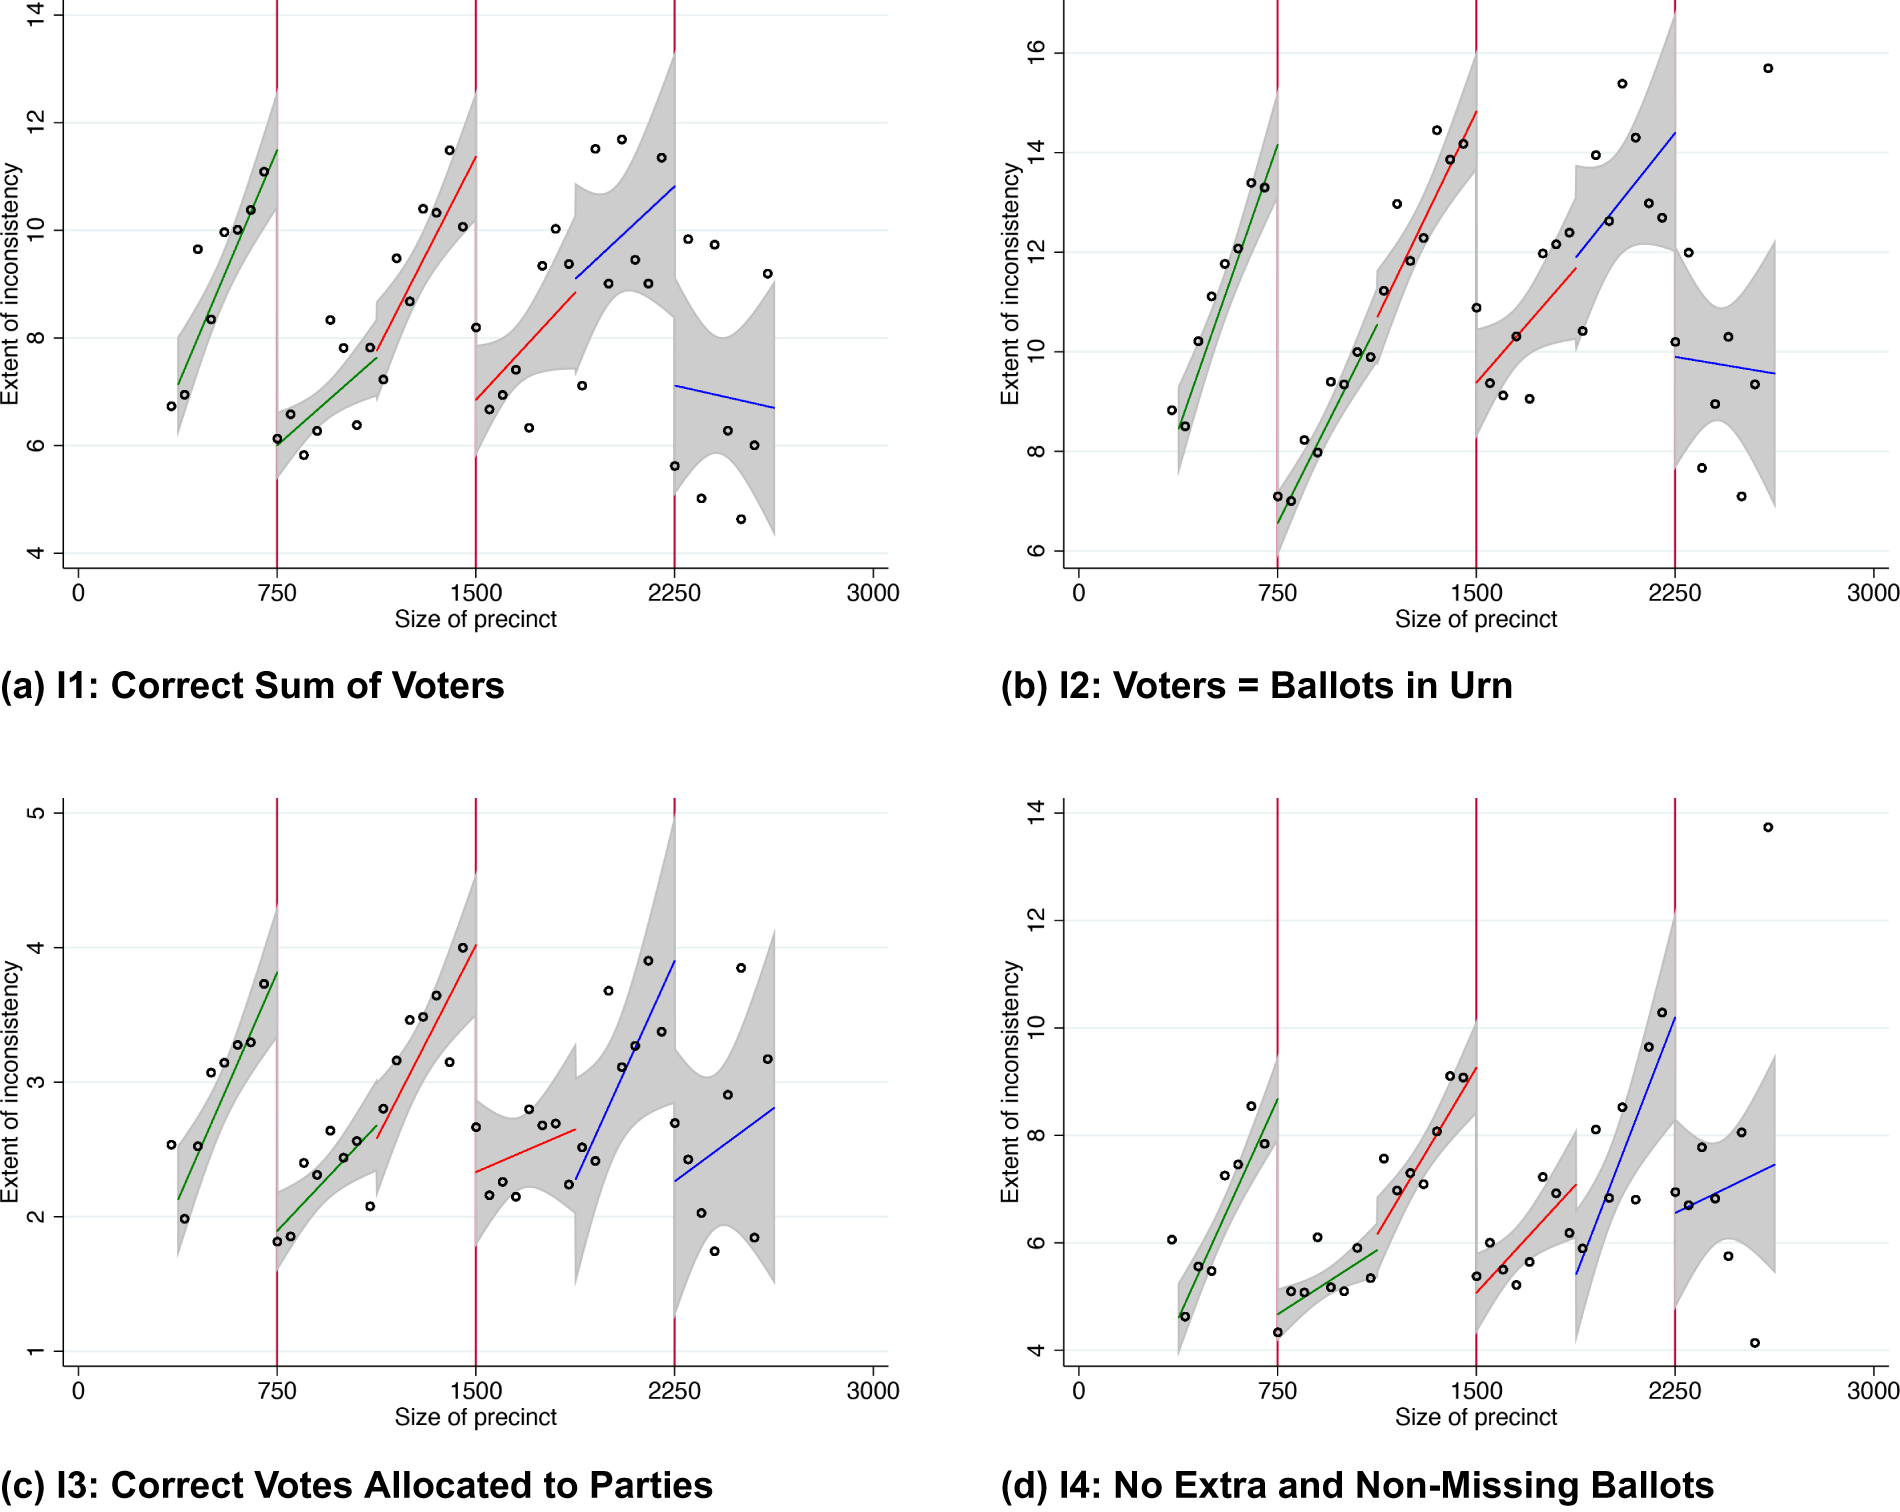
To estimate the causal effect of workload on the extent of inconsistencies, we implement a regression discontinuity analysis. In the online Appendix we present McCrary density tests (Figure A7) and smoothness/balance tests (Figure A8 and Table A10), which lend strong support to the RD identification assumptions. Figure 2 presents the main results graphically, separately for each of the four types of inconsistencies. The horizontal axes describe the number of registered voters in a precinct, while the vertical axes represent the extent (absolute number) of inconsistencies (one inconsistency type is shown in each panel). The vertical lines indicate the number of registered voters at which an additional PS is to be added, inducing the jump in the number of registered voters per PS in the precinct that we use to identify causality. The regression estimates corresponding to the figure are provided in Table A11 in the Appendix.
Effect of Workload on Tally Quality (Regression Discontinuity Analysis)

The pattern that emerges from the figure is quite clear: workload—the number of ballots to be tallied— causes inconsistencies. The figure shows, for example, that number of inconsistencies is halved at 751 registered voters and again decreases sharply at 1,501 registered voters. In between the discontinuity points, the slope (inconsistencies per registered voter) is positive and practically linear. This pattern is present for each of the four types of inconsistencies. Respectively, the extent of inconsistencies for types 1, 2, 3, and 4 decreases by 5.5, 7.6, 1.9, and 4.0 at the 751 discontinuity (the mean extent of inconsistencies just below the 751 cutoff is roughly 10, 14, 5, and 7 for each of the types 1–4, respectively). These are substantial decreases, and they are all precisely estimated (with t-statistics above 5).
Generally speaking, one might postulate two simple models of inconsistencies as a function of workload. The first is simply that each vote has some probability of being erroneously tallied, independently of how many votes have been counted before it. This model would imply that the level of mistakes increases proportionally to the workload (i.e., to the number of votes counted). A second model, consistent with fatigue explanations, is that mistakes are a convex (instead of linear) function of total votes. In this case, the likelihood that an additional vote is miscounted would increase with the number of votes counted previously by the PW team on election night. This distinction has important policy implications. In the second model, further reductions in the number of registered voters per PS—a policy measure that INE has considered—would reduce the extent of inconsistencies, but this would not be true in the first model.
Figure 2 suggests that the relationship between workload and inconsistencies is in fact linear, at least within the range of workloads we observe. To investigate this further, we redefine the dependent variable as the ratio of the extent of inconsistencies over the workload (number of votes counted) in a PS. We find (Figure A9) that the slope is practically flat and there is no jump in inconsistencies at the discontinuity points—that is, the rate of inconsistencies per vote counted is approximately constant.Footnote 18
Consequences of Inconsistencies
To be sure, mistakes in vote tallies, even if nonpartisan in nature, violate basic tenets of democratic fairness and are therefore undesirable. But inconsistencies in tallies also have serious practical consequences. For one thing, they can be, and often are, used by politicians to undercut the legitimacy of an electoral result or of democratic institutions themselves. We indeed find that inconsistencies in vote tallies make recounts substantially more likely and that in doing so they erode public trust in the electoral authorities.Footnote 19
Tally Quality and Ballot Recounts
Inconsistent vote tallies provide a legal basis for ballot recounts in Mexico and other countries (Table A12). In a sample of 177 countries, 92% have legal provisions that contemplate the possibility of ballot recounts (Figure A12). Mexican electoral law establishes the causes that can give rise to a recount. For purposes of this paper, the law establishes that if there are inconsistencies in a vote tally, an official political party representative can request a recount. The electoral authorities cannot choose to perform a recount based on tally inconsistencies without the explicit request of a political party representative. In practice, more than one-third of PSs with tally inconsistencies do not get recounted.
Recounts are political ammunition often used to question election results. In Mexico politicians frequently cite tally inconsistencies as evidence of fraud and to request recounts. Serra (Reference Serra2014), for example, relates that extensive recounts requested by the runner-up in the 2006 presidential election in Mexico did not change the electoral results, but they were used as the basis for accusing the authorities of having committed election fraud and for mobilizing over one million people to the streets in protest.Footnote 20
To study the relationship between inconsistencies and recounts, we create a dummy variable indicating whether a PS was subject to a recount. The share of PSs subject to a recount ranges in our data between 27% (in the 2009 legislative elections) and 62% (in the 2015 legislative elections). The mean over the five national elections in our data is 48.6%. We estimate the relationship between the presence of inconsistencies and the likelihood of a recount using the following linear probability model:
 $$ {\displaystyle \begin{array}{ccc}1{\left( PS\_ Recounted\right)}_{pste}=\alpha +{\beta}^j1\left( AbsNumIn{c}_{pste}^j>0\right)+{n}_{st}+{\epsilon}_{pste,}& & \end{array}} $$
where  $$ 1{\left( PS\_ Recounted\right)}_{pste} $$ is a dummy variable indicating that PS
 $$ p $$ in precinct
 $$ s $$ in year
 $$ t $$ and election-type
 $$ e $$ was recounted and 1(
 $$ AbsNumIn{c}_{pste}^j>0 $$) is a dummy variable indicating that the number of inconsistencies of type
 $$ j=1,..,4 $$ in absolute value was greater than zero. For this analysis, we use this indicator of the presence of inconsistencies, instead of a measure of their extent, because it is their presence that the law marks as grounds for requesting a recount.Footnote 21 The unit of observation is a PS vote tally. We include precinct-year fixed effects (
 $$ {n}_{\mathrm{st}} $$) to control for location-specific variables like education, socioeconomic status of the neighborhood, and local strength of the political parties.
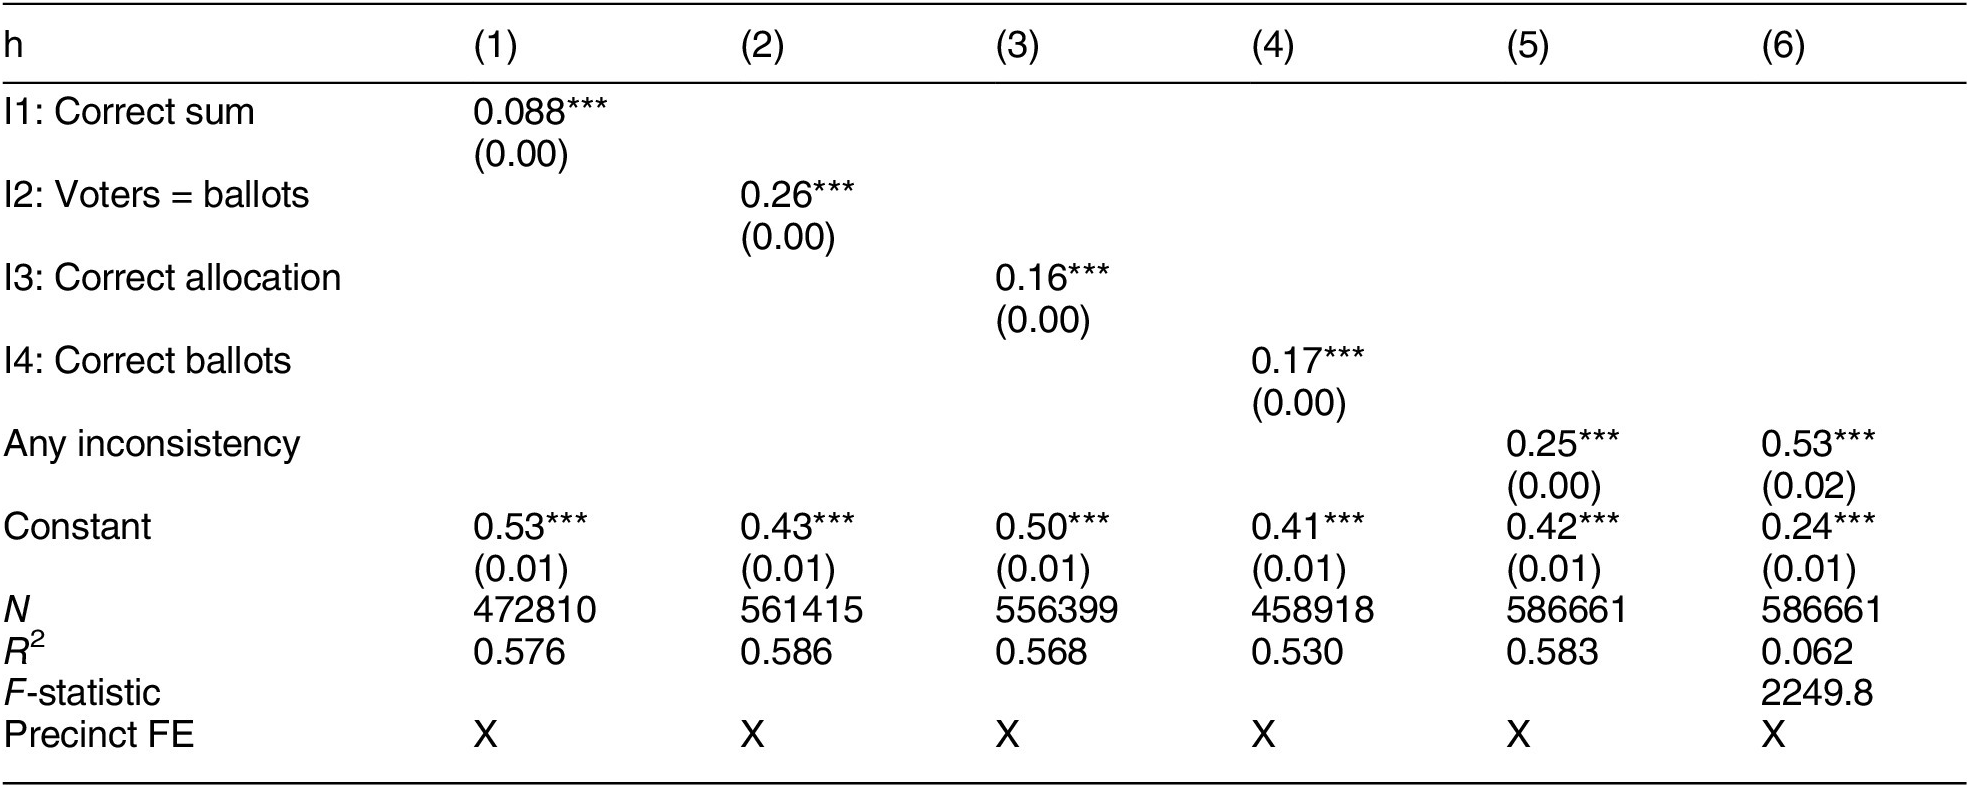
Table 3 presents the results. Columns 1–4 show that the presence of each of the four types of inconsistency is individually strongly related to the likelihood of recount, with effect sizes ranging between 8.8 and 26.0 percentage points. Column 5 shows that the presence of any inconsistency in the vote tally is associated with a 25 percentage point greater probability of a recount.
Recounts vs. Tally Quality (OLS and IV Estimates)

Note: This table shows estimates from Equation 3. The dependent variable in all columns is a dummy indicating whether a PS was subject to a recount. In columns 1–4 the main explanatory variable is an indicator for the respective inconsistency being present  $$ 1( AbsNumIn{c}_{pste}^j>\mathrm{0}),j=1,2,3,4 $$). In columns 5–6, the explanatory variable is an indicator for any of the four types of inconsistency being present. Column 6 instruments this dummy with an indicator variable for whether the PS is the first-ranked (basica) within its precinct, while column 5 is plain OLS. We include controls for gender, education, and age of PS workers. All regressions include precinct–year-level fixed effects. Standard errors are clustered at precinct–year level. *** p < 0.01, ** p < 0.05, * p < 0.10.
We emphasize that these estimates are identified based on variation between different PS within one same precinct. In other words, if the vote tally for one PS displays no inconsistencies and the tally for another PS in the same precinct does, the latter is about 25 percentage points more likely to be recounted than the former. In order to give a causal interpretation to the regression estimates, it is sufficient to assume that the various PSs within a precinct would have had the same probability of being recounted if none had displayed inconsistencies. We believe this is a reasonable assumption in light of the fact that PSs in a precinct are generally located in the same physical space (e.g., a school building), and precincts cover a narrow geographical space.
Nevertheless, we additionally implement an instrumental variables strategy. We instrument for inconsistencies with the allocation rule that determines which poll workers are assigned to which PSs within a precinct. Above we showed that a dummy variable indicating whether a PS is the first one in the precinct (básica) predicts inconsistencies.Footnote 22 The exclusion assumption is that, within a precinct, this dummy variable may only cause recounts via its effect on inconsistencies. We find no reason to believe otherwise. Column 6 of Table 3 presents the instrumental variables estimator. The result that inconsistencies cause recounts stands. In fact, the IV point estimate is larger than the comparable one based on the OLS regression (column 5).Footnote 23 The result is also robust to controlling for other major causes of recounts in the law.Footnote 24 In sum, the analysis furnishes evidence that inconsistencies in the vote tallies are an important cause of recounts.
Inconsistencies and Trust in the Electoral Authority
“Inconsistencies make it easy to sow doubts about elections and difficult to clear such doubts,” writes Schedler (Reference Schedler2009). Once they get into the public eye, inconsistencies in vote tallies can undermine trust in election outcomes and in the electoral system itself—often with the help of political rhetoric. In the Mexican case, the political use of recounts was on display in both the 2006 and the 2012 elections. Serra (Reference Serra2012) concludes that, as a result, “several institutions lost public support, especially the electoral ones.”
Media coverage of inconsistencies typically takes place in the context of partisan calls for recounts and of the recount processes themselves. To establish the fact that recounts are indeed covered by the media, we conducted a keyword search of seven major national Mexican media outlets during the six-month period following the 2018 elections. We found 157 articles mentioning vote recounts, equivalent to 22 news items per outlet in the period covered. We conducted additional searches of local media with similar results (described in the Appendix). While both media coverage and the scholarly literature suggest the possibility that recounts may erode trust in electoral institutions, this is ultimately an empirical question to which we now turn.
Having shown in the previous section that inconsistencies are an important cause of recounts, we now focus on the relationship between recounts and trust in the impartiality of electoral authorities. We measure trust through an original survey of approximately 77,000 Mexican citizens conducted in 2017 in the states of Estado de México, Veracruz, Coahuila, and Nayarit.Footnote 25 Respondents were asked to state the extent to which they agree with the statement that “INE is impartial and does not favor any political party.” Answer options consisted of a five-point scale: strongly agree (= 5), agree (= 4), neither agree nor disagree (= 3), disagree (= 2), and strongly disagree (= 1). Even with these many surveys, the data are too sparse to compute polling-station-level averages. This means that we cannot apply the instrumental variables strategy used in the previous section, which was predicated on comparing across polling stations within a precinct. Instead, the analyses in this section are based on comparisons across precincts.
To probe causality we follow six strategies. First, we use a selection-on-observables approach, controlling for large sets of covariates. We also run specifications with state, district, and municipality fixed effects. Second, we implement a variety of placebo checks on alternative outcome variables that we would not expect to be influenced by recounts. Third, we implement a sensitivity analysis that gauges the plausibility that our findings might be spuriously caused by omitted variable bias. Fourth, we implement an instrumental variables strategy. Fifth, we implement a front-door analysis as suggested by Pearl (Reference Pearl1995). Finally, we exploit heterogeneity in the margin of victory to test for a specific causal mechanism.
We begin by estimating a plain regression of trust in INE’s impartiality, measured in 2017, on the fraction of PSs in a precinct that experienced recounts in 2015, using the following model:
 $$ {\displaystyle \begin{array}{ccc} INE\_ Impartia{l}_s=\alpha +\beta FraccRecounte{d}_s+{X}_s^{\prime}\gamma +{\nu}_{s,}& & \end{array}} $$
where  $$ INE\_ Impartia{l}_s $$ is the precinct-
 $$ s $$ average of the trust question,
 $$ FraccRecounte{d}_s $$ represents the fraction of PSs presenting recounts in precinct
 $$ s $$, and
 $$ {X}_s $$ is a matrix of precinct-level controls that vary across specifications.
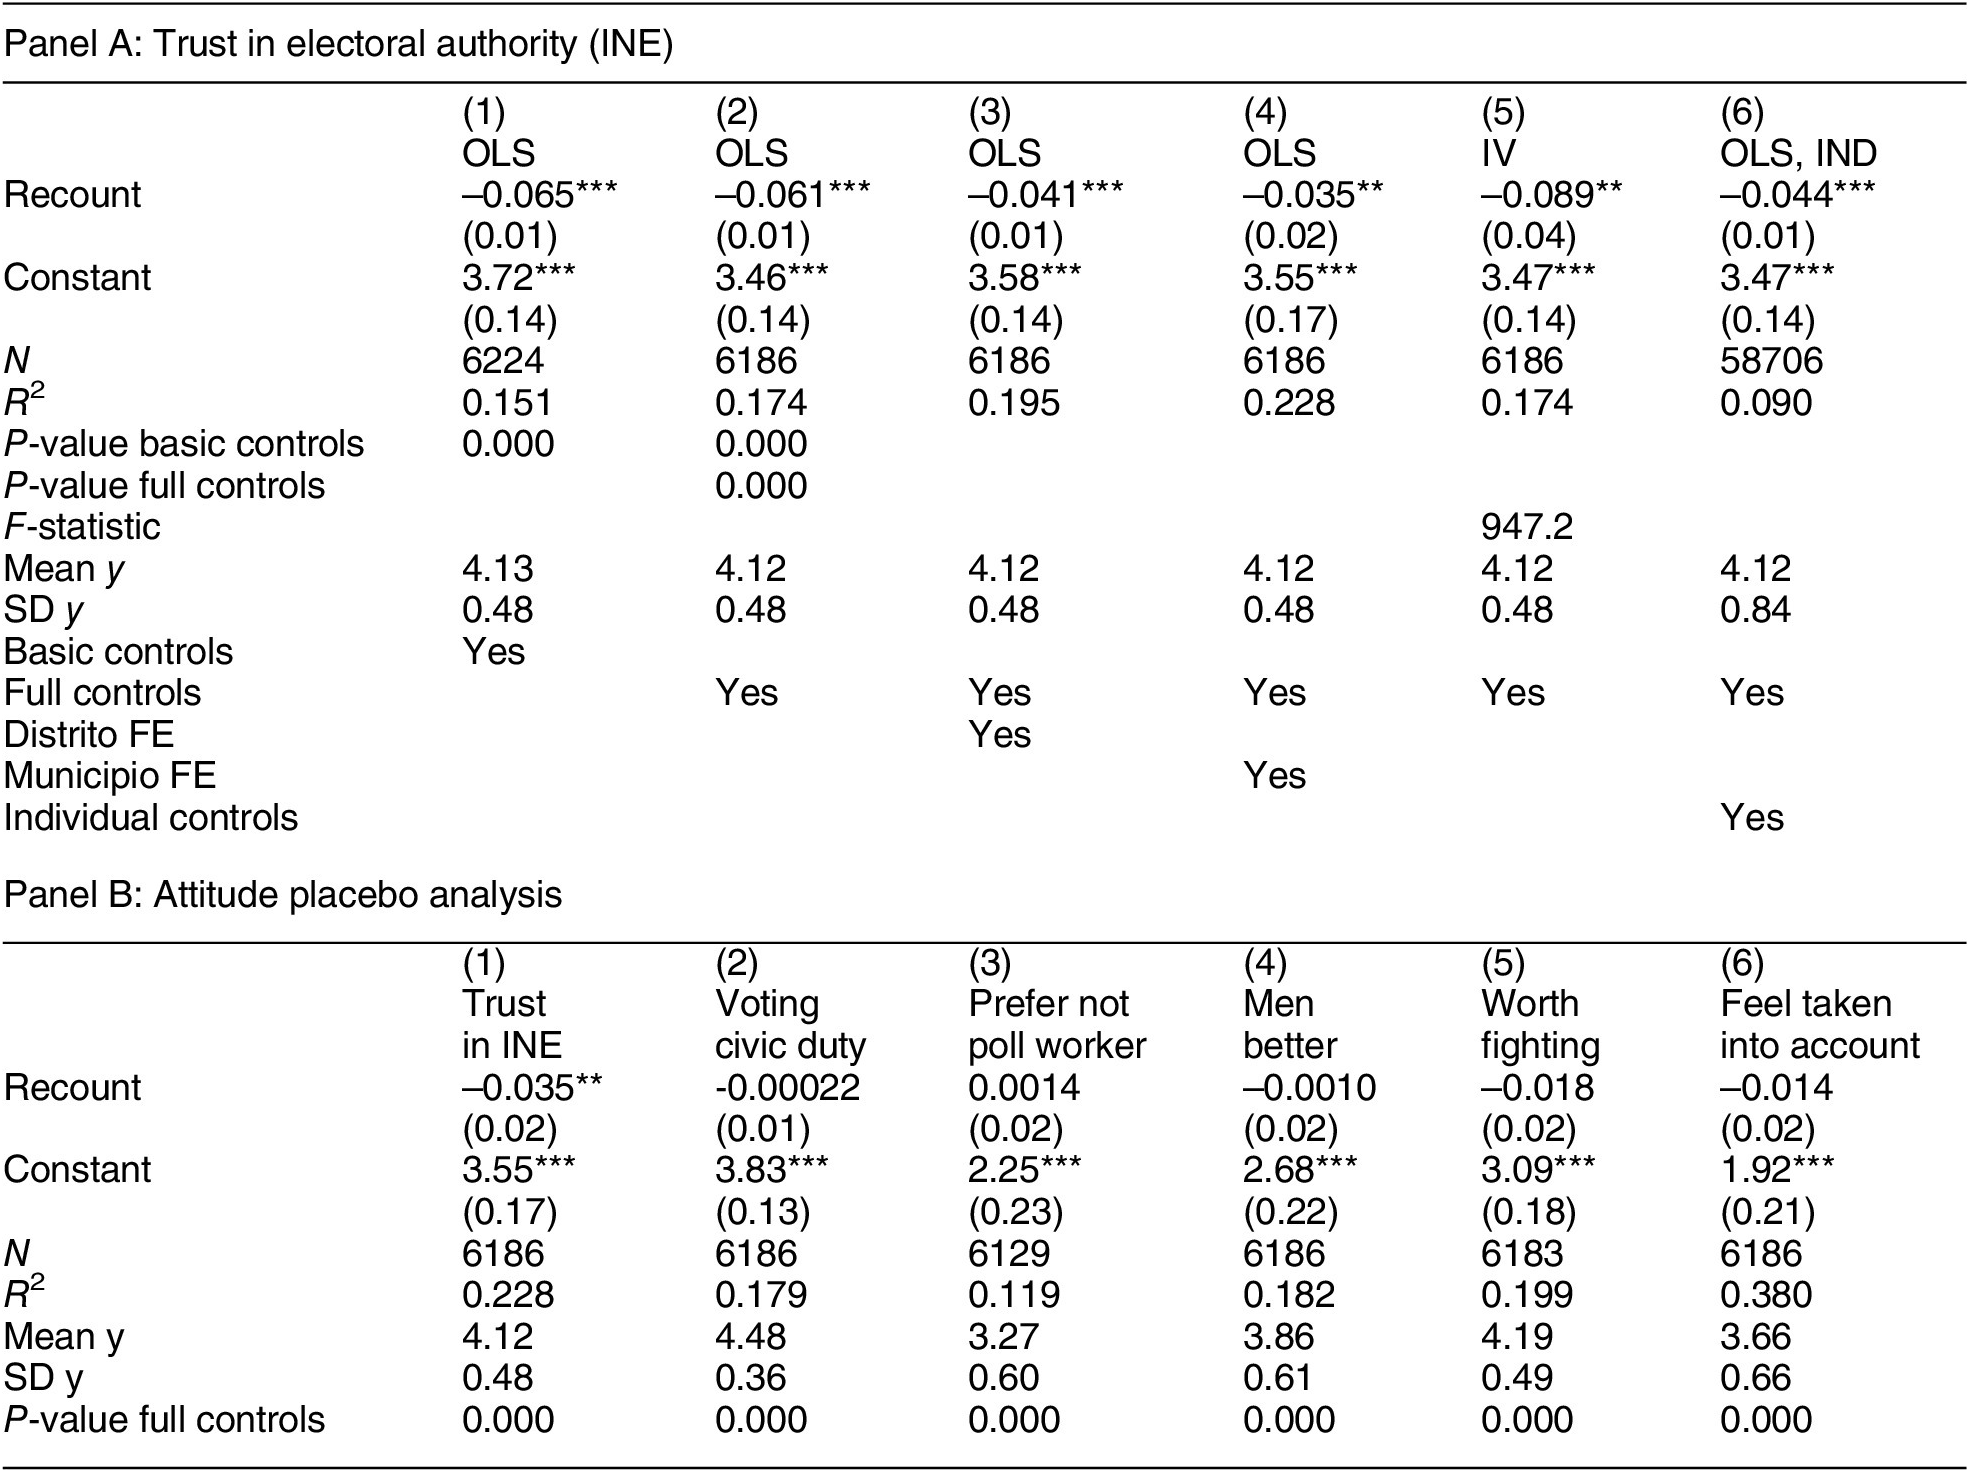
Results are shown in Table 4. Columns 1–4 (top of the table) include progressively larger sets of control variables: 15 sociodemographic controls, then the whole battery of 27 controls, and then these same 27 with additional geographic fixed effects (see the table notes for the specific regressors used). The first column shows that the greater the fraction of PSs with recounts in a precinct, the lower the perceived impartiality of the INE among those surveyed in that precinct. Comparing a precinct where no PSs display recounts with one where all PSs do, perceptions of INE impartiality are lower in the latter by 0.065, or about 13.5% of a standard deviation of the dependent variable in the regression sample. The result survives the inclusion of additional controls: the coefficient is –0.035 (p < 0.05) in the specification with municipality fixed effects and 27 precinct-level control variables (column 4). In this case, identification is based on comparing precincts within a municipality (there are 212 municipalities in the regression sample). The fact that the estimate is still large and statistically significant after including close to 250 regressors and using only within-municipality variation substantially decreases the likelihood that the estimated association is spurious.Footnote 26 Also, the fact that the dependent variable is measured two years after the explanatory variable argues against the possibility of reverse causality. The result is also robust to repeating the analysis with the individual-level survey data. Column 6 displays the estimates for a regression in which the dependent variable is the individual respondent’s trust in the electoral authorities. Controls include all precinct-level variables (basic controls). In addition, we control for a large set of individual-level covariates including: age, education, gender, having an email account, being a WhatsApp user, having gone to public (vs. private) school, knowing any of the poll workers at one’s polling station, being married (vs. single), satisfaction with democracy, owning a smartphone, having donated money the previous year, having donated blood the previous year, having signed a petition to government in the most recent two years, having paid taxes in the most recent two years, having participated in a neighborhood committee, having participated in a protest, having volunteered for a social cause, having communicated about politics in social media, and having voted in an election in the last six years. The coefficient on the recounts variable is fully robust.
Trust in Electoral Authority and Recounts

Note: Part A of this table presents estimates of Equation 4, INE_Impartials = α+β Fracc Recounteds + X’s γ + vs, where INE_Impartials is the precinct-B average of answers to the trust question in our 2017 survey (except for column 6, where individual-level data are used and errors clustered at the precinct level; see text), FraccRecounted is the fraction of PSs recounted in precinct B in 2015, and -B is a matrix of precinct-level (or higher level) controls. To assess robustness, different columns use different sets of controls and geographic fixed effects. Basic controls: (at precinct level from Census) average years of schooling, % born in another State, number Catholic, number of persons with no health insurance, working population, number of houses/apartments with dirt floor, with electricity, or with low assets; (for registered voters) schooling of PWs at the PS, age of PWs at the PS, % women of PWs at the PS, number of registered voters, (from election results) %PAN, %PRI, %PRD. Full controls = Basic controls + % satisfied with democracy, % with smartphone, % donated money last year, % donated blood last year, % signed petition to government this or last year, % paid taxes this or last year, % participated in neighborhood committee, % participated in a protest, % volunteered for a social cause, % talked about politics in social media, % voted in an election in the last six years. To conduct a “placebo” analysis, Part B changes the dependent variable to the precinct-B average of the extent of agreement with the following statements: (1) INE is impartial and does not favor any party; (2) Voting is a civic duty; (3) I would have preferred not to be asked to be a poll worker; (4) Men are better bosses and leaders than women; (5) We Mexicans should donate our time and fight for transparent elections; (6) I feel taken into account in the political decisions of the country.
As an alternative strategy to explore the possibility of confounding by omitted factors, we implement a series of placebo tests. Prior research shows that political attitudes in different realms tend to correlate across geographically close persons and also within persons. Such correlation could stem from common unobserved factors such as public-mindedness, generalized trust, and/or social capital. Insofar as such deeper factors also drive vote recounts, they would generate a spurious association between recounts and trust in INE, and in the same way one would expect they would also generate spurious correlation between recounts and other attitudes. We repeat the main regression analysis described above using different (placebo) attitudes as dependent variables: voting viewed as a civic duty, willingness to fight for transparent elections, feeling of being taken into account in the political decisions of the country, preferences for being tapped to be a poll worker, and men are better bosses and leaders than women (responses to these items are on the same agree-disagree scale as for the trust-in-INE item). The bottom part of Table 4 presents placebo estimates of Equation 4 using the same controls as column 4 of the top part of the table. It shows that recounts are not associated with any of these alternative attitudes. Instead, recounts only affect trust in INE’s impartiality. This is remarkable in light of the fact that trust in INE is indeed substantially correlated with all the other alternative dependent variables.Footnote 27 Omitted variables could still bias the estimates, but they would have to be of a peculiar kind, inducing correlation with trust in INE but not with any other of the attitudes we tested.
As a further probe of causality, we use tally inconsistencies as an instrument for recounts. Specifically, we measure the share of recounted PSs within a precinct with the fraction of PSs in the precinct that presented inconsistencies. That is, we focus only on the variation in recounts due to inconsistencies. The first stage is powerful, with an F-statistic greater than 900. The IV estimate for attitudes about INE’s impartiality is reported in column 5 in the top part of Table 4.Footnote 28 The estimated effect is somewhat larger than that the OLS equivalent. We view this analysis as an additional piece of evidence consistent with a causal interpretation.
As an alternative approach to exploring whether the estimates are causal, we implement a sensitivity analysis that asks: how strong would omitted confounders have to be to fully account for the estimated association between recounts and trust? Following Oster (Reference Oster2019), we find that omitted confounding would have to be more than 6.1 times more important than the set of basic controls, or 5.2 times more important than the full set of controls, suggesting that omitted variable bias is unlikely to account for the estimated relationship (details are provided in the Appendix).Footnote 29
As a further robustness check, we implement front-door adjustment, as developed by Pearl (Reference Pearl1995), to estimate the causal effect of inconsistencies on trust. A key advantage of front-door adjustment is that it does not rely on the assumption that inconsistencies cause trust only via recounts, which is the exclusion restriction we relied on for the instrumental variables analysis presented in column 5 of Table 4. (See Appendix for further details). The front-door estimate indicates that a precinct where all PSs display some inconsistencies, compared with one where none do, is causally associated with lower trust in the electoral authorities by 3.2%.
As a final robustness test, we explore the implications of a specific mechanism consistent with our causal story: that recounts undermine trust in INE because they are spun and publicized by politicians and political parties for political ends. Specifically, we test the hypothesis that politicians have stronger incentives to use recounts politically in tight races (for example, in order to influence the outcome or appease their political base). This hypothesis implies that recounts should erode trust in INE more in tighter races.Footnote 30 We test this hypothesis and find that recounts indeed matter more for trust in tighter races (Table A13).
In sum, all the estimation methods that we implement obtain similar results under different assumptions, substantially raising our confidence in a causal interpretation for the negative association between recounts and trust in INE. It is still possible, of course, for the observed association to be spurious. However, any argument to that effect would have to point to a confounding mechanism specific to trust in electoral authorities but not to other electoral and political attitudes. It would additionally have to confound tally inaccuracies and trust in INE’s impartiality, it could not rely on omitted variables we actually control for, including the fine-grained geographical fixed effects, and it would have to be many times stronger in its causal effects than all the included covariates together. Finally, whatever the confounding mechanism, it would have to be consistent with the finding that the relationship between recounts and trust is stronger in more-competitive races. We view a causal interpretation (i.e., that recounts erode trust in INE) as the most parsimonious one given the evidence.
We believe that tally inconsistencies could potentially have additional negative effects beyond their effects on trust in electoral institutions, such as increased social polarization and unrest, and a general long-term erosion of democratic values;Footnote 31 they could also deny the rightful winner of her place. We leave these issues as open questions for future research.
Conclusion
A large majority of democracies today count votes by hand (Figure A1). Although electronic voting has gained in popularity, growing concerns about hacking around the globe may stall its growth. However, hand-counting also has costs, not only in terms of counting effort by citizens or salaries of poll workers but also because human counting is subject to mistakes. We document that more than 40% of polling-station level tallies in recent Mexican elections display arithmetical or counting inconsistencies. We find no evidence that the inconsistencies we study are partisan in nature. But even if such inconsistencies result from honest mistakes, they may result in vote recounts, which require effort and can prolong uncertainty about outcomes. Moreover, politicians around the world have used inconsistencies and recounts to undermine the credibility of electoral authorities. We document that this delegitimizing strategy may erode trust in the impartiality of electoral institutions and therefore, we surmise, in democracy more generally.
In addition to documenting some of the consequences of tallying mistakes, we have documented some of their causal determinants. First, the education of poll workers matters. Less-developed regions may have lower-quality vote tallies and consequently more recounts and potentially lower trust in their electoral institutions. Second, because arithmetical complexity leads to more errors, simplifying the counting and tallying procedures might improve the accuracy of tallies, consistent with behavioral public policy guidelines (Datta and Mullainathan Reference Datta and Mullainathan2014). Third, we find that higher tallying workload leads to more errors, but only proportionately so. Within the range of variation in our data, it seems that having polling stations with fewer voters would not reduce the total prevalence of errors. We cannot rule out, however, the possibility that higher workloads could yield increasing rates of mistakes.Footnote 32
In comparative perspective, Mexico is quite a typical country in terms of the sociodemographic determinants of poll-worker performance that we identify (Figure A5). The fact that Mexican electoral law provides for recounts is also typical (Figure A12). Nevertheless, there is probably much to learn yet from variation in who counts votes, which varies widely across countries. In many parts of Africa, poll workers are employees of the Electoral Commission. In New Zealand, South Korea, and some parts of the United States, school teachers do the tallying. In Sierra Leone and Zambia, poll workers are hired from a pool of self-selected applicants. Finally, countries such as Ecuador, Spain, and Mexico draw unpaid volunteers to function as poll workers. Our analysis suggests that how vote counters are selected is likely to interact with socioeconomic development in terms of impact on the quality of vote tallies.
Overall, our analysis suggests that the fact that voting results are imperfect, even in the absence of malfeasance, ought to receive greater scholarly attention in future work on elections, electoral behavior, and democracy.
Supplementary Materials
To view supplementary material for this article, please visit http://dx.doi.org/10.1017/S0003055420000398. Replication materials can be found on Dataverse at: https://doi.org/10.7910/DVN/4M0HEN.




Comments
No Comments have been published for this article.