Introduction
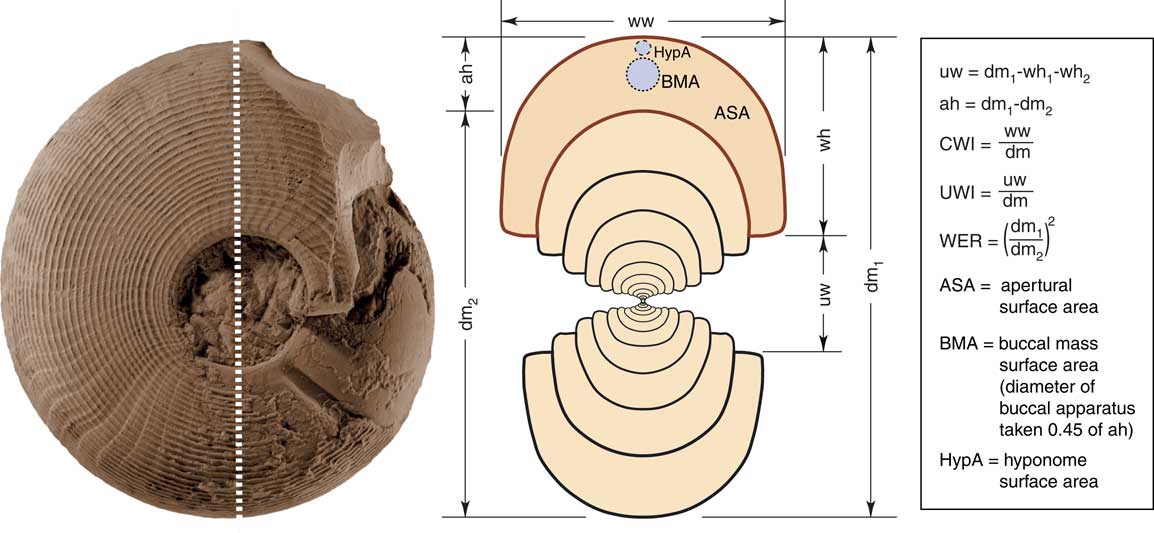
The Ammonoidea are an extinct subclass of ectocochleate cephalopods, meaning that the conch (shell) of the animal was external. This conch performed several tasks. First, the phragmocone, a gas-filled, chambered region of the conch, was used for buoyancy (Trueman Reference Trueman1940). Second, the body chamber housed the soft body of the animal and offered protection from predators. The body chamber also provided space for the mantle cavity, an area for water to wash over the gills, as can be seen in Recent Nautilus (Wells and Wells Reference Wells and Wells1985). The fossilized conchs of ammonoids offer an opportunity for researchers to study the ontogenetic development of individual animals; the most effective way of studying their ontogeny is by making high-precision cross sections of the conch (Korn Reference Korn2010, Reference Korn2012). A good cross section can reveal the growing history of an ammonoid conch from the initial stage, the protoconch, through to the adult in a series of half whorls (Fig. 1).
Conch parameters and ratios as used in the analysis of ammonoid shells (modified from Korn Reference Korn2012).

Ammonoid conch measurements and the parameters derived from them have been used for a long time. The first modern attempt to quantify shell growth in mollusks was carried out by Raup and Michelson (Reference Raup and Michelson1965) and furthered by Raup (Reference Raup1966). Raup (Reference Raup1967) then provided a keystone for analyses of conch morphology in the Ammonoidea. The principal Raupian conch parameters were subsequently used by ammonoid researchers for studying ontogenetic trajectories (Kullmann and Scheuch Reference Kullmann and Scheuch1970, Reference Kullmann and Scheuch1972; Kant and Kullmann Reference Kant and Kullmann1973). The Raupian parameters were later modified to provide more accurate data from ammonoid cross sections (Korn Reference Korn2000, Reference Korn2010; Korn and Klug Reference Korn and Klug2003, Reference Korn and Klug2007). Using the conch growth parameters, it is possible to look at the ontogenetic trajectories of many species of ammonoids and to compare developmental rates within and between ammonoid families. Such information adds important empirical evidence for exploring and refining evolutionary theories.
More recent studies on nautiloid and ammonoid conch growth have made use of new techniques such as microcomputed tomography (micro-CT scans) (Hoffmann and Zachow Reference Hoffmann and Zachow2011; Hoffmann et al. Reference Hoffmann, Schultz, Schellhorn, Rybacki, Keupp, Gerden, Lemanis and Zachow2014; Tajika et al. Reference Tajika, Naglik, Morimoto, Pascual-Cebrian, Hennhöfer and Klug2015; Lemanis et al. Reference Lemanis, Korn, Zachow, Rybacki and Hoffmann2016) or serial grinding tomography (Naglik et al. Reference Naglik, Monnet, Goetz, Kolb, De Baets, Tajika and Klug2015; Tajika et al. Reference Tajika, Naglik, Morimoto, Pascual-Cebrian, Hennhöfer and Klug2015). These techniques can reveal a lot of information about the growth of an ammonoid, especially the chamber and septum volumes (Naglik et al. Reference Naglik, Monnet, Goetz, Kolb, De Baets, Tajika and Klug2015; Lemanis et al. Reference Lemanis, Korn, Zachow, Rybacki and Hoffmann2016). However, they are not without their problems. Micro-CT scans require ammonoid conchs, which are hollow, to provide a good clear image (Hoffmann and Zachow Reference Hoffmann and Zachow2011). Serial grinding tomography does not require hollow specimens, but it is time-consuming (Naglik et al. Reference Naglik, Monnet, Goetz, Kolb, De Baets, Tajika and Klug2015).
Based on various conch parameters, there were several attempts to create a morphospace for ammonoids. Saunders and Swan (Reference Saunders and Swan1984) performed a multicharacter analysis of Serpukhovian ammonoids, and Westermann (Reference Westermann1996) proposed a morphospace on the basis of conch characters and possible function. The latter concept has been revived by Ritterbush and Bottjer (Reference Ritterbush and Bottjer2012). Villier and Korn (Reference Villier and Korn2004) used a morphospace based on the main conch parameters to analyze the morphological disparity for the latest Carboniferous to Early Triassic ammonoids. Korn and Klug (Reference Korn and Klug2012) presented a morphospace for the Devonian ammonoids that was calculated with the three cardinal conch parameters—conch width index, umbilical width index, and whorl expansion rate—and resulted in a triangular-shaped morphospace occupation. Most recently, a large morphospace study was carried out by Tendler et al. (Reference Tendler, Mayo and Alon2015) in which the changing conch morphologies of the Ammonoidea were discussed in terms of Pareto optimality theory.
In this paper we introduce new measurements derived from the conch itself and conch parameters obtained from them, as well as modeled measurements for soft-bodied organs (buccal mass and hyponome) based on size ratios in Nautilus pompilius obtained from illustrations in Saunders and Spinosa (Reference Saunders and Spinosa1978). The new methods build upon techniques already used with conch cross sections, so they are easy to implement, fast, and require no extra equipment beyond what would be needed for obtaining the cardinal conch parameters. These new methods can help to categorize ammonoid conch forms with respect to their apertural opening; they thus indirectly may allow an analysis of the size of organs such as the buccal mass, hyponome, and tentacles that interact with the external environment and could reveal information on the lifestyle of certain ammonoid morphs (Tendler et al. Reference Tendler, Mayo and Alon2015). Based on this information, an ecomorphospace is created and discussed in the frame of a morphospace based on the classical conch parameters.
Materials and Methods
Analyzed Material
We investigated cross sections of 77 ammonoid species, 1 extinct nautiloid, and 1 extant nautiloid (N. pompilius), which together cover a representative spectrum of conch morphologies (see Supplementary Table 1).
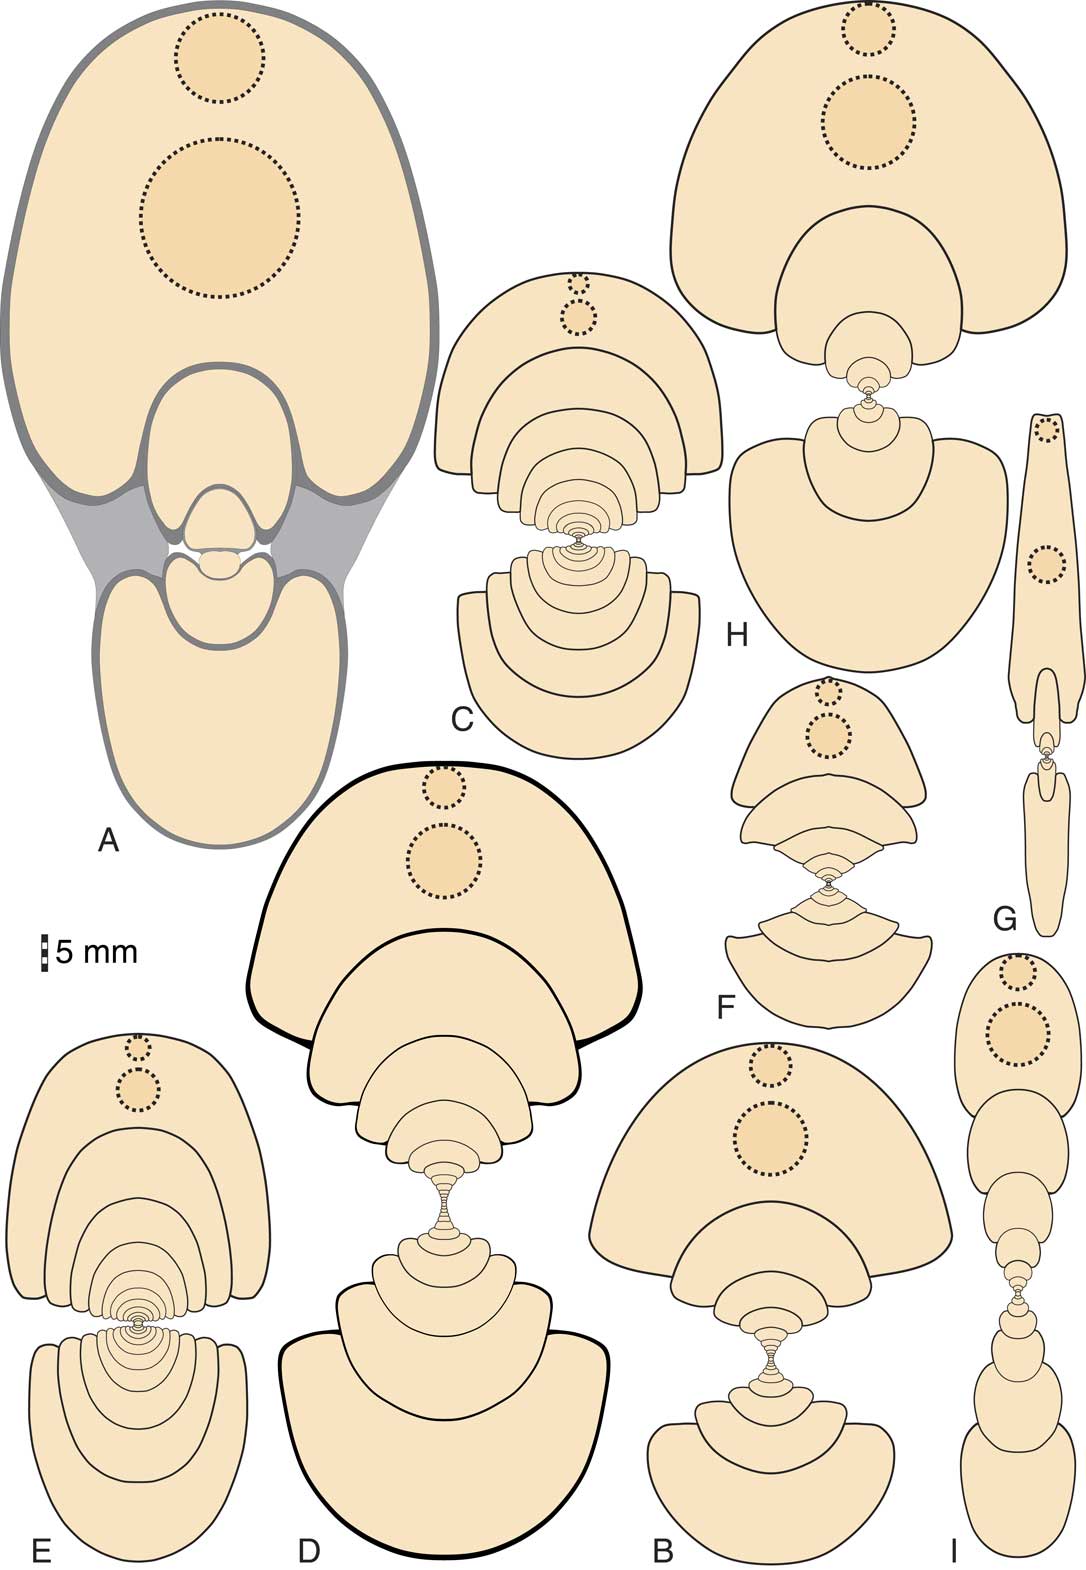
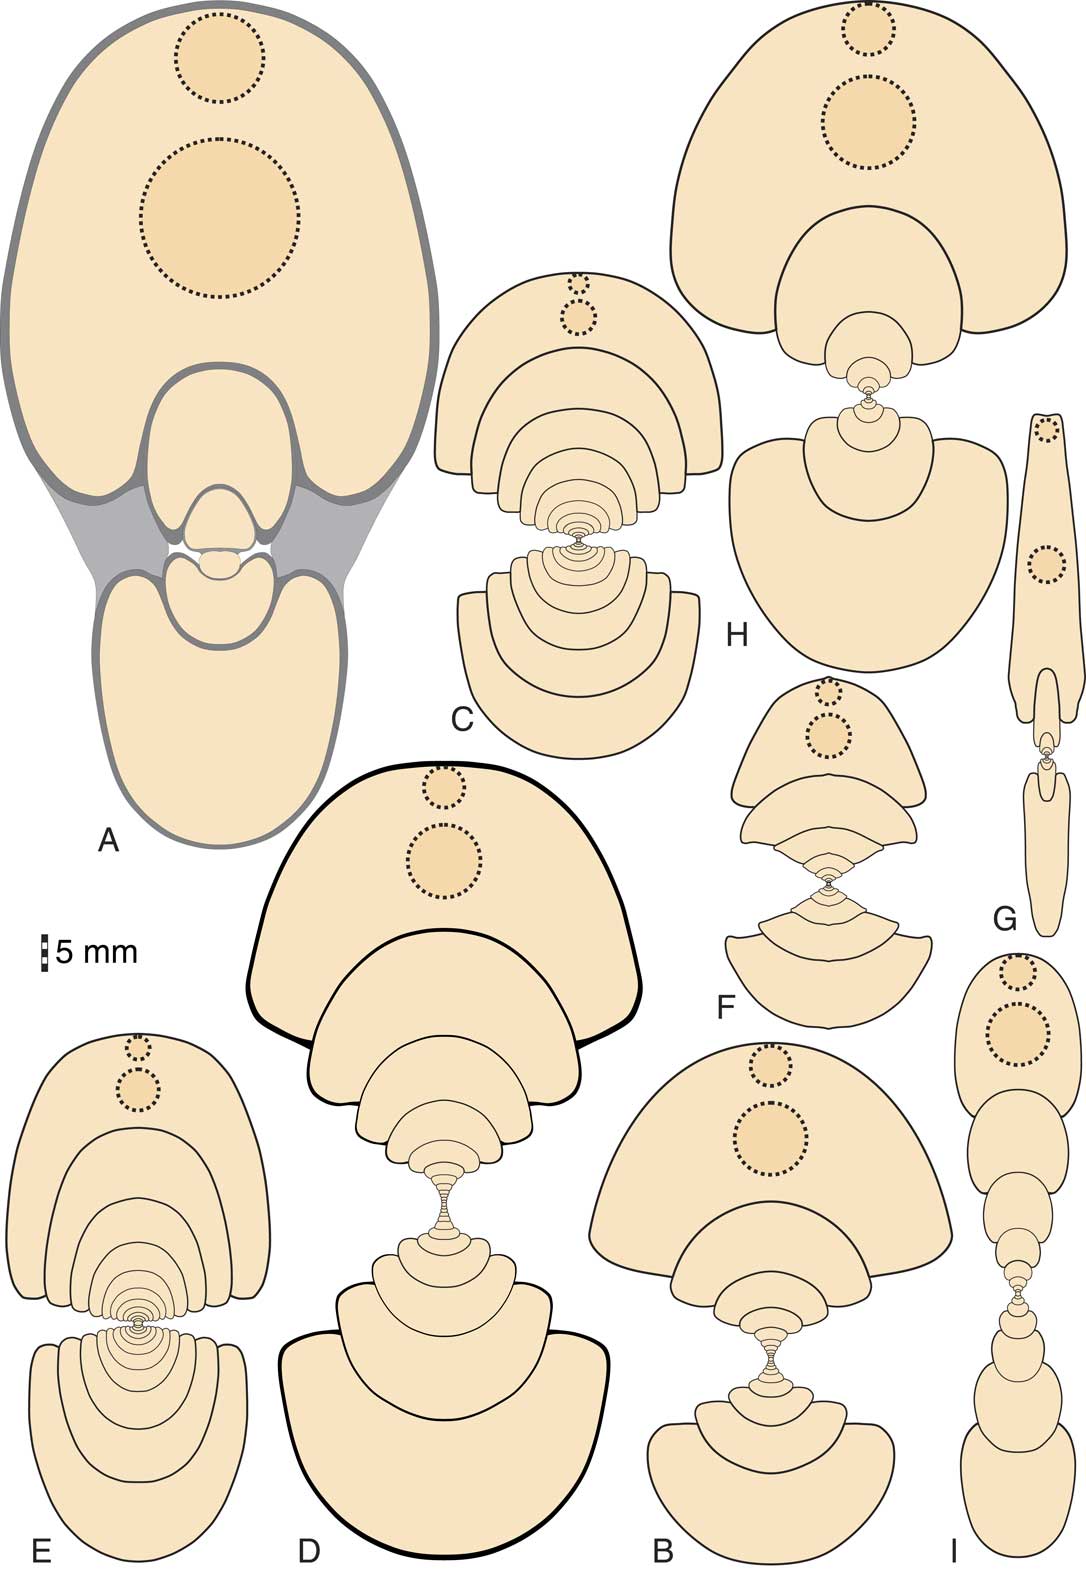
Nine cephalopod taxa are highlighted in the following and may serve as representative examples (Fig. 2):
Cross sections of the nine example specimens with the observed (Nautilus) and modeled (ammonoids) diameters of buccal apparatus and hyponome; all 1×. A, Nautilus pompilius Linnaeus, Reference Linnaeus1758, specimen GPI Tübingen 1431-K1. B, Revilloceras granofalcatum (Kullmann, Reference Kullmann1961), specimen MB.C.9090.1 (early Carboniferous, Anti-Atlas, Morocco). C, Macrocephalites macrocephalus (Schlotheim, Reference Schlotheim1813), specimen MB.C.26518 (Middle Jurassic, Westphalia). D, Tropites subbullatus (Hauer, Reference Hauer1849), specimen MB.C.7724 (Late Triassic, Austria). E, Sageceras haidingeri (Hauer, Reference Hauer1849), specimen MB.C.6008.4 (Late Triassic, Austria). F, Joannites cymbiformis (Wulfen, Reference Wulfen1793), specimen MB.C.6352.2 (Late Triassic, Austria). G, Metalegoceras sundaicum (Haniel, Reference Haniel1915), specimen MNHN Paris 1925-16 B7532 (early Permian, Timor). H, Hammatocyclus pollex Ebbighausen, Korn & Bockwinkel, Reference Ebbighausen, Korn and Bockwinkel2010, specimen MB.C.18601.7 (early Carboniferous, Gourara, Algeria). I, Choffatia isabellae Bonnot et al., Reference Bonnot, Boursicot, Ferchaud and Marchand2008, specimen MB.C.26550 (Middle Jurassic, Normandy).
Hammatocyclus pollex (Ebbighausen, Korn, and Bockwinkel, Reference Ebbighausen, Korn and Bockwinkel2010): This species has been chosen out of the various Carboniferous ammonoids with pachyconic, subinvolute adult whorls but extremely wide umbilicate juvenile whorls.
Revilloceras granofalcatum (Kullmann, Reference Kullmann1961): This is a representative of a large group of Carboniferous ammonoids with a pachyconic subinvolute conch shape and a distinctive triphasic conch width index ontogeny (Korn Reference Korn2012; Walton and Korn Reference Walton and Korn2017).
Metalegoceras sundaicum (Haniel, Reference Haniel1915): Representative of the Permian ammonoids with extremely evolute inner whorls and closure of the umbilicus later in ontogeny. The species may also be an example of the Permian ammonoids that repeat similar conch geometries of the Carboniferous ammonoids.
Joannites cymbiformis (Wulfen, Reference Wulfen1793): This species was chosen because it is a Triassic representative of the large group Arcestoidea, which iteratively developed pachyconic-to-globular conch characteristics similar to many Carboniferous ammonoids (Walton and Korn Reference Walton and Korn2017).
Sageceras haidingeri (Hauer, Reference Hauer1847): Of the various Triassic thinly discoidal ammonoids with a very high aperture, this species was chosen to represent the wide range of conch geometry and ontogenies within the Ammonoidea.
Tropites subbullatus (Hauer, Reference Hauer1849): Adult modifications play an important role in Triassic ammonoids, and hence this species was chosen as an example. Additionally, the species differs from the other examples in its wide whorl profile with a flattened venter.
Macrocephalites macrocephalus (Schlotheim, Reference Schlotheim1813): Macrocephalites is one of the few Jurassic ammonoid genera with a pachyconic or globular, subevolute conch (Walton and Korn Reference Walton and Korn2017). Also, it has some similarities to the Recent Nautilus and was therefore chosen.
Choffatia isabellae (Bonnot, Ferchaud, Boursicot, and Marchand, 2008): This serves as an example of the very many Jurassic widely umbilicate ammonoids.
Nautilus pompilius Linnaeus, Reference Linnaeus1758: Nautilus was chosen as an extant example for comparison with the representatives of the Ammonoidea.
Description of the Aperture Shape
The aperture of an ammonoid was the area that was the interface between the animal and the external environment. This interface played a crucial role for an ammonoid, as it was the only point of ingress for water and food, and the only point of egress for metabolic products. Due to their direct relationship with the aperture, the buccal mass, a feeding organ found in cephalopods, and the hyponome, an organ used for pumping water over the gills and jet propulsion (Wells and O’Dor Reference Wells and O’Dor1991), are of particular interest in studying the ecological roles that ammonoids played in their environments. The movement of water between the external environment and the body chamber, or vice versa, was an important process. Water drawn into the body chamber would carry dissolved oxygen for respiration. Outgoing water would carry away waste products such as excretory waste and carbon dioxide, the same process used by extant cephalopods today (Wells and Wells Reference Wells and Wells1982). The size and shape of the aperture therefore had an effect on water movement into and out of the body chamber. Larger apertures can host a larger buccal apparatus and a larger hyponome; they facilitate greater volumes of water transport in a given time, thus increasing the amount of oxygen provided and the efficiency of waste product removal.
Quantificaton of the Apertural Surface Area
In conch cross sections, the apertural surface area (ASarea) is taken for each successive half whorl from the protoconch through to the last measurable half whorl (Fig. 1). The ASarea was measured in Adobe Illustrator CS3 using the programmers’ debugging palette.
The ASarea on its own can reveal only so much information about the organism, as it cannot be quantitatively compared with the ASarea of different-sized specimens and conch forms. For that reason the ASarea measurement is compared with the conch diameter (dm) for the concurrent whorl cross section, the resulting apertural surface area index (ASAI) parameter can be used to reveal more information:
 $${\rm ASAI}\, {\equals}\,\left( {{\rm AS}_{{{\rm area1}}} ^{{1\!/\!2}} } \right)\!/\!{\rm dm}_{1} $$
The parameter describes the relationship between the square root of the ASarea and the diameter of the conch. The ASAI is dependent on the shape of the apertural opening, as reflected in several parameters (Fig. 1). A high ASAI would indicate a relatively large apertural opening, in other words, a larger interface between the body chamber and the habitat than would be found in a specimen with a smaller ASAI. A very high ASAI (>0.5), for instance, indicates an animal that has a proportionately larger apertural opening than another ammonoid with a lower ASAI. The ASarea is thus a source of information important to ammonoid research, as it helps to categorize the Ammonoidea in terms of their abilities in respiration, locomotion, and feeding strategies. Details of actual ecological implications need to be aligned with other sources of information such as stomach contents and dimensions as well as shape of the mouthparts.
The ASAI is dependent on the shape of the apertural opening, as reflected in several parameters (Fig. 1):
1. Height of the aperture: Changes to the conch diameter are driven by the whorl expansion rate (WER). An extremely high WER (>2.5) describes a rapid increase in the conch diameter, and a low WER (about 1.5) represents a very slow increase.
2. Width of the conch: Two ammonoid species having the same WER could have very different ASAIs if their conch widths are different. A globular ammonoid would have a larger ASarea than a discoidal ammonoid.
3. Rate of whorl overlap: The shape of the whorl profile, indicated by the whorl width index and the imprint zone rate, is strongly determined by the width of the umbilicus, a narrow or even closed umbilicus stands for a wide overlap of a given whorl over the preceding one. In contrast, no or little overlap is seen with a wide umbilicus. The shape of the whorl profile can thus vary from perfectly circular to horseshoe shaped, with consequences for the shape of the soft body and the size and shape of organs and their spatial arrangement, as is seen for the buccal mass and the hyponome.
It is well known that the ontogenetic trajectories for the umbilical width index (UWI), conch width index (CWI), whorl width index (WWI), and WER for an ammonoid species may show conspicuous changes that result in increases and decreases in the parameters during growth (Klug Reference Klug2001; Korn Reference Korn2012; Korn and Klug Reference Korn and Klug2012; Walton and Korn Reference Walton and Korn2017). Changes of these conch parameters ultimately affect the apertural shape, hence by changes in the ASarea and the ASAI.
Measuring the ASarea allows for a closer approximation of the body mass of ammonoids and coiled nautiloids; it takes into consideration the various conch shapes and whorl profile shapes (Supplementary Fig. 1).
Quantificaton of the Surface Area of the Buccal Mass and the Hyponome
The cephalopod body plan contains a buccal mass, which is located on the sagittal plane. It is surrounded by tentacles within the head (Young and Vecchione Reference Young and Vecchione1996; Boyle and Rodhouse Reference Boyle and Rodhouse2005; Shigeno et al. Reference Shigeno, Sasaki, Moritaki, Kasugai, Vecchione and Agata2008; Kröger et al. Reference Kröger, Vinther and Fuchs2011), so it is strongly suggestive that this was also true for the Ammonoidea. As the buccal mass is globular in Recent cephalopods, both nautiloids and coleoids (Nixon Reference Nixon1988; Tanabe and Fukuda Reference Tanabe and Fukuda1999; Uyeno and Kier Reference Uyeno and Kier2005; Tanabe Reference Tanabe2011, Reference Tanabe2012; Tanabe et al. Reference Tanabe, Kruta and Landman2015), we assume the same for the ammonoids. This assumption may somewhat contradict fossil evidence of jaw morphology from ammonoids, which have revealed jaws with quite dramatic shapes that often fit the apertural opening (Woodward Reference Westermann1885; Lehmann Reference Lehmann1972; Morton Reference Morton1981; Lehmann and Kulicki Reference Lehmann and Kulicki1990; Klug et al. Reference Klug, Frey, Korn, Jattiot and Rücklin2016b). However, the main body of the buccal mass is composed of muscle (Tanabe et al. Reference Tanabe, Kruta and Landman2015), and as the jaws are embedded in the muscle (Uyeno and Kier Reference Uyeno and Kier2005), the buccal mass is to some extent independent of the jaw shape, as can be seen in extant cephalopods (Uyeno and Kier Reference Uyeno and Kier2005). Tanabe et al. (Reference Tanabe, Kruta and Landman2015) provide some examples of reconstructed ammonoid buccal structures that resemble a raindrop in cross section. We decided to use the globular form and associated circular cross section to keep the model simple for analytical purposes. Although it is not perfect, it will provide some estimates in an easily applicable way. The central location of the buccal mass in the ammonoid Bauplan places it in the central portion of the apertural opening (Fig.1). The height of the buccal mass is, therefore, limited by the aperture height: the higher the aperture, the larger the range for possible buccal mass sizes. The shape of the aperture opening could also play a role on the buccal mass size. U-shaped jaws in ammonoids with crescent-shaped apertures (Klug et al. Reference Klug, Frey, Korn, Jattiot and Rücklin2016b) may have had larger buccal masses than our proposed model; however, they were still constrained by aperture height in terms of the size of the food items ingested, leading to similar conclusions with regard to the proposed buccal mass model. In our model, we are assuming that ammonoids with relatively low apertures would also have had a relatively small buccal mass. This may not have been the case with all ammonoids, and our estimates may neglect certain aspects of buccal mass morphologies in some taxa. However, the goal is to develop an estimate of ammonoid feeding styles that is relatively easy to carry out and as inclusive of all groups as possible. The size of the buccal mass has a link to the size of food items that could be consumed; a small buccal mass means that only small prey items could be eaten whole, while larger prey could only be consumed in small pieces. This is based on evidence of buccal mass contents found in fossil ammonoids, which contain whole planktonic animals (Lehmann Reference Lehmann1971; Jager and Fraaye Reference Jager and Fraaye1997; Kruta et al. Reference Kruta, Landman, Rouget, Cecca and Tafforeau2011; Klug and Lehmann Reference Klug and Lehmann2015; Tanabe et al. Reference Tanabe, Kruta and Landman2015) and also by the lack of wear on fossilized ammonoid radula, which has led researchers to believe that it was used to transport material to the esophagus (Kruta et al. Reference Kruta, Landman, Mapes and Pradel2014), either whole or as already broken up skeletal remains (Klug and Lehmann Reference Klug and Lehmann2015). There is some evidence to suggest that the jaw morphology in some ammonoids was relatively weak, suggesting that small prey items were probably swallowed relatively intact (Lehmann Reference Lehmann1971, Reference Lehmann1975; Kruta et al. Reference Kruta, Landman, Rouget, Cecca and Tafforeau2011, Reference Kruta, Landman, Mapes and Pradel2014; Klug and Lehmann Reference Klug and Lehmann2015; Tanabe et al. Reference Tanabe, Kruta and Landman2015). However, other research suggests that some ammonoids, lytoceratids, and phylloceratids were able to process larger food items in a way similar to modern Nautilus species (Tanabe et al. Reference Tanabe, Fukuda, Kanie and Lehmann1980, Reference Tanabe, Misaki, Landman and Kato2013, Reference Tanabe, Kruta and Landman2015; Tanabe and Fukuda Reference Tanabe and Fukuda1999; Tanabe Reference Tanabe2011).
Ammonoids are assumed to have possessed a hyponome, like their living relatives, and to have used this organ for propulsion (Jacobs and Chamberlain Reference Jacobs and Chamberlain1996; Klug and Korn Reference Klug and Korn2004), as well as for ventilation, as in extant Nautilus species (Wells and Wells Reference Wells and Wells1985). The hyponome (funnel) in most living cephalopods, like the buccal mass, is also located along the sagittal plane (Boyle and Rodhouse Reference Boyle and Rodhouse2005; Shigeno et al. Reference Shigeno, Sasaki, Moritaki, Kasugai, Vecchione and Agata2008; Kröger et al. Reference Kröger, Vinther and Fuchs2011). The central location of the hyponome then indicates, as seen with the buccal mass, that the diameter of this organ (Hypdm) is also determined by the aperture height, and consequently is controlled by the WER.
It would be ideal to base the diameters of the buccal mass (BMdm) and the hyponome (Hypdm) on actual ammonoid specimens; however, it is extremely rare to have any soft part morphology preserved in the Ammonoidea (Klug et al. Reference Klug, Riegraf and Lehmann2012; Klug and Lehmann Reference Klug and Lehmann2015). When buccal apparatuses are found, they are often flattened (Klug and Jerjen Reference Klug and Jerjen2012), making it hard to take reliable measurements. It is for this reason that the BMdm and Hypdm in the Ammonoidea were modeled on approximate ratios based on the living cephalopod example N. pompilius (Saunders and Spinosa Reference Saunders and Spinosa1978). Although N. pompilius may not be perfect for modeling ammonoid organs (Jacobs and Landman Reference Jacobs and Landman1993), there are certainly some similarities in the lower jaws of modern Nautilus species and some ammonoids (Tanabe et al. Reference Tanabe, Fukuda, Kanie and Lehmann1980, Reference Tanabe, Misaki, Landman and Kato2013, Reference Tanabe, Kruta and Landman2015; Tanabe and Fukuda Reference Tanabe and Fukuda1999; Tanabe Reference Tanabe2011; Kruta et al. Reference Kruta, Landman, Mapes and Pradel2014). Ammonoids and nautiloids both had to accommodate certain organs, buccal mass, feeding arms, hyponome, and eyes, in the apertural opening and as such are subject to similar constraints on organ placement and spacing. The buccal mass ratio obtained was 0.45 and the hyponome ratio was 0.25. The buccal mass ratio is somewhat lower than two ratios that we obtained from the literature for two ammonoid examples, 0.56 for Ceratites (based on the preserved remains of a buccal mass in Klug and Jerjen [Reference Klug and Jerjen2012]) and 0.62 for Baculites (based on the reconstruction of the jaw apparatus in Kruta et al. [Reference Kruta, Landman, Rouget, Cecca and Tafforeau2011]). However, the fossilized remains of buccal masses and jaws are often slightly distorted by the preservation process (Klug and Jerjen Reference Klug and Jerjen2012), and we therefore feel that the modeled ratio is still informative. These ratios were then used with the aperture heights (ah) for each half whorl measurement to give modeled estimates for the BMdm and Hypdm.
 $${\rm BM}_{{{\rm dm}}} \, {\equals}\,{\rm ah}\, {\asterisk}\, 0.45$$
 $${\rm Hyp}_{{{\rm dm}}} \, {\equals}\,{\rm ah}\, {\asterisk}\, 0.{\rm 25}$$
Of the 79 specimens investigated by us, there were two with extremely compressed adult conchs (S. haidingeri and Pinacoceras layeri). Due to the narrowness of the conch, the whorl width (ww) was less than the aperture height. This means that for the two specimens, the whorl width was less than the estimated buccal mass diameter, which meant that the modeled buccal mass would not have fit within the apertural opening. An alternative method was required to calculate the BMdm for extremely compressed conchs like these two; therefore the BMdm was taken to be 65 % of the whorl width. Although this number is somewhat arbitrary, it was decided that it would represent a reasonable size for the buccal mass while still allowing space for the tentacles. The alternative BMdm was calculated in the following way:
 $${\rm BM}_{{{\rm dm}}} \, {\equals}\,{\rm ww}\, {\asterisk}\, 0.{\rm 65}$$
The two-dimensional cross-sectional shapes of the buccal mass and hyponome were taken to be circular, as the buccal mass in Nautilus and coleoids are mainly spherical in form (Saunders and Spinosa Reference Saunders and Spinosa1978; Uyeno and Kier Reference Uyeno and Kier2005). Our hyponome model is, as with the buccal mass model, not necessarily a perfect fit for all ammonoids. There are thought to be differences in hyponome structures between different ammonoid groups; Devonian ammonoids had a ventral hyponomic sinus (Klug and Lehmann Reference Klug and Lehmann2015) like modern-day Nautilus, whereas Mesozoic ammonoids often had a ventral projection or a rostrum (Klug and Lehmann Reference Klug and Lehmann2015). However, the circular cross section represents a functional optimum and was used for uniformity. Hence buccal mass area (BMarea) and hyponome area (Hyparea) are calculated as follows:
 $${\rm BM}_{{{\rm area}}} \, {\equals}\,\left( {{\rm BM}_{{{\rm dm}}} \,/\,{\rm 2}} \right)^{2} \, {\asterisk}\, {\rm \pi }$$
 $${\rm Hyp}_{{{\rm area}}} \, {\equals}\,\left( {{\rm Hyp}_{{{\rm dm}}} \,/\,{\rm 2}} \right)^{2} \, {\asterisk}\, {\rm \pi }$$
The BMarea estimation of the sizes of the buccal mass provides an idea of the dimensions of the feeding organ in ammonoids. The size of the hyponome affects the flow rate of water that passes through it. Both are not meant to be absolute measurements; to appreciate the relationship of the area estimates of the two organs with the organism, it is useful to compare them with the ASarea.
The buccal mass area index (BMAI) represents the proportion of the ASarea accounted for by the buccal mass; it is calculated in the following way:
 $${\rm BMAI}\, {\equals}\,{\rm BM}_{{{\rm area}}} \!/\!{\rm AS}_{{{\rm area}}} $$
The hyponome area index (HypAI) represents the proportion of the ASarea accounted for by the hyponome. HypAI is calculated in the following way:
 $${\rm HypAI}\, {\equals}\,{\rm Hyp}_{{{\rm area}}} \!/\!{\rm AS}_{{{\rm area}}} $$
The BMAI and HypAI therefore show the relative sizes of the two organs in comparison to the apertural opening (Supplementary Fig. 2). This means that different conch shapes with the same ASarea can have different-sized hyponomes or buccal masses. Conch morphs that have a high WER, and therefore a large aperture, would also have a relatively large buccal mass and hyponome in comparison with morphs with a low WER of the same diameter. The relevance of this to ammonoid paleobiology is that a species with a high WER (such as N. pompilius) could eat larger prey items and move larger volumes of water than similar-sized species with low WER. The BMAI and HypAI can then be used to tentatively assign possible trophic positions or ecological preferences in conjunction with paleobiological evidence such as stomach contents and jaw morphology.
Quantification of Ontogenetic Change
The growth of an organism at the most basic level can either be isometric or allometric (Gould Reference Gould1966). Isometry is geometrically speaking the simplest way for an organism to grow; parts of an organism increase in size with the same relation to one another or the organism as a whole (Huxley Reference Huxley1950; Gould Reference Gould1966). However, isometric growth is not ideal for organisms, as the physical properties of a cell, organ, or limb change when scaled up, thus affecting its ability to perform the same tasks as well as the scaled-down version did (Gould Reference Gould1966, Reference Gould1971). Allometric growth allows different parts of the body to grow at different rates with respect to one another, so body parts are able to maintain their function at optimum levels. Huxley (Reference Huxley1924) set out an equation to describe allometric growth that was later modified to y=bx α (Huxley and Teissier Reference Huxley and Teissier1936). The variable is y (e.g., the ASarea), the reference parameter is x (e.g., the diameter of the conch), and b represents a constant for the calculation (e.g., the ratio between the ASarea and the conch diameter). The allometric factor α shows the type of change; α>1 represents positive allometry, α<1 represents negative allometry, and α=1 represents isometry (Huxley and Teissier Reference Huxley and Teissier1936). The relationship of this equation with ammonoid ontogeny has been set out in detail by Korn (Reference Korn2012).
The ammonoid conch measurements and derived parameters were obtained from a number of specimens for each successive half whorl of a conch cross section working out from the protoconch (Fig. 1). They are thus available for the growth history of an individual in the form of ontogenetic trajectories, in which the conch parameters are plotted against log10 diameter or whorl number. Ontogenetic trajectories are very informative, cataloging changes in the parameters in a visual way. Changes in allometric trends are represented by upward trajectories for positive allometry, downward trajectories for negative allometry, and a stable trajectory for isometry (Korn Reference Korn2012).
Results
Conch Shapes and ASarea
The nine figured examples of our study can be grouped into three units based on the ASarea (Supplementary Fig. 1):
1. Forms with high ASarea: Nautilus, Macrocephalites, and Hammatocyclus, but the last only in the adult stage. While the first two possess similar whorl profiles, Hammatocyclus reaches a similar ASarea through widening of the whorls.
2. Forms with moderate ASarea: Revilloceras and Joannites, Metalegoceras in the adult stage, and Tropites in the terminal stage. While the first two possess a horseshoe-shaped whorl profile during most of their ontogeny, Metalegoceras reaches this stage only at about 15 mm conch diameter.
3. Forms with low ASarea: Choffatia and Sageceras. Very different conch geometries lead to a similar ASarea; in Choffatia it is the wide umbilicus and the near lack of an imprint zone, and in Sageceras it is the strongly compressed whorl cross section.
A bivariate morphospace of WER and ASAI shows a distinct distribution of the investigated species with regard to the ASAI (Supplementary Fig. 3). Of the three specimens from group 1, the adults of Macrocephalites and Hammatocyclus plot only a small distance apart, despite the fact that their ontogenies are very different. Macrocephalites has a similar position throughout ontogeny, but Hammatocyclus migrates from a low juvenile ASAI to the higher adult ASAI. The third specimen of group 1 is Nautilus; this differs in the much higher WER from the other two. Group 2 is located in the lower left area of the scatter plot; however, the forms differ in their ontogeny. Group 3 is at the bottom of the scatter plot, but the wide distance between the two forms, Choffatia and Sageceras, is due to their different coiling rates.
Conch Shapes and Sizes of the Buccal Mass
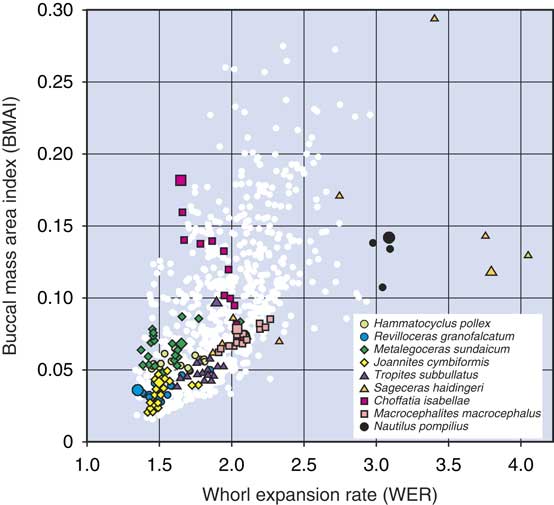
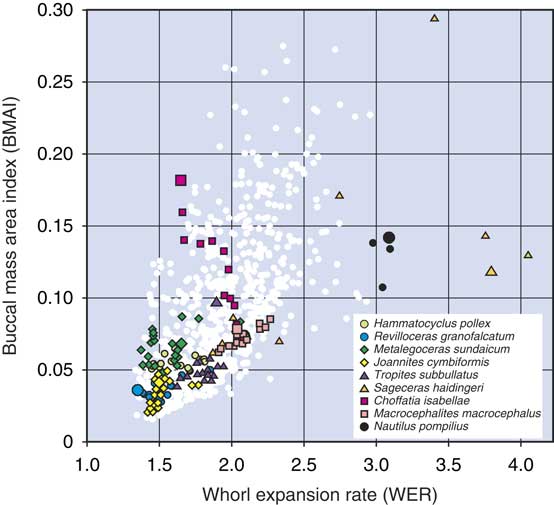
The WER–BMAI bivariate plot demonstrates a strong positive correlation between the two characters (Spearman’s rank correlation r=0.69) (Fig. 3).
1. There is a clear positive correlation between the two characters. A low coiling rate is usually combined with a low BMAI, particularly in those ammonoids with a narrow umbilicus and thus a horseshoe-shaped whorl profile (e.g., Revilloceras, Metalegoceras, Joannites). A combination of a low WER and a higher BMAI is possible in widely umbilicate conchs (e.g., Choffatia). Higher apertures allow the accommodation of a higher buccal mass (e.g., Sageceras, Nautilus), which can accommodate larger pieces of food.
2. Ontogenetic stages may be stationary or may migrate across the scatter plot, depending on changes of the shape of the whorl profile. While Revilloceras and Joannites remain in the lower left corner of the scatter plot, Nautilus remains in a position on the right side with high WER and considerably high BMAI. Choffatia migrates with weak ontogenetic reduction of the WER toward a higher BMAI (caused by the reduction of the whorl overlap).
3. Sageceras, with its very conspicuous ontogenetic changes, migrates across a wide range within the scatter plot. This has two causes: first, the significant heightening of the WER during ontogeny, and second, the flattening of the whorl profile, which restricts the space for the buccal mass, in terms of the width of the apertural opening.
Simple WER/BMAI plot to outline the position of the various cross sections studied. A strong positive correlation is present between increasing WER and BMAI. This strong correlation is due to the dependency of the aperture height on the WER; however, some specimens with low WERs can still achieve high BMAIs if they have a high UWI, that is, a more circular apertural opening. The large symbols of the highlighted specimens represent the last measurable half whorl (final adult measurements); the small symbols represent the ontogeny from hatchling size onward; and white dots represent all ontogenetic stages for the nonhighlighted specimens.
Ontogenetic Trajectories of ASAI and BMAI
The ontogenetic history of the changes in the ASAI shows a wide range of different trajectories among the studied specimens (Supplementary Figs. 4–6). Some genera (e.g., Revilloceras, Metalegoceras, Joannites) show a very small amount of variance in both the ASAI and BMAI during their growth history. Other species (e.g., Hammatocyclus) show an upward trend in the ASAI, in contrast to all of the other examples, which possess a clear downward trend.
The most extreme example of allometric change in the ASAI is seen in Sageceras. The hatchling and early juvenile stages are in the region of depressed cross-sectional areas, and then the later stages become more circular and then progressively compressed (Supplementary Fig. 5B). The bivariate plot with the BMAI for this species shows significant increase during early ontogeny, but a decrease in the adult form due to a more slender conch that can no longer accommodate a large buccal mass.
By contrast, Macrocephalites shows a quite stable ASAI throughout its conch growth due to the fact that the conch morphology changes only slightly during ontogeny (Supplementary Fig. 6A). Changes in the shape of the apertural opening during ontogeny are small, and hence there is no reason for changes in the ASAI and the BMAI.
Choffatia, on the other hand, tells a quite different story; the ASAI shows a rather continuous slow decrease, whereas the BMAI increases. Choffatia goes from having a juvenile conch form that is thinly pachychonic and subevolute, with a high coiling rate, to an extremely discoidal, evolute adult conch form with a low WER (Supplementary Fig. 6B). The change in the conch form allows for a relative increase in buccal mass size, increasing the range of possible prey items.
Ontogenetic trajectories for the BMAI show, according to our assumption of its dependence on the apertural height, whorl width, and umbilical width, very characteristic allometric changes in the growth of an individual specimen. Revilloceras (Supplementary Fig. 4B) and Joannites (Supplementary Fig. 5A) show a very low BMAI (<0.05) that does not change significantly during ontogeny. Hammatocyclus (Supplementary Fig. 4A) and Metalegoceras (Supplementary Fig. 4C) are similar but show a weak adult increase.
Macrocephalites shows a slow ontogenetic increase of the BMAI from 0.06 in the early stage to about 0.09 later in ontogeny, and Choffatia shows a similar but much faster development from 0.07 to 0.18 (Supplementary Fig. 6).
The BMAI ontogeny of Sageceras is more complicated. Due to the increasing coiling rate rather early in ontogeny, the space for the accommodation of the buccal mass increases rapidly. However, at around 10 mm conch diameter, the whorl profile becomes laterally compressed, and thus the buccal mass cannot grow at the same rate it did earlier in ontogeny. This leads to an adult decrease of the BMAI (Supplementary Fig. 5B).
An Ecomorphospace for the Ammonoidea
The data from three parameters (ASAI, BMAI, and WER) from the first half whorl to the last measurable half whorl for all investigated specimens were analyzed using a principal components analysis (PCA), meaning that a total of 1018 individual whorl cross sections were analyzed (see Supplementary Table 2). The PCA was run using PAST, Version 2.17, with the correlation matrix (Hammer et al. Reference Hammer, Harper and Ryan2001). The first two principal components accounted for nearly 97 % of the variance (PC 1=61.63%, PC 2=35.14%, PC 3=3.23%). The reduction to only two axes can be explained by the fact that a strong correlation exists, because of geometric dependencies, between the WER and BMAI.
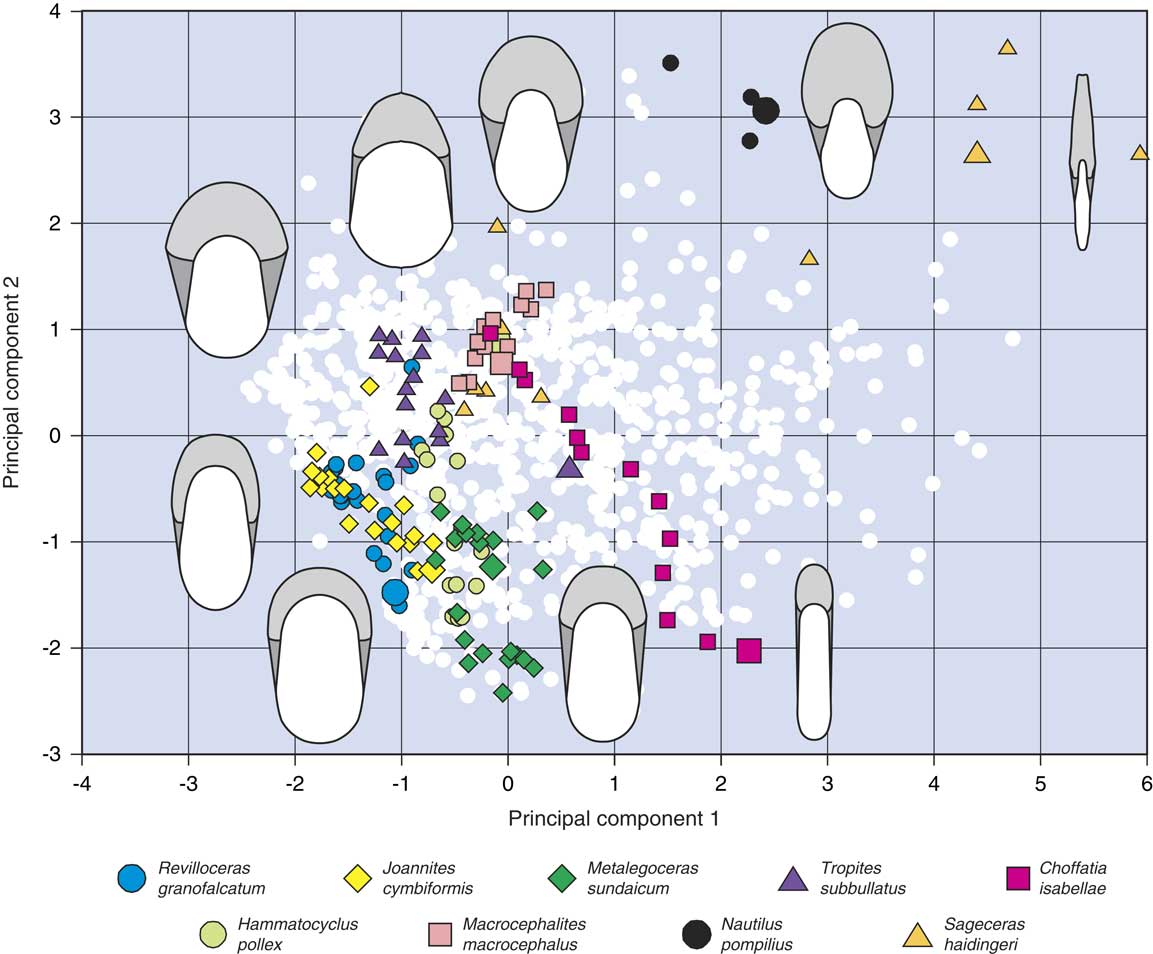
The morphospace produced by the PCA has a truncated oblique left margin, which borders the scatter plot and from which dispersion occurs toward the upper right corner (Fig. 4). The axes along the morphospace explain: (1) high PC 1 values express a high BMAI, (2) high PC 2 values express a high WER. ASAI decreases diagonally from the upper left corner down to the bottom right.
Ecomorphospace: high PC 1 values express a high buccal mass area index and high PC 2 values express a high whorl expansion rate. Apertural surface area index decreases diagonally from the upper left corner down to the bottom right. Nine example specimens (eight ammonoids and one nautilid, highlighted) show several different developmental pathways with respect to their feeding ecologies. The large symbols of the highlighted specimens represent the last measurable half whorl (final adult measurements); the small symbols represent the ontogeny from hatchling size onward; and white dots represent all ontogenetic stages for the nonhighlighted specimens.
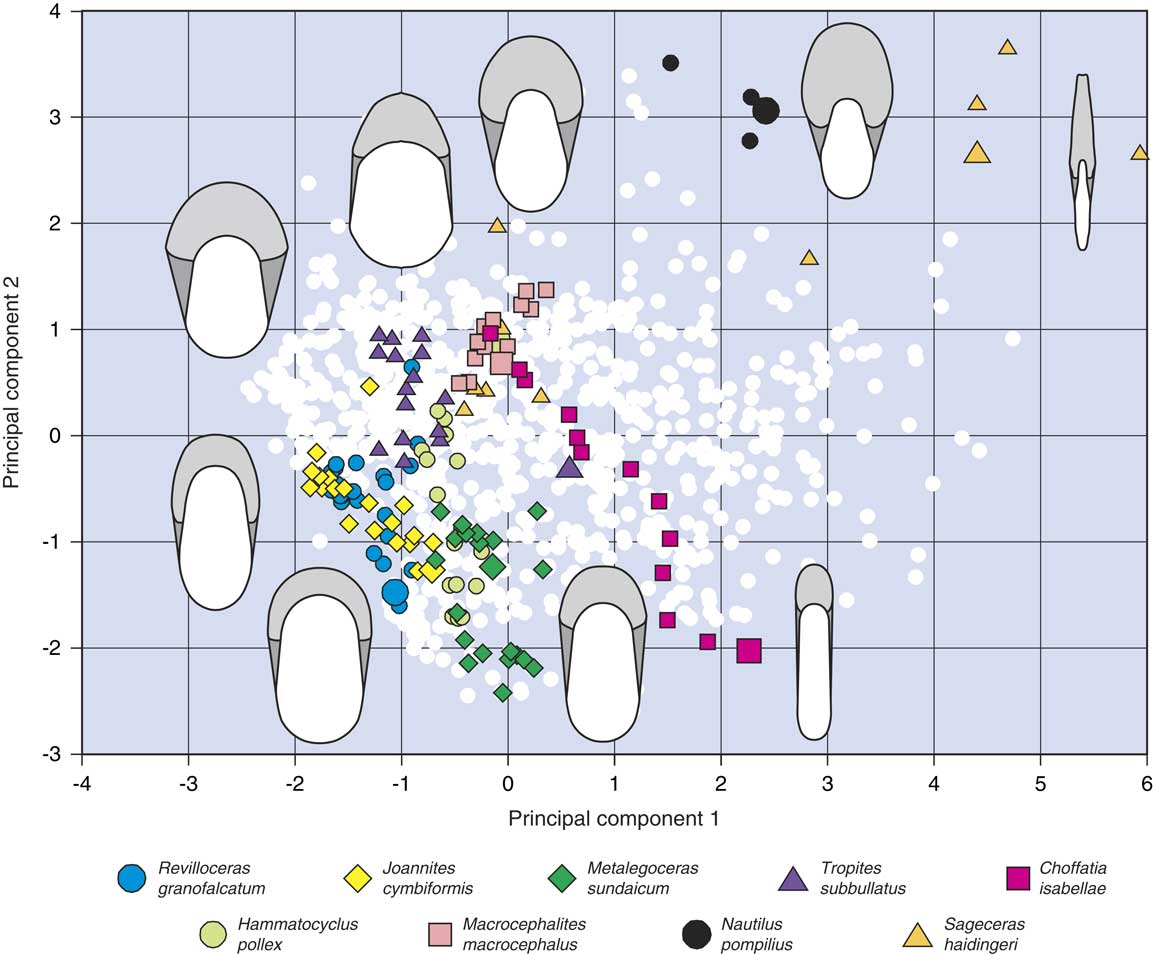
The lower left corner is thus occupied by the conchs that are characterized by a low WER in combination with low BMAI but a high ASAI. This is the most densely occupied area; it is mainly filled with data points representing the juvenile stages of development of the individual specimens.
The scatter plot demonstrates that the pachyconic, slowly coiling ammonoids of various stratigraphic ages (Revilloceras of the Carboniferous and Joannites of the Triassic) cover similar fields in the lower left corner of the morphospace. With increasing coiling rate and reduced whorl overlap (Hammatocyclus and Macrocephalites), they are arranged toward the upper right. Nautilus can be seen to occupy an otherwise empty upper peripheral area of the morphospace, as do the last four half whorl data points of Sageceras (Fig. 4).
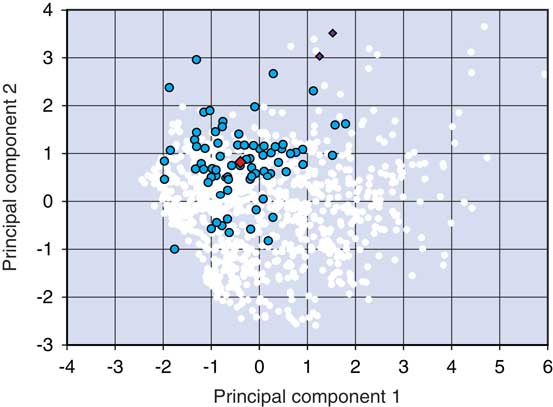
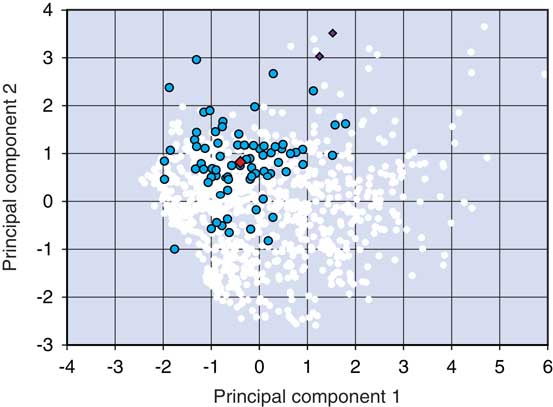
It can also be seen that the hatchling ammonoid specimens start off in a limited area (around PC 1=0; PC 2=1) of the morphospace (Fig. 5) and then drift apart as they develop toward the adult stage. Nautilus pompilius hatchlings, however, occupy a different area from most of the ammonoid hatchlings (Fig. 5).
PCA diagram highlighting the first half whorl measurements (hatchlings) of the ammonoid specimens (dark dots), position of the centroid of the ammonoid hatchlings (large diamond), and nautilid specimens (small diamonds); white dots represent all later ontogenetic stages.
The highlighted examples disperse in different directions during ontogeny:
1. Revilloceras, Joannites, and Metalegoceras move toward the lower margin of the morphospace.
2. Hammatocyclus and Macrocephalites move toward higher PC 2 values, but remain as adults at PC 2=1.
3. Tropites shows a similar pathway during ontogeny, but turns back in the terminal stage due to the significant adult modification.
4. Choffatia moves toward the lower right margin.
5. Sageceras moves toward the upper right margin.
6. Nautilus has, during its short ontogeny, a position at the central upper margin.
Discussion
The parameters described here, in particular the ASAI and BMAI, have the potential to help interpret the ecological preferences of the ammonoid species. These parameters apply to those organs of the ammonoid that were used for locomotion, feeding, and respiration.
Variation in the Size of the Buccal Mass
The wide range in BMAIs of ammonoid specimens within the same size (e.g., the diameter of the conch) categories reflects the spectrum of possible food items that could be consumed. Specimens with a low BMAI, notably those with globular and pachychonic conchs, would have been restricted to consuming small prey items with respect to their conch diameter. Ammonoids with a high BMAI, such as the discoidal species with a high aperture (thus being comparable to Nautilus), could have eaten larger prey items with respect to their conch diameter. A high BMAI would be useful for predators or scavengers, as a wider range of potential food items could be handled and swallowed.
Variation in Hyponome Areas
The ontogenetic trajectories for the HypAI follow the same pattern as the BMAI trajectories. This means that not only do pachychonic and globular-shaped ammonoids possess lower BMAIs, but they also have smaller HypAIs. A smaller HypAI would result in a reduced amount of thrust for locomotion and a smaller intake of water into the mantle cavity. Therefore, the lower HypAI would suggest ammonoids that were rather slow moving.
Ammonoid Feeding Ecology: Hatchlings
It has been proposed by multiple researchers that hatchling ammonoids would have been planktonic in nature (Weitschat and Bandel Reference Weitschat and Bandel1991; Landman et al. Reference Landman, Tanabe and Shigeta1996b; Mapes and Nützel Reference Mapes and Nützel2009; Tajika and Wani Reference Tajika and Wani2011; Tanabe Reference Tanabe2011; De Baets et al. Reference De Baets, Klug, Korn and Landman2012; Korn and Klug Reference Korn and Klug2012; Ritterbush et al. Reference Ritterbush, Hoffmann, Lukeneder and De Baets2014). Due to their small size and limited swimming capabilities (Weitschat and Bandel Reference Weitschat and Bandel1991; Klug and Korn Reference Klug and Korn2004), hatchlings likely would have fed on other members of the zooplankton; for a review of ammonoid stomach contents, see Klug and Lehmann (Reference Klug and Lehmann2015). Also, due to the great degree of congruence seen in conch morphology in ammonoid hatchlings (Klug et al. Reference Klug, Baets and Korn2016a), although there are some exceptions (Klug et al. Reference Klug, Baets and Korn2016a), the feeding ecology of hatchlings has been assumed to be quite similar. This has been shown to be the case with the ASAI, BMAI, and WER—there is a dense cloud of hatchling data points in the same area of the ecomorphospace (Fig. 5). Ecomorphs of hatchlings, broadly speaking, represent feeding forms with a medium-sized buccal mass and large apertural opening. The hatchling ecomorph would be well suited to capturing and devouring prey items that could be relatively large in proportion to its conch diameter. This is a feeding strategy that would allow the young ammonoids the chance to feed on a relatively wide spectrum of possible prey items and would support fast growth rates.
Ammonoid Feeding Ecology: Juveniles
During development, the niches of different ammonoid species can become more disparate as their conch morphologies change (Klug Reference Klug2001; Klug et al. Reference Klug, Baets and Korn2016a). The potential for a great diversity of feeding ecologies begins to become apparent in the juvenile stage of the Ammonoidea, when the conch form and its apertural opening become quite different from those of the hatchling stage, as expressed in the ecomorphospace in the developmental pathways (Fig. 4).
Juveniles of some species may leave the planktonic zone and migrate down the water column to a more nektonic or demersal lifestyle. It has been proposed that species following this ontogenetic change in niche type would develop a more lenticular or discoidal conch form (Ritterbush and Bottjer Reference Ritterbush and Bottjer2012) leading to a more compressed apertural opening but with a larger relative buccal mass for dealing with larger prey items or carrion. Genera such as Sageceras represent this shift with their extreme developmental pathway (Fig. 4).
A large buccal mass is ideal for the consumption and storage of macro-invertebrates, a number of smaller invertebrates in times of plenty, or scavenging carrion. It has been shown in fish that larger predatory individuals have access to a greater spectrum of prey sizes. Fish with a large gape size not only search for and eat larger prey but will also consume smaller animals; the larger gape allows for more chances to encounter prey (Scharf et al. Reference Scharf, Juanes and Rountree2000). The ability to consume large quantities of food in one go is of benefit to species that do not have access to regular food sources. According to O’Dor et al. (Reference O’Dor, Forsythe, Webber, Wells and Wells1993), Nautilus can hold 50 g of food in its crop, and this will last it for more than 2 months in times of scarcity. An ammonoid with a high ASAI (>0.4) and a medium to high BMAI (>0.1) would have possessed a relatively large buccal mass, ideal for accommodating macro-invertebrates or scavenged food, and a large hyponome for increased mobility.
Other species of ammonoids may have remained in the planktonic zone as they grew. In order to maintain feeding efficiency, allometric growth in feeding morphology would be expected, as there is a scale-up from a hatchling ammonoid feeding on plankton to an adult, where the relative proportions of predator compared with its prey are greatly increased. The change in scale between predator and prey could result in a change in prey-capture methods. A larger individual feeding on relatively smaller prey items needs to catch more of them at a faster rate. The developmental pathways of the pachyconic or thickly discoidal ammonoids (Revilloceras, Joannites, and Metalegoceras) show a downward trend in the lower left of the ecomorphospace (Fig. 4), meaning they are occupying an area of ecomorphospace representing lower WERs and BMAIs. The lower BMAIs indicate a smaller-sized class of prey, such as zooplankton or small benthic organisms.
Ammonoid Feeding Ecology: Adults
Some changes in the ontogenetic trajectories in the ecomorphospace may represent mature adult modifications that are linked to reproductive behavior rather than feeding behavior. A large deviation in the adult stage (last half whorl) from the rest of the apertural ontogeny is clear to see in Tropites (Fig. 4). The earlier ontogenetic stages for Tropites plot in an area of ecomorphospace associated with low BMAIs and associated planktivorous feeding behavior, whereas the last half whorl plot of the adult stage occupies a region associated with higher BMAIs. However, in the case of Tropites, it would seem that the sudden adult modification shifting to a higher BMAI is perhaps associated with breeding behavior or even egg laying or brooding, as has been posited for other ammonoids and their adult modifications (Walton et al. Reference Walton, Korn and Klug2010; Korn and Klug Reference Korn and Klug2012; Klug et al. Reference Klug, Zatoń, Parent, Hostettler and Tajika2015b; Tajika et al. Reference Tajika, Naglik, Morimoto, Pascual-Cebrian, Hennhöfer and Klug2015), rather than an extreme change in feeding behavior.
Nautilus Feeding Ecology
The inclusion of N. pompilius in the ecomorphospace is useful, as it provides a neontological example that has been studied and observed with regard to its feeding behavior. Nautilus pompilius has been documented using both active predatory behavior (Saisho and Tanabe Reference Saisho and Tanabe1985) and scavenging behavior on the seafloor (Nixon Reference Nixon1988; Dunstan et al. Reference Dunstan, Ward and Marshall2011). Nautilus can eat relatively large amounts of food at one time, and this may keep it going for an extended period of time (Ward et al. Reference Ward, Stone, Westermann and Martin1977; Saisho and Tanabe Reference Saisho and Tanabe1985; O’Dor et al. Reference O’Dor, Forsythe, Webber, Wells and Wells1993). The high BMAI, ASAI, and WER seen in Nautilus provide the best preconditions for this feeding ecology. The high ratios enable the presence of a relatively large buccal mass positioned in a short but high body chamber (Nixon Reference Nixon1988). The relatively large buccal mass and the tentacles form an effective means for manipulating food (Nixon Reference Nixon1988), prey or scavenged. A short body chamber (high WER) provides more stability, which is important for neutrally buoyant animals in locating and handling prey such as macro-invertebrates (Saunders and Shapiro Reference Saunders and Shapiro1986; Okamoto Reference Okamoto1996). A conch that can reduce rocking effects while in motion is able to maintain the same apertural orientation during the search for food (Saunders and Shapiro Reference Saunders and Shapiro1986).
The high apertural opening in Nautilus also allows for a relatively large hyponome (high HypAI), which provides a propulsive force allowing it to travel efficiently at slow speeds over large distances (O’Dor et al. Reference O’Dor, Wells and Wells1990, Reference O’Dor, Forsythe, Webber, Wells and Wells1993).
Nautilus pompilius and the extinct nautilid species occupy the upper center of the ecomorphospace, an area representing morphs that are strikingly underrepresented in the samples used for this study (Fig. 4). The feeding ecomorph following the Nautilus pattern would appear to be rarer in ammonoid species that were included in this study.
An important distinction to make between the Nautilus ontogenetic pathway through the ecomorphospace and those of the ammonoids is in the region of occupation of their early stages of development. The entire ontogenetic development of N. pompilius is restricted to the same upper central region of the ecomorphospace, thus representing a relatively consistent feeding style in the young and adults; this is confirmed from observations on living specimens in the wild (Dunstan et al. Reference Dunstan, Ward and Marshall2011). The hatchling feeding ecologies of the Ammonoidea and modern-day Nautilus are extremely different. The Ammonoidea, which were very small as hatchlings (Landman et al. Reference Landman, Tanabe and Shigeta1996b; De Baets et al. Reference De Baets, Klug, Korn and Landman2012), are assumed to have lived in the planktonic zone and to have fed on zooplankton (Weitschat and Bandel Reference Weitschat and Bandel1991; Landman et al. Reference Landman, Tanabe and Shigeta1996b). Nautilus hatchlings, on the other hand, are already larger than some adult ammonoids, having a conch diameter of 25–30 mm (Landman et al. Reference Landman, Cochran, Rye, Tanabe and Arnold1994), and are capable of eating macroinvertebrates and carrion. For the morphology of the whorl profile in the hatchling, the shape of the protoconch plays an important role: In ammonoids, the first whorl closely embraces the globular or spindle-shaped protoconch, while the first whorl in Nautilus originates from the conical protoconch, allowing a nearly circular whorl profile with the potential to accommodate a much larger buccal apparatus. This disparity in hatchling feeding ecologies has been captured in the ecomorphospace with the planktivorous hatchling ammonoids plotting in a very different region than the hatchling Nautilus (Fig. 5).
Iteration in Ecomorphs through Time
Although the number of specimens used for the current study has by no means been exhaustive, it has at least provided an outline for exploring the feeding ecologies of some ammonoids. Of particular note is the repetition in the occupation of areas of ecomorphospace from species from differing time periods. This is best illustrated with two pachyconic ammonoids, the early Carboniferous R. granofalcatum and the Late Triassic J. cymbiformis (Fig. 4). The two aforementioned species occupy the bottom left of the ecomorphospace, an area representing low BMAIs and WERs, ecomorphs that, because of their long, wormlike, soft bodies with horseshoe-shaped profiles, were probably rather slow moving (Jacobs Reference Jacobs1992; Walton et al. Reference Walton, Korn and Klug2010; Klug et al. Reference Klug, Baets and Korn2016a) and possessed weak muscle attachments (Saunders and Shapiro Reference Saunders and Shapiro1986; Doguzhaeva and Mapes Reference Doguzhaeva and Mapes2015). The low BMAI indicates a small size class of prey such as zooplankton. The similarities in feeding ecology between the ontogenetic development of the two species (Fig. 4) match the repetitive patterns in CWI and UWI ontogenetic trajectories seen in pachyconic ammonoids. Another pachyconic ammonoid species, the Middle Jurassic M. macrocephalus, occupies a more central area of the ecomorphospace, an area densely occupied with hatchling morphs. The disparity in the ecomorphospace between M. macrocephalus and the other two aforementioned pachyconic species and the differences in their ontogenetic pathways highlight a discrepancy between Paleozoic and Triassic versus Jurassic pachyconic ammonoids with regard to the ontogenetic development of their conchs.
The two nautilid genera Cenoceras and Nautilus also show a degree of similarity in their occupation of the ecomorphospace (Fig. 4), implying a similarity in feeding ecologies.
Conclusions
The ecomorphospace presented here emphasizes the disparity of feeding ecologies seen within the life history of ammonoids. In some cases the changes are quite dramatic, with widely spaced ontogenetic pathways being plotted in the ecomorphospace (Choffatia and Sageceras). Even in other species with shorter ontogenetic pathways, such as Revilloceras and Joannites, the disparity between hatchling and adult is still greater than that seen in the two nautilid genera.
Many of the ammonoid hatchlings plot within the same relatively constrained area of morphospace, despite large degrees of morphological variation in the adults. This provides more evidence for the theory that the hatchlings were passive planktonic drifters in the initial posthatching phase, irrespective of clade affiliation or adult feeding ecology.
Allometric changes to feeding ecology have been shown to occur in planktonic ammonoid species, representing differing feeding styles used on zooplankton, to maintain an efficient competitive edge as the relationship between predator and prey volumes scales up.
There is a repetitive pattern in ontogenetic changes to feeding ecologies seen in some of the studied ammonoid species, which are from different clades and time periods. This provides modeled evidence for the idea that ammonoids were able to recreate similar niches at various stages during their evolutionary history when the correct biotic and abiotic conditions were present.
By proposing these methods, we hope to help demonstrate the potential of ammonoid conch cross sections, allowing for more data extraction. The suggested models for the buccal mass and hyponome are in our opinion useful in helping to explore the evolutionary reasons behind the shape and size of the apertural opening in the conch. The models provide a framework for estimating the soft part morphology and the chance to test ideas on ammonoid trophic and ecological habits.
Acknowledgments
The authors would like to thank C. Klein (Museum für Naturkunde, Berlin) for her assistance in producing and measuring conch cross sections. We would also like to thank the reviewers P. Yacobucci and C. Klug for their helpful and constructive suggestions and an anonymous reviewer. This study was made possible due to funding from the Deutsche Forschungsgemeinschaft (DFG; KO1829/16-1).
Supplementary material
Data available from the Dryad Digital Repository: https://doi.org/10.5061/dryad.tk06g.2