


Introduction
Vapor transport in snow and firn is of basic importance in many areas of glaciology. Glacier mass-balance assessments require knowledge of sublimation rates, along with accumulation, redistribution and melt. Ice-core interpretation requires knowledge of vapor transport for assessing effects of recrystallization and chemical-species transport in snow. Interpretation of remotely sensed signatures in polar regions requires an understanding of the effects of microstructure and microstructure change, which occurs through vapor transport.Traditionally in vapor-transport estimates in snow, it is assumed that diffusion is the only controlling physical process and that the water vapor is at saturation density for the local temperature. However, it is well known in the field of mass transfer that advective processes can induce far greater mass exchange and transport than processes of diffusion. In addition, in instances where advection causes disequilibria, the local water vapor may not be at saturation density, inducing even more mass transfer (sublimation or condensation). This paper presents a theoretical investigation of the effects of advective transport of water vapor in snow due to wind-induced interstitial airflow through snow and firn, also known as snow ventilation.
Interpretation of chemical analysis of snow initially motivated studies of snow ventilation. Reference GjessingGjessing (1977) postulated that air movement through snow (ventilation) depends on snow structure and snow surface roughness. Reference Clarke, Fisher and WaddingtonClarke and others (1987) identified windpumping as an important mechanism for air movement in snow. It has been shown theoretically that both turbulent winds over a flat surface and winds over surface relief can cause pressure perturbations to propagate vertically into the firn (Reference ColbeckColbeck,1989; Reference Clarke and WaddingtonClarke and Waddington, 1991; Reference Waddington, Cunningham, Harder, Wolff and BalesWaddington and others 1996). Snow and firn properties affect ventilation rates (Reference AlbertAlbert, 1996; Reference Albert, Arons, Davis, Wolff and BalesAlbert and others 1996). Surface pressure forcing due to the wind may also cause significant lateral flow in buried layers of high permeability (Reference AlbertAlbert, 1996; Reference ColbeckColbeck, 1997). Reference Albert and McGilvaryAlbert and McGilvary (1992) demonstrated that temperature profiles resulting from wind-pumping arise from a balance between diffusive and advective heat-transfer processes, and also showed that there may be significant air movement in snow that temperature measurements will not reveal if steep temperature gradients or relatively high firn thermal conductivity occur. Snow ventilation affects chemical-species transport in the snow (Reference Waddington, Cunningham, Harder, Wolff and BalesWaddington and others, 1996; Reference McConnell, Bales, Stewart, Thompson, Albert and RamosMcConnell and others 1998) and has the potential to affect ice-core interpretation (Reference Cunningham and WaddingtonCunningham and Waddington, 1993).
While the effects of interstitial airflow (ventilation) on vapor transport in snow have not been discussed in the literature, there have been studies of diffusion of water vapor in snow. Many investigations of water-vapor movement in snow have focused on metamorphic effects of vapor movement on crystal structure (e.g. Reference Giddings and LaChapelleGiddings and La Chapelle; 1962; Reference ColbeckColbeck, 1983a, Reference Colbeckb; Reference GublerGubler, 1985). Studies have also been conducted considering a more macroscopic view of snow as a porous medium. Reference ColbeckColbeck (1993) conducted a theoretical investigation of vapor transport in snow and concluded that the effective vapor-diffusion coefficient driven by temperature gradients in snow is 4–7 times greater than in air. Reference Whillans and GrootesWhillans and Grootes (1985) investigated isotopic diffusion in snow and firn and concluded that vapor diffusion is the rate-limiting mechanism for isotopic smoothing, and that the most rapid diffusion occurs in low-density firn during the summer. Reference Cuffey and SteigCuffey and Steig (1998) adapted the theory of Whillans and Grootes to investigate smoothing of isotopic signatures for ice-core interpretation, and concluded that cold areas with high snow accumulation best preserve the original isotopic signatures in the snow. They note that, for isotopes, assuming a diffusion coefficient for water vapor in snow equal to that in air gives the best fit to the data. Field measurements from firn cores have been used to infer the net effects of vapor transport. from simultaneous δD and δ18O measurements from an Antarctic firn core, Reference Satake and KawadaSatake and Kawada (1997) estimate that the firn lost 30–35% of deposited snow during firnification andwas enriched in deuterium and O18 by about 50‰ and 6‰, respectively, relative to the deposited snow. Thus it is evident that vapor movement plays a key role both in microscopic processes of crystal change and in macroscopic effects of mass loss and species redistribution. There have been no previously published assessments of the effects of ventilation on vapor transport in snow.
The ventilation modeled in this paper is that driven by the wind through pressure differences across a rough snow surface. It is possible that turbulence in strong winds plays a role in ventilation even over flat surfaces, but that is not explicitly considered in the calculations presented here. Surface roughness of various forms and sizes exists on masses of snow and ice. At many sites, wind-produced surface roughness on the order of 10–100cm high and 3–15m wavelength exists in the forms of sastrugi or barchans. on the East Antarctic plateau and perhaps elsewhere, large dune fields exist with roughness amplitudes of several meters and wavelengths of several kilometers (Reference Fahnestock, Scambos, Shuman, Arthern, Winebrenner and KwokFahnestock and others, 2000). These ``megadunes’’ occur in areas of sustained winds and have crests that are oriented perpendicular to the local katabatic wind direction. the snow in these areas is extensively recrystallized (Reference GiovinettoGiovinetto, 1963; Reference Fahnestock, Scambos, Shuman, Arthern, Winebrenner and KwokFahnestock and others, 2000). Thus wind-induced pressure variations across surface roughness on a variety of scales create the potential for ventilation to exist on a variety of scales.
Governing Equations
The airflow is assumed to follow Darcy’s law, where the Darcy velocity or volumetric flux of the air, νi is given by

where P is pressure deviation from ambient pressure, kij is permeability and μ is viscosity of the air. Repeated indices imply summation. Assuming incompressible gas flow through the porous medium, the equation to be solved for airflow through snow is

where P0 is the ambient pressure and ϕ is the porosity.
Vapor transport
This model is unlike conventional assessments of vapor transport in snow because it allows for the possibility, but does not assume, that the local vapor density in snow is equal to the saturation density at the local snow temperature. the transport of water vapor through snow follows an advective–diffusive equation:

where the source term, S, is the source of vapor due to sublimation or condensation. It is evident from the equation that the vapor density at a given location may change in time due to advection of vapor by the airflow, diffusion of vapor by vapor-density gradients and generation or dissipation of vapor by the source term. Since the vapor density is small compared to the density of the air, the advection term implies that the vapor is carried by the airflow.
The diffusion coefficient for water vapor in snow is assumed to be proportional to the diffusion coefficient in air:

For non-reactive materials, α is the ratio of porosity to tortuosity, in which case α is 51. In Equation (4), α represents the ratio of the diffusivity of water vapor in snow to that in air. Because the ice matrix of snow reacts with water vapor, it has been found (Reference YosidaYosida and others, 1955; Reference ColbeckColbeck, 1993) that α, when taken as an effective diffusion coefficient for temperature-gradient-driven water-vapordiffusion in snow, may lie between 4 and 7. Because the source/sink and diffusion terms are explicitly handled in the model, rather than lumped as an effective diffusion coefficient, α was taken as unity in the calculations presented here.
The source term, S, in Equation (3) is an important quantity. the source of vapor is sublimation which is driven by two phenomena: a change in vapor concentration due to the diffusion of vapor which is induced by temperature gradients alone, and a change in vapor concentration due to advection of vapor by airflow through the pore space. the theory described here includes both phenomena, although the primary concern of this paper concerns situations involving significant airflow.
It is well known that the flow of a fluid or gas through a medium results in mass-transfer rates that can be considerably higher than those which occur by diffusion alone. We describe the source of vapor due to phase change enhanced by airflow through snow by

The specific surface of the snow, as, is the surface area of the ice matrix per unit volume of snow. the saturation vapor density,  is given by the following curve fit to psychrometric data (ASHRAE, 1989), which takes on the form of the Clausius–Clapeyron equation of state:

where ρν0 and T0 are the reference vapor density and temperature, respectively (e.g. 2.36610–3 kg m–3 at 263.15 K), and C1 = 6145 K.The mass-transfer coefficient in Equation (5), hm, is estimated from a correlation of Reynolds, Schmidt and Stanton numbers developed by Reference Chu, Kalil and WetterothChu and others (1953) for mass transfer in gas–solid and liquid–solid systems in fixed and fluidized beds of porous media for cylindrical and spherical particles. They developed the correlation from a wide variety of materials and particle sizes:

where the Stanton number is  the Reynolds number is defined by
 the Schmidt number is
 the porosity is
 dp is the particle diameter, νa is the kinematic viscosity of air, and ρ is density, with subscripts a, s and i denoting air, snow and ice, respectively. the data used to develop this correlation included many Reynolds numbers in the Darcy range and a variety of materials.
Heat transport
Heat transport through snow follows an advective–diffusive equation:

where the heat capacity is weighted between the air and snow according to porosity:

In these equations, T is temperature, Cp is specific heat, λij is thermal conductivity and QT is the thermal source term. Because the density of water vapor is much less than that of air, one can assume that the sensible-heat effects are borne by the air. the source term, QT, includes latent-heat effects due to sublimation:

where S is the vapor source defined in Equation (5) and L is the latent heat of sublimation. for simplicity in the present analysis, we neglect changes in snow density and structure created by phase change.
The above system of coupled equations is solved by finite-element analysis using a two-dimensional finite-element code (Reference Albert and McGilvaryAlbert and McGilvary, 1992) based on the Galerkin method with linear triangular elements.
Results
Interstitial airflow patterns within the snow and firn are controlled by the nature of the surface forcing and also by the nature of the surface and subsurface permeability of the firn. While traditional estimates of ventilation have assumed uniform firn, in fact the layered nature of firn causes variability in interior ventilation, with faster flow in some buried high-permeability layers than in the overlying snow (Reference Albert, Arons, Davis, Wolff and BalesAlbert,1996). for the calculations presented here, we employ the permeability profile and snow characteristics measured at Siple Dome, Antarctica (Reference Albert, Shultz and PerronAlbert and others, 2000), using the curve fit described for permeability vs depth in that paper.
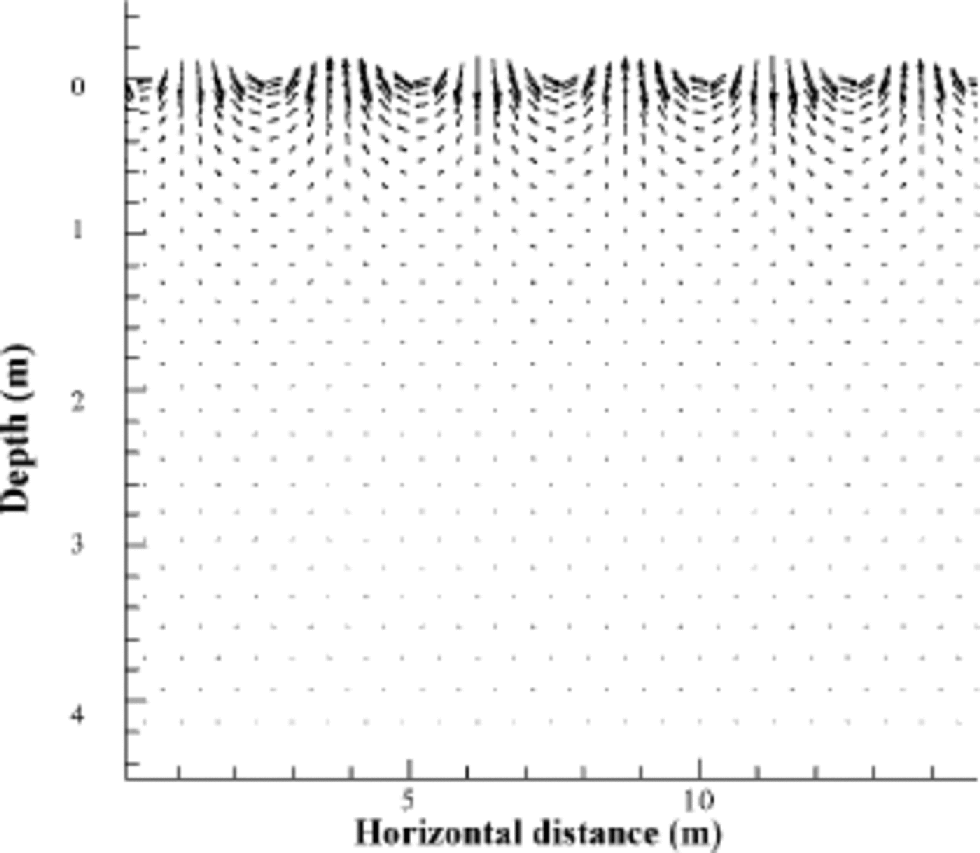
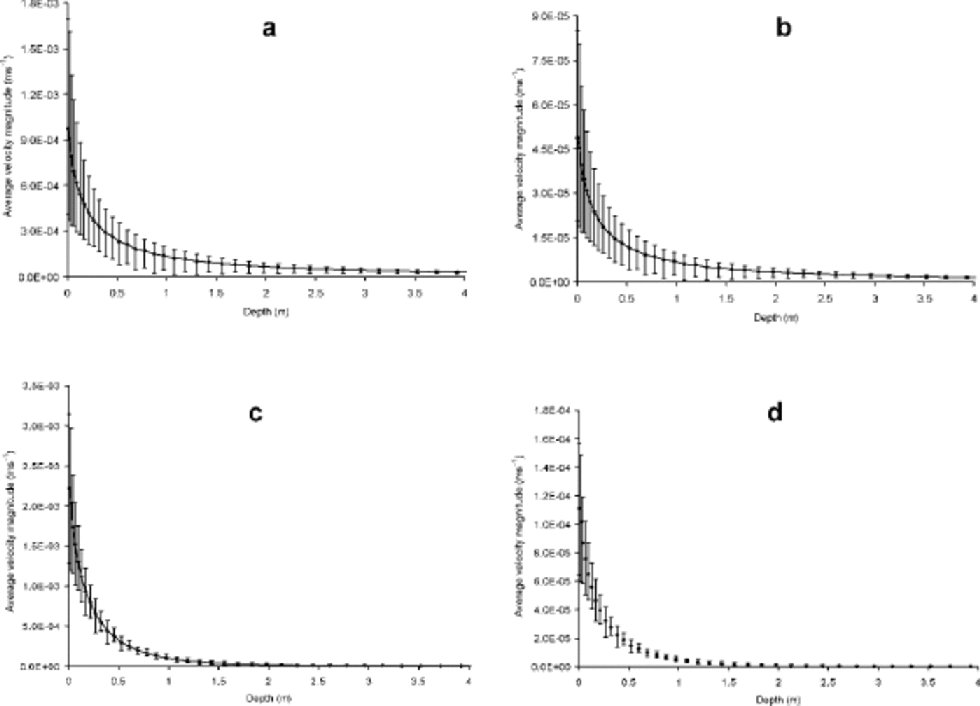
While the ventilation rates and depth of ventilation depend on both the surface forcing and the firn permeability, in general the airflow is greatest near the surface and decreases with depth. Figure 1depicts the airflow velocity vectors that result from a steady sinusoidal pressure forcing along the surface when the surface roughness wavelength is 3 m. the magnitudes of these vectors depend on the magnitude of the pressure difference between the snow crests and troughs. As examples of ventilation due to low and moderate wind conditions on sastrugi of several different wavelengths, surface pressures that we measured at Siple Dome are used in the following calculations. the surface pressure difference between crests and troughs of 0.25 Pa was measured on a small-amplitude (7 cm) sastrugi under light wind (3ms–1); under moderate winds (4–6ms–1), pressure amplitude on the same sastrugi was 5 Pa. By visual inspection and linear measurements from a tape, the wavelength of the surface sastrugi ranged between 3 and 10 m. the results of the calculations are shown in Figure 2. for each calculation, the two-dimensional airflow velocity profile was laterally averaged to produce an average velocity magnitude as a function of depth. the bars on each side of the average show the range in velocities at a given depth due to lateral position along the sastrugi. It is evident that the 10 m surface roughness wavelength will promote ventilation to an approximate depth of 2m, while the 3 msurface roughness induced ventilation down to an approximate depth of 1m.The amplitude of the pressure forcing controls the magnitude of the airflow for a given wavelength; the larger the amplitude of the forcing, the higher the air-flux velocities at a given depth. Under the low-wind conditions shown in Figure 2b and d (surface pressure variations of 0.25 Pa), it is evident that the ventilation rates are very low, probably on the same level as molecular diffusion. Under moderate conditions (Fig. 2a and c), however, the ventilation rates are significant.
Ventilation airflow velocity patterns in response to sinusoidal pressure variations along the surface with wavelength 3m.
Laterally averaged airflow velocity magnitudes as a function of depth for two surface wavelengths and two pressure amplitudes. the bar around the velocity at a given depth shows the range of velocities due to horizontal location along the sinusoid. (a) λ = 10m, P0 =5 Pa; (b) λ =10 m, P0 =0.25 Pa; (c) λ =3 m, P0 =5 Pa; (d) λ =3m, P0 =0.25 Pa.
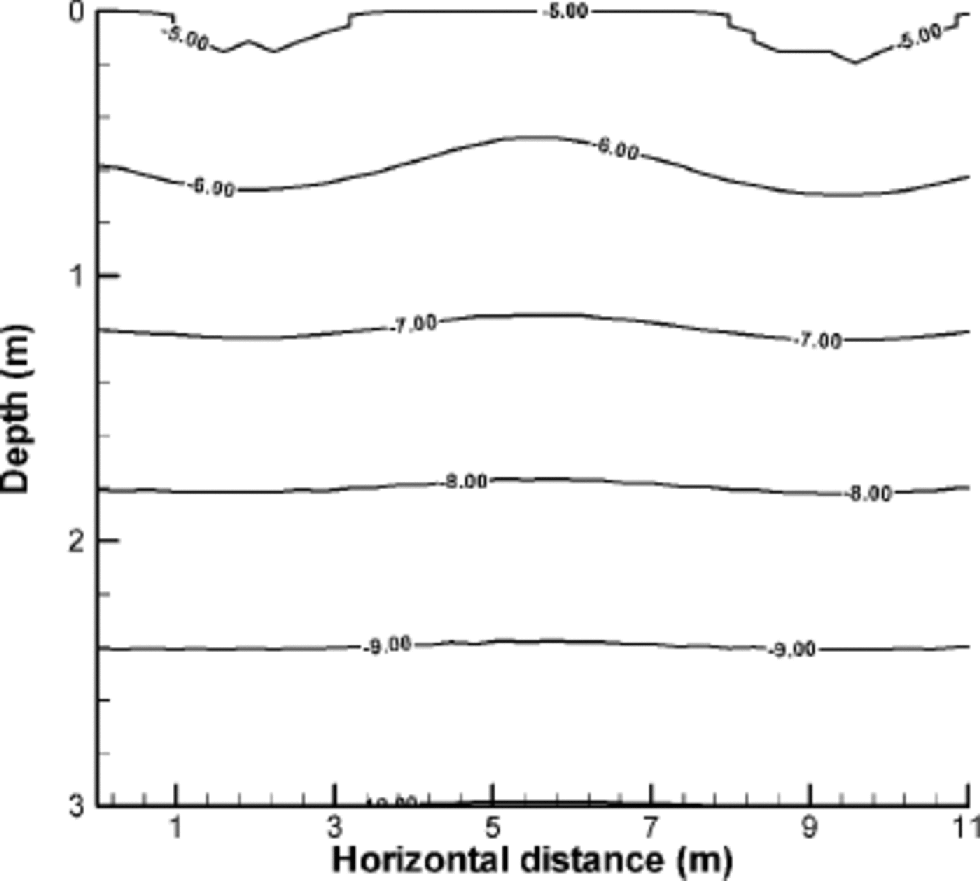
Ventilation advects heat, in addition to advecting water vapor and chemical species. for transport of a passive scalar such as temperature in advective–diffusive problems, the resulting scalar distribution is the net result of the interplay of conduction and forced convection due to ventilation. Because windpack and firn usually have a high thermal conductivity relative to some light seasonal snow types, conduction often plays a strong role in the determination of the temperature, and measured temperature profiles sometimes cannot be distinguished from pure conduction alone, even though there may be high interstitial airflow rates (Reference AlbertAlbert, 1993, Reference Albert1995). In Figure 3, the isotherms in the top 10 m are shown for an advective–diffusive calculation using the velocity field shown in Figure 1, with surface pressure difference amplitude of 5 Pa (moderate winds) and wavelength of 3 m. Note that, in order to view the details of the temperature variations, the plot for Figure 3 focuses on the top 3 m, with 11m horizontal distance. Inb the top meter of snow and firn, small temperature variations are induced by interstitial advection.
Isotherms from an advective–diffusive temperature calculation in the firn due to the forcing from a pressure variation with λ = 3 m and P0 =5 Pa (small roughness feature and moderate winds).
Vapor transport is sensitive to firn temperature because the saturation vapor density is a sensitive function of temperature (Equation (6) above). Enhanced vapor transport due to ventilation arises from the fact that the vapor content of the moving air will rarely be at equilibrium (saturation) levels with the surrounding snow. Figure 4 depicts contours of the sublimation rates (kgm–3 s–1) due to the airflow and temperature calculations presented above (in Fig. 1 and 3). As in Figure 3, this plot focuses on the top 3 mwith 11m horizontal distance. Positive values indicate sublimation rates, and negative values indicate condensation rates. the lateral variability is evident; airflow patterns induce regions of sublimation and regions of condensation within the snow and firn. the results shown here are for steady flow. In nature, because small surface sastrugi move in time as the snow surface profile changes due to wind redeposition, the subsurface flow and regions of condensation and sublimation will also likely change on a time-scale of days to weeks. However, in regions where the surface-roughness features move very little over the course of years (e.g. due to subsurface topography), it is likely that the stationary regions of condensation and sublimation will have a marked effect on the microstructure of the firn. This is especially true in low-accumulation areas, where the top several meters of snow and firn representmany years of accumulation and long exposure to the effects of ventilation. While the highest mass-transfer rates occur near the surface, the depth of vapor transport and phase change depends on firn properties (highly permeable snow will allow more ventilation than lower-permeability snow), surface roughness wavelength (the longer the wavelength the deeper the ventilation) and temperature (warmer air can hold more water vapor than colder air). These influences will be further investigated in ongoing work.
Contours of firn sublimation rate (kgm–3s–1) from steady airflow due to the forcing from a surface pressure variation with λ = 3 m and P0 = 5 Pa (small roughness feature and moderate winds).

Conclusions
The assessment of sublimation rates and vapor transport in firn has traditionally assumed that diffusion is the only governing transport phenomenon and that the vapor in the firn is in local equilibrium or at saturation levels. In this paper, a multidimensional finite-element model was used to calculate sublimation/condensation effects due to ventilation and diffusion, allowing the vapor to be variably saturated. Because the thermal conductivity of firn is relatively high (compared to seasonal snow), the advective/diffusive balance is often skewed toward the diffusion temperature profile, even though there may be significant interstitial air motion in the firn. In these calculations, small temperature differences due to ventilation are evident. Regions of sublimation and condensation occur in the snow and firn as a result of ventilation. for small surface-roughness elements that evolve and move in time on the scale of hours or weeks, such as sastrugi, these regions of sublimation and condensation therefore also relocate in time. However, for roughness elements that remain at relatively fixed locations for months and years, the regions of sublimation and condensation are likely to have significant impact on the firn microstructure itself, especially in low-accumulation regions. In continuing work on this topic, we will further investigate effects on sublimation on snow microstructure and the effects of vapor transport on grain growth, permeability and firnification.
Acknowledgements
I thank E. D.Waddington and W. F. Budd for constructive and helpful reviews. Initial development of the vapor-transport model was facilitated by a grant from NASA’s Program for Arctic Regional Climate Assessment. This study was funded by the U.S. National Science Foundation grant NSF-OPP 9814676.



