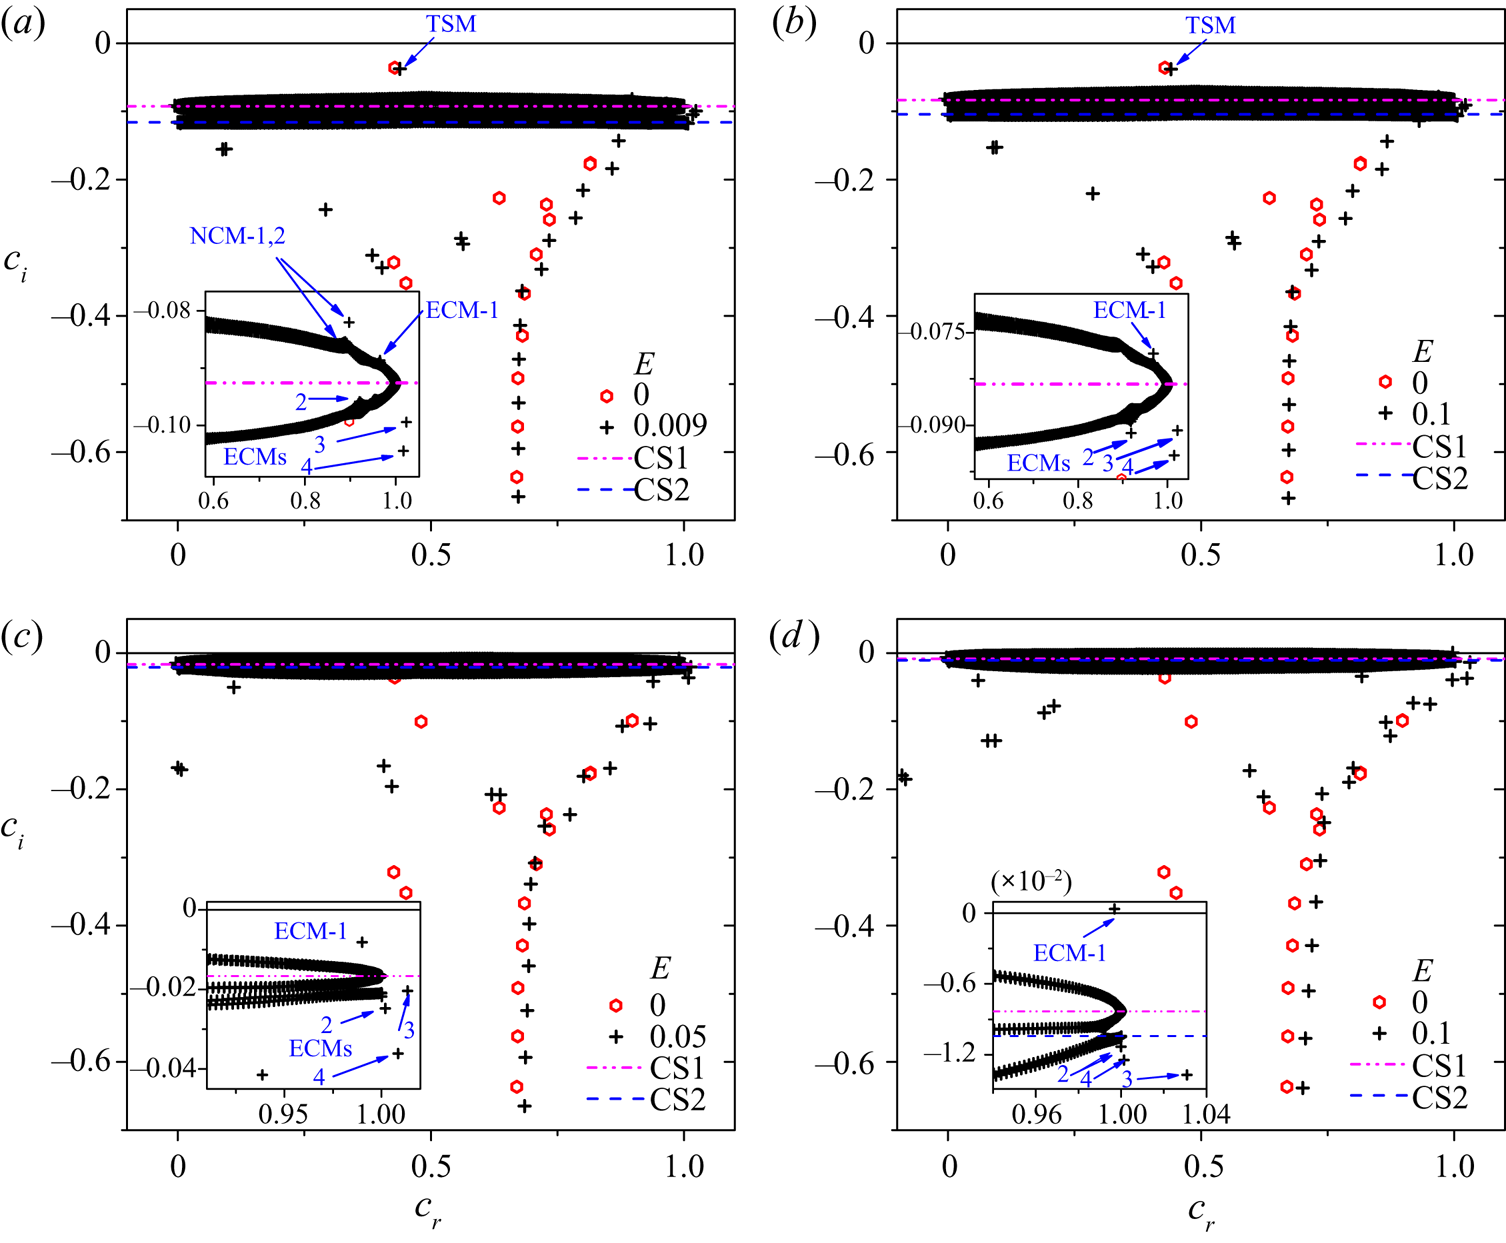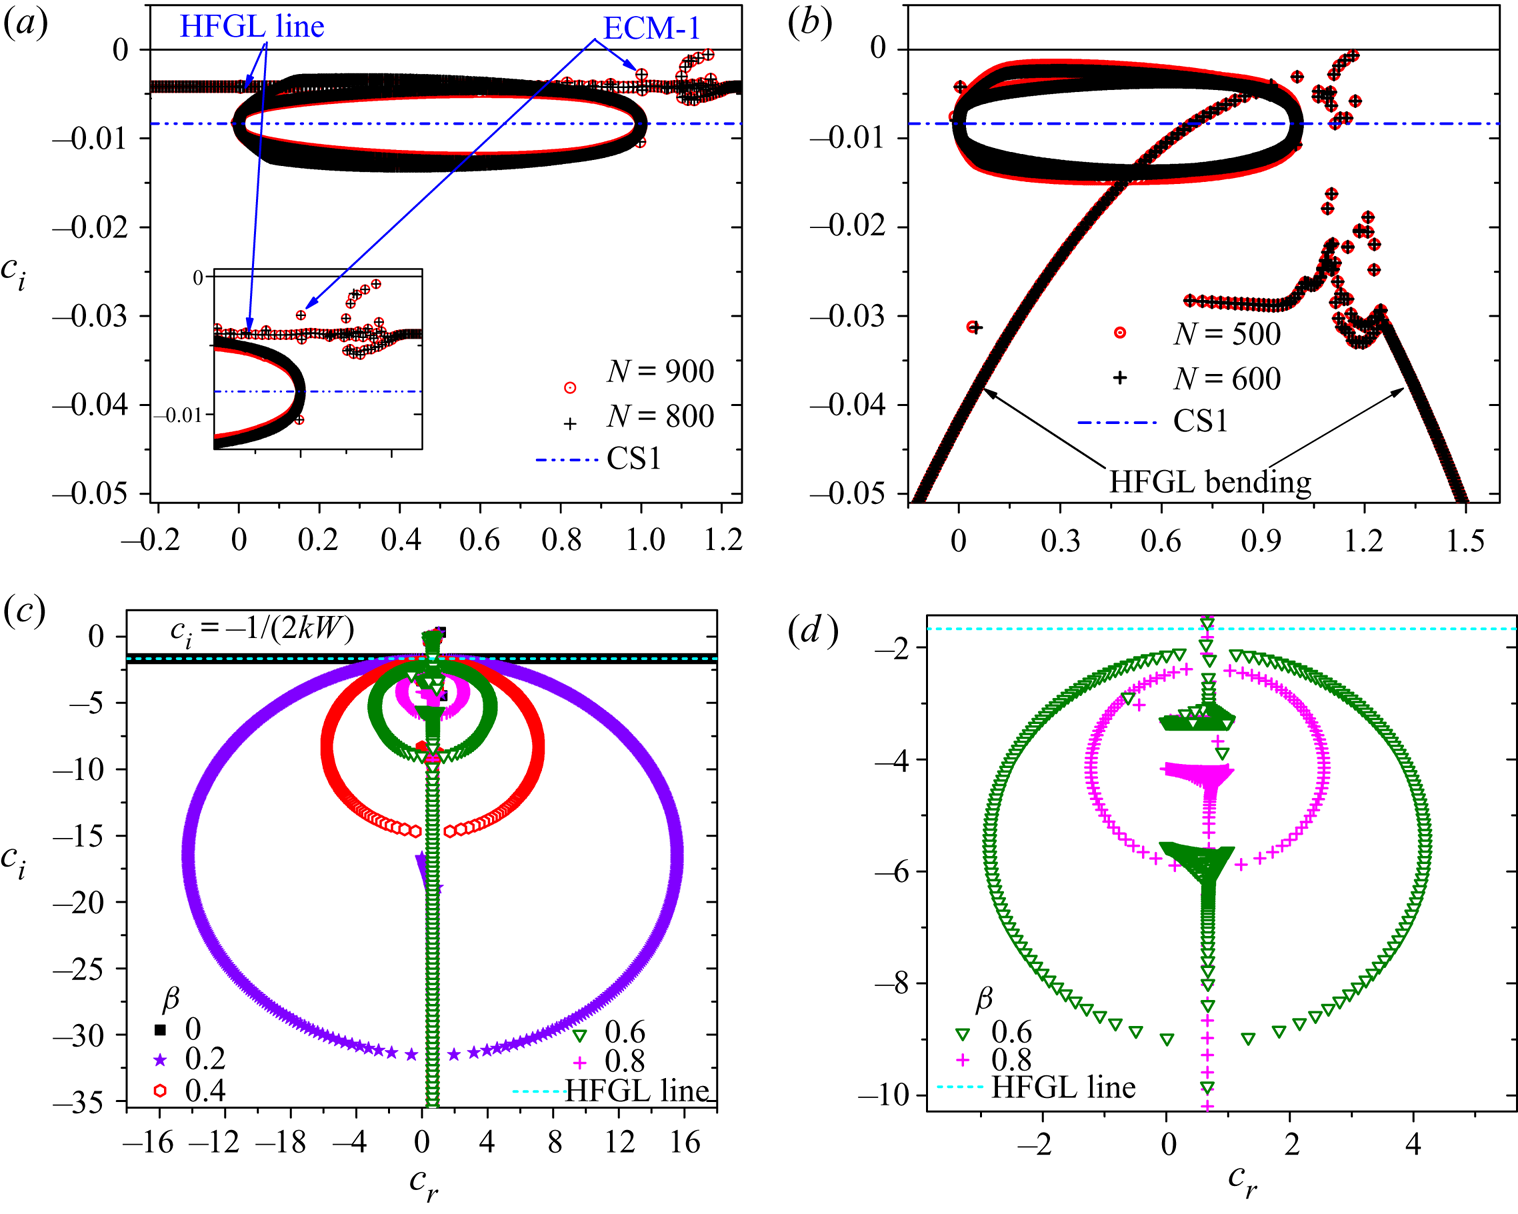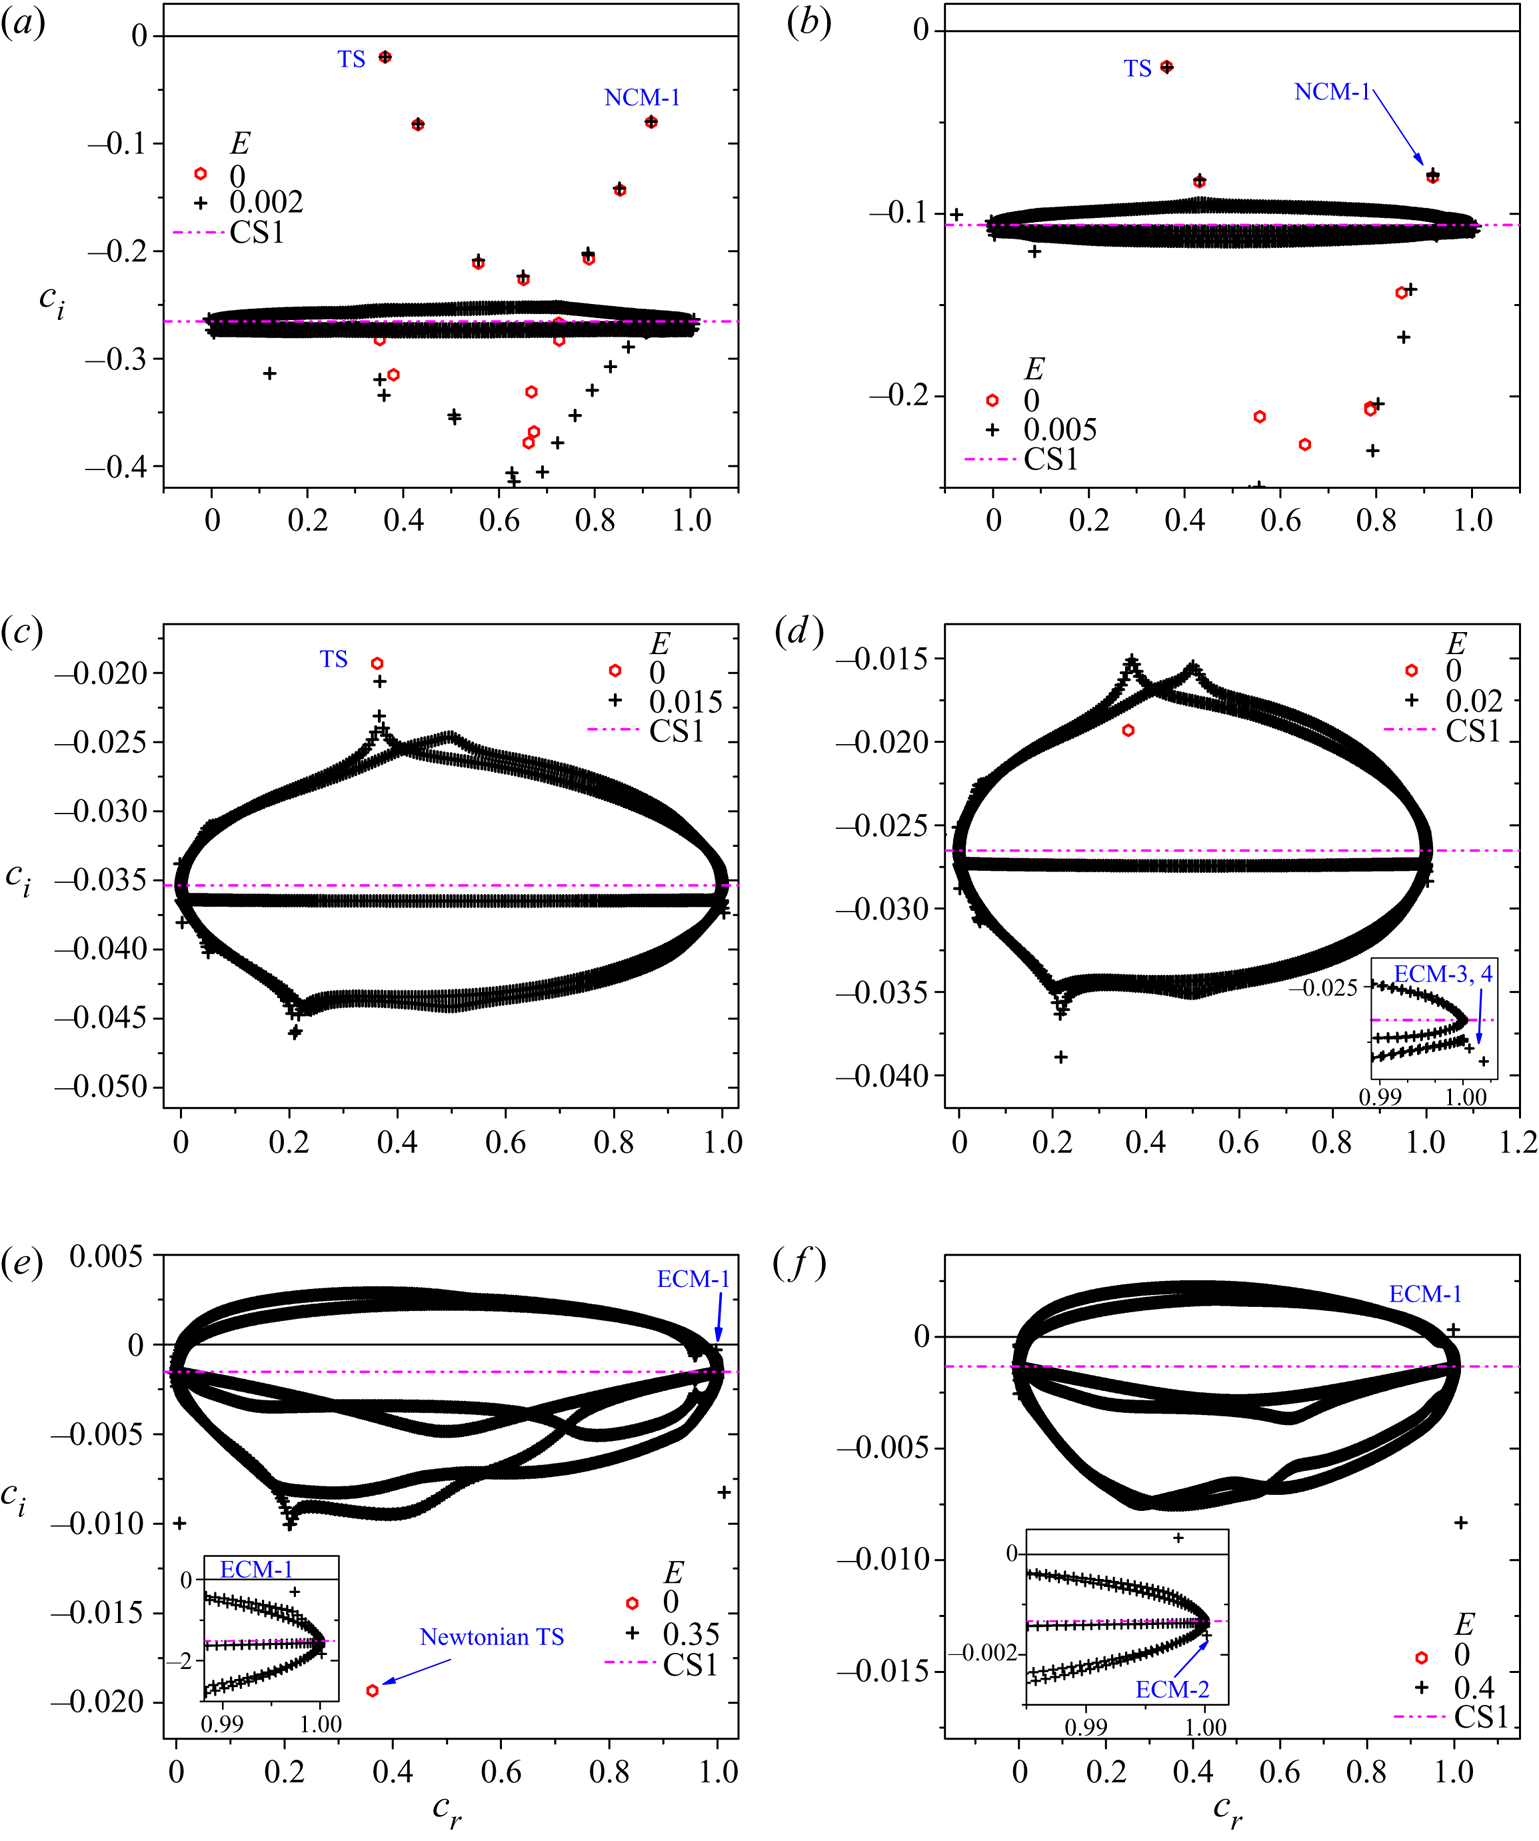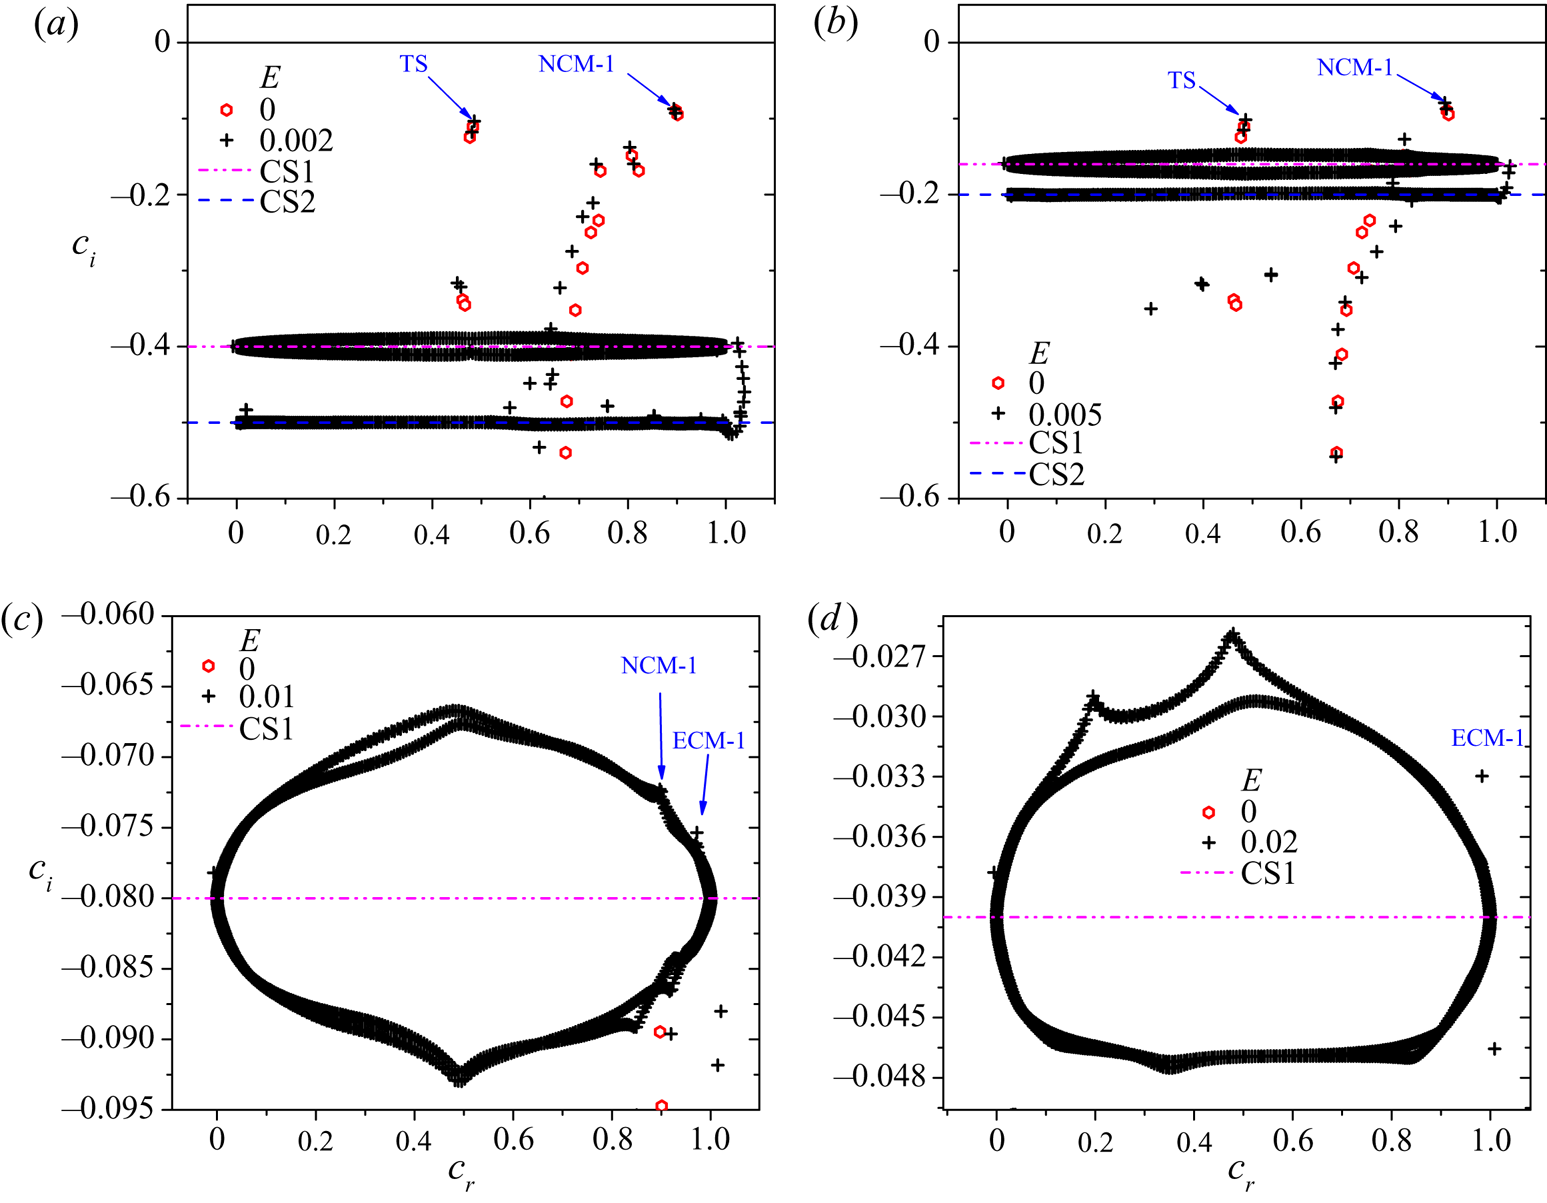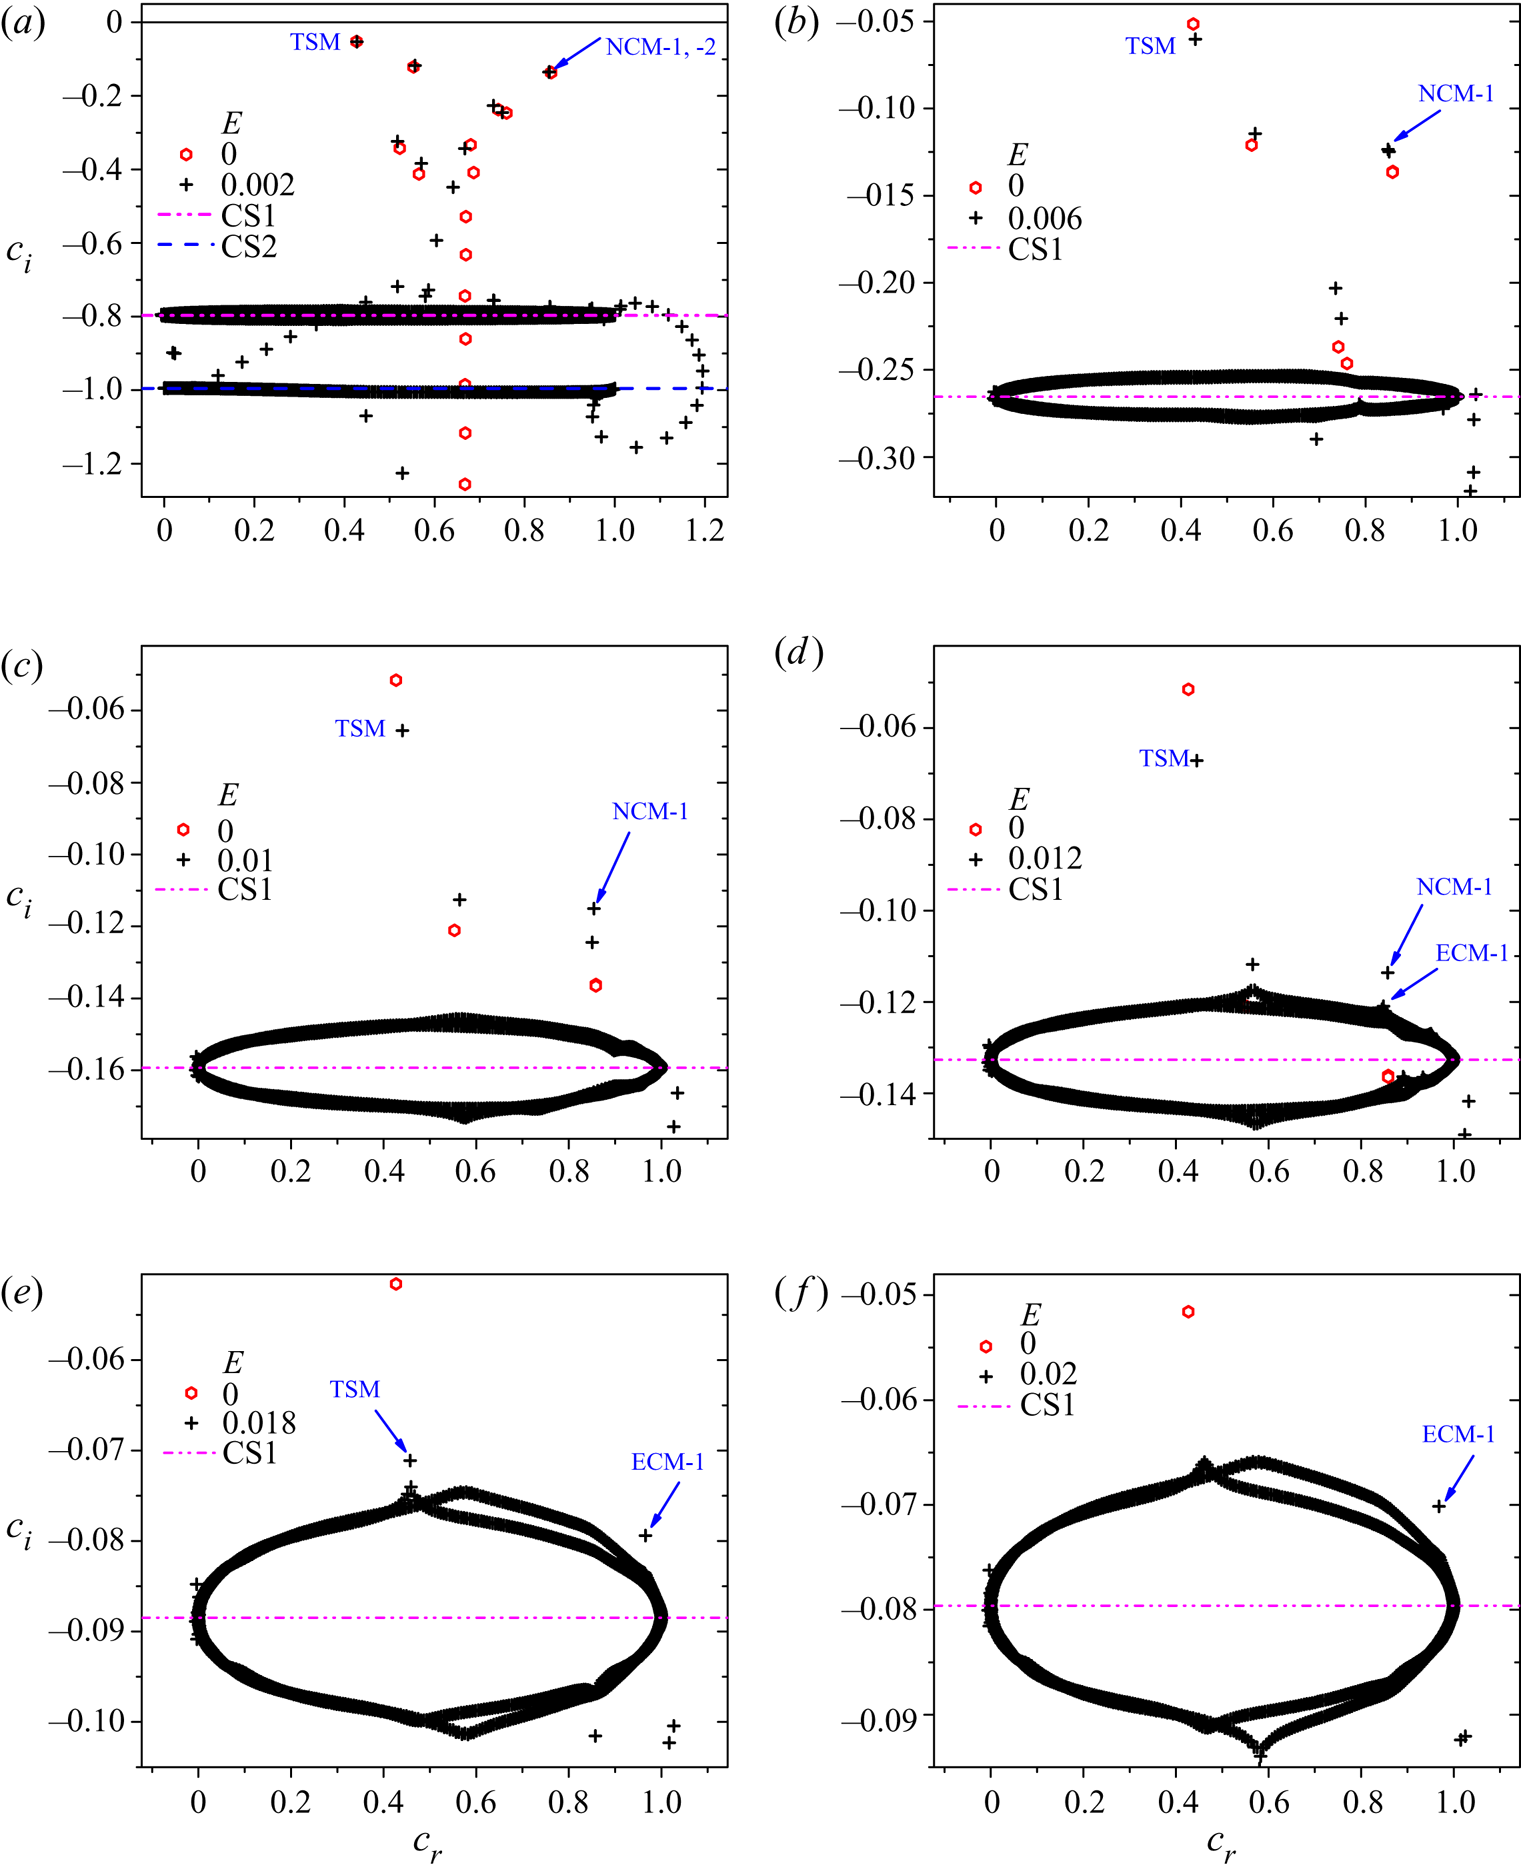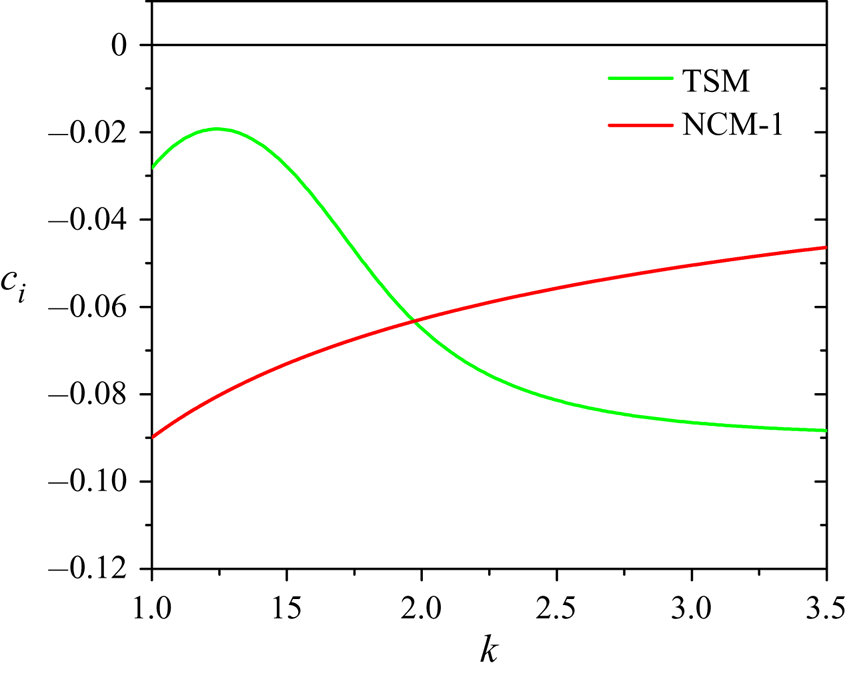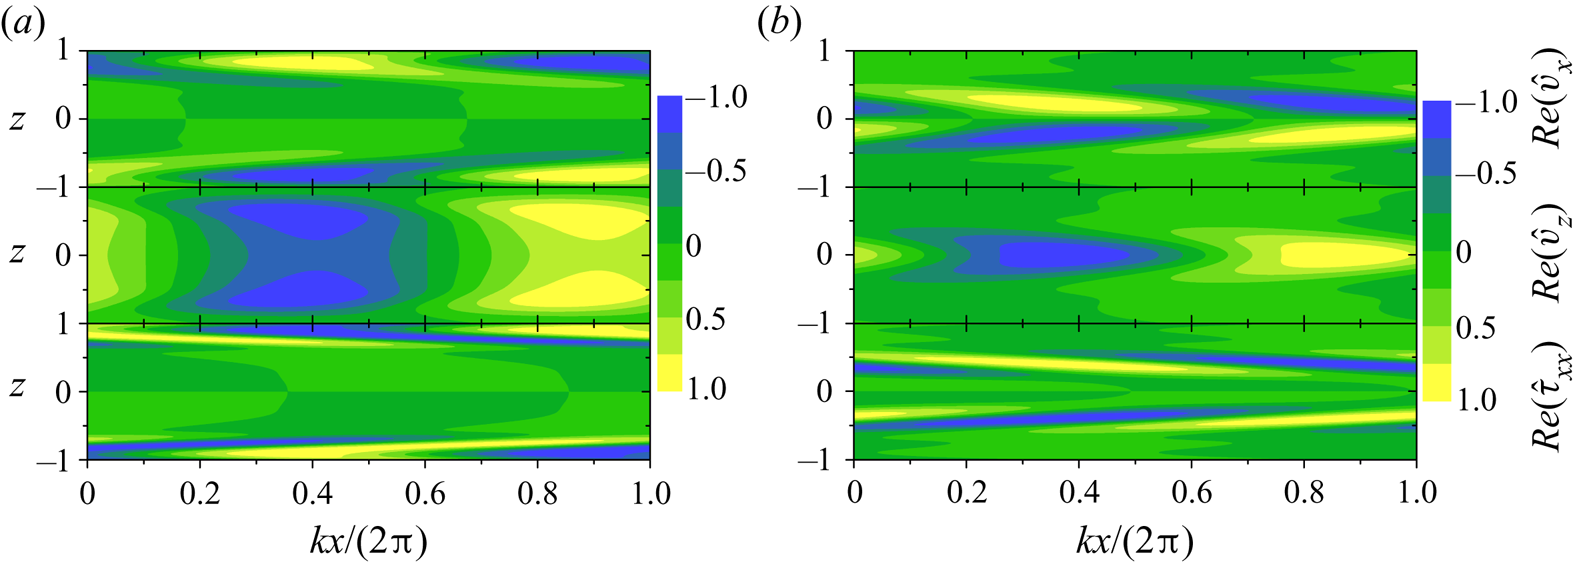



1. Introduction
The onset of turbulence in the flow of Newtonian fluids through pipes and channels is now known to be dominated by nonlinear processes (Eckhardt et al. Reference Eckhardt, Schneider, Hof and Westerweel2007; White & Mungal Reference White and Mungal2008), with the actual transition being preceded by the emergence of three-dimensional solutions of Navier–Stokes equations, dubbed ‘exact coherent states’ (ECS) (Waleffe Reference Waleffe1998, Reference Waleffe2001; Wedin & Kerswell Reference Wedin and Kerswell2004), and with a concomitant reduction in the basin of attraction of the laminar state. Experimentally, transition typically occurs at a Reynolds number  ${\textit {Re}} \approx 2000$ for pipe flows (Avila et al. Reference Avila, Moxey, Lozar, Barkley and Hof2011) and
 ${\textit {Re}} \approx 1100$ for channel flows (Patel & Head Reference Patel and Head1969). In contrast, linear stability theory predicts channel (plane Poiseuille) flow of a Newtonian fluid to become unstable at
 ${\textit {Re}} \approx 5772$ (Schmid & Henningson Reference Schmid and Henningson2001), and pipe flow to be stable at all
 ${\textit {Re}}$ (Meseguer & Trefethen Reference Meseguer and Trefethen2003), implying that the presence or absence of a linear instability has no relevance to the observed subcritical transition. The mechanisms underlying transition in pipe and channel flows of viscoelastic polymer solutions has, however, received much less attention. Although the addition of polymers (
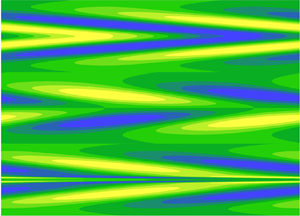
 ${\sim }10$ ppm onward) is well known to result in drag reduction in the fully turbulent regime (Virk Reference Virk1975; Toms Reference Toms1977; White & Mungal Reference White and Mungal2008; Graham Reference Graham2014; Xi Reference Xi2019), the onset of turbulence in polymer solutions has attracted attention only recently. In their experiments on pipe flow of polymer solutions, Samanta et al. (Reference Samanta, Dubief, Holzner, Schäfer, Morozov, Wagner and Hof2013) showed that, for concentrations greater than
 $300$ ppm, transition occurs at an
 $Re$ lower than
 $2000$, and the ensuing flow state was referred to as ‘elasto-inertial turbulence’ (EIT). Recent experiments by Choueiri, Lopez & Hof (Reference Choueiri, Lopez and Hof2018), Chandra, Shankar & Das (Reference Chandra, Shankar and Das2018) and Chandra, Shankar & Das (Reference Chandra, Shankar and Das2020) have corroborated these findings using micro particle image velocimetry (PIV) and pressure-drop measurements. Although most of the experiments on viscoelastic transition have been carried out in the pipe geometry, the study of Srinivas & Kumaran (Reference Srinivas and Kumaran2017) showed, using PIV measurements, that transition in the flow of dilute polymer solutions (with concentrations in the range
 $30$–
 $50$ ppm), through a rectangular channel with a gap width of
 $160\ \mathrm {\mu }$m and a cross-sectional aspect ratio of
 $1:10$, occurred at
 ${\textit {Re}} \sim 300$, again significantly lower than the Newtonian threshold. Importantly, Samanta et al. (Reference Samanta, Dubief, Holzner, Schäfer, Morozov, Wagner and Hof2013) showed that, for concentrations greater than
 $300$ ppm, turbulence onset in pipe flow occurred at the same
 ${\textit {Re}}$ irrespective of whether the flow is perturbed or not, implying that the flow becomes unstable to infinitesimal disturbances. This suggests a common linear mechanism underlying transition in the flow of polymer solutions through both pipes and channels, particularly for sufficiently concentrated polymer solutions for which the transition occurs at
 $Re$ much lower than those corresponding to the Newtonian transition. The proposed linear scenario for viscoelastic pipe and channel flows is thus in direct contrast with the Newtonian transition in these geometries, wherein the common underlying mechanism has a nonlinear subcritical character.
The notion of a linear mechanism underlying the viscoelastic transition was reinforced by our recent discovery (Garg et al. Reference Garg, Chaudhary, Khalid, Shankar and Subramanian2018) of pipe flow of an Oldroyd-B fluid being linearly unstable, in sharp contrast to the Newtonian scenario, with the critical  $Re$ being as low as
 $100$ for strongly elastic dilute solutions; a more detailed account of this instability is provided by Chaudhary et al. (Reference Chaudhary, Garg, Subramanian and Shankar2021). The unstable eigenmode identified belongs to a class of elasto-inertial (axisymmetric) ‘centre modes’ with phase speed approaching the maximum base-flow velocity. In Garg et al. (Reference Garg, Chaudhary, Khalid, Shankar and Subramanian2018), we had alluded to the existence of a similar centre-mode instability in pressure-driven channel flow. In the present study, we show that an analogous instability does indeed exist for channel flow, and for
 ${\textit {Re}}$ much lower than
 $1000$. We provide a comprehensive picture on the origin of the instability and the domain of its existence in the parameter space consisting of
 ${\textit {Re}} = \rho U_{max} H/\eta$, elasticity number
 $E = \lambda \eta /(\rho H^2)$ and the ratio of solvent to solution viscosity
 $\beta = \eta _s/\eta$. Here,
 $\lambda$ is the microstructural relaxation time,
 $U_{max}$ is the maximum base-flow velocity,
 $\rho$ is the fluid density,
 $H$ is the channel half-width and
 $\eta = \eta _p + \eta _s$ is the solution viscosity, which is a sum of the polymer (
 $\eta _p$) and solvent (
 $\eta _s$) contributions. In addition, we discuss the similarities and differences between the centre-mode instabilities of pipe and channel flows, in the aforementioned
 $Re$–
 $E$–
 $\beta$ space, ending with a discussion of the possible transition scenarios for viscoelastic channel flow. We also show that our predictions are in good agreement with the observations of Srinivas & Kumaran (Reference Srinivas and Kumaran2017).
1.1. Stability of rectilinear viscoelastic shearing flows
We first provide a brief overview of relevant previous work on stability of viscoelastic channel flow; a detailed survey of this subject can be found in Chaudhary et al. (Reference Chaudhary, Garg, Shankar and Subramanian2019). Most earlier studies have employed the upper-convected Maxwell (UCM)/Oldroyd-B class of models to analyse the modal stability of both plane Couette and Poiseuille flows. Recall that the dimensionless parameters governing the stability of an Oldroyd-B fluid are  ${\textit {Re}}$,
 $E$ and
 $\beta$, with
 $\beta = 0$ and
 $1$ being the UCM and Newtonian limits, respectively (note that, in lieu of
 $E$, one may also use the Weissenberg number
 $W = E {\textit {Re}}$). To begin with, it is useful to keep in mind the broad features of the Newtonian spectrum for plane Poiseuille flow. At sufficiently high
 ${\textit {Re}}$, the spectrum has a characteristic ‘Y-shaped’ locus with three distinct branches: the ‘A branch’ comprising ‘wall modes’ with phase speeds
 $c_r \rightarrow 0$; the ‘P branch’ comprising ‘centre modes’ with phase speeds
 $c_r \rightarrow 1$; and the ‘S branch’, which forms a vertical line in the
 $c_r$–
 $c_i$ plane comprising modes with a phase speed equalling two-thirds of the maximum base-flow velocity. A wall mode belonging to the A-branch, referred to as the Tollmien–Schlichting (TS) mode, becomes unstable for
 $Re > 5772$ (Schmid & Henningson Reference Schmid and Henningson2001). Although viscoelastic plane Poiseuille flow was found to be stable at low Reynolds number (less than one) by Ho & Denn (Reference Ho and Denn1977) and Lee & Finlayson (Reference Lee and Finlayson1986a), Denn and co-workers (Porteous & Denn Reference Porteous and Denn1972; Ho & Denn Reference Ho and Denn1977) used the UCM model and showed that, for sufficiently high
 $Re$ (
 ${>}2000$) and
 $E$, two new unstable wall modes appear in the eigenspectrum in addition to the elastically modified TS mode and one of these new modes is the most unstable mode at sufficiently high
 $E$. Sureshkumar & Beris (Reference Sureshkumar and Beris1995b) used an Arnoldi algorithm to identify the most unstable eigenmodes in plane Poiseuille flow of a UCM fluid, and showed that the critical
 $Re$ (
 $Re_c$) for the elastically modified TS mode showed a non-monotonic behaviour with increasing
 $E$. Consistent with the findings of Porteous & Denn (Reference Porteous and Denn1972), at sufficiently high
 $E$, Sureshkumar & Beris (Reference Sureshkumar and Beris1995b) identified an unstable mode that is absent in Newtonian channel flow. However, the new unstable mode was found to be suppressed on account of a finite solvent viscosity (using the Oldroyd-B model) or finite extensibility (using the FENE-CR model; see Chilcott & Rallison Reference Chilcott and Rallison1988). Subsequently, Sadanandan & Sureshkumar (Reference Sadanandan and Sureshkumar2002) carried out a modal stability analysis to explore the effect of fluid elasticity on the TS mode at different
 $\beta$ and showed a non-monotonic dependence of
 $Re_c$ on
 $E$, similar to the UCM limit. A similar non-monotonic behaviour was also reported by Zhang et al. (Reference Zhang, Lashgari, Zaki and Brandt2013) using the FENE-P model which, like the FENE-CR model, accounts for the finite extensibility of polymer chains. The recent effort of Brandi, Mendonça & Souza (Reference Brandi, Mendonça and Souza2019) also explored the role of elasticity on the TS (wall) mode using the Oldroyd-B model, focusing on smaller range of
 $E$ (
 $0 < E < 0.003$). Both linear stability analysis (using a shooting procedure) and direct numerical simulations (DNS) were used to analyse the unstable flow structures corresponding to the wall mode, and good agreement was found between the two.
As mentioned previously, viscoelastic plane Poiseuille flow is stable in the limit of low  $Re$, and Kumar and co-workers (Hoda, Jovanovic & Kumar Reference Hoda, Jovanovic and Kumar2008, Reference Hoda, Jovanovic and Kumar2009; Jovanovic & Kumar Reference Jovanovic and Kumar2010, Reference Jovanovic and Kumar2011) have therefore explored the possibility of non-modal (transient) growth in these flows, with the non-modal mechanism being purely elastic, and therefore operative in the inertialess limit. Zhang et al. (Reference Zhang, Lashgari, Zaki and Brandt2013), in contrast, examined non-modal growth in inertially dominated channel flows of both Oldroyd-B and FENE-P fluids, and found that stream-wise elongated structures exhibit the largest transient growth in the subcritical regime. There have also been many studies that used a weakly nonlinear approach (Bertola et al. Reference Bertola, Meulenbroek, Wagner, Storm, Morozov, van Saarloos and Bonn2003; Meulenbroek et al. Reference Meulenbroek, Storm, Morozov and van Saarloos2004; Morozov & van Saarloos Reference Morozov and van Saarloos2005; Pan et al. Reference Pan, Morozov, Wagner and Arratia2013) to identify a subcritical instability in the inertialess limit. These studies were motivated by a hoop-stress-driven mechanism operative at the nonlinear order, which is caused by a curvature of the infinitesimally perturbed streamlines. However, these nonlinear analyses were predicated on the rather simplistic structure of the viscoelastic spectrum in the inertialess limit, and as pointed out by Chaudhary et al. (Reference Chaudhary, Garg, Subramanian and Shankar2021), may not be applicable at higher
 $Re$.
In a recent effort, Chaudhary et al. (Reference Chaudhary, Garg, Shankar and Subramanian2019) employed a numerical shooting procedure along with the spectral method (over a wide range of  ${\textit {Re}}$ and
 $E$) to provide a comprehensive picture of the stability of both plane Couette and Poiseuille flows in the UCM limit. In contrast to the earlier efforts mentioned previously, Chaudhary et al. (Reference Chaudhary, Garg, Shankar and Subramanian2019) also analysed the structure of the elasto-inertial spectrum in detail, in addition to examining the unstable discrete modes found in earlier studies. In doing so, at sufficiently high
 $Re$ and
 $E$, the authors demonstrated the existence of a possibly infinite hierarchy of elasto-inertial instabilities in Poiseuille flow that are absent in the Newtonian limit. Further, both sinuous and varicose modes were shown to be unstable, in contrast to the Newtonian case where only the sinuous mode is unstable. For
 ${\textit {Re}} \gg 1$, the unstable modes found by Chaudhary et al. (Reference Chaudhary, Garg, Shankar and Subramanian2019) belong to the class of wall modes, and the minimum Reynolds number at which the flow is unstable (at any
 $E$) was found to be
 $O(1000)$ in the UCM limit. It has recently been found (Khalid et al. Reference Khalid, Chaudhary, Shankar and Subramanian2020) that the inclusion of a solvent (viscous) contribution, corresponding to a small but finite
 $\beta$, has a strong stabilizing effect on these unstable modes, an effect that may be attributed to the presence of fine-scaled structures in the higher-order elasto-inertial modes. Thus, the wall mode instabilities examined in earlier studies do not pertain to the transition observed in channel flow of dilute polymer solutions with
 $\beta \sim 0.9$ (Srinivas & Kumaran Reference Srinivas and Kumaran2017).
Whereas the aforementioned efforts focused on wall modes, Garg et al. (Reference Garg, Chaudhary, Khalid, Shankar and Subramanian2018) reported a hitherto unexplored linear instability in pipe Poiseuille flow of an Oldroyd-B fluid, which exists only in the presence of solvent viscous effects, and is surprisingly absent in the UCM limit. This implies a destabilizing role of solvent viscosity on the centre mode, in direct contrast to its stabilizing effect on the aforementioned wall-mode instabilities in channel flow. Further, the threshold  $Re$ for transition is significantly lower than the Newtonian threshold even for relatively modest
 $E$; for instance,
 $Re_c \sim 500$ for
 $\beta = 0.8$ and
 $E \sim 0.1$. As was briefly reported in Garg et al. (Reference Garg, Chaudhary, Khalid, Shankar and Subramanian2018), a similar centre-mode instability exists in plane channel flow of an Oldroyd-B fluid. The central objective of the present work is to expand further on the origin and nature of this centre-mode instability in viscoelastic channel flow, and to identify its domain of existence in the
 $Re$–
 $E$–
 $\beta$ space.
1.2. Computational bifurcation studies and DNS
We may classify computational efforts towards understanding viscoelastic transition and drag reduction into two broad categories: (i) bifurcation studies that have explored the role of viscoelasticity on the three-dimensional Newtonian ECS solutions that helped shed light on the Newtonian transition scenario; and (ii) DNS. Both classes of investigations almost exclusively use the FENE-P equation to model the polymer dynamics. In direct contrast to the experimental scenario which, as already seen, is dominated by a focus on pipe flows, almost all of the computational studies (except that of Lopez, Choueiri & Hof (Reference Lopez, Choueiri and Hof2019), as described later) have been carried out for the channel geometry. Implicit in this focus on the channel geometry is the assumption of an identical physical mechanism underlying the transition in both the pipe and channel geometries. This is justified in the Newtonian case owing to the structural similarities of the Newtonian ECS solutions in all of the canonical rectilinear shearing flows including, in particular, the channel (Waleffe Reference Waleffe2001) and pipe (Wedin & Kerswell Reference Wedin and Kerswell2004) geometries; the ECS solutions in all cases are characterized by a staggered arrangement of counter-rotating vortices and stream-wise streaks. Thus, although Newtonian pipe and channel flows yield very different results with regard to linear modal stability (Drazin & Reid Reference Drazin and Reid1981), they nevertheless exhibit similar subcritical transitions to turbulence, with this transition in either case being understood now in terms of a turbulent trajectory wandering chaotically amongst a multitude of the aforementioned ECS solutions in an appropriate phase space. A series of papers by Graham and co-workers (Stone, Waleffe & Graham Reference Stone, Waleffe and Graham2002; Stone & Graham Reference Stone and Graham2003; Stone et al. Reference Stone, Roy, Larson, Waleffe and Graham2004; Li, Xi & Graham Reference Li, Xi and Graham2006; Li & Graham Reference Li and Graham2007) have shown that elasticity has a stabilizing effect on the simplest of the three-dimensional ECS solutions (travelling waves) in viscoelastic plane Couette and Poiseuille flows, in terms of delaying the bifurcation birthing these solutions to a higher  $Re$; the results for sufficiently high
 $E$ are suggestive of the ECS being fully suppressed by elasticity. This, in turn, is suggestive of a delay in transition due to elasticity, a prediction that has some experimental support wherein the onset of turbulence, in pipe flow of polymer solutions, was delayed at lower polymer concentrations (Samanta et al. Reference Samanta, Dubief, Holzner, Schäfer, Morozov, Wagner and Hof2013; Chandra et al. Reference Chandra, Shankar and Das2018; Choueiri et al. Reference Choueiri, Lopez and Hof2018).
Starting from the pioneering work of Sureshkumar, Beris & Handler (Reference Sureshkumar, Beris and Handler1997), there have been many DNS investigations (De Angelis, Casciola & Piva Reference De Angelis, Casciola and Piva2002; Sibilla & Baron Reference Sibilla and Baron2002; Dubief et al. Reference Dubief, White, Terrapon, Shaqfeh, Moin and Lele2004; Xi & Graham Reference Xi and Graham2010, Reference Xi and Graham2012; Xi Reference Xi2019) carried out to study the mechanisms underlying turbulent drag reduction. These efforts were able to successfully capture the moderate drag reduction regime (at  $Re$ below the so-called maximum drag reduction regime), and showed that turbulence production in the buffer layer is modified by the addition of polymers, as originally predicted by Virk (Reference Virk1975). All of these early studies incorporated an additional diffusive term in the constitutive equation in order to preserve the positive definiteness of the polymer conformation tensor. However, the diffusivity
 $D$ used is orders of magnitude larger than the Brownian diffusivity of a polymer molecule. The Schmidt number
 $Sc = \nu /D$ should be
 $O(10^6)$ (where
 $\nu$ is the kinematic viscosity of the fluid) for realistic values of the polymer diffusivity, but the aforementioned simulations used
 $Sc \sim 0.5$. Recently, Dubief and co-workers (Dubief, Terrapon & Soria Reference Dubief, Terrapon and Soria2013; Samanta et al. Reference Samanta, Dubief, Holzner, Schäfer, Morozov, Wagner and Hof2013; Sid, Terrapon & Dubief Reference Sid, Terrapon and Dubief2018) have carried out DNS of viscoelastic channel flow in the absence of stress diffusion to show that the deviation of friction factor from the laminar value occurred at
 $Re \sim 700$ (whereas it does so for
 $Re \sim 5000$ for the Newtonian case in their computations), thereby demonstrating the early onset of EIT, in direct contradiction to the conclusions of Graham and co-workers based on their investigation of the elastically modified ECS. Crucially, the structures that dominated the onset of EIT were two-dimensional (span-wise elongated and stream-wise varying), in direct contrast with the three-dimensional ECS structures (stream-wise elongated and span-wise varying) that dominate the Newtonian (and weakly elastic) transition. The recent work of Sid et al. (Reference Sid, Terrapon and Dubief2018) has shown that the two-dimensional EIT structures are suppressed for
 $Sc < 9$, thus demonstrating the spurious stabilizing role played by the large stress diffusivities used in the earlier DNS studies (It is pertinent here to add a caveat that the aforementioned results of Graham and co-workers on the stabilization of the simplest ECS were also obtained using artificially large stress diffusivities, and it would therefore be prudent to revisit the original conclusions of the authors, at
 $Sc \sim O(1)$, in light of the recent findings for
 $Sc = \infty$). Another recent DNS study (Lopez et al. Reference Lopez, Choueiri and Hof2019), the only one that pertains to the pipe geometry, showed that the onset to EIT is dominated by axisymmetric vortices oriented along the azimuthal direction (the analogue of the span-wise direction in the pipe geometry). The qualitative similarity between the nature of elasto-inertial structures seen in the aforementioned DNS of viscoelastic channel and pipe flows is, in fact, consistent with our earlier report (Garg et al. Reference Garg, Chaudhary, Khalid, Shankar and Subramanian2018) of an analogous linear instability in these flows, thereby suggestive of a generic linear mechanism for turbulence onset in viscoelastic channel and pipe flows. Note, however, that the analogy is qualitative because the pipe centre-mode eigenfunctions, even when confined to the neighbourhood of the centreline, as happens at large
 $Re$ (see Chaudhary et al. Reference Chaudhary, Garg, Subramanian and Shankar2021, and § 4 of this work), do not still lend themselves to a two-dimensional approximation. Thus, as demonstrated in the following, there remain some important differences in the behaviour of the threshold parameters for the pipe and channel flow cases.
As mentioned previously, the ECS-driven three-dimensional transition mechanism is suppressed for quite modest  $E$ and, on the other hand, it is shown in the present work that the centre-mode instability exists only for sufficiently high
 $E$. Thus, for intermediate
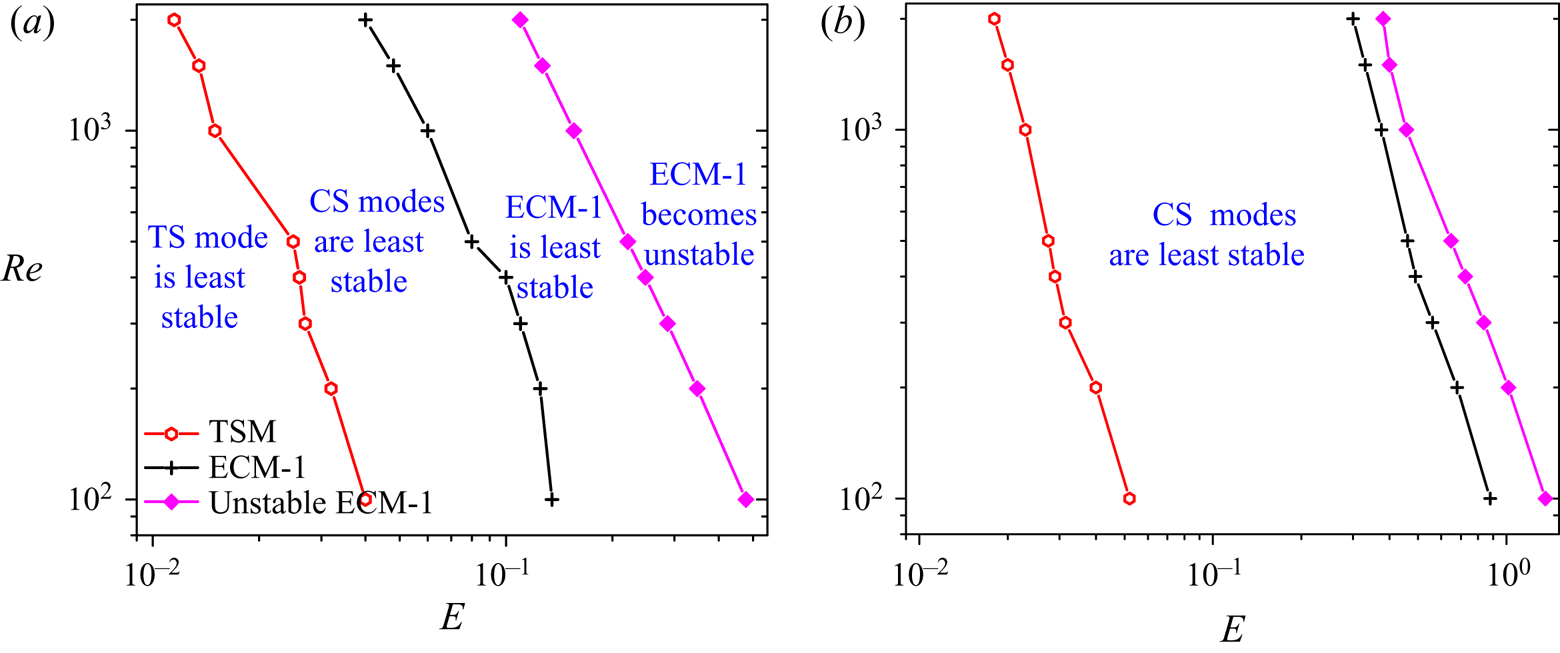
 $E$, there must be new (subcritical) nonlinear mechanisms that underlie the viscoelastic transition. In this regard, two very different mechanisms have been advanced in the recent literature. The first by Shekar et al. (Reference Shekar, McMullen, Wang, McKeon and Graham2019) and Shekar et al. (Reference Shekar, McMullen, McKeon and Graham2020) proposes a two-dimensional nonlinear mechanism that entails strongly localized polymer stretch fluctuations near the ‘critical layer’ (the transverse location where the phase speed of disturbances equals the local laminar velocity) corresponding to the (least-stable) elastically modified, TS (wall) mode. The second by Page, Dubief & Kerswell (Reference Page, Dubief and Kerswell2020) (see also Dubief et al. Reference Dubief, Page, Kerswell, Terrapon and Steinberg2020) is rooted in a novel nonlinear elasto-inertial coherent structure that originates (subcritically) from the critical point corresponding to the centre-mode instability. We demonstrate, in appendix B, that although the centre mode is invariably the least-stable mode for high
 $E$, even in the Newtonian or weakly elastic limit, there exist parameter regimes (based on the perturbation wavenumber and the elasticity number) where the centre mode is less stable than all the wall modes, including the aforementioned TS mode. Thus, the two-dimensional nonlinear mechanism rooted in the TS mode (Shekar et al. Reference Shekar, McMullen, Wang, McKeon and Graham2019) is likely to be valid only in restricted parts of the
 $Re$–
 $E$ parameter space, even for smaller
 $E$ for which the centre mode is linearly stable. Nevertheless, given the relevance of the least-stable eigenmode(s) in the elasto-inertial spectrum to both of the aforementioned nonlinear mechanisms, in § 5, we demarcate regions in the
 $Re$–
 $E$ plane where the centre and wall modes are least stable. In light of the rather high-dimensional parameter space required even for a minimal description of viscoelastic shearing flow, such a demarcation should serve as a useful guide in the search for nonlinear transition mechanisms in the
 $Re$–
 $E$ plane, where the flow is linearly stable.
The rest of this paper is structured as follows. Section 2 provides the linearized governing equations for viscoelastic channel flow, along with a discussion and validation of the numerical methods used in this study. In § 3.1, we discuss the general features of the Oldroyd-B eigenspectrum and contrast it with its Newtonian counterpart. Section 3.2.1 demonstrates the origin of the unstable centre mode with increasing  $E$ at fixed
 $\beta$. Section 3.2.2 examines the deviation from the Newtonian limit at a fixed
 $E$, but with
 $\beta$ decreasing from unity, the focus again being on the emergence of the centre mode below a threshold
 $\beta$. Neutral stability curves in the
 $Re$–
 $k$ plane are presented in § 4. Section 4.1 shows the collapse of the neutral stability curves in the limit
 $E \ll 1$ for a given
 $\beta$, and in the limit
 $E(1-\beta ) \ll 1$ for fixed
 $E$. The variation of the critical parameters (
 $Re_c$,
 $k_c$) with
 $E (1-\beta )$ is discussed in § 4.2, whereas the absence of this instability at lower
 $\beta$ is demonstrated in § 4.3. In § 4.4, the threshold
 $Re$ for the centre-mode instability is shown to remain virtually unaltered for realistic polymer diffusivities, although the artificially large stress diffusivities used in many DNS has a stabilizing effect. Our theoretical predictions are shown to agree well with the observations of Srinivas & Kumaran (Reference Srinivas and Kumaran2017) in § 4.5. In § 5, we discuss the possible transition scenarios in viscoelastic channel flows by showing our results for the onset of transition via linear instability, alongside the results of Li & Graham (Reference Li and Graham2007) for the ECS-mediated nonlinear transition, in the
 $Re$–
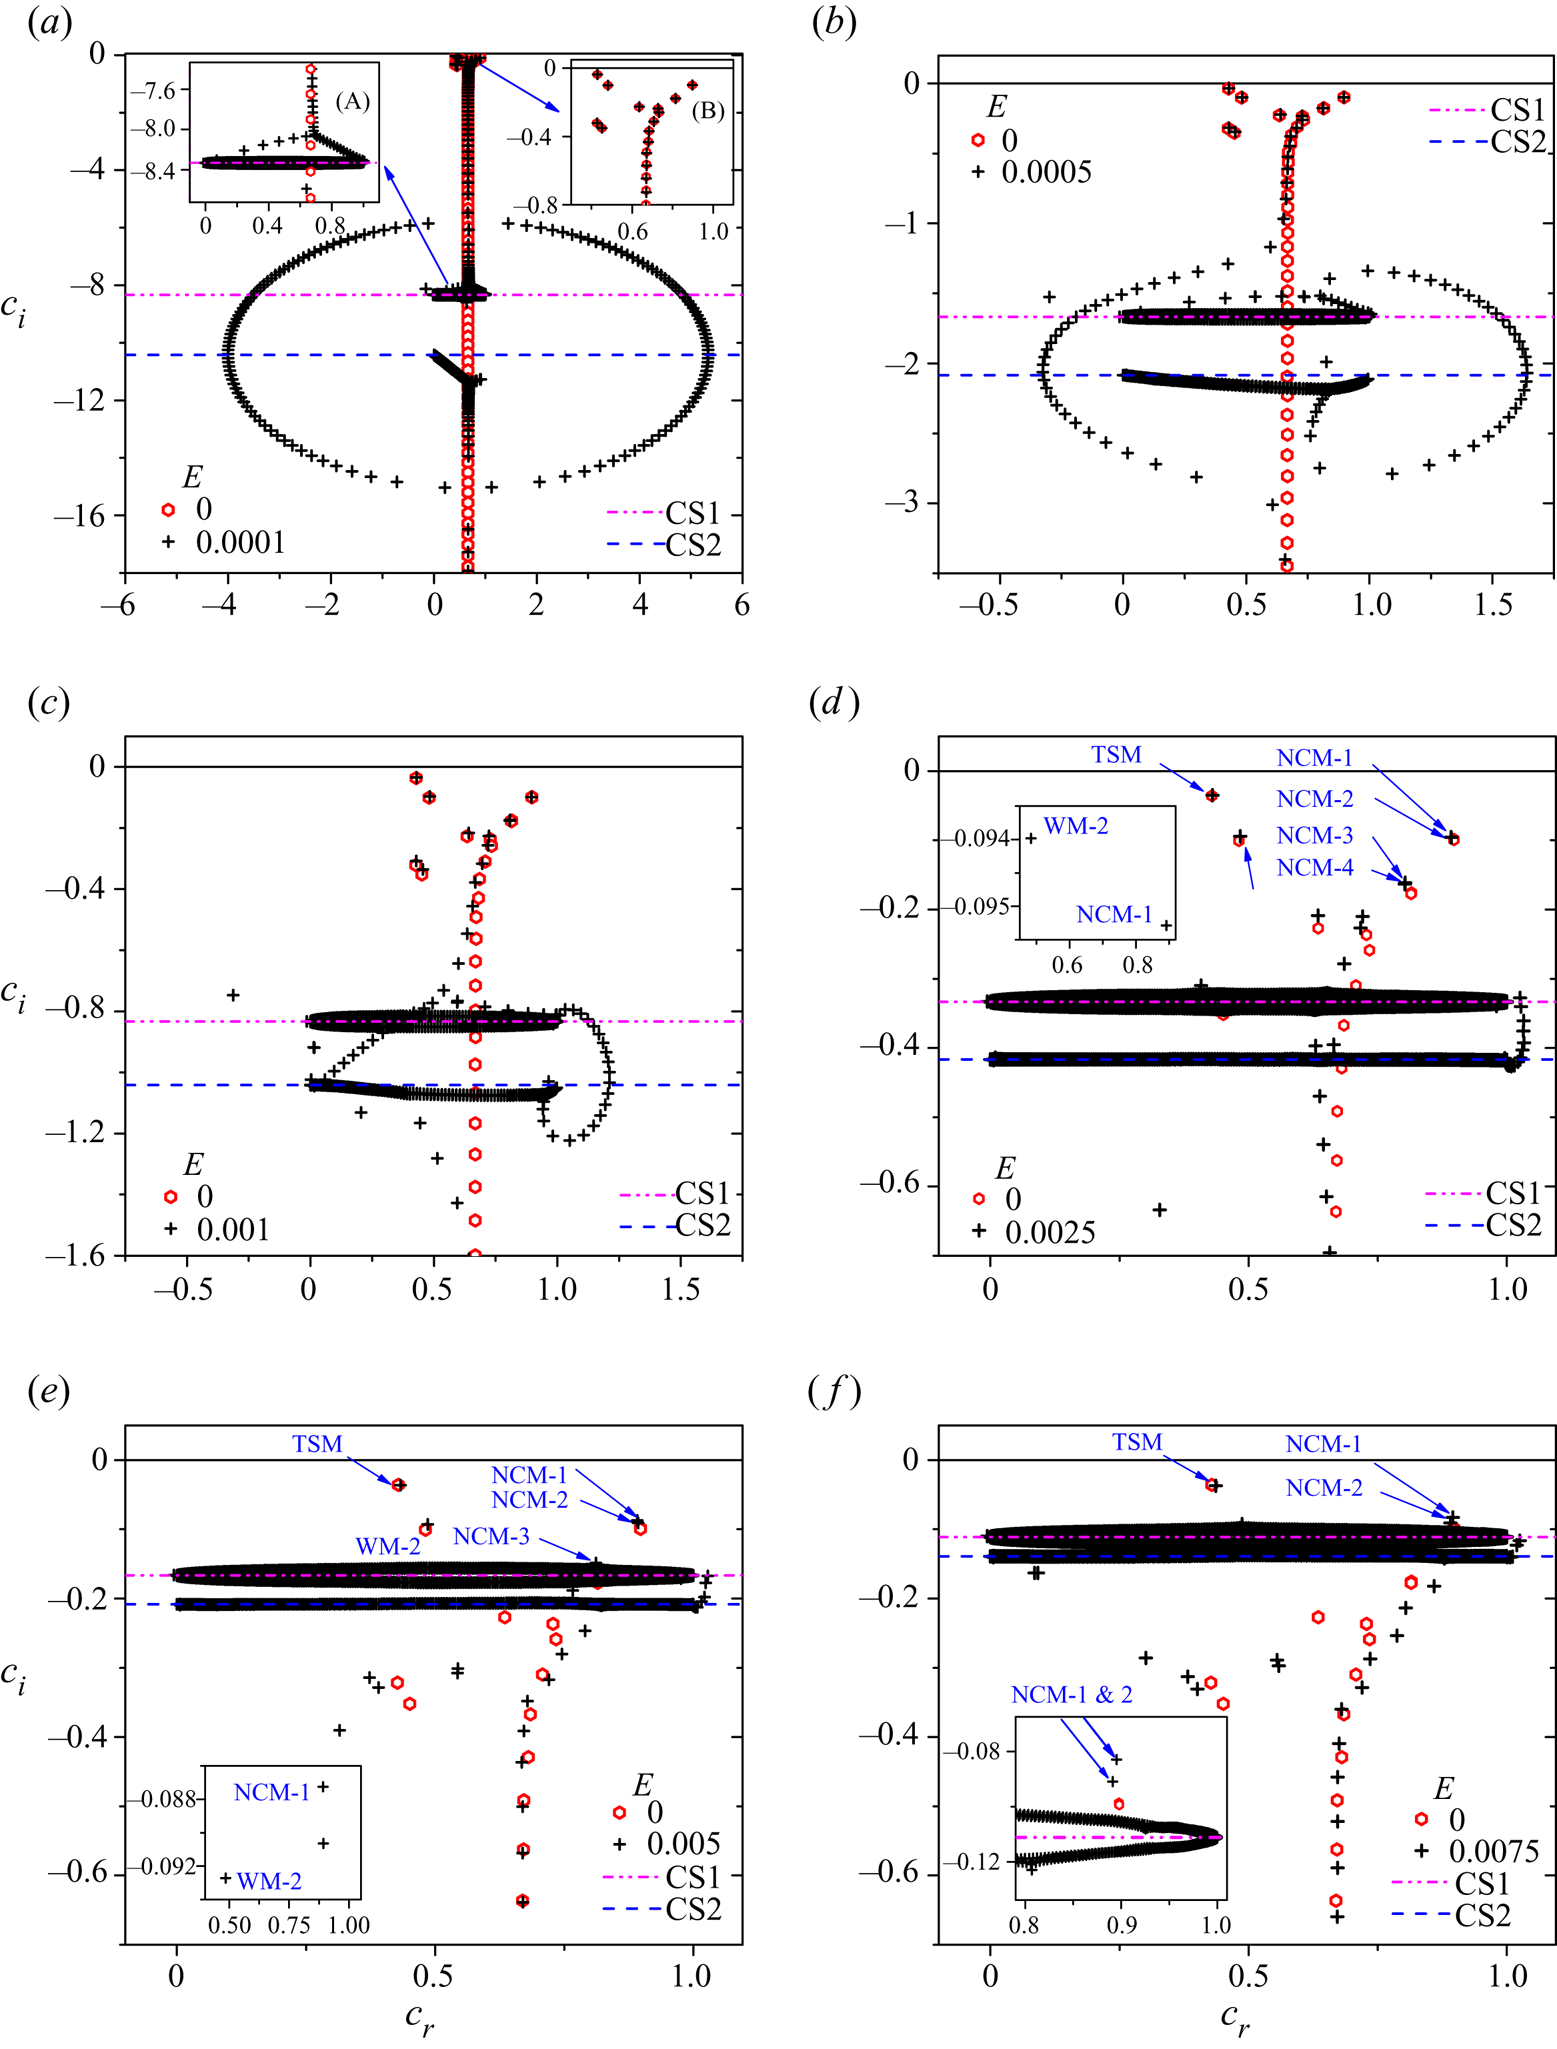
 $E$ plane. The salient conclusions of the present study are provided in § 6. Appendices A.1 and A.2 focus on an overall comparison of the Newtonian and Oldroyd-B spectra. Appendix A.1 shows how the Oldroyd-B spectrum deviates from the Newtonian one as
 $E$ is increased from zero at fixed
 $\beta$, and appendix A.2 examines the evolution of the spectrum as
 $\beta$ is increased from zero at fixed
 $E$. The relative importance of centre modes, wall modes and modes belonging to the continuous spectrum (CS) in viscoelastic channel flow is discussed in appendix B, where it is argued that at sufficiently high
 $E$, it is either the CS or the centre mode which is least stable (or even unstable, in case of the centre mode).
2. Problem formulation
2.1. Governing equations
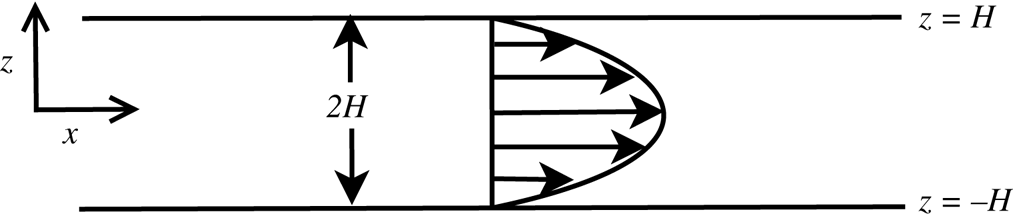
We consider pressure-driven flow of an incompressible viscoelastic fluid in a channel with walls separated by a distance  $2H$ (figure 1). The viscoelastic fluid is modelled using the Oldroyd-B constitutive equation (Larson Reference Larson1988), which is applicable to dilute polymer solutions wherein the polymer chains are assumed to be non-interacting, and each chain is modelled as an elastic dumbbell with beads connected by a linear infinitely extensible entropic spring. This model predicts a shear-rate independent viscosity and first normal stress difference in viscometric shearing flows. Many authors have used this model in the past to analyse instabilities in the flow of dilute polymer solutions in rectilinear (Sureshkumar & Beris Reference Sureshkumar and Beris1995b; Wilson, Renardy & Renardy Reference Wilson, Renardy and Renardy1999; Morozov & Saarloos Reference Morozov and Saarloos2007; Zhang et al. Reference Zhang, Lashgari, Zaki and Brandt2013; Garg et al. Reference Garg, Chaudhary, Khalid, Shankar and Subramanian2018), curvilinear (Shaqfeh Reference Shaqfeh1996) and cross-slot (Poole, Alves & Oliveira Reference Poole, Alves and Oliveira2007) geometries with considerable success. To render the governing equations dimensionless, we use the centreline maximum velocity of the laminar base state
 $U_{max}$ as the velocity scale, channel half-width
 $H$ as the length scale,
 $H/U_{max}$ as the time scale,
 $\eta U_{max}/H$ as the scale for the stresses and pressure and
 $\eta$ is the total solution viscosity. The dimensionless continuity and momentum equations are given by
 \begin{gather} \boldsymbol{\nabla} \boldsymbol{\cdot} \boldsymbol{u}=0, \end{gather}
 \begin{gather}Re \left(\frac{\partial \boldsymbol{u}}{\partial t}+(\boldsymbol{u}\boldsymbol{\cdot}\boldsymbol{\nabla}) \boldsymbol{u} \right)={-}\boldsymbol{\nabla} {p}+ {\beta} \nabla^2 \boldsymbol{u} + \boldsymbol{\nabla}\boldsymbol{\cdot}\boldsymbol{\tau}. \end{gather}
Here,  $Re = \rho U_{max} H/\eta$ is the Reynolds number based on the solution viscosity and
 $\beta = \eta _s/\eta$. The Oldroyd-B constitutive relation for the polymeric stress tensor,
 $\boldsymbol {\tau }$, in dimensionless form is given by
 \begin{equation} \boldsymbol{\tau}+{W} \left(\frac{\partial \boldsymbol{\tau}}{\partial t}+ (\boldsymbol{u}\boldsymbol{\cdot}\boldsymbol{\nabla}) \boldsymbol{\tau}-(\boldsymbol{\nabla}\boldsymbol{u})^\intercal \cdot \boldsymbol{\tau}- \boldsymbol{\tau} \boldsymbol{\cdot}(\boldsymbol{\nabla} \boldsymbol{u})\right)=\left( 1-\beta \right)\left(\boldsymbol{\nabla} \boldsymbol{u}+\boldsymbol{\nabla}\boldsymbol{u}^\intercal \right). \end{equation}
Here,  $W = \lambda U_{max}/H$ is the Weissenberg number and
 $\lambda$ is the microstructural relaxation time. The UCM model, which ignores the solvent contribution to the stress, is obtained from the Oldroyd-B model by setting
 $\beta = 0$, whereas the limit of a Newtonian fluid is obtained by setting
 $\beta = 1$.
Schematic representation of the configuration consisting of pressure-driven flow in a channel of half-width  $H$.

2.2. Base flow
The laminar base state whose stability is of interest here is the steady fully developed pressure-driven channel flow of an Oldroyd-B fluid, with the base-state velocity profile  $U(z) = 1-z^2$ being identical to that of plane Poiseuille flow of a Newtonian fluid. However, unlike its Newtonian counterpart, the Oldroyd-B fluid exhibits a nonzero first normal stress difference (
 $T_{xx} - T_{zz}) = 8 (1-\beta ) W z^2$. Here, and in what follows, the velocity and stress fields corresponding to the base flow are denoted by uppercase letters.
2.3. Linearized governing equations
A temporal linear stability analysis of the aforementioned base flow is carried out by imposing infinitesimal perturbations (denoted by primes) to the base flow:  $\boldsymbol {u}=\boldsymbol {U}+\boldsymbol {u'},\ p=P+p',\ \boldsymbol {\tau }=\boldsymbol {T}+\boldsymbol {\tau '}$. As Squire's theorem is valid for plane Poiseuille flow of an Oldroyd-B fluid (Bistagnino et al. Reference Bistagnino, Boffetta, Celani, Mazzino, Puliafito and Vergassola2007), we restrict our analysis to two-dimensional perturbations, which are considered as elementary Fourier modes of the form
 $f'(x,z,t)=\tilde {f}(z)\exp [\textrm {i}k(x-ct)]$, where
 $f'$ is the relevant disturbance field,
 $\tilde {f}(z)$ is the eigenfunction,
 $k$ is the dimensionless wavenumber and the eigenvalue
 $c =c_r+{\rm i} c_i$ is the complex wavespeed of perturbations. If
 $c_i > 0$, the perturbations grow exponentially with time leading to an instability. Substituting the Fourier mode representation for perturbations in the linearized governing equations yields, with
 $\textrm {d}_z = \textrm {d}/\textrm {d} z$, and primes on the base velocity profile
 $U(z)$ denoting derivatives with respect to
 $z$:
 \begin{gather} \textrm{d}_z \tilde {v}(z)+{\rm i} k\tilde {u}(z)=0,\end{gather}
 \begin{gather} Re [\textrm{i} k (U-c)\tilde{u}(z)+\tilde{v}(z)U']={-}\textrm{i}k\tilde{p}(z)+\beta(\textrm{d}_z^2-k^2)\tilde{u}(z) \nonumber\\ \hspace{9.5pc} +\textrm{i}k\tilde{\tau}_{xx}(z)+\textrm{d}_z\tilde{\tau}_{xz}(z), \end{gather}
 \begin{gather} Re \, \textrm{i} k (U-c)\tilde{v}(z)={-}\textrm{d}_z\tilde{p}(z)+\beta (\textrm{d}_z^2-k^2) \tilde{v}(z) \nonumber\\ \hspace{5.5pc} + \textrm{i}k\tilde{\tau}_{xz}(z)+\textrm{d}_z\tilde{\tau}_{zz}(z), \end{gather}
 \begin{gather} {[}1+ \textrm{i} k W (U-c)]\tilde{\tau}_{xx}(z) = (1-\beta) [2 \textrm{i} k \tilde{u}(z) + 4 {\rm i} k W^2 (U')^2 \tilde{u}(z) +2 W U' \textrm{d}_z\tilde{u}(z) \nonumber\\\hspace{3.5pc} -4W^2 U' U'' \tilde{v}(z)]+2W U' \tilde{\tau}_{xz}(z), \end{gather}
 \begin{gather} {[}1+\textrm{i} k W (U-c)]\tilde{\tau}_{zz}(z) = 2(1-\beta)[ d_z \tilde{v}(z) + \textrm{i} k W U' \tilde{v}(z)], \end{gather}
 \begin{gather} {[}1+\textrm{i} k W (U-c)]\tilde{\tau}_{xz}(z) = (1-\beta)[\textrm{d}_z \tilde {u}(z) + \textrm{i} k \tilde{v}(z) +2 \textrm{i} k W^2 (U')^2\tilde{v}(z) \nonumber\\ \hspace{3.5pc}- W U'' \tilde{v}(z) ]+W U'\tilde{\tau}_{zz}(z). \end{gather}
2.4. Numerical procedure
In order to determine the complex eigenvalue ( $c$), we use a spectral collocation method (Boyd Reference Boyd1999; Weideman & Reddy Reference Weideman and Reddy2000), where the dynamical variables (velocity, pressure and stress perturbations) are expanded as a finite sum of Chebyshev polynomials and substituted in the above linearized differential equations. In our spectral formulation, we discretize all of the six (2.4)–(2.9), and the resulting generalized eigenvalue problem is of the form
 \begin{equation} \boldsymbol{\mathsf{A}}\boldsymbol{x}=c\boldsymbol{\mathsf{B}}\boldsymbol{x},\end{equation}
where  $\boldsymbol{\mathsf{A}}$ and
 $\boldsymbol{\mathsf{B}}$ are coefficient matrices, and
 $\boldsymbol {x} = (\tilde {u},\tilde {v},\tilde {p},\tilde {\tau }_{xx},\tilde {\tau }_{xz},\tilde {\tau }_{zz})^\intercal$ is the vector comprising of the coefficients of the spectral expansion at the collocation points. The size of the
 $\boldsymbol{\mathsf{A}}$ matrix is
 $6N \times 6N$, where
 $N$ is the number of Gauss–Lobatto collocation points. The generalized eigenvalue problem is solved using the ‘polyeig’ eigenvalue solver of Matlab. To filter out the spurious eigenvalues associated with the spectral method, we run our spectral code for two different values of
 $N$, say,
 $400$ and
 $500$, and eliminate those eigenvalues that do not satisfy a prescribed tolerance criterion. In the following discussion, we usually use
 $N$ between
 $400$ and
 $600$ for
 $k,E < 1$. However, for the highest
 $E$, we use
 $N = 900$ to obtain convergence of the unstable mode. In addition, a numerical shooting procedure (Ho & Denn Reference Ho and Denn1977; Lee & Finlayson Reference Lee and Finlayson1986b; Schmid & Henningson Reference Schmid and Henningson2001) is used for further validation by providing the results from the spectral method as initial guesses. The numerical shooting procedure involves an adaptive Runge–Kutta integrator coupled with a Newton–Raphson iterative scheme to solve for the eigenvalues. Only physically genuine modes from the spectral method converge with the shooting code. To benchmark the implementation of our numerical methodology, we compare (table 1) results from our procedure with those of Sureshkumar & Beris (Reference Sureshkumar and Beris1995b) for both UCM and Oldroyd-B fluids. The unstable eigenvalues are in good agreement for
 $N=129$ and
 $N=257$. In addition, we have benchmarked our results with those of Chaudhary et al. (Reference Chaudhary, Garg, Shankar and Subramanian2019) for the UCM case.
Validation of UCM ( $\beta =0$) and Oldroyd-B
 $(\beta =0.5)$ results with those of Sureshkumar & Beris (Reference Sureshkumar and Beris1995b) for viscoelastic channel flow.

3. Emergence of the unstable centre mode in the elasto-inertial eigenspectrum
3.1. The Newtonian and Oldroyd-B spectra
We first discuss the key differences between the Oldroyd-B and Newtonian eigenspectra. Note that the Oldroyd-B eigenspectrum reduces to the Newtonian eigenspectrum when either  $E = 0$ (for any
 $\beta$) or
 $\beta = 1$ (for any
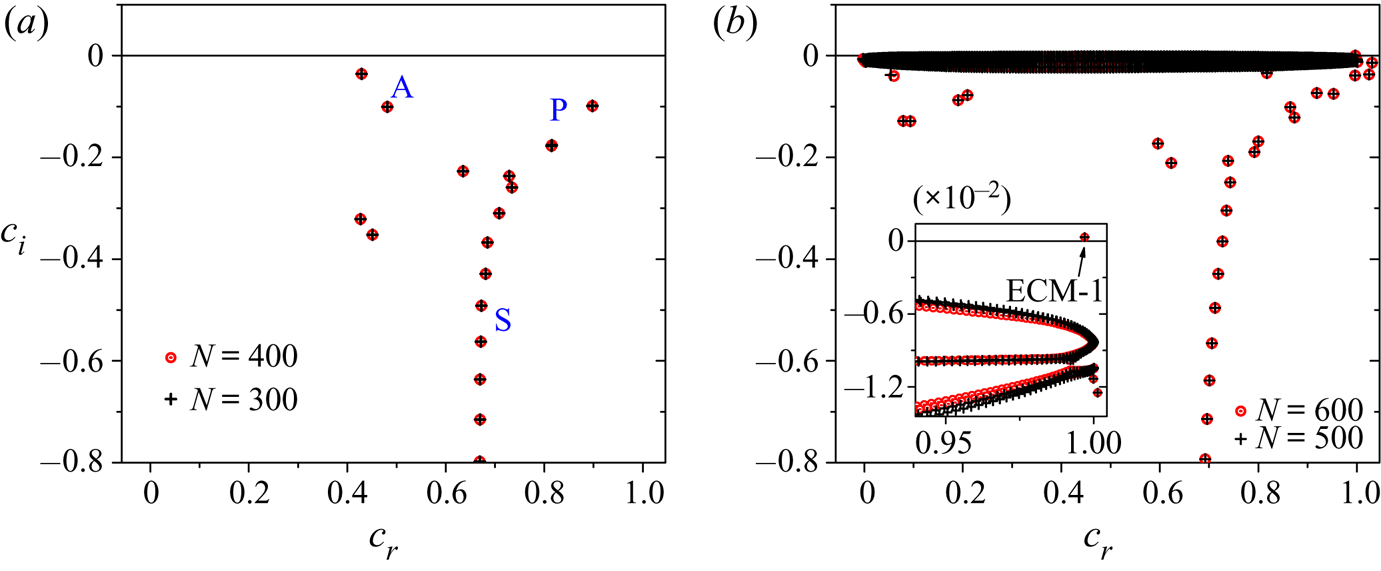
 $E$). As mentioned in § 1, the Newtonian eigenspectrum for plane Poiseuille flow (see figure 2a), at sufficiently high
 $Re$, has a characteristic ‘Y-shaped’ structure. For
 $Re > 5772$, a wall mode belonging to the ‘A’ branch becomes unstable (Schmid & Henningson Reference Schmid and Henningson2001), this being the TS instability. The eigenspectrum at
 $Re = 800$,
 $E = 0.1$,
 $\beta = 0.8$ and
 $k = 1.5$ (figure 2b) shows that in addition to the elastic modification of the discrete modes of the Newtonian spectrum, the spectrum for the Oldroyd-B fluid has a pair of CS ‘balloons’ (Graham Reference Graham1998; Wilson et al. Reference Wilson, Renardy and Renardy1999; Chaudhary et al. Reference Chaudhary, Garg, Shankar and Subramanian2019). The exact locations of the two continuous spectra are obtained in the following manner (Wilson et al. Reference Wilson, Renardy and Renardy1999; Chokshi & Kumaran Reference Chokshi and Kumaran2009). The linearized governing equations and constitutive relations (2.4)–(2.9) can be recast into a single fourth-order differential equation for
 $\tilde {v}_z$, wherein the coefficient of the highest-order derivative vanishes when
 $[1+\textrm {i} k W (U-c)] = 0$ and
 $[1+\textrm {i} \beta k W (U-c)] = 0$. This yields
 $c_i = -1/(kW)$ and
 $c_i = -1/(\beta k W)$, with
 $c_r = U(z)$, for the two CS; the latter condition implies
 $c_r \in [0,1]$. The CS with
 $c_i = -1/(kW)$ is present even in the absence of solvent (i.e. the UCM limit), and henceforth will be referred to as ‘CS1’. The second continuous spectrum (abbreviated as CS2), characterized by modes with
 $c_i = -1/(\beta k W)$, is present only for non-zero
 $\beta$. Theoretically, both the CS are ‘lines’ in the
 $c_r$–
 $c_i$ plane with the aforementioned
 $c_i$. As the eigenfunctions corresponding to the CS eigenvalues are singular, these are resolved only approximately by the finite number of collocation points used in the spectral method. Thus, both the CS appear as balloons whose spread only decreases slowly with increasing
 $N$. In addition to the elastically modified Newtonian discrete modes and the CS balloons, new discrete modes (absent in the Newtonian spectrum) also appear, of which one of the centre modes is unstable at
 $E = 0.1$ (see the inset of figure 2b); all other discrete modes, including the continuation of the TS (wall) mode, remain stable for
 $Re = 800$. An analogous centre-mode instability for viscoelastic pipe flow (over a similar range of parameters) was first reported by Garg et al. (Reference Garg, Chaudhary, Khalid, Shankar and Subramanian2018), and has since been examined in more detail by Chaudhary et al. (Reference Chaudhary, Garg, Subramanian and Shankar2021). The presence of a centre-mode instability in both channel and pipe flows of an Oldroyd-B fluid is in direct contrast to the Newtonian scenario, where pipe flow is stable at any
 $Re$.
Eigenspectra for plane Poiseuille flow of (a) Newtonian ( $E= 0$) and (b) Oldroyd-B (
 $E = 0.1$) fluids at
 $Re = 800,\ k = 1.5$ and
 $\beta = 0.8$. The A, P, and S branches of the Newtonian spectrum are indicated in (a). The inset in (b) zooms over the region near the unstable eigenvalue.

3.2. Evolution of the unstable elasto-inertial centre mode
In this section, we discuss the emergence and trajectory of the elasto-inertial centre mode (henceforth labelled ECM-1) that turns unstable for large enough  $E$, and a few of the least-stable discrete stable modes, by following two different paths in parameter space, both starting from the Newtonian limit: (i) increasing
 $E$ (from zero) at fixed
 $\beta$ and (ii) decreasing
 $\beta$ (from unity) at fixed
 $E$; we also examine the non-trivial effect of changing
 $\beta$ on the spectrum in the complementary UCM limit (
 $\beta \rightarrow 0$).
3.2.1. Effect of varying  $E$ at fixed $\beta$


The focus of the ensuing discussion is on the aforementioned centre mode; a detailed depiction of the overall features of the elasto-inertial spectrum, as a function of both  $E$ and
 $\beta$, is provided in appendix A. In general, when
 $E$ is increased from zero at fixed
 $\beta$,
 $Re$ and
 $k$, the two CS moves up towards the
 $c_i = 0$ line (the
 $c_r$ axis), and the continuation of the centre modes originally present in the Newtonian P-branch (termed the NCM-
 $i$,
 $i$ being the mode number), merge with CS1 (located at
 $c_i = -1/(k E \,Re)$); new discrete modes also emerge from below the CS1 in this process (see appendix A.1). We further demonstrate (see appendix A.2) that the distinct class of discrete modes, comprising the shear waves in the UCM spectrum (
 $\beta = 0$), referred to here as the ‘HFGL’ (high-frequency Gorodtsov–Leonov) class of modes (Gorodtsov & Leonov Reference Gorodtsov and Leonov1967), are strongly stabilized at finite
 $\beta$. Hence, the continuation of the HFGL modes are not relevant in determining the stability of plane-Poiseuille flow in the dilute and semi-dilute regimes of relevance to experimental studies. At higher
 $E$, all the Newtonian centre modes have merged with the CS, and the CS-modes are, therefore, the least stable. Crucially, beyond a threshold
 $E$, a new ‘elasto-inertial’ centre mode emerges above the CS, and this mode becomes eventually unstable at sufficiently high
 $E$ (see figure 21 of appendix A.1).
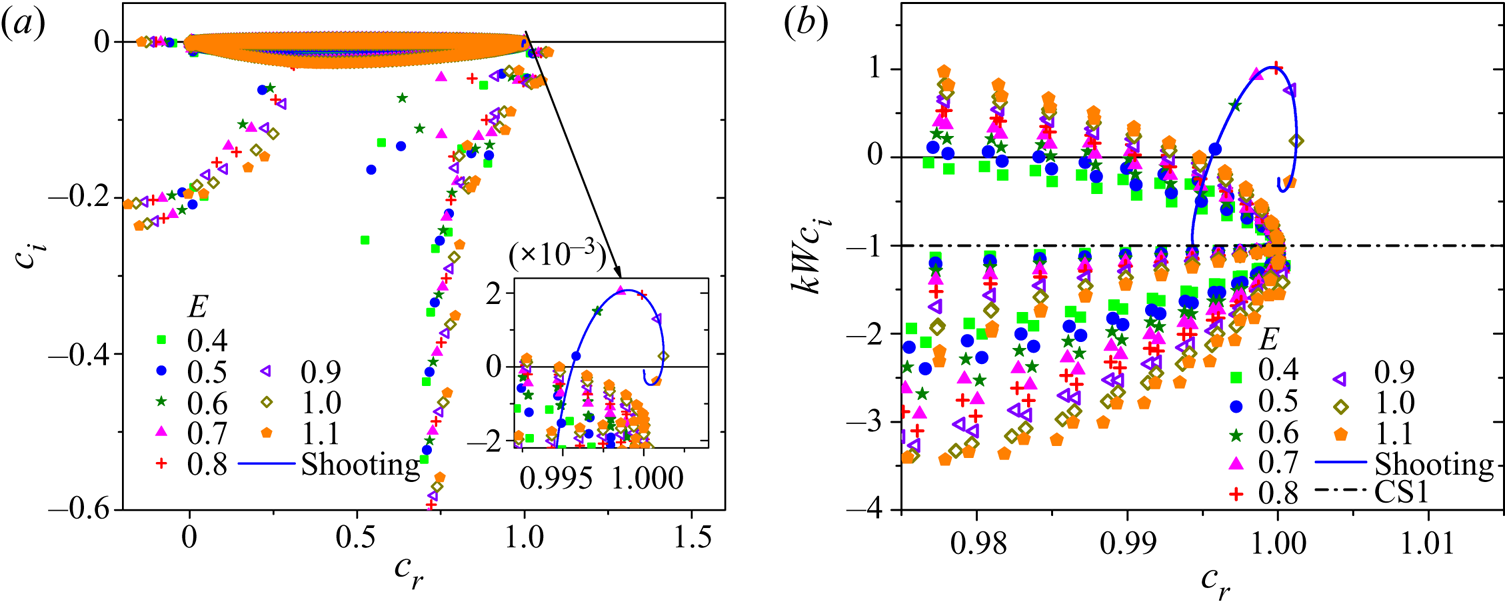
Figures 3(a) and 3(b) present the eigenspectra for different  $E$ varying over the interval
 $(0.4, 1.1)$ for
 $\beta = 0.96$, with figure 3(b) being plotted in terms of the scaled growth rate
 $k W c_i$, which ensures that the locations of the two CS are fixed as
 $E$ is changed (for a given
 $\beta$). Figure 3(a) tracks the paths taken (with increasing
 $E$) by the first few discrete modes, whereas the continuous line in figure 3(b) represents the trajectory of the unstable elasto-inertial centre mode (ECM-1) alone obtained from the shooting method (the superposed symbols correspond to results obtained using the spectral method). The new elasto-inertial centre mode, which emerges above the CS1 at
 $E \approx 0.4$, becomes unstable for
 $0.48 < E < 1.04$, but becomes stable again for
 $E>1.04$, with
 $|c_i|$ eventually scaling as
 $1/E$ for large
 $E$, quite similar to pipe flow (Chaudhary et al. Reference Chaudhary, Garg, Subramanian and Shankar2021). However, unlike pipe flow, the
 $c_r$ for the unstable mode exceed unity over some ranges of
 $E$.
Eigenspectra for  $Re=650,\ k=1,\ \beta =0.96$ at different
 $E$. (a) The full spectrum. (b) Enlarged view of (a) near the unstable eigenvalue expressed using the scaled growth rate
 $kWc_i$. The continuous (blue) line showing the trajectory of ECM-1 is obtained using shooting method, whereas symbols show results from the spectral method.

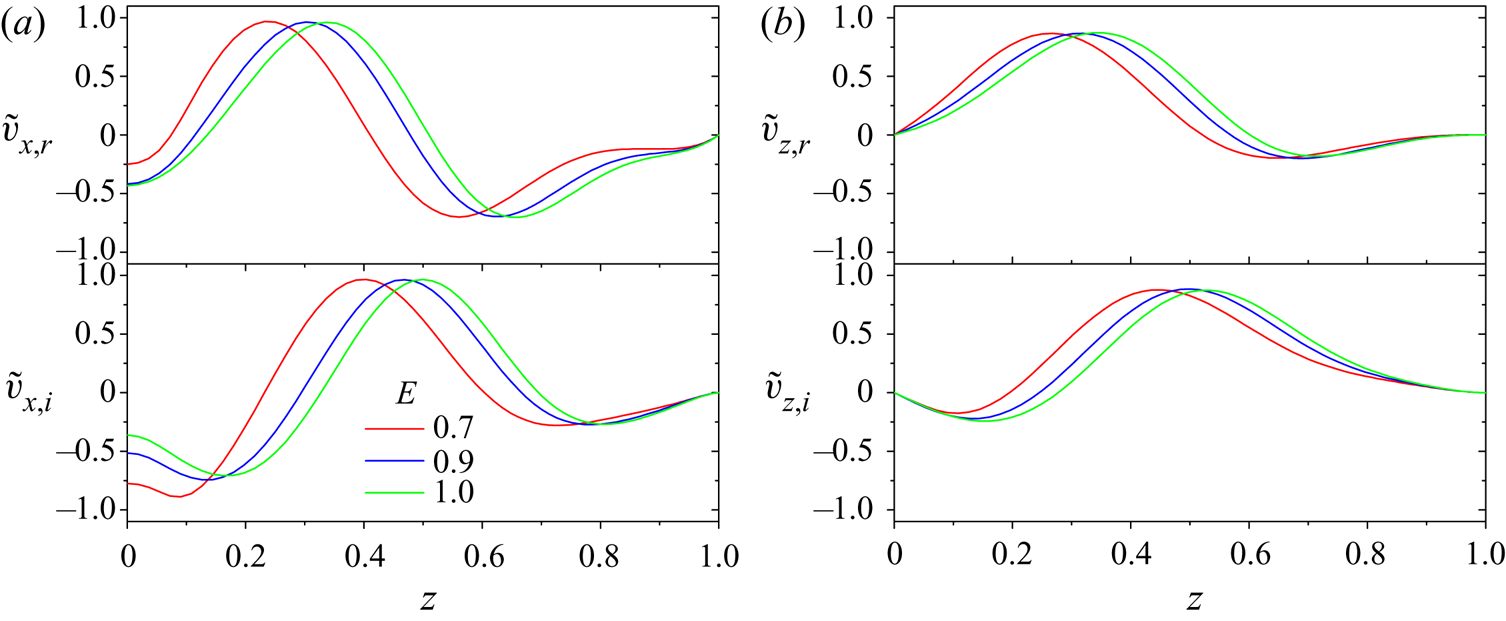
Figure 4 shows the velocity eigenfunctions ( $\tilde {v}_x, \tilde {v}_z$) for different
 $E$, corresponding to some of the unstable centre modes shown in figure 3. The
 $\tilde {v}_x$ eigenfunctions are symmetric about the channel centreline (and are therefore shown only over one half of the channel), in marked contrast with the TS (wall) and NCM-1 modes, which are antisymmetric about the channel centreline; note that NCM-1 refers to the first (least-stable) mode originally on the P-branch of the Newtonian spectrum. The eigenfunctions have their peak amplitudes closer to the channel centreline, but are nevertheless spread across the entire channel for the moderate
 $Re$ considered here, similar to the centre-mode instability in pipe flow (Chaudhary et al. Reference Chaudhary, Garg, Subramanian and Shankar2021). This latter fact, that the unstable eigenfunctions for moderate
 $Re$ and
 $E$ are not localized near the channel centreline despite the phase speed being close to the maximum velocity of the base flow, needs to be emphasized since this contradicts earlier interpretations of our original report on the centre-mode instability (Shekar et al. Reference Shekar, McMullen, Wang, McKeon and Graham2019). The contours corresponding to the velocity (
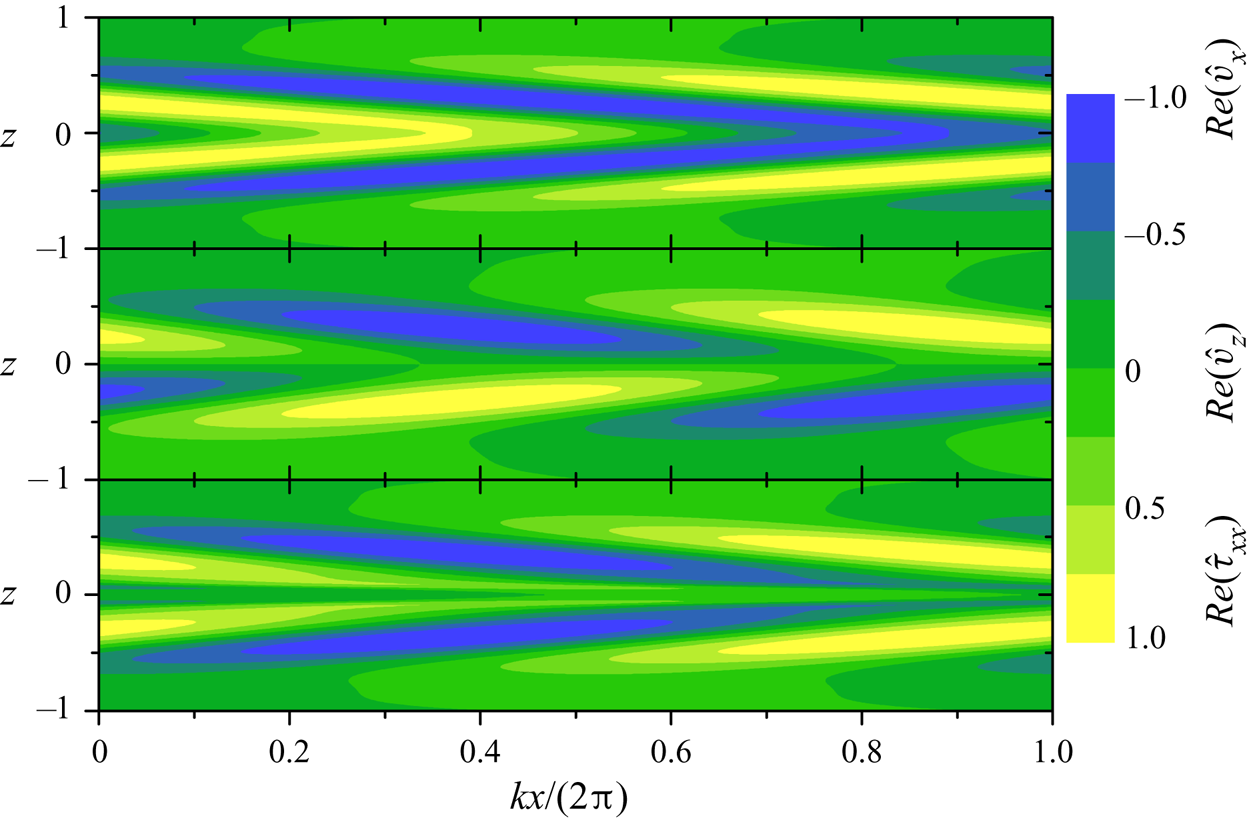
 $\hat {v}_x(x,z), \hat {v}_z(x,z)$) and stream-wise component of the polymeric stress (
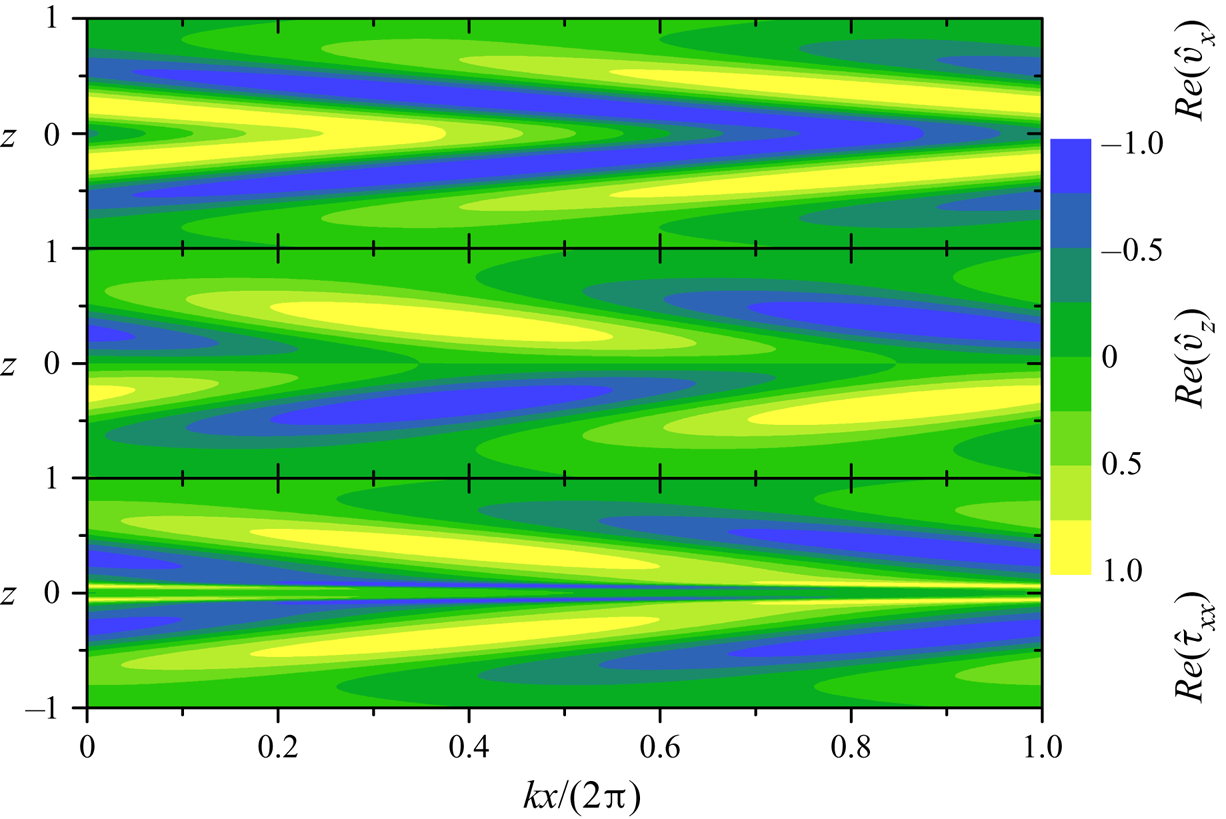
 $\hat {\tau }_{xx}(x,z)$) eigenfunctions of the unstable mode are shown in figure 5, and reinforce the relatively modest confinement (in the neighbourhood of the centreline) at
 $Re = 650$.
Velocity eigenfunctions corresponding to unstable eigenvalues in figure 3 for  $Re = 650$,
 $k = 1$,
 $\beta = 0.96$ and at different
 $E$: (a) axial velocity,
 $\tilde {v}_x$; (b) wall-normal velocity,
 $\tilde {v}_z$. The
 $\tilde {v}_x$ eigenfunctions are symmetric about the channel centre, and are shown over the half-domain
 $0 \leq z \leq 1$. The eigenvalues for which the eigenfunctions are shown here are
 $E = 0.7$,
 $c = 0.99856712 + 0.00204187\textrm {i}$;
 $E =0.9$,
 $c = 1.00087623 + 0.00130115\textrm {i}$;
 $E =1.0$,
 $c = 1.00121782 + 2.88573410 \times 10^{-4}\textrm {i}$.

Contours of  $v_x, v_z$ and
 $T_{xx}$ for unstable (symmetric) centre mode in the
 $x$–
 $z$ plane for
 $Re =650$,
 $\beta = 0.96$,
 $k=1$ and
 $E=0.7$. The unstable eigenvalue is
 $c = 0.99856712 + 0.00204187\textrm {i}$.

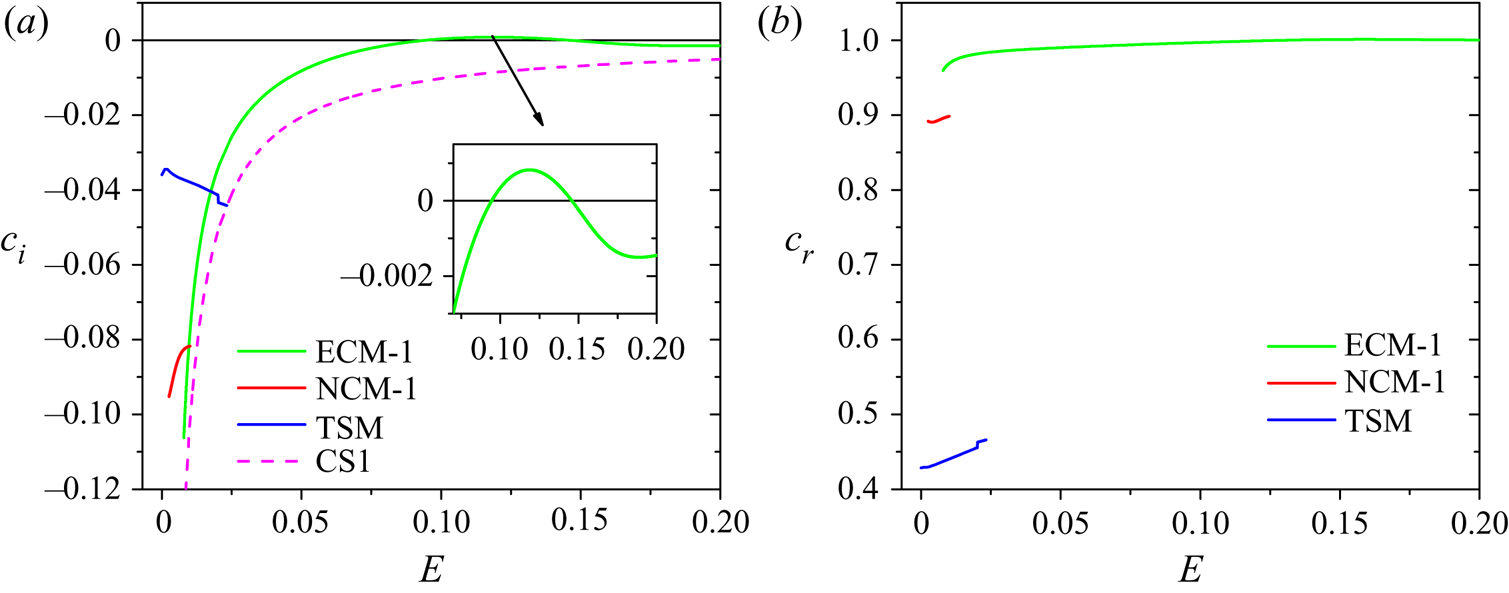
Figure 6(a) shows the variation of  $c_i$ for the TS mode (TSM), NCM-1 and ECM-1 modes with
 $E$. In the near-Newtonian limit (
 $E \rightarrow 0$), TSM is the least-stable mode followed by NCM-1, whereas ECM-1 just emerges from the CS1 for
 $E \approx 0.01$. For
 $E \sim 0.01$, the decay rates of TSM and ECM-1 cross each other, and for all higher values of
 $E$, ECM-1 is the least-stable/unstable mode. For
 $E > 0.02$, both TSM and NCM-1 collapse into CS1 (figure 6a); we discuss this feature in more detail in appendix B where we compare the relative stability of these two modes for different values of
 $Re$,
 $k$ and
 $\beta$. Thus, the mode ECM-1 is the least-stable discrete mode for
 $E > 0.01$, and, in fact, is the only discrete mode that lies above the CS for
 $E > 0.02$; for
 $E > 0.1$, ECM-1 becomes unstable (inset of figure 6a). The corresponding behaviour of the phase speeds of the three modes is shown in figure 6(b), where the phase speeds for TSM and NCM-1 increase with
 $E$, before eventually merging into CS1, whereas the phase speed of ECM-1 remains almost constant (close to unity) over the range of
 $E$ spanned.
Relative stability of the first three least stable eigenmodes, namely TS mode (TSM), elastically modified Newtonian centre mode (NCM-1) and the new elasto-inertial centre mode (ECM-1) at  $Re = 800,\ k = 1.5$ and
 $\beta =0.8$. (a) Variation of
 $c_i$ with
 $E$ (inset shows the range of
 $E$ for which ECM-1 is unstable). (b) Phase speed
 $(c_r)$ corresponding to the modes shown in (a). In the Newtonian limit
 $(E\rightarrow 0)$, TSM is the least stable mode that governs the stability of the flow, whereas ECM-1 emerges from CS1 at
 $E \sim 0.01$. However, as
 $E$ increases, both TSM and NCM-1 disappear into CS1 leaving behind ECM-1 as the least-stable mode for
 $E > 0.02$, which eventually becomes unstable at
 $E \approx 0.1$.

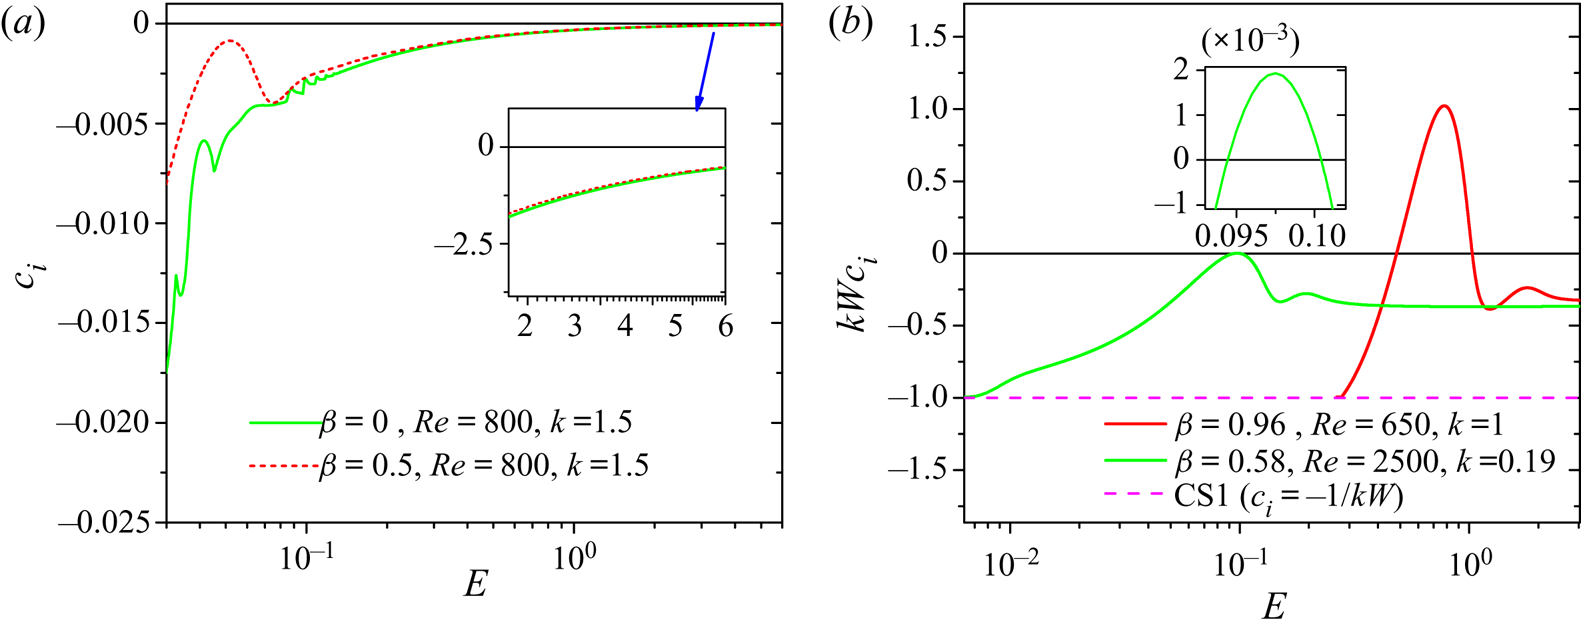
Unlike elasto-inertial wall modes (Chaudhary et al. Reference Chaudhary, Garg, Shankar and Subramanian2019), the elasto-inertial centre mode remains stable in the UCM limit ( $\beta = 0$) for channel flow, and remains so for
 $\beta$ below a finite threshold. Figure 7(a) explores the effect of varying
 $E$ on ECM-1 for
 $\beta = 0$ and
 $0.5$. In the UCM limit
 $(\beta = 0)$, as
 $E$ is increased from the Newtonian limit (
 $E \rightarrow 0$),
 $|c_i|$ eventually decreases to very small values (figure 7a). However,
 $c_i$ remains negative even for very large
 $E$ and, therefore, no centre-mode instability is found in the UCM limit for channel flow. An analogous behaviour is found for
 $\beta = 0.5$. At higher
 $\beta$, ECM-1 does become unstable as explained in the following paragraph.
Effect of increasing  $E$ on the elasto-inertial centre mode (ECM-1) for UCM and Oldroyd-B fluids. (a) Variation of
 $c_i$ for
 $Re = 800,\ k = 1.5$ and
 $\beta = 0$ and
 $0.5$. The centre mode remains stable for
 $\beta <0.5$ even at very large values of
 $E$, in stark contrast to pipe flow which remains unstable at much lower
 $\beta$. (b) Scaled growth rate of ECM-1 for
 $Re = 2500,\ k = 0.19,\ \beta = 0.58$ and
 $Re = 650,\ k = 1,\ \beta = 0.96$. Regardless of the value of
 $\beta$, ECM-1 in channel always emerges from CS1 (
 $c_i =-1/(kW)$) in the limit
 $E \rightarrow 0$.

While discussing the evolution of the elasto-inertial centre mode (ECM-1) in pipe flow at fixed  $\beta$, and for different
 $E$, Chaudhary et al. (Reference Chaudhary, Garg, Subramanian and Shankar2021) identified two qualitatively different trajectories of ECM-1 depending upon
 $\beta$: For
 $\beta \geq 0.85$, ECM-1 collapses into CS1 in the limit
 $E\rightarrow 0$, and does not seem to have any connection with the Newtonian spectrum (and with the least-stable Newtonian centre mode NCM-1, in particular). However, for
 $\beta <0.85$, the unstable centre mode smoothly continues to the least-stable centre mode of the Newtonian eigenspectrum (labelled NCM-1 in this study). For channel flow, in marked contrast, the unstable elasto-inertial centre mode never smoothly continues to its Newtonian counterpart with decreasing
 $E$, within the parameter regimes explored. This is because ECM-1 and NCM-1 are modes with opposite symmetry (as will be seen later in figure 27 of appendix B), the tangential velocity eigenfunction for NCM-1 is antisymmetric about the channel centreline, while it is symmetric for ECM-1 as already seen in figure 4, with the former emerging out of CS1 at a (non-zero) threshold
 $E$, and the latter collapsing into CS1 at a smaller
 $E$, for any fixed
 $\beta$. For the pipe-flow case, the smooth connection made possible by the axisymmetry of both modes. Figure 7(b) reinforces this trend by showing the scaled growth rate of the least-stable elasto-inertial centre mode for two different
 $\beta$, both greater than
 $0.5$ (namely, 0.58 and 0.96). The range of
 $E$ for which elasto-inertial centre mode remains unstable increases with
 $\beta$. For both
 $\beta$, ECM-1 follows a trajectory similar to the one shown in figures 3 and 6(a). Thus, the elasto-inertial centre mode, whether unstable or otherwise, is not the continuation/elastic modification of least-stable Newtonian centre mode (NCM-1) for any
 $\beta$ (regardless of
 $Re$ or
 $E$).
3.2.2. Effect of varying $\beta$ at fixed $E$


We considered the effect of varying  $\beta$ on the elasto-inertial spectrum both from the Newtonian (
 $\beta = 1$) and UCM (
 $\beta = 0$) limits. The following discussion focuses on the former limit; in appendix A.2, we examine the latter limit and show the qualitative changes in the elasto-inertial spectrum as
 $\beta$ is increased from zero.
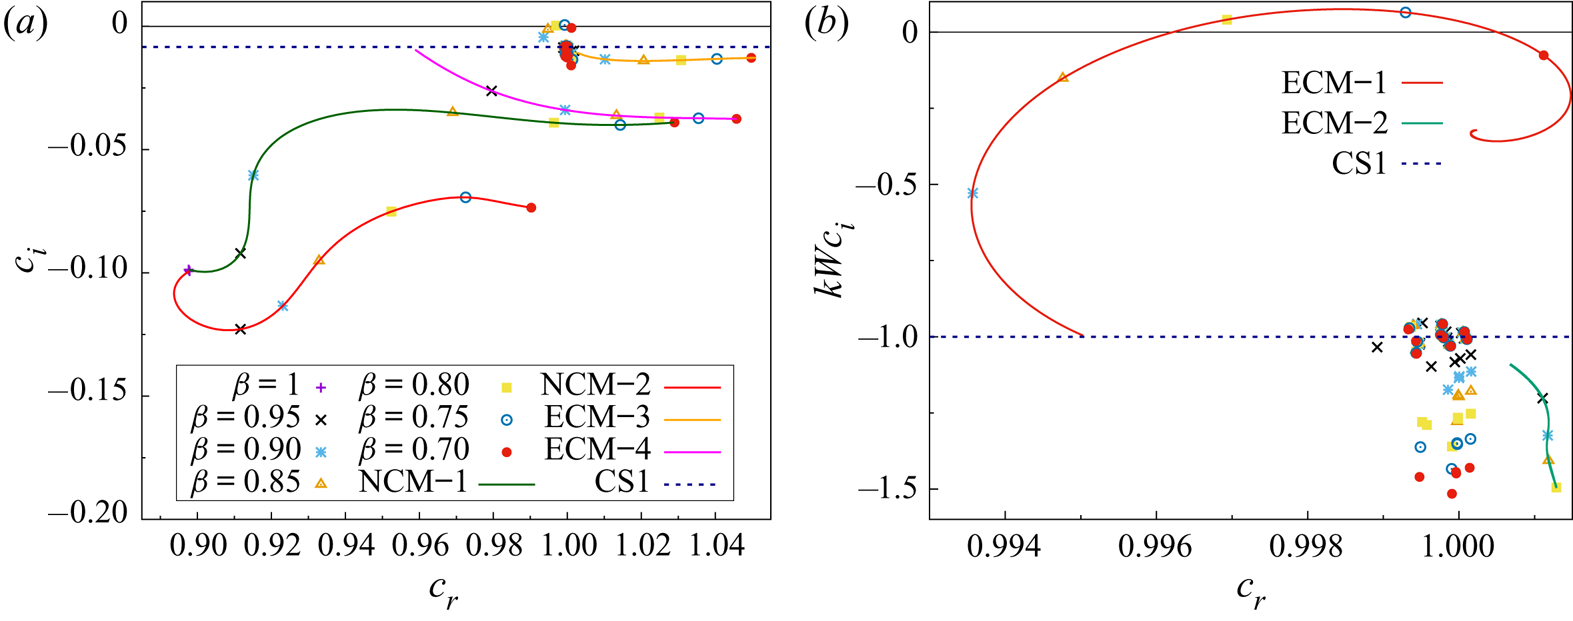
In figure 8(a), we discuss the role of gradually decreasing  $\beta$ from unity at a fixed
 $E$ on the first few discrete modes. This figure shows the trajectories of the two leading Newtonian centre modes (labelled NCM-1 and NCM-2); although these appear to emanate from the same point for
 $\beta = 1$, a closer examination reveals two distinct, but closely-spaced modes in the Newtonian spectrum. In addition to these Newtonian centre modes (NCM-1 and NCM-2), four new modes emerge from CS1. These modes (labelled ECM-1 to ECM-4 in figures 8(a) and 8b) arise because of the combined effect of polymer elasticity and solvent viscosity at non-zero
 $Re$, and hence do not have counterparts in the Newtonian spectrum. The unstable centre mode belongs to this class (ECM-1 in figure 8b). Except for ECM-1, however, all the other elasto-inertial centre modes remain stable over the entire range of
 $\beta$, from the Newtonian (
 $\beta = 1$) to the UCM (
 $\beta = 0$) limit, regardless of
 $Re$ and
 $E$. Figure 8(b) depicts the trajectory of ECM-1 with decreasing
 $\beta$, starting from its emergence out of CS1 at
 $\beta \approx 0.95$, using the scaled growth rate
 $W kc_i$ (the continuous red line represents results from the shooting method). Similar to the trend exhibited by ECM-1 for varying
 $E$ (at fixed
 $\beta$; see § 3.2.1), wherein the instability existed only over a finite range of
 $E$, the mode is unstable only over a range of
 $\beta$ at fixed
 $E$ in figure 8(b), and becomes stable again below a critical
 $\beta$. Thus, the trajectory of the unstable centre mode with varying
 $\beta$, at a fixed
 $E$, is similar in both pipe (see figure 12 of Chaudhary et al. Reference Chaudhary, Garg, Subramanian and Shankar2021) and channel (figure 8 of the present work) flows. However, in contrast to the pipe case, the unstable centre mode in channel flow persists even for
 $Re \sim O(1)$ in the limit
 $\beta \rightarrow 1$, albeit at high
 $E$. We discuss this in detail in § 4.2.
Modification of Newtonian centre modes (NCM-1,-2) in the viscoelastic spectrum and the emergence of new elasto-inertial centre modes (ECM-1,-2,-3,-4) as  $\beta$ is decreased from unity at
 $Re=800,\ k=1.5,\ E=0.1$: (a) NCM-1 and -2 and ECM-3, ECM-4; (b) ECM-1 and ECM-2. All the new elasto-inertial centre modes emerge from CS1 as
 $\beta$ is reduced from unity. In (a), the modes NCM-1 and 2 are distinct, but closely placed, in the Newtonian limit. The continuous lines represent results from the shooting method while symbols denote results from the spectral method. For clarity, only the filtered eigenspectrum is shown (with the CS balloons being absent). The theoretical location of CS1 is shown using dotted lines.

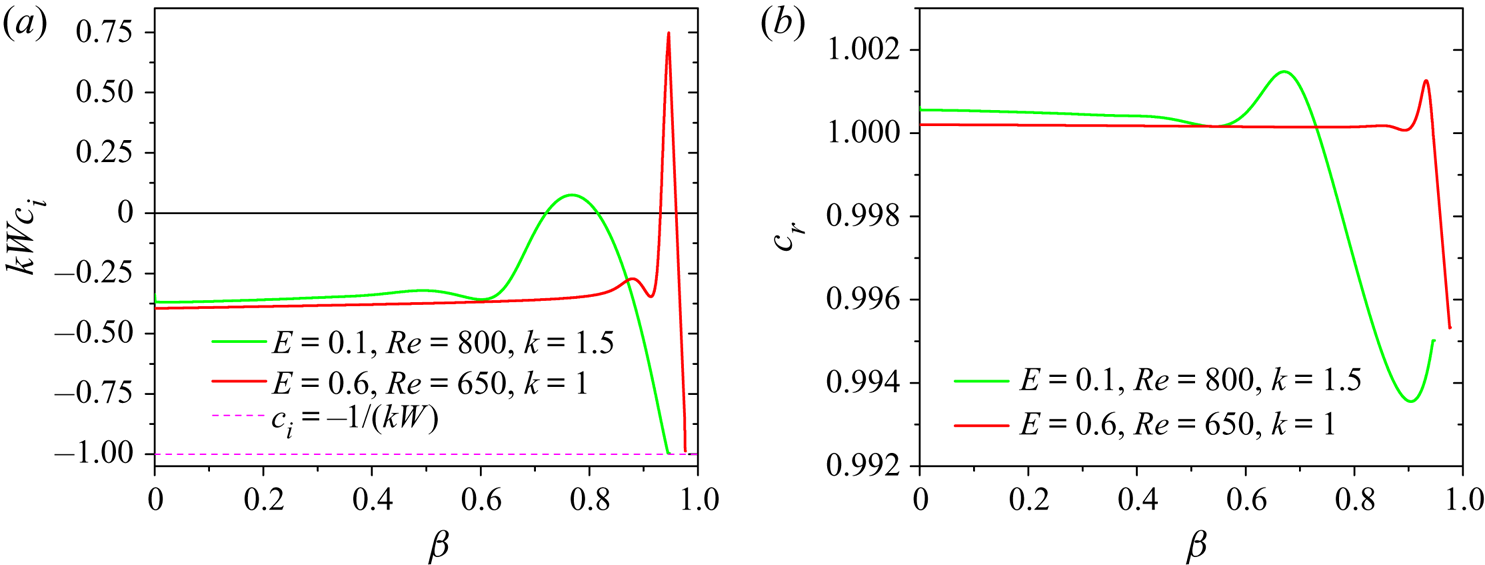
In figure 9(a), we exclusively focus on the centre mode ECM-1 to illustrate the importance of the solvent viscous contribution in rendering this mode unstable, by showing the variation of the scaled growth rate with  $\beta$; figure 9(b) shows the variation of the corresponding phase speeds. At a fixed
 $Re, E$ and
 $k$, ECM-1 emerges from CS1 (
 $c_i=-1/kW$) as
 $\beta$ is decreased from the Newtonian limit (
 $\beta \rightarrow 1$). At a critical
 $\beta$ (close to unity for higher
 $E$) the elasto-inertial mode becomes unstable, and the range of
 $\beta$ in which ECM-1 is unstable increases with decrease in
 $E$. However, the mode becomes stable again as
 $\beta$ is decreased below a threshold. Crucially, for
 $\beta < 0.5$, we find that the centre mode always remains stable in channel flow, for any
 $E$ and
 $Re$. The absence of an instability for
 $\beta < 0.5$ reinforces our predictions from the spectral analysis (in the previous section) that for the centre-mode instability, solvent viscosity is essential along with inertia and elasticity, again in agreement with the pipe flow results of Garg et al. (Reference Garg, Chaudhary, Khalid, Shankar and Subramanian2018) and Chaudhary et al. (Reference Chaudhary, Garg, Subramanian and Shankar2021). However, for pipe flow, the centre mode becomes unstable even as
 $\beta \approx 10^{-3}$, for sufficiently high
 $Re$. Intriguingly, this feature is not present in viscoelastic channel flows.
Effect of variation in  $\beta$ on the scaled growth rate (
 $k W c_i$) of unstable elasto-inertial centre mode (ECM-1) for
 $Re=800,\ k=1.5$. (a) In the UCM limit (
 $\beta \rightarrow 0$), the centre mode remains stable even at very large values of
 $E$, illustrating the role of solvent viscosity in the centre-mode instability in channel flow. For a fixed
 $E = 0.1$, as
 $\beta$ is decreased from unity, ECM-1 emerges from CS1 and becomes unstable over a small range of
 $\beta$ (
 $0.8$–
 $0.7$). The unstable range of
 $\beta$ shifts towards
 $\beta \rightarrow 1$ for
 $E = 0.6$. (b) The corresponding variation of
 $c_r$ with
 $\beta$.

4. Neutral stability curves
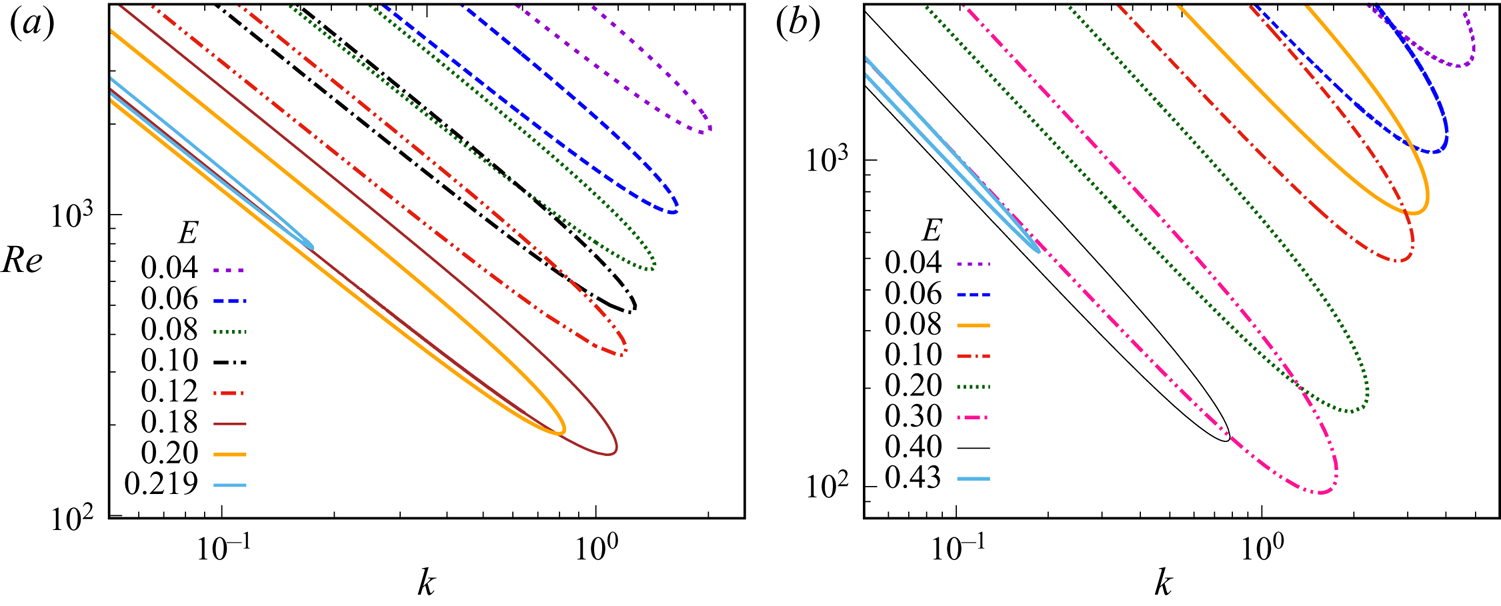
In figure 10, we present neutral stability curves (at fixed  $\beta$, and with varying
 $E$) for the channel-flow centre mode, which are in the form of loops in the
 $Re$–
 $k$ plane, with the region inside each neutral loop being unstable. For
 $k \ll 1$, we find
 $Re \sim k^{-1}$ along both the upper and lower branches of the loops for
 $\beta = 0.65$ and
 $0.8$ in figure 10, and for other
 $\beta$ (not shown). In contrast, for pipe flow, this scaling is valid along the lower branch (regardless of
 $\beta$; see Garg et al. Reference Garg, Chaudhary, Khalid, Shankar and Subramanian2018; Chaudhary et al. Reference Chaudhary, Garg, Subramanian and Shankar2021), with the upper branch conforming to this scaling only for
 $\beta < 0.9$. Whereas the neutral loops for channel flow shown in figure 10 remain single-lobed for any
 $\beta$, those for pipe flow display instead a two-lobed structure for
 $\beta > 0.9$ (Chaudhary et al. Reference Chaudhary, Garg, Subramanian and Shankar2021). For a fixed
 $\beta$ and
 $E$, the critical Reynolds number
 $(Re_c)$ is the minimum of the
 $Re$–
 $k$ curve, and from figures 10(a) and 10(b), is seen to exhibit a non-monotonic variation with increasing
 $E$. For sufficiently high
 $E$, increasing
 $E$ is accompanied by a shrinking of the
 $Re$–
 $k$ loop, leading to its disappearance beyond a critical
 $E$. Thus, similar to pipe flow (Garg et al. Reference Garg, Chaudhary, Khalid, Shankar and Subramanian2018; Chaudhary et al. Reference Chaudhary, Garg, Subramanian and Shankar2021), the centre-mode instability ceases to exist at sufficiently high
 $E$. The phase speeds corresponding to the
 $Re$–
 $k$ neutral curves (not shown; see, however, figures 11(c) and 11(d) for plots of
 $(1-c_r)/E$ versus
 $kE^{1/2}$) remain close to unity, with the range of
 $c_r$, for any given
 $k$, again exhibiting a non-monotonic dependence on
 $E$. Importantly, and in sharp contrast to pipe flow, the phase speeds of the neutral modes along the upper branch exceed unity.
Neutral stability curves in the  $Re$–
 $k$ plane for different
 $E$ at: (a)
 $\beta =0.65$, and (b)
 $\beta =0.8$.

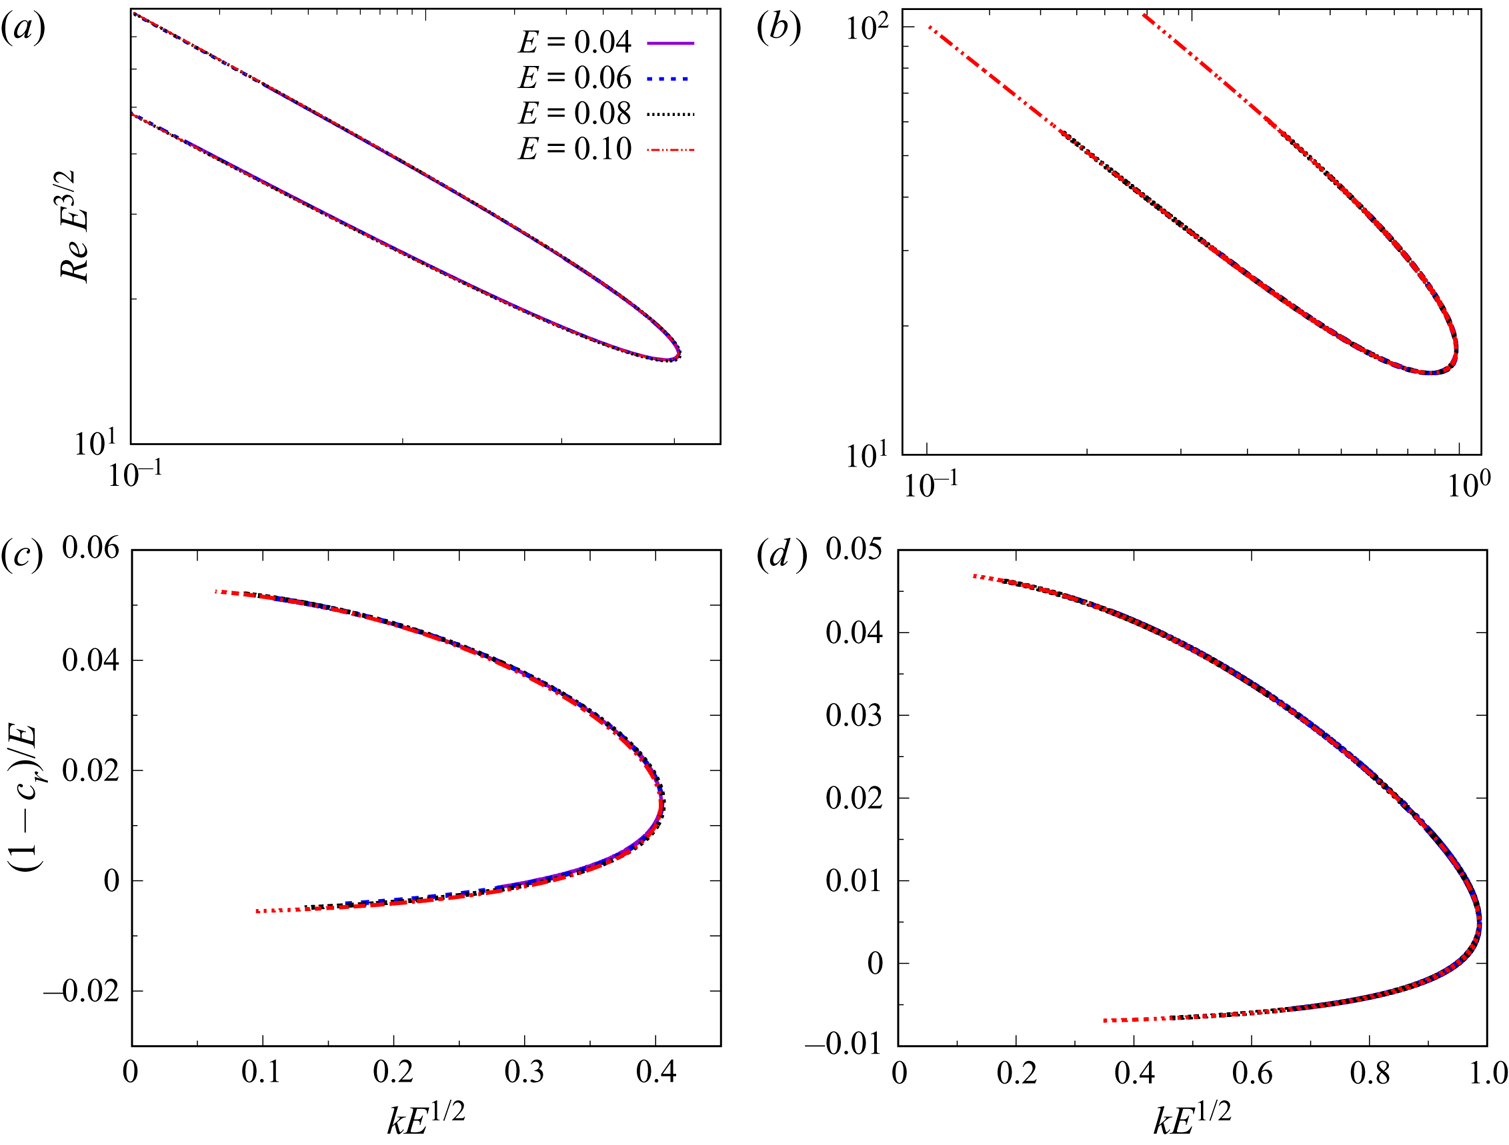
Collapse of the neutral curves for small  $E$ and for
 $\beta$ shown in figure 10: (a,b) rescaled neutral stability curves in the
 $Re E^{3/2}$–
 $k E^{1/2}$ plane for (a)
 $\beta =0.65$ and (b)
 $\beta =0.8$; (c,d) corresponding rescaled phase speeds in the
 $(1-c_r)/E$–
 $kE^{1/2}$ plane for (c)
 $\beta =0.65$ and (d)
 $\beta =0.8$.

4.1. Scaled neutral curves
Figure 10 is strongly suggestive of a collapse of neutral curves, especially for the smaller  $E$, on suitable rescaling. Figures 11(a) and 11(b) show a collapse of the different small-
 $E$ neutral loops onto a single master curve in the
 $Re E^{3/2}$–
 $k E^{1/2}$ plane, for the
 $\beta$ chosen in the aforementioned figures, implying that the threshold Reynolds number diverges as
 $E^{-3/2}$ as one approaches the Newtonian limit
 $E = 0$. In figures 11(c) and 11(d), the phase speeds along the neutral curve exhibit a similar collapse when plotted as
 $(1-c_r)/E$ versus
 $kE^{1/2}$, suggesting that
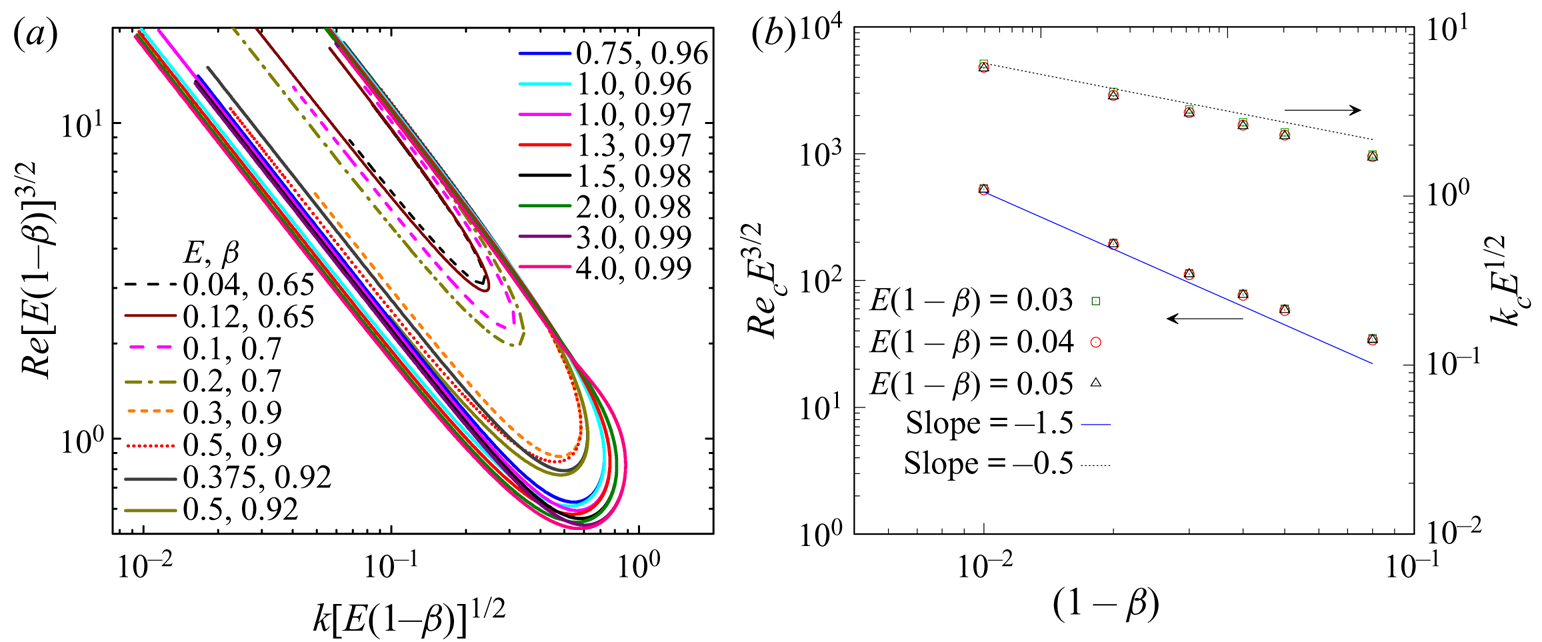
 $(1-c_r) \sim O(E)$ along the neutral curve. A similar collapse was also reported for pipe flow (Garg et al. Reference Garg, Chaudhary, Khalid, Shankar and Subramanian2018; Chaudhary et al. Reference Chaudhary, Garg, Subramanian and Shankar2021). An alternate route to the Newtonian limit, that of
 $\beta$ approaching unity for a fixed
 $E$, also appears to yield a collapse of the neutral curves when plotted in terms of
 $Re[E(1-\beta )]^{3/2}$ and
 $k[E(1-\beta )]^{1/2}$, in the limit
 $[E(1-\beta )]\ll 1$ (figure 12a). However, this collapse is not as perfect as that obtained previously for small
 $E$, even in the limit
 $\beta \rightarrow 1$. In particular, the upper branch of the
 $Re$–
 $k$ curves collapses very well for
 $\beta \approx 0.99$, but the collapse is not perfect in the lower branches and near the minimum of the neutral curves. Figure 12(b) shows the rescaled critical Reynolds number,
 $Re_c E^{3/2}$, and the corresponding rescaled critical wavenumber,
 $k_c E^{1/2}$, as a function of
 $(1-\beta )$. This plot suggests that
 $Re_c$ and
 $k_c$ begin to approach the scalings
 $Re_c \propto (E(1-\beta ))^{-3/2}$,
 $k_c \propto (E(1-\beta ))^{-1/2}$ only for
 $\beta \approx 0.99$.
Collapse in the limit  $(1-\beta ) \ll 1$ and
 $E$ fixed. In (a), neutral stability curves at different
 $E$ and
 $\beta$ plotted in terms of the scaled Reynolds number
 $Re[E(1-\beta )^{-3/2}]$ and wavenumber
 $k[E(1-\beta )]^{-1/2}$. For
 $\beta \rightarrow 1$, the rescaled neutral curves exhibit a data collapse. In (b), rescaled critical parameters at different
 $E$ and
 $\beta$ plotted as
 $Re_c E^{3/2}$,
 $k_c E^{1/2}$ vs.
 $(1-\beta )$ fall on lines of slopes
 $-3/2$ and
 $-1/2$ respectively, indicating again that,
 $Re_c \propto [E(1-\beta )]^{-3/2}$ and
 $k_c \propto [E(1-\beta )]^{-1/2}$.

4.2. Critical parameters and scalings
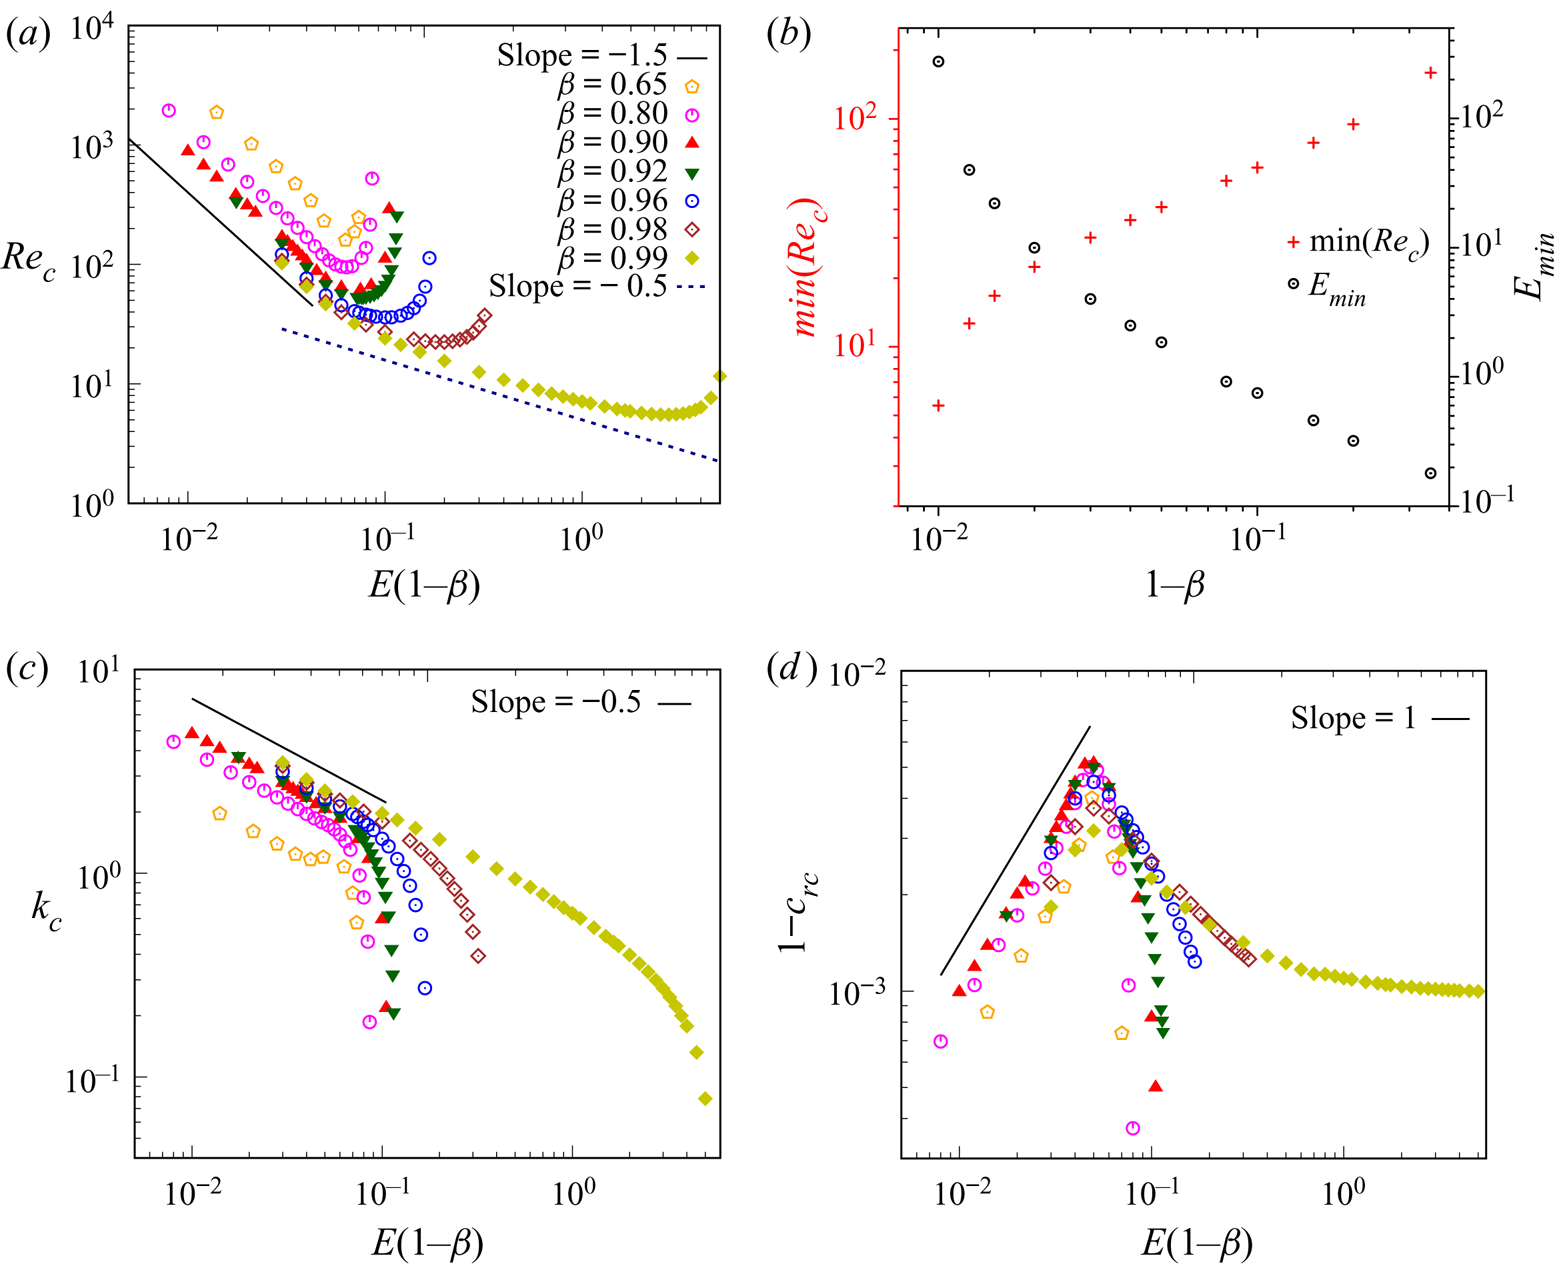
The critical parameters ( $Re_c, k_c$ and
 $c_{rc}$) are plotted as a function of
 $E(1-\beta )$ in figure 13. The variation of
 $Re_c$ (figure 13a) is non-monotonic with
 $E(1-\beta )$, with
 $Re_c$ scaling as
 $(E(1-\beta ))^{-3/2}$ for
 $E(1-\beta ) \ll 1$, but showing a nearly vertical rise beyond a threshold
 $E$, denoted
 $E_{min}$, in a manner very similar to pipe flow (Garg et al. Reference Garg, Chaudhary, Khalid, Shankar and Subramanian2018; Chaudhary et al. Reference Chaudhary, Garg, Subramanian and Shankar2021). A similar non-monotonic behaviour of
 $Re_c$ with
 $E$ has been obtained for elasto-inertial wall mode instabilities in plane Poiseuille flow of Oldroyd-B (Sadanandan & Sureshkumar Reference Sadanandan and Sureshkumar2002; Brandi et al. Reference Brandi, Mendonça and Souza2019) and FENE-P (Zhang et al. Reference Zhang, Lashgari, Zaki and Brandt2013) fluids. However, because wall modes in channel flow are strongly stabilized by solvent viscous effects, the minima in
 $Re_c$–
 $E$ curves shift towards higher
 $Re_c$ with increase in
 $\beta$ for a fixed
 $E$ (see, for example, figure 1(a) of Sadanandan & Sureshkumar Reference Sadanandan and Sureshkumar2002). In stark contrast, for the unstable centre modes (figure 13a), the
 $Re_c$ shift towards lower values as
 $\beta$ approaches unity, thereby illustrating the contrasting roles played by solvent viscous effects on the centre- and wall-mode instabilities. Figure 13(b) further reinforces the effect of
 $\beta$ by showing the variation of the minimum
 $Re_c$ (obtained from figure 13a) and the corresponding
 $E_{min}$ with
 $(1-\beta )$. Unlike pipe flow, where the centre-mode instability ceases to exist below
 $Re_c \approx 60$, the instability in channel flow persists down to
 $Re_c \sim O(1)$ for
 $\beta \rightarrow 1$, albeit at very high
 $E$. Figure 13(c) shows that the critical wavenumber scales as
 $k_c \propto [E(1-\beta )]^{-1/2}$ for
 $E (1-\beta ) \ll 1$, whereas figure 13(d) shows that the critical phase speed scales as
 $( 1-c_r ) \propto [E(1-\beta )]$, both similar to pipe flow.
Variation of critical parameters with  $E (1-\beta )$: (a) the critical Reynolds number scales as
 $Re_c \propto [E(1-\beta )]^{-3/2}$ for
 $E(1-\beta ) \ll 1$; (b) the minimum
 $Re_c$ in (a) and the corresponding
 $E_{min}$; (c) critical wavenumber
 $k_c \propto [E(1-\beta )]^{-1/2}$; and (d) phase speed,
 $(1- c_r) \propto [E(1-\beta )]$. As shown in (b), the centre-mode instability persists in channel flow up to
 $Re \approx 5$ for very high
 $E \sim 10^4$ and for
 $\beta \approx 0.99$.

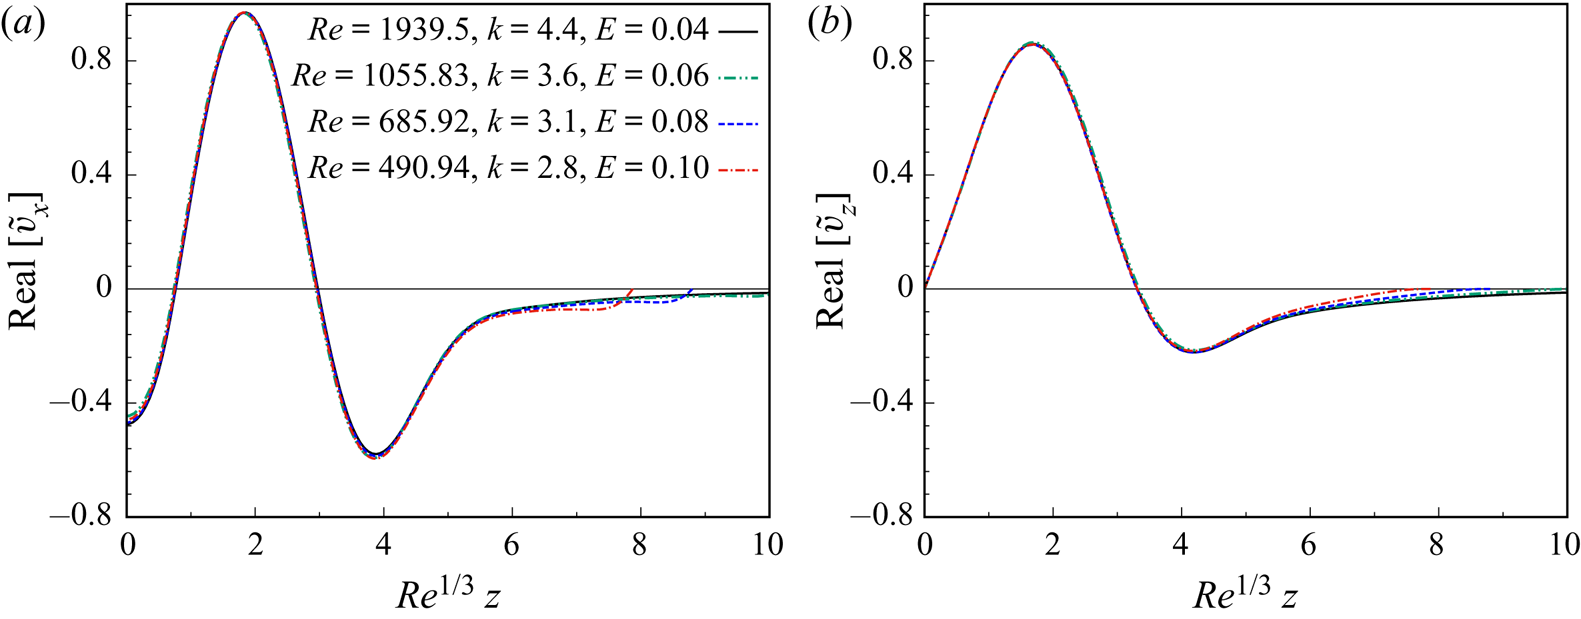
Similar to the collapse of the neutral curves for  $E \ll 1$, a collapse is also exhibited by the eigenfunctions when plotted using a suitably rescaled wall-normal coordinate for
 $Re \gg 1$,
 $E \ll 1$. In this regard, there are two possible asymptotic regimes: one in which (
 $k, \beta$) are fixed and
 $Re$ and
 $E$ are varied so as to remain in the unstable region, and the other in which
 $\beta$ is fixed, and the eigenfunctions are tracked along different sets of critical parameters (
 $Re_c, k_c$) for different
 $E$. For the latter case, figure 14 shows that the tangential and normal velocity eigenfunctions are increasingly localized in the vicinity of the channel centreline, within a boundary layer of thickness of
 $O(Re^{-1/3 })$; the
 $Re$-dependence of this boundary layer thickness may be obtained using a scaling analysis, as outlined in Chaudhary et al. (Reference Chaudhary, Garg, Subramanian and Shankar2021). Instead, if one considers a fixed
 $k$, and the limit
 $Re,W \rightarrow \infty$, such that the ratio
 $W/Re^{1/2} \sim O(1)$ in order to be in the unstable region, the eigenfunctions become localized in a boundary layer of thickness of
 $\textit{O}(Re^{-1/4})$ in the vicinity of channel centreline.
The collapse of stream-wise and wall-normal eigenfunctions corresponding to  $Re_c$ and
 $k_c$ (at
 $\beta =0.8$ and different
 $E$) when plotted against the rescaled wall-normal coordinate scaled using the viscous layer thickness of
 $\textit{O}(Re^{-1/3})$: (a) axial and (b) wall-normal.

4.3. Effect of solvent viscosity on critical parameters
The centre-mode instability in pipe Poiseuille flow discussed in our earlier works (Garg et al. Reference Garg, Chaudhary, Khalid, Shankar and Subramanian2018; Chaudhary et al. Reference Chaudhary, Garg, Subramanian and Shankar2021), rather counter-intuitively, required the presence of solvent viscous effects, with the flow being stable in the UCM limit. Nevertheless, the pipe-flow instability does continue to exist for very low  $\beta \sim 0.001$, with
 $Re_c$ exhibiting a weak divergence for
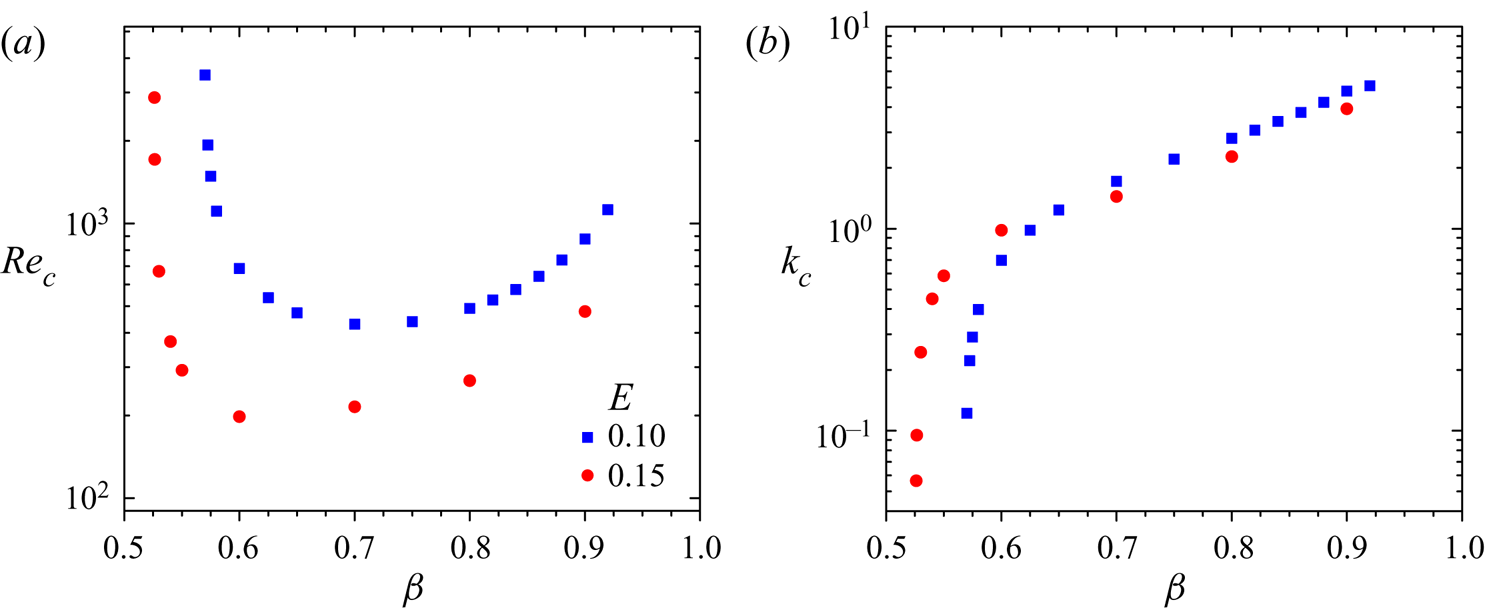
 $\beta \rightarrow 0$. In marked contrast, a finite solvent viscous threshold is required for the channel flow instability, with the instability ceasing to exist below
 $\beta \approx 0.5$ at
 $E =0.01$ (figure 15a). We have further verified that this is, in fact, the lowest
 $\beta$ for which the instability is present for any
 $E$. Figure 15(a) also shows a non-monotonic behaviour of
 $Re_c$ with
 $\beta$, at fixed
 $E \sim O(1)$, rather similar to the variation of
 $Re_c$ with
 $E$ (at fixed
 $\beta$). In the limit of
 $\beta \rightarrow 1$,
 $Re_c$ does diverge for channel flow, in a manner similar to that seen in pipe flow (see figure 5 of Garg et al. Reference Garg, Chaudhary, Khalid, Shankar and Subramanian2018). The divergence of
 $Re_c$ for
 $\beta \rightarrow 1$ appears, at first sight, to contradict the results shown in figure 13(b), where
 $Re_c$ decreases in the same limit. There is no inconsistency, however, because the parameters kept constant differ in the two cases. In figure 15(a),
 $E$ is fixed at
 $0.1$, whereas in figure 13(b),
 $E$ is allowed to vary, and increases to very high values for
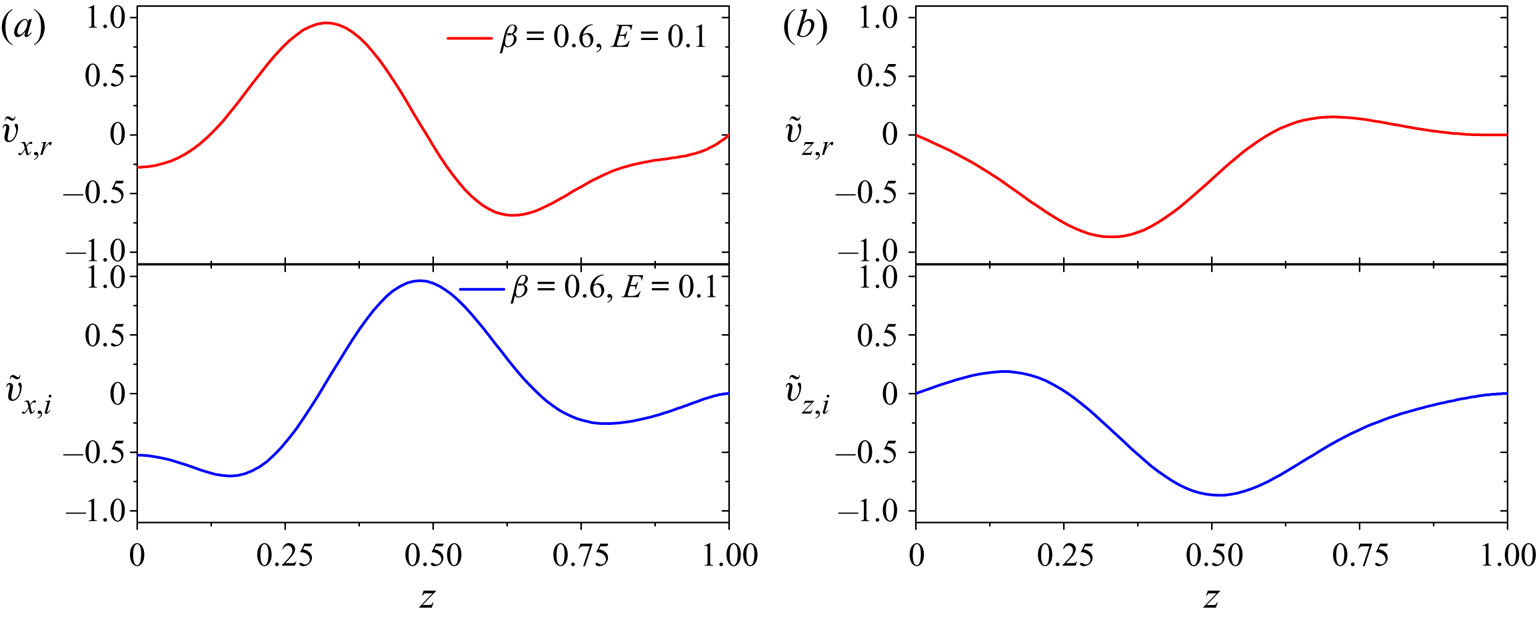
 $\beta \rightarrow 1$. The eigenfunctions at the lowest
 $\beta$ for which the centre-mode instability is present are shown in figure 16. Interestingly, the eigenfunctions at
 $\beta = 0.6$ (and
 $Re = 800$,
 $k = 1.5$) are qualitatively similar to the eigenfunctions at a much higher
 $\beta = 0.96$ (and
 $Re = 650$,
 $k = 1$) shown in figure 4, suggesting that the shape of the centre-mode eigenfunctions is rather robust over the entire unstable range of
 $\beta$.
Variation of (a)  $Re_c$ and (b) critical wavenumber
 $k_c$ as a function of the viscosity ratio
 $\beta$ at fixed
 $E$. The minimum
 $\beta$ required to sustain the centre-mode instability in channel flow is
 ${\approx }0.5$.

Normalized eigenfunctions for (a) stream-wise  $\tilde {v}_x$ and (b) wall-normal
 $\tilde {v}_z$ perturbation velocities near the lowest value of
 $\beta$ for which the centre-mode instability exists in viscoelastic channel flow. Data shown for the eigenvalue
 $c = 0.99778 + 5.78112 \times 10^{-5} \textrm {i}$ at
 $Re =800,\ k=0.6,\ E=0.1,\ \beta =0.6$.

4.4. Role of diffusion on the centre-mode instability
In this section, we explore the role of stress diffusion on the centre-mode instability. The underlying microscopic origin of stress diffusion is the Brownian (translational) diffusion of the polymer molecules, with a diffusivity  $D \sim 10^{-12}$ m
 $^2$ s
 $^{-1}$, and a corresponding Schmidt number
 $Sc = \nu /D \sim 10^6$, with
 $\nu$ being the kinematic viscosity of the polymer solution. To this end, the Oldroyd-B constitutive equation is now augmented with a stress diffusion term, whose importance, in dimensionless terms, is characterized by
 $D \lambda /H^2$ (Chaudhary et al. Reference Chaudhary, Garg, Subramanian and Shankar2021). Although many older (Sureshkumar & Beris Reference Sureshkumar and Beris1995a; Sureshkumar et al. Reference Sureshkumar, Beris and Handler1997) and a few recent (Lopez et al. Reference Lopez, Choueiri and Hof2019) DNS studies have incorporated an artificially large diffusion coefficient with
 $Sc \sim O(1)$, the work of Sid et al. (Reference Sid, Terrapon and Dubief2018) has demonstrated that the two-dimensional EIT structures are suppressed for
 $Sc < 9$. It therefore behooves us to examine whether stress diffusion has a similar effect on the centre-mode instability analysed in this study, especially because of our premise that the centre-mode instability is the mechanism underlying the onset of EIT. Based on the
 $D$ given previously, a typical relaxation time
 $\lambda \sim 10^{-3}$ s, and with channel half-width
 $H \sim 1$ mm, the dimensionless diffusivity
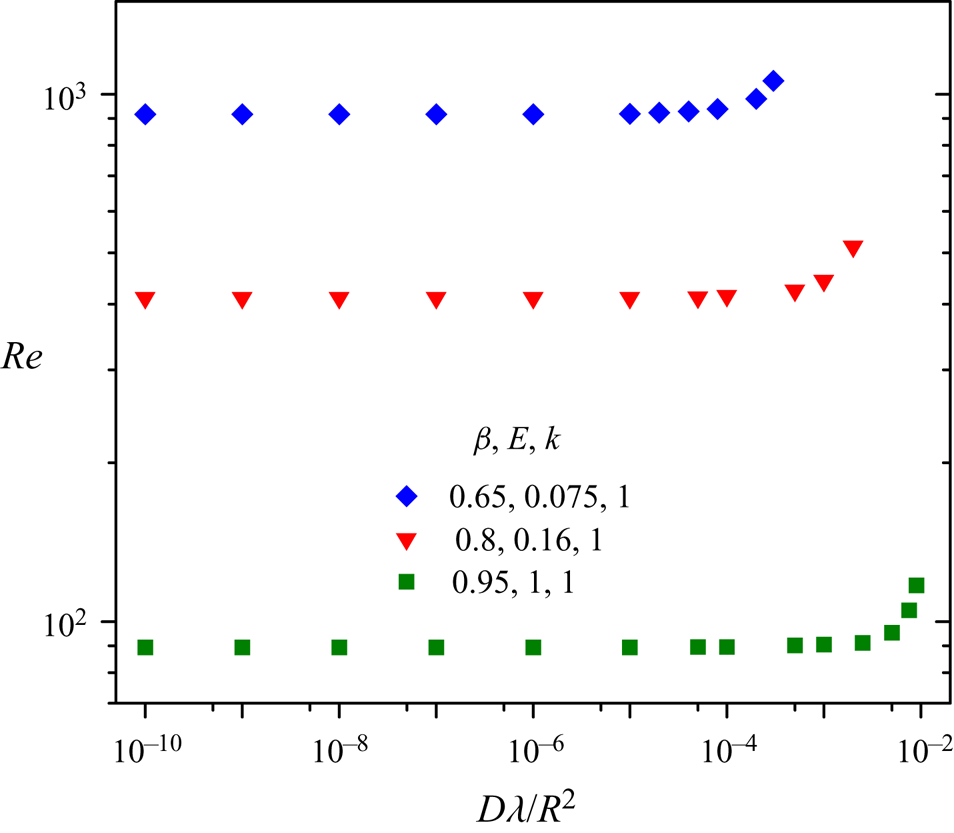
 $D \lambda /H^2 \sim 10^{-9}$. Note that, with the stress diffusion term included, boundary conditions need to be prescribed for the polymeric stress. Following earlier efforts (Sureshkumar & Beris Reference Sureshkumar and Beris1995a), these are obtained by using the constitutive equation without diffusion at the two boundaries. Figure 17 shows the threshold
 $Re$ for the centre-mode instability as a function of
 $D \lambda /H^2$, for fixed sets of
 $E$,
 $\beta$ and
 $k$. For
 $D\lambda /H^2 \rightarrow 0$, the threshold
 $Re$ for instability for the model with stress diffusion approaches that of the Oldroyd-B model without diffusion; importantly,
 $Re_c$ remains virtually unaltered for the aforementioned estimate of
 $D\lambda /H^2 \sim O(10^{-9})$. However, similar to pipe flow (Chaudhary et al. Reference Chaudhary, Garg, Subramanian and Shankar2021),
 $Re_c$ increases steeply for
 $D\lambda /H^2$ greater than a threshold that is a function of
 $E$ and
 $\beta$. For
 $(\beta ,E,k) \equiv (0.8, 0.16, 1)$, this threshold is
 $O(10^{-3})$, corresponding to
 $Sc = E/(D \lambda /H^2) \sim 100$ for
 $E = 0.1$. This stabilization of the linear centre-mode instability beyond a threshold stress diffusivity is broadly consistent with the disappearance of the span-wise structures in the fully nonlinear simulations of Sid et al. (Reference Sid, Terrapon and Dubief2018) discussed previously.
The effect of stress diffusion coefficient  $D \lambda /H^2$ on the threshold
 $Re$ required for centre-mode instability at different
 $E$,
 $\beta$ and
 $k$.

4.5. Comparison with experiments
We compare our theoretical predictions with the experiments of Srinivas & Kumaran (Reference Srinivas and Kumaran2017), who studied the flow of 30 and 50 ppm polyacrylamide (PAAm) solutions (molecular weight  $5 \times 10^6$) through a rectangular microchannel with cross-sectional dimensions
 $160\ \mathrm {\mu }\textrm {m} \times 1.5$ mm, resulting in a cross-sectional aspect ratio of
 $9.375$. Srinivas & Kumaran (Reference Srinivas and Kumaran2017) characterized the transition using the increase in the standard deviation of velocity fluctuations, as inferred from PIV. On account of the large cross-sectional aspect ratio, the flow in the channel is expected to be quasi-two-dimensional, and have a parabolic (plane-Poiseuille) form with the characteristic scale in the gradient direction being the shorter of the two cross-sectional dimensions (
 $160\ \mathrm {\mu }$m). Therefore, for the purposes of comparison with our predictions, we identify the experimental channel half-width (see figure 1) to be
 $H = 80\ \mathrm {\mu }$m. We estimated the elasticity numbers (
 $E \equiv \lambda \nu /\rho H^2$,
 $\lambda$ being the longest relaxation time of polymer, whereas
 $\nu$ and
 $H$ are the kinematic viscosity of the solution and channel half-width), respectively, for these experiments using the Zimm relaxation time of the polymer solution. The longest relaxation time from the Zimm model is given by
 $\lambda _{Zimm} = \eta _s R_g^3/(k_B T)$ ((4.83) of Doi & Edwards Reference Doi and Edwards1986), where
 $R_g$ is the radius of gyration of a polymer molecule,
 $T$ is the absolute temperature,
 $k_B$ is the Boltzmann constant and
 $\eta _s$ is the solvent viscosity. It is important to note here that the Zimm relaxation time of
 $\lambda _{Zimm} = 30$ ms used in Srinivas & Kumaran (Reference Srinivas and Kumaran2017) is overestimated by a factor of around
 $20$ owing to the use of end-to-end distance in the expression given previously. However, if
 $R_g = 0.184 \times 10^{-6}$ m corresponding to a molecular weight of
 $5 \times 10^6$ g mol
 $^{-1}$ is used (Kulicke, Kniewske & Klein Reference Kulicke, Kniewske and Klein1982), we obtain
 $\lambda _{Zimm} = 1.4$ ms, for
 $\eta _s = 0.001$ Pa s. Using these estimates, we obtain
 $E = 0.22$ for
 $H = 80\ \mathrm {\mu }$m corresponding to the flow conditions of Srinivas & Kumaran (Reference Srinivas and Kumaran2017). The
 $Re_c$ from our stability analysis are in reasonable agreement with the threshold
 $Re_t$ inferred from experiments (table 2).
Comparison of present theoretical predictions for  $Re_c$ with the experimentally inferred transition Reynolds number
 $Re_t$ of Srinivas & Kumaran (Reference Srinivas and Kumaran2017) for the flow of PAAm solutions in rectangular microchannels. Note that the
 $Re$ defined in Srinivas & Kumaran (Reference Srinivas and Kumaran2017) was based on the average velocity and channel-full width, and hence must be multiplied by
 $3/4$ to obtain the
 $Re$ used in the present work, which is based on the maximum base-flow velocity and channel half-width. Here,
 $C_p$ denotes the concentration of the polymer solutions used.

A point, made on more than one occasion in this paper, is that viscoelastic channel flow continues to be linearly unstable even at  $Re \sim O(1)$, provided the elasticity number is sufficiently large. In figure 13(b),
 $Re_c$ dips down to about
 $5$ at an
 $E$ of
 $O(200)$ (with
 $\beta = 0.99$). In this regard, it is worth mentioning the recent experiments of Steinberg and co-workers (Varshney & Steinberg Reference Varshney and Steinberg2017, Reference Varshney and Steinberg2018a,Reference Varshney and Steinbergb), which demonstrate the feasibility of achieving very high
 $E$ with dilute polymer solutions. The experiments involve a channel flow set-up, although the focus is entirely different; the authors analyse elasticity-induced transitions in the free-shear flow set up between a pair of cylindrical obstacles embedded in the imposed pressure-driven flow. Importantly, the experiments access
 $W$ in excess of
 $10^3$ with
 $Re$ still being substantially smaller than unity. Note that the polymer concentration in the previous experiments is quite low (
 $c = 80$ ppm, with the overlap concentration
 $c^* \approx 200$ ppm), and shear thinning effects are therefore negligible. In contrast, there have been other reports of instabilities (Bodiguel et al. Reference Bodiguel, Beaumont, Machado, Martinie, Kellay and Colin2015; Poole Reference Poole2016; Picaut et al. Reference Picaut, Ronsin, Caroli and Baumberger2017; Chandra et al. Reference Chandra, Mangal, Das and Shankar2019) in channel/tube flows of highly shear-thinning concentrated solutions (
 $\beta < 0.2$), but these observations cannot be explained by the centre-mode instability which is absent for
 $\beta \leq 0.5$.
5. Linear versus nonlinear transition scenarios in viscoelastic channel flow
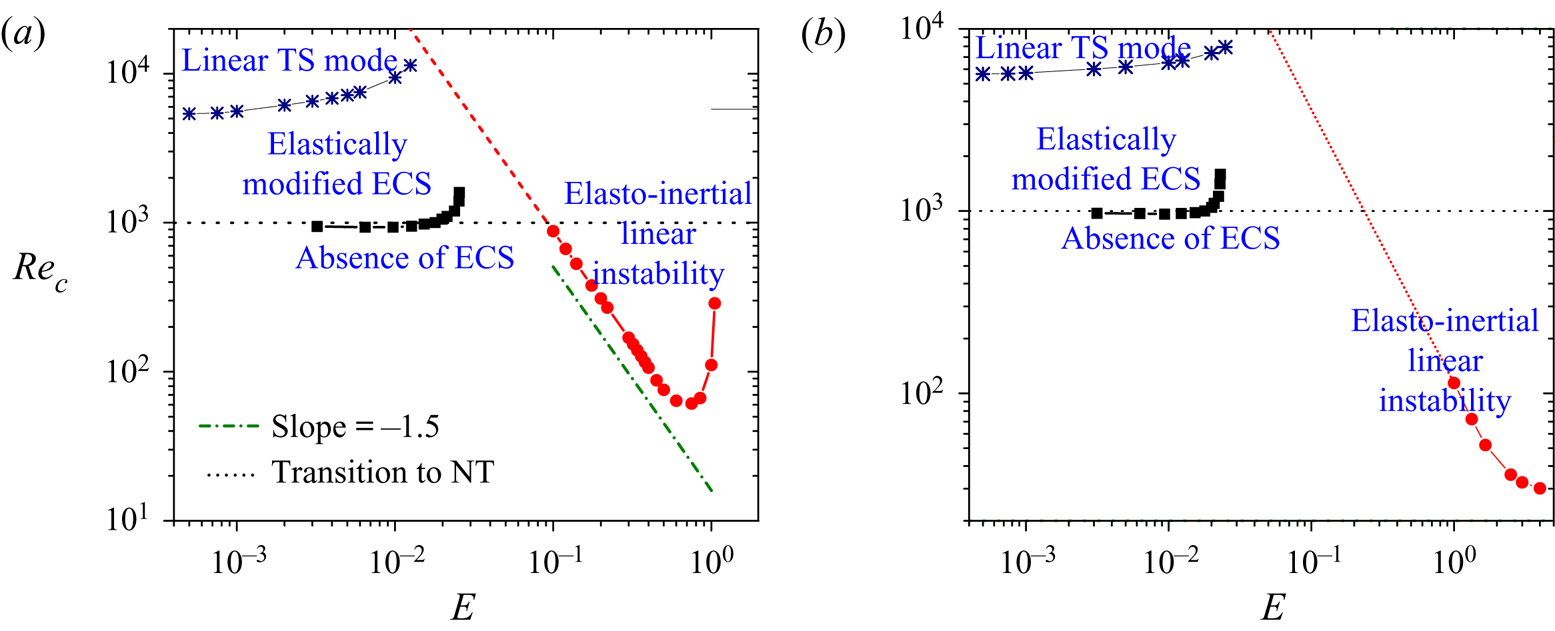
As mentioned in the introduction, transition to turbulence in canonical parallel shear flows of Newtonian fluids has a subcritical character, being preceded by the emergence and proliferation of nonlinear three-dimensional solutions (including travelling waves), termed ECS, in an appropriate phase space. Motivated by this Newtonian picture, Li & Graham (Reference Li and Graham2007) studied the effect of viscoelasticity (using a FENE-P model) on the simplest ECS solutions in plane Poiseuille flow, namely, the nonlinear travelling waves originally found for the Newtonian case by Waleffe (Reference Waleffe2001), with the aim of inferring the effect of viscoelasticity on transition. The results from figure 2 of Li & Graham (Reference Li and Graham2007) for the Reynolds number  $Re_{min}$ required for the existence of the travelling-wave ECS are shown in figure 18(a) for
 $\beta = 0.9$ and in figure 18(b) for
 $\beta = 0.97$; the results have been replotted as a function of
 $E$, rather than
 $W$ used by those authors. The first effects of viscoelasticity, extending up to
 $E \le 0.01$, manifest as a slight decrease (not visible on the scale of the plot) in
 $Re_{min}$ from the Newtonian value. This initial decrease arises because the polymer molecules see a (weak) Lagrangian unsteady flow as they are convected by the ECS velocity field. A part of the shear work is thereby stored as elastic energy, in turn leading to a reduced polymer contribution to the shear viscosity. Regarding the threshold Reynolds number for the existence of ECS, defined in terms of the aforementioned reduced viscosity, to be unchanged, implies that the original threshold based on the (zero-shear) solution viscosity decreases by a factor equal to the viscosity ratio. A similar argument, in fact, explains the initial reduction in the drag coefficient, as a function of the Deborah number, for a sphere translating in a viscoelastic fluid (James Reference James2009).
Boundaries demarcating the existence of elastically-modified ECS solutions (black squares; Li & Graham Reference Li and Graham2007), the elastically-modified linear TS mode (blue stars; present study) and the linear centre-mode instabilities (red circles; present study) in the  $Re$–
 $E$ plane for (a)
 $\beta =0.9$ and (b)
 $\beta =0.97$. The lack of points on the centre-mode threshold curve is only an apparent one, because the numerics have begun conforming to the small-
 $E$ asymptote (the red dashed line represents the
 $Re_c \propto E^{-3/2}$ scaling for the centre mode, extrapolated down to
 $E \sim 0.01$). The black dotted line represents the experimental threshold for Newtonian turbulence (NT).

For  $E > 0.03$, however,
 $Re_{min}$ increases abruptly owing to (nonlinear) stretching of the polymers, implying a rapid shrinking (and subsequent disappearance) of the regime of existence of the simplest ECS. Assuming this stabilizing effect to hold for the other ECS with a non-trivial time dependence (for instance, relative periodic orbits), one may infer that viscoelasticity tends to suppress the subcritical Newtonian transition. Figure 18 also shows the threshold Reynolds number,
 $Re_c$, for the onset of the centre-mode instability. For completeness, we show, in addition, the
 $Re_c$ for the elastically modified TS mode (recall that
 $Re_c$ in this case equals
 $5772$ for
 $E = 0$). Note that whereas the results of Li & Graham (Reference Li and Graham2007) are for a FENE-P fluid and the present results have been obtained using the Oldroyd-B model, our preliminary stability calculations for a FENE-P fluid show that the present results are not qualitatively altered by finite extensibility.
Figure 18 allows one to rationally infer the transition scenario pertinent to a given viscoelastic channel flow configuration, and should serve as a guide for future experimental efforts probing transition in the flow of polymer solutions through rectangular channels. Note that two types of transition experiments have been carried out in the literature: the ‘forced transition’, wherein the inlet was subjected to a disturbance of fixed finite amplitude (for instance, a commonly used forcing mechanism is via fluid injection at the walls; see Darbyshire & Mullin Reference Darbyshire and Mullin1995; Hof, Juel & Mullin Reference Hof, Juel and Mullin2003), and the ‘natural transition’ that ensues in the absence of any imposed disturbances. Based on this, one may clearly differentiate between two extreme scenarios for channel-flow transition. The first is that of a ‘noisy’ experimental set-up, where the subcritical forced transition occurs at an  $Re_c \approx 1000$ in the Newtonian limit (correlated to the emergence of the ECS at a slightly lower
 $Re$). The viscoelasticity-induced suppression of the ECS then leads to a steep increase in
 $Re_c$ with increasing
 $E$ and, finally, at much higher
 $E$, a rapid decrease in
 $Re_c$ results corresponding to the onset of the linear centre-mode instability. At the other extreme, for a sufficiently refined set-up, the Newtonian transition would be the natural one, occurring at
 $Re_c = 5772$ for
 $E = 0$, with
 $Re_c$ exhibiting a relatively gentle increase with
 $E$ thereafter, along the TS-wall mode branch, until the point of intersection with the centre-mode branch. This intersection corresponds to a fairly modest
 $E$ of
 $O(10^{-2})$ for
 $\beta = 0.9$ (see figure 18a), after which
 $Re_c$ begins to decrease owing to the centre-mode instability, similar to the forced transition described previously. For intermediate noise levels, one expects the transition scenario to interpolate between these two extremes.
Interestingly, figure 18 bears a qualitative resemblance to that obtained by Samanta et al. (Reference Samanta, Dubief, Holzner, Schäfer, Morozov, Wagner and Hof2013) for their pipe-flow experiments (see figure 3(a) therein). Note that  $E$ in figure 18 may be treated as a surrogate for the polymer concentration used in Samanta et al. (Reference Samanta, Dubief, Holzner, Schäfer, Morozov, Wagner and Hof2013); in either case, a given experiment corresponds to a vertical line in figure 18. For Newtonian pipe flow, the forced transition is again subcritical (and related to the emergence of ECS similar to those for channel flow), and in the experiments of Samanta et al. (Reference Samanta, Dubief, Holzner, Schäfer, Morozov, Wagner and Hof2013), this transition occurred at
 $Re_c \approx 2000$ (an exact critical point of
 $Re_c = 2040 \pm 10$ has been identified in this regard based on the timescales associated with the emergence and subsequent splitting of the ECS; see Avila et al. Reference Avila, Moxey, Lozar, Barkley and Hof2011). However, the linear stability of pipe flow implies that the natural transition, although at a higher
 $Re_c$, is again subcritical and, therefore, in contrast to the channel flow case. Thus, although the natural transition in the Newtonian limit can, in principle, be delayed to very high Reynolds numbers in suitably refined set-ups (Pfenniger Reference Pfenniger1961), it occurred at
 $Re_c \approx 6500$ for Samanta et al. (Reference Samanta, Dubief, Holzner, Schäfer, Morozov, Wagner and Hof2013). For the forced transition, Samanta et al. (Reference Samanta, Dubief, Holzner, Schäfer, Morozov, Wagner and Hof2013) did observe an increase in
 $Re_c$ with polymer concentration, similar to the role played by
 $E$ in the subcritical channel-flow transition discussed previously, and that may be rationalized based on the elasticity-induced suppression of the underlying ECS solutions. However, the
 $Re_c$ for the natural transition decreased from
 $6500$ with increasing
 $E$ (although the authors explicitly state the Newtonian threshold, as is also evident from their figure 2(a), their figure 3(a) nevertheless does not connect to this Newtonian threshold, and is instead suggestive of an apparent divergence of the threshold
 $Re$ in the limit of zero concentration). As mentioned in Chaudhary et al. (Reference Chaudhary, Garg, Subramanian and Shankar2021), this runs counter to the stabilizing role of elasticity on the simplest ECS predicted by Li & Graham (Reference Li and Graham2007), and implies a differing role of elasticity on the more complex set of ECS that presumably determine the turbulent trajectory at the higher
 $Re$. This behaviour for pipe flow suggests that the effect of an increasing
 $E$ on the channel flow transition, in cases where the transition occurs at
 $Re$ greater than
 $O(1000)$ (and until close to the linear TS-mode threshold), might depend on the relative influences of the TS wall-mode with regards to the ECS solutions that, in turn, might depend both on the
 $Re$ and on the detailed nature of the induced disturbance. When the ECS solutions play a dominant role for small
 $E$, similar to Samanta et al. (Reference Samanta, Dubief, Holzner, Schäfer, Morozov, Wagner and Hof2013), one expects the
 $Re_c$ to decrease with increasing
 $E$ to begin with, with a subsequent more rapid decrease at higher
 $E$ arising owing to the centre-mode instability.
In the context of the forced transition scenario, we mentioned the suppression of the ECS at a fairly modest  $E$, and the emergence of the centre-mode-mediated transition only at higher
 $E$, implying the existence of an intermediate
 $E$-interval where neither mechanism might be operative. For instance, considering a fixed-
 $Re$ path, with
 $Re \approx 1500$ in figure 18(a) for
 $\beta = 0.9$, the ECS solutions are restricted to
 $E$ below an (approximate) threshold of
 $0.04$; in contrast, the two-dimensional centre-mode instability is only operative for
 $E > 0.09$. Thus, there is the possibility of transition in the interval
 $0.04 < E < 0.09$ being controlled by novel subcritical mechanisms. In this regard, as briefly mentioned in the introduction and discussed in the following, two very different mechanisms, with their origins in the centre and wall modes of the elasto-inertial spectrum, have recently been proposed.
The first proposal, by Shekar et al. (Reference Shekar, McMullen, Wang, McKeon and Graham2019), is rooted in the least-stable TS wall mode, as already mentioned in § 1. However, our discussion in § 3.2 (e.g. figure 6) shows that, at higher  $E$, one of the centre modes is the least stable. Thus, it is necessary to demarcate the
 $E$-intervals in which the TS (TSM) and centre (NCM-1 and ECM-1) modes is the most dominant one in the elasto-inertial spectrum. To this end, in appendix B, we examine, within the linear stability framework, the decay/growth rates of each of these modes as
 $E$ is varied (at fixed
 $Re$,
 $\beta$ and
 $k$). It is demonstrated therein that the continuation of the TS mode is no longer present in the elasto-inertial spectrum as
 $E$ is increased. Indeed, there is a range of
 $E$ for which there are no discrete stable modes above the CS, the latter being the least stable in this range. The centre mode eventually emerges above the CS, being the least-stable or least-unstable mode for all higher
 $E$. Clearly, beyond the smallest
 $E$, even a nonlinear (subcritical) mechanism underlying the transition must necessarily involve the signatures, either of the least-stable centre mode or the stable CS. This scenario is further illustrated in figure 19, where we demarcate regions in the
 $Re$–
 $E$ plane for a fixed
 $k = 0.4{\rm \pi}$ (and for
 $\beta = 0.9$ and
 $0.97$, the values used in Li & Graham Reference Li and Graham2007) where the TS, CS and the centre modes are least stable or unstable. For
 $k = 0.4{\rm \pi}$ and
 $Re = 1500$, the TS mode is the least stable only for sufficiently small
 $E$ (
 $E < 0.015$ for
 $\beta = 0.9$ and
 $E < 0.02$ for
 $\beta = 0.97$ in figure 19); for an intermediate range of
 $E$, a range that increases in extent as
 $\beta$ approaches unity, there are no discrete modes above the CS in the elasto-inertial spectrum, with the CS dominating the dynamics. At higher
 $E$, the centre mode emerges above the CS, and is either the least-stable (
 $E > 0.06$ for
 $\beta = 0.9$ and
 $E > 0.5$ for
 $\beta = 0.97$) or least-unstable (
 $E > 0.2$ for
 $\beta = 0.9$ and
 $E > 0.7$ for
 $\beta = 0.97$) mode. The least-stable nature of the TS mode at the lowest
 $E$ (for
 $k = 0.4 {\rm \pi}$) in figure 19 is, however, sensitive to the wavenumber chosen, and as discussed in appendix B, for
 $k > 2$, the centre mode is the least stable even in the Newtonian limit. The second mechanism, proposed by Page et al. (Reference Page, Dubief and Kerswell2020), is based on a novel elasto-inertial coherent state that bifurcates subcritically from the centre-mode instability, and therefore continues to exist even in regimes where the centre mode is stable (thereby being relevant to the aforementioned intermediate range of
 $E$). In particular, Page et al. (Reference Page, Dubief and Kerswell2020) carried out DNS using the FENE-P model, and used an arc-length procedure to continue the centre-mode eigenfunction to the subcritical regime. Their study identified a structure with polymer stretch contours resembling an ‘arrow head’ configuration, and shares similarities with the structures seen transiently in DNS of the EIT regime (Dubief et al. Reference Dubief, Page, Kerswell, Terrapon and Steinberg2020). These two-dimensional elasto-inertial coherent states owe their origin to both inertia and elasticity, and thus are absent in the Newtonian limit, unlike the elastically modified three-dimensional ECS analysed by Graham and co-workers which are, essentially, of a Newtonian origin.
Regions in the  $Re$–
 $E$ plane where the TS, CS and ECM-1 are the least stable/unstable for
 $k = 0.4{\rm \pi}$ and (a)
 $\beta =0.9$ and (b)
 $\beta =0.97$. The TS mode is the least stable in the region to the left of the red curve, whereas the CS modes are the least stable in the region between the red and black curves. The centre mode (ECM-1) is the least stable in the region between the black and pink curves and is unstable in the region to the right of the pink curves.

6. Conclusions
The present study provides a comprehensive account of the linear stability of plane Poiseuille flow of an Oldroyd-B fluid, and shows that in the limit of sufficiently elastic ( $E \sim 0.01$ and higher) and moderate-to-highly dilute (
 $\beta \sim 0.6$ and higher) solutions, the flow becomes unstable to a two-dimensional centre mode with phase speed close to the maximum base-flow velocity, and at a critical Reynolds number,
 $Re_c$, much lower than the typical Newtonian threshold of
 $\sim 1100$. We also provide a detailed account of the emergence of the unstable centre mode in the elasto-inertial spectrum. Several features of the instability predicted here for channel flow are analogous to those for viscoelastic pipe flow (Garg et al. Reference Garg, Chaudhary, Khalid, Shankar and Subramanian2018; Chaudhary et al. Reference Chaudhary, Garg, Subramanian and Shankar2021), including the scalings of the critical Reynolds
 $Re_c \propto (E (1-\beta ))^{-3/2}$ and wavenumbers
 $k_c \propto (E (1-\beta ))^{-1/2}$ in the limit
 $E(1-\beta ) \ll 1$ for fixed
 $E$. Although the disturbances in the aforementioned asymptotic limit are strongly localized near the channel centreline, this is no longer true for experimentally relevant values of
 $\beta$ and
 $E$. In fact, after correctly accounting for the relaxation times, our theoretical predictions for
 $Re_c$ are in reasonable agreement with the observations of Srinivas & Kumaran (Reference Srinivas and Kumaran2017) for transition in rectangular microchannels.
There are a few crucial differences between the centre-mode stability characteristics of viscoelastic channel and pipe flows, the most important being the absence of the centre-mode instability for  $\beta < 0.5$ in channel flow, in contrast to its persistence down to
 $\beta \sim 10^{-3}$ in pipe flow. In either case, the destabilizing role of solvent viscous effects on the centre-mode instability is in contrast to their stabilizing role for wall-mode instabilities (Sadanandan & Sureshkumar Reference Sadanandan and Sureshkumar2002; Khalid et al. Reference Khalid, Chaudhary, Shankar and Subramanian2020). In the opposite limit of
 $\beta \rightarrow 1$, the instability persists down to
 $Re \approx 5$ for channel flow, while being restricted to
 $Re > 63$ in pipe flow. Thus, whereas the channel centre-mode instability requires a finite solvent viscous threshold, the pipe centre-mode instability requires a finite inertial threshold for its existence. It is also worth noting that the prediction of a linear instability for
 $Re \sim O(1)$, for channel flow, is a significant departure from the prevailing viewpoint of such rectilinear shearing flows being linearly stable at low
 $Re$, wherein a nonlinear subcritical mechanism was hitherto considered to be the only route to instability (Meulenbroek et al. Reference Meulenbroek, Storm, Morozov and van Saarloos2004; Morozov & van Saarloos Reference Morozov and van Saarloos2005; Pan et al. Reference Pan, Morozov, Wagner and Arratia2013).
Despite the differences for  $\beta < 0.5$ and
 $\beta \rightarrow 1$, for the intermediate range of
 $\beta$, there does appear to be a universal linear mechanism underlying the onset of EIT in both viscoelastic channel and pipe flows. Thus, the viscoelastic scenario stands in stark contrast to the profound differences between the modal stabilities of Newtonian pipe and channel flows, with pipe flow being linearly stable for all
 $Re$ and channel flow exhibiting a linear instability at
 $Re = 5772$. The Newtonian transition observed in experiments is now known to be dominated by nonlinear processes, and is similar for both the channel and pipe flow geometries. Theoretically speaking, the transition is attributed to the emergence and subsequent proliferation of ECS solutions of the Navier–Stokes equations, with increasing
 $Re$, in the neighbourhood of the laminar state, and that drive the nonlinear transitional dynamics. The close analogy between the Newtonian pipe and channel transition scenarios, despite the aforementioned contrast in the linear stability characteristics, arises from the structural and dynamical resemblance of the underlying ECS solutions in the two cases. On the other hand, linear stability theory appears broadly consistent with observations for the viscoelastic case, both for pipe and channel flows. However, as discussed in the following, more work needs to be done with regard to the nonlinear dynamics of the transition.
It is worth mentioning that the two-dimensional centre-mode instability predicted here and the axisymmetric instability predicted in our earlier work (Garg et al. Reference Garg, Chaudhary, Khalid, Shankar and Subramanian2018; Chaudhary et al. Reference Chaudhary, Garg, Subramanian and Shankar2021) are also consistent with the nature of the nonlinear state observed in simulations in these geometries: see Dubief et al. (Reference Dubief, Terrapon and Soria2013), Samanta et al. (Reference Samanta, Dubief, Holzner, Schäfer, Morozov, Wagner and Hof2013) and Sid et al. (Reference Sid, Terrapon and Dubief2018) for the channel case and Lopez et al. (Reference Lopez, Choueiri and Hof2019) for the pipe geometry. In both cases, the nonlinear elasto-inertial turbulent state is dominated by span-wise structures in sharp contrast to stream-wise oriented, span-wise varying structures that dominate Newtonian transition. This contrast between the Newtonian ECS and the EIT structures has recently found some support in a bifurcation study (Page et al. Reference Page, Dubief and Kerswell2020), where the authors used an arc-length method to continue the centre-mode solutions subcritically, identifying a continuous pathway from the linear threshold. Although this shows the relevance of the centre-mode even in the linearly stable regime, the so-called arrowhead EIT structure found does not bear a close resemblance to the centre-mode eigenfunctions, presumably owing to the (strong) subcriticality. However, one expects a closer connection between the DNS structures and the linear (centre-mode) eigenfunctions in parameter regimes where the bifurcation is supercritical (Garg, Shankar & Subramanian Reference Garg, Shankar and Subramanian2020). The structure identified by Page et al. (Reference Page, Dubief and Kerswell2020), presumably along with other new elasto-inertial structures, are likely to underlie the dynamics of the EIT state, with the EIT trajectory sampling these novel elasto-inertial coherent states, akin to how the Newtonian turbulent trajectory samples the multitude of Newtonian ECS (Budanur et al. Reference Budanur, Short, Farazmand, Willis and Cvitanović2017). Identifying the nature of the nonlinear transition mechanisms in the intermediate range of  $E$, where the (Newtonian) ECS are suppressed and the flow is linearly stable, is likely to be an important area for future research.
Declaration of interests
The authors report no conflict of interest.
Appendix A. The elasto-inertial spectrum of an Oldroyd-B fluid
In this appendix, we discuss the generic features of the elasto-inertial eigenspectrum of an Oldroyd-B fluid with the Newtonian spectrum as a reference. The emergence and trajectory of the elasto-inertial centre mode and other stable discrete modes are depicted with the aid of eigenspectra. Appendix A.1 examines the spectra as  $E$ is increased from zero at fixed
 $\beta$, whereas in appendix A.2, the evolution of spectra is shown as
 $\beta$ is varied at fixed
 $E$.
A.1. Varying $E$ at fixed $\beta$


Figures 20 and 21 show the unfiltered eigenspectra for  $Re = 800$,
 $k = 1.5$ and
 $\beta = 0.8$ for
 $E$ ranging from
 $10^{-4}$ to
 $10^{-1}$, with figure 20 focusing on the subinterval
 $E \in 10^{-4}$–
 $7.5 \times 10^{-3}$. The Newtonian eigenspectrum (
 $E = 0$) is shown in each figure as a reference. The original Y-shape of the Newtonian spectrum is modified only slightly for very low values of
 $E$ (inset (B) in figure 20a), although there is the appearance of an additional inverted Y-shape just above CS1 (inset (A) in figure 20a). In addition to this modified Newtonian locus, the two CS balloons, discussed in § 3.1 of the main text, are encircled by a set of discrete modes which form an approximate ring-like structure (figures 20(a) and 20b). We have verified (illustrated further in figure 22c) that these modes are the continuation, to finite-
 $\beta$, of a class of damped shear waves in the UCM limit, termed the HFGL modes (after Gorodtsov & Leonov Reference Gorodtsov and Leonov1967). The locus of these modes corresponds to
 $c_i = -1/(2kW)$ for
 $\beta = 0$ (Kumar & Shankar Reference Kumar and Shankar2005; Chaudhary et al. Reference Chaudhary, Garg, Shankar and Subramanian2019), but this line bends downwards upon increase in
 $\beta$, leading to the ring-like structure seen in figure 20(a). For
 $E>0.001$, the bent locus collapses onto the two CS, except for a small portion near the
 $c_r \approx 1$ (figure 20c). Further, the discrete centre modes belonging to the Newtonian P-branch are also modified with an increase in
 $E$. Figures 20(d)–20(f) show that the elastically modified Newtonian centre modes (referred to as ‘NCMs’, with an index that labels them in order of increasing
 $|c_i|$) only change a little with increasing
 $E$, but both CS1 and CS2 move up and in this process, all the NCMs disappear into CS1 beyond a threshold
 $E$ (
 $\sim 7.5 \times 10^{-3}$) for
 $Re = 800$ in figure 20(f). It is well known that CS1 is a branch cut for any
 $Re$, with plane Couette flow being an exception (Wilson et al. Reference Wilson, Renardy and Renardy1999), allowing modes to collapse into it (crossing onto a different Riemann sheet in the process), and likewise, new modes to appear from it, with increasing
 $E$. This behaviour mimics that found earlier in viscoelastic pipe flow (Chaudhary et al. Reference Chaudhary, Garg, Subramanian and Shankar2021).
Elasto-inertial spectra for plane channel flow as  $E$ is increased from zero, with
 $Re=800$,
 $k=1.5,\ \beta =0.8$: (a)
 $E = 10^{-4}$; (b)
 $E = 5\times 10^{-4}$; (c)
 $E = 10^{-3}$; (d)
 $E = 2.5\times 10^{-3}$; (e)
 $E = 5\times 10^{-3}$; and (f)
 $E = 7.5\times 10^{-3}$. In (a,b), the HFGL line bends back as an elliptical ring so as to merge with the S branch below the CS; in (c) further increment in
 $E$ leads to collapsing of HFGL line with discrete modes wrapping near
 $c_r \approx 1$ of the CS; in (d–f), as
 $E$ is increased, both the CS move up and the elastically-modified NCMs disappear into the CS. The insets (A) and (B) in (a) show an enlarged view of the region near CS1 and the modified Y-shaped structure respectively. The insets in (d,e) shows the zoomed-in regions showing the second least-stable wall mode (WM-2) and NCM-1. The inset in (f) shows the two least-stable NCMs. Here, CS1 and CS2 denote the two continuous spectra.

Elasto-inertial spectra at  $Re = 800$,
 $k = 1.5$ and
 $\beta = 0.8$ as
 $E$ is varied in the range
 $0.009$–
 $0.1$: (a)
 $E = 0.009$; (b)
 $E = 0.01$; (c)
 $E = 0.05$; and (d)
 $E = 0.1$. For higher
 $E$, both NCM-1 and 2 merge with CS1 (a,b), and a new elasto-inertial centre mode (ECM-1) emerges above CS1 (b,c); (d) ECM-1 becomes unstable at
 $E=0.1$.

Eigenspectrum of plane Poiseuille flow for  $Re=800,\ k=1.5$: (a) UCM model for
 $E=0.1$; (b) Oldroyd-B model for
 $\beta = 0.001$,
 $E =0.1$ showing the bending of HFGL; (c) bending of HFGL with increasing
 $\beta$ illustrated for a very low value of
 $E = 0.00025$; (d) zoomed-in version of (c) showing the spectra at the higher
 $\beta$. Here: (a)
 $\beta = 0,\ E = 0.1$; (b)
 $\beta = 0.001,\ E = 0.1$; (c)
 $\beta \in (0 , 0.8),\ E = 2.5 \times 10^{-4}$; and (d)
 $\beta = 0.6, 0.8;\ E = 2.5 \times 10^{-4}$.

Figure 21 shows the spectra for a higher range of  $E$, wherein all of the NCMs have collapsed into CS1. For
 $E = 0.009$ and
 $0.01$ (figures 21(a) and 21(b)), the lone discrete mode that remains above the CS is the elastically modified TS mode. This feature differs from that of the elasto-inertial spectrum for pipe flow, wherein there is no analogue of the TS mode, and the centre modes remain the least stable, even for smallest
 $E$. However, even in the channel case, the elastically modified TS mode merges with CS1 for higher
 $E$ (the absence of the TS mode is illustrated, for example, in figure 21(c) for
 $E = 0.05$). Importantly, for
 $E \sim 0.01$, a new elasto-inertial centre mode (labelled ECM-1) with phase speed close to the maximum base-state velocity, having no Newtonian counterpart, emerges above CS1 (figure 21b). This centre mode (ECM-1) becomes unstable as
 $E$ is increased beyond
 $0.1$ (figure 21d). New elasto-inertial centre modes (labelled ECM-2, -3, and -4) also appear below CS1, but they remain stable as
 $E$ is increased.
A.2. Varying $\beta$ at fixed $E$


In figure 22, we examine the role of increasing  $\beta$ from zero (
 $\beta = 0$ being the UCM limit) on the elasto-inertial spectrum at a fixed
 $E$. The structure of the elasto-inertial spectrum in the UCM limit (figure 22a) is now well understood (Chaudhary et al. Reference Chaudhary, Garg, Shankar and Subramanian2019), comprising the HFGL class of modes (with
 $c_i = -1/(2kW)$ and
 $c_r \in [-\infty , \infty ]$) and the ballooned-up CS1 (with
 $c_i = -1/(kW)$ and
 $c_r \in [0, 1]$). In addition, at sufficiently high
 $Re$ and
 $E$, Chaudhary et al. (Reference Chaudhary, Garg, Shankar and Subramanian2019) also showed the existence of an hourglass-like structure which, however, is not prominent for the moderate
 $Re$ and
 $E$ considered in figure 22. The centre mode (ECM-1) remains stable for
 $\beta = 0$ in figure 22(a). As
 $\beta$ is increased to
 $0.001$ in figure 22(b), the HFGL modes are seen to be heavily damped even at this small
 $\beta$. Thus, for
 $E = 0.1$, the continuation of the HFGL modes are not important in determining the stability of the flow in the (experimentally relevant) dilute limit (
 $\beta \sim 0.8$ and higher). As pointed out earlier in § 3.2.1, for non-zero
 $\beta$, the HFGL line in the UCM limit bends leading to the formation of an ellipse. The formation of the ellipse-like structure is best illustrated at a lower
 $E = 2.5 \times 10^{-4}$ (figure 22c). The extent of the ellipse shrinks as
 $\beta$ is increased to
 $0.4$, leading to an enhanced stability of the HFGL modes. Thus, regardless of
 $E$, in the limit of dilute polymer solutions, the continuation of the HFGL modes are not relevant in determining the stability. Accordingly, the focus in the main text is on the least-stable centre modes. Finally, in our earlier study on viscoelastic channel flow (Chaudhary et al. Reference Chaudhary, Garg, Shankar and Subramanian2019), we showed that an increasing number of wall modes belonging to the upper bulb of the ‘hourglass’ structure (see figure 2 of Chaudhary et al. Reference Chaudhary, Garg, Shankar and Subramanian2019) become unstable in the UCM spectrum with increasing
 $Re$ and
 $E$. The effect of non-zero
 $\beta$ on these elasto-inertial wall modes, however, was found to be strongly stabilizing (Khalid et al. Reference Khalid, Chaudhary, Shankar and Subramanian2020), akin to its stabilizing effect on the continuation of the TS mode found in earlier studies (Sureshkumar & Beris Reference Sureshkumar and Beris1995b; Sadanandan & Sureshkumar Reference Sadanandan and Sureshkumar2002; Zhang et al. Reference Zhang, Lashgari, Zaki and Brandt2013). This stabilizing role of
 $\beta$ on wall modes is in direct contrast to its destabilizing effect on the elasto-inertial centre mode examined in the present study.
Appendix B. Relative stability of centre and wall modes
In the limit  $E\rightarrow 0$, as demonstrated by the spectra in figures 20 and 21 of appendix A.1, the first few least-stable modes in the viscoelastic channel spectrum are the elastically modified TS wall mode and Newtonian centre mode (NCM-1) with former being the least stable (the second wall mode becomes more stable than NCM-1 (figure 20(d) of appendix A.1) as
 $E$ is increased, and is not considered in this discussion). However, this picture of relative stability does not hold as
 $E$ is increased, a point we demonstrate with the aid of figure 6 and also briefly address in § 5 of the main text. We have further established in § 3.2 and appendix A that the unstable ECM-1 in channel flow is not merely a continuation of the least-stable Newtonian centre mode (NCM-1), on account of their differing symmetries. The unstable ECM-1 is also not related to the continuation of the TS mode owing to the disparity in the phase speeds and symmetries of these modes. Instead, the mode ECM-1 was shown to emerge out of CS1 beyond a threshold
 $E$. In the present work, we propose that it is this unstable centre mode that underlies the early transition to EIT observed in both pipe and channel flow experiments, involving polymer solutions, discussed in § 1.
In contrast, a recent DNS effort (Shekar et al. Reference Shekar, McMullen, Wang, McKeon and Graham2019) has shown a resemblance between the phase-matched, ensemble-averaged structures of polymer stretch contours that emerge in the simulations and the elastically modified TS mode. The authors carried out DNS for channel flow of a FENE-P fluid in the elasto-inertial turbulent regime ( $Re = 1500$,
 $\beta = 0.97$; the Newtonian flow is turbulent at this
 $Re$), and for
 $W$ in the range
 $0$–
 $50$, where the flow is linearly stable. With increasing
 $W$, the simulations showed a reduction in drag from the Newtonian turbulent value, eventually approaching the laminar value at
 $W \approx 10$, suggesting complete relaminarization, in agreement with observations (Choueiri et al. Reference Choueiri, Lopez and Hof2018). For
 $W$ greater than
 $20$, the simulations showed a weak increase in drag, and the authors attributed this mild increase to an instability via a two-dimensional nonlinear mechanism. In this regime, simulation results showed very strong and localized polymer stretch fluctuations similar to those in the vicinity of the ‘critical layer’ (the transverse location where the phase speed of the perturbation equals the base-flow velocity, in linear stability theory) of the elastically modified TS mode. Thus, the suggestion is that the fluctuating velocity field corresponding to the self-sustaining EIT state closely resembles the near-Newtonian velocity field of the TS (wall) mode for the small
 $E$ under consideration (
 $0 < E < 0.03$), and that drives the polymer stretch, and the resulting large axial polymeric stresses, near the critical layer.
Thus, there are two qualitatively different mechanisms being put forward for transition (to EIT) in viscoelastic channel flow, based on two different modes in the elasto-inertial spectrum: the centre mode (that has recently been shown, for a set of parameters, to continue subcritically to a novel EIT coherent structure; see Page et al. Reference Page, Dubief and Kerswell2020), and that advocated previously by Shekar et al. (Reference Shekar, McMullen, Wang, McKeon and Graham2019) based on the wall mode. A rigorous demonstration as to which mode would be dominant would require a weakly nonlinear analysis leading to the determination of the first Landau coefficient; such an analysis, for the centre mode, will be reported in a future communication. For the time being, it is useful to examine, within the linear stability framework, the decay/growth rates of centre (NCM-1 and ECM-1) and wall (TSM) modes as  $E$ is varied (at fixed
 $Re$,
 $\beta$ and
 $k$), and demarcate the
 $E$ intervals in which each of these modes is the most dominant in the elasto-inertial spectrum. Figure 23 focuses on the relative stability of TSM and NCM-1 modes as
 $E$ is varied (for the Oldroyd-B model), for
 $Re = 1500$,
 $k=0.4{\rm \pi}$ and
 $\beta =0.97$, these parameter values being identical to those used by Shekar et al. (Reference Shekar, McMullen, Wang, McKeon and Graham2019) for the FENE-P model. Recall from § 3.2 that, as
 $E$ is increased, the NCMs merge with CS1, and new modes appear from it. For
 $0 \leq E \leq 0.015$, which includes the range of
 $E$ considered by Shekar et al. (Reference Shekar, McMullen, Wang, McKeon and Graham2019), the elastically modified TS mode (i.e. TSM) is the least stable (see the inset of figure 23c). For
 $E = 0.015$, NCM-1 has already collapsed onto CS1, and as
 $E$ is increased further to
 $0.02$, TSM also disappears into CS1 (figure 23d), and concomitantly, new elasto-inertial centre modes (ECM-3 and ECM-4; ECM-2 lies very close to the CS, and hence is not visible at this scale) appear from the lower side of CS1 (see the inset of figure 23d). Although these new elasto-inertial centre modes are not unstable at this parameter range, nonetheless, these are the least-stable discrete modes at this value of
 $E$. Importantly, there are no discrete modes above the CS for
 $0.02 < E < 0.35$, and thus the CS modes are the least stable in this range. It is only at a much higher
 $E \approx 0.35$ that ECM-1 emerges above CS1. Subsequently, ECM-1 becomes unstable at
 $E \approx 0.4$, and thereby, dictates the stability for all higher
 $E$ (see the insets of figures 23(e) and 23(f)).
Eigenspectra of viscoelastic channel flow for  $Re=1500$,
 $k=0.4{\rm \pi} ,\ \beta =0.97$ and varying
 $E$: (a)
 $E = 0.002$; (b)
 $E = 0.005$; (c)
 $E = 0.015$; (d)
 $E = 0.02$; (e)
 $E = 0.35$; and (f)
 $E = 0.4$. For
 $E \le 0.015$ (or
 $W \leq 22$, similar to the regime considered by Shekar et al. Reference Shekar, McMullen, Wang, McKeon and Graham2019), the elastically modified TS mode is the least stable. For
 $0.015 < E < 0.35$, there is no discrete mode above the CS. However, for
 $E = 0.35$, ECM-1 emerges above the CS to become the least-stable mode, turning unstable at
 $E \approx 0.4$. The corresponding Newtonian eigenspectrum (
 $E = 0$) for these set of parameters is shown for comparison. In (c–f), only the region near the CS is shown to illustrate the collapse and emergence of discrete modes from the CS.

In figures 24 and 25, we investigate the relative stability of TSM and the centre modes at a lower  $Re = 500$,
 $\beta = 0.8$ and for two different
 $k =0.8{\rm \pi}$ and
 $k = 0.4{\rm \pi}$, respectively. Surprisingly, for the larger
 $k$ (figures 24(a) and 24(b)), NCM-1 is less stable than TSM (red circles) even in the Newtonian limit. Figure 24(c) shows that TSM has already collapsed into CS1, whereas NCM-1 lies just above it, in contrast to the behaviour seen in figure 23(c). As soon as both the TSM and NCM-1 merge into CS1, the new elasto-inertial centre mode (ECM-1) emerges above CS1 (figure 24c), eventually becoming unstable at higher
 $E$. The spectra at the lower
 $k = 0.4{\rm \pi}$ (figure 25) but at the same
 $Re$ and
 $\beta$ as in figure 24, however, show that the TS mode remains the least stable for
 $E < 0.02$ before merging into the CS. The ECM-1 mode emerges above the CS for
 $E > 0.02$, as the least stable in the spectrum. Note, however, that the
 $E$ intervals in which the CS modes are the least stable in figures 24 and 25 are substantially lower compared with those shown in figures 19(a) and 19(b) of the main text. This is due, respectively, to the higher
 $k$ in figure 24 and lower
 $\beta$ in figure 25 compared with the
 $k$ and
 $\beta$ values used in figures 19(a) and 19(b).
Eigenspectra for viscoelastic channel flow for  $Re=500$,
 $k=0.8{\rm \pi}$
 $(2.5)$,
 $\beta =0.97$ and varying
 $E$: (a)
 $E = 0.002$; (b)
 $E = 0.005$; (c)
 $E = 0.01$; and (d)
 $E = 0.02$. For
 $k>2$, NCM-1 is the least-stable mode even in the Newtonian limit (
 $E\rightarrow 0$). In (c,d), only the region near the CS is shown to illustrate the collapse and emergence of discrete modes from the CS.

Eigenspectra of viscoelastic channel flow at the same  $Re = 500$ and
 $\beta = 0.8$ as in figure 24 but with
 $k = 0.4{\rm \pi}$, and varying
 $E$: (a)
 $E = 0.002$; (b)
 $E = 0.006$; (c)
 $E = 0.01$; (d)
 $E = 0.012$; (e)
 $E = 0.018$; and (f)
 $E = 0.02$. For
 $E < 0.02$, the elastically modified TS mode is the least stable, whereas ECM-1 just emerges from CS1. However, for
 $E >0.02$, the TS mode merges with CS1 and ECM-1 becomes the least-stable mode dictating the stability of the system. The corresponding Newtonian eigenspectrum (with
 $E = 0$) is also shown for reference. In (c–f), only the region near the CS is magnified to illustrate the collapse and emergence of discrete modes from the CS.

Thus, at sufficiently high  $E$, the centre mode ECM-1 is always the least-stable/unstable mode in the elasto-inertial spectrum, but even for smaller
 $E$ (where ECM-1 has not yet emerged from the CS), one could have the original Newtonian centre mode (NCM-1) to be less stable than the wall mode (TSM), depending on
 $k$. In light of this, the relative stability of the wall (TS) and centre (NCM) modes in Newtonian channel flow at different
 $k$, for
 $Re = 1500$, is shown in figure 26. This demonstrates the change in the relative stability of the TS-mode and NCM-1 with increasing
 $k$, the latter being the least-stable mode
 $k\geq 2$. An important inference from figures 23–26 is that, even in parameter regimes where channel flow is linearly stable, there are intervals where the centre mode (ECM-1 or NCM-1) or the CS is the least stable, and are likely to influence the (subcritical) nonlinear dynamics of the transition. Indeed, in figure 23 alone, there is a significant range of
 $E$ for which there is no discrete mode above the CS, a fact that might be attributed to the near-unity
 $\beta$ (
 ${=}0.97$) considered. Thus, the connection between the least-stable wall (TSM) mode in Newtonian channel flow and the (two-dimensional) elasto-inertial turbulent structures noted by Shekar et al. (Reference Shekar, McMullen, Wang, McKeon and Graham2019) may not be generic in the
 $Re$–
 $E$–
 $\beta$ space.
Relative stability of centre (NCM-1) and least-stable wall (TS) modes in Newtonian channel flow at  $Re=1500$: variation of
 $c_i$ for these modes with
 $k$. The wall mode is the least stable for
 $k < 2$, whereas the centre mode becomes least stable for
 $k \ge 2$.

Finally, the contours corresponding to the velocity ( $\hat {v}_x(x,z), \hat {v}_z(x,z)$) and stream-wise component of the polymeric stress (
 $\hat {\tau }_{xx}(x,z)$) eigenfunctions of the TS and NCM-1 modes are shown in figures 27(a) and 27(b). Although both these modes are antisymmetric about the channel centreline, the structures of the TS mode are confined near the wall, with the NCM-1 structures displaying the maximum variation away from the walls; in both cases, the confinement is prominent in the tangential velocity and stream-wise polymer stress eigenfunctions. For the small
 $E$ considered, the velocity contours are quite reminiscent of their Newtonian counterparts (not shown). For the higher
 $E = 0.12$, the elasto-inertial centre mode has become unstable, and the two-dimensional contour plots of
 $\hat {v}_x(x,z), \hat {v}_z(x,z)$ and
 $\hat {\tau }_{xx}(x,z)$ corresponding to this mode are shown in figure 28. In contrast to the TS mode, the ECM-1 is a symmetric mode; further, the confinement, in the neighbourhood of the centreline, of ECM-1 is less pronounced compared with the near-wall confinement of the TSM, and the near-centre confinement of the NCM-1. As indicated in § 5, the proposal of the centre mode underlying EIT dynamics seems to have support from the recent finding of a novel EIT structure (Page et al. Reference Page, Dubief and Kerswell2020) that bifurcates subcritically from the centre-mode instability, and has the same symmetry about the channel centreline.
Contours of the  $v_x$,
 $v_z$ and
 $T_{xx}$ eigenfunctions for (a) wall (TS),
 $c = 0.484998 -0.10376\textrm {i}$, and (b) centre (NCM-1),
 $c =0.894151 -0.0865\textrm {i}$, modes in the
 $x$–
 $z$ plane for
 $Re=500, \beta =0.8,\ k=0.8{\rm \pi}$ and
 $E=0.002$.

Contours of  $v_x$,
 $v_z$ and
 $T_{xx}$ for unstable (symmetric) centre mode in the
 $x$–
 $z$ plane for
 $Re =500$,
 $\beta = 0.8$,
 $k=0.8{\rm \pi}$ and
 $E=0.12$. The unstable eigenvalue is
 $c = 0.9995 + 2.3197 \times 10^{-4} \textrm {i}$.