INTRODUCTION
Crop genotypes normally respond differently to variations in environmental conditions. These differential environmental responses of genotypes, or genotype×environment (G×E) interactions, complicate the effective identification of superior genotypes, as performance ranking of the test genotypes may change for different environments (Kang Reference Kang and Kang1990; Cooper & Delacy Reference Cooper and Delacy1994). Generally, G×E interactions are considered a hindrance to crop improvement in a target region (Kang Reference Kang1998), but they can be viewed as a reflection of the differences in genotype adaptation, which may be exploited by selection and/or by adjustments in the testing strategy (Basford et al. Reference Basford, Williams, Cullis, Gilmour, Cooper and Hammer1996). It has been stated that some understanding of the nature of the G×E interactions is needed to be able to use them effectively through appropriate breeding methodologies (Basford & Cooper Reference Basford and Cooper1998).
The general existence of G×E interactions has led breeders to evaluate crop breeding lines across a range of environments so that their responses to different environmental factors could be assessed. However, performance evaluation has almost entirely been based on final crop yield. Physiological traits are not commonly considered in the evaluation and selection of crop breeding lines. Wallace et al. (Reference Wallace, Baudoin, Beaver, Coyne, Halseth, Masaya, Munger, Myers, Silbernagel, Yourstone and Zobel1993) argued that selection approaches based exclusively on final yield without considering biomass production are inefficient. Others have suggested selection for physiological traits that correlate well with yield to supplement yield per se in selection (Jackson et al. Reference Jackson, Robertson, Cooper and Hammer1996; Boote et al. Reference Boote, Kropff and Bindraban2001; Abeledo et al. Reference Abeledo, Calderini and Slafer2003). Physiological traits, such as crop growth rate (CGR), pod growth rate (PGR), partitioning coefficient (PC) and pod filling duration have been shown to account for variations in seed yields between chickpea (Cicer arietinum) lines grown under different environmental conditions (Williams & Saxena Reference Williams and Saxena1991; Krishnamurthy et al. Reference Krishnamurthy, Johanson and Sethi1999). In peanut, Banterng et al. (Reference Banterng, Patanothai, Pannangpetch, Jogloy and Hoogenboom2003) also found that CGR, PGR, PC and pod filling duration were important physiological determinants for pod yield, indicating the possibility of using these traits as additional criteria for evaluation of peanut breeding lines.
Effective utilization of physiological traits for breeding line evaluation, however, requires a good understanding of the nature and magnitude of their G×E interactions. In peanut, this information is lacking. Growth analysis of peanut breeding lines conducted during different growing seasons can provide information on the environmental responses and the G×E interactions for physiological traits, leading to a better understanding of the physiological basis for the differential responses to environments between genotypes. Kang (Reference Kang and Kang2002) pointed out that periodical measurement of plant growth and environmental variables throughout the growing season would help determine what effect, if any, the environmental variables from an earlier period had on G×E interactions at intermediate stages and on final yield, providing a better understanding of the dynamic process of yield formation. Wright et al. (Reference Wright, Nageswara Rao, Basu, Cooper and Hammer1996) advocated that a better knowledge of the physiological basis for the differential response to environments between genotypes should improve the characterization of the genotypes under selection and help the identification of superior genotypes. Such information could also be used to develop additional selection criteria and to determine appropriate breeding strategies. The overall goal of the present study was to gain a better understanding of the physiological basis for the differential environmental responses between peanut genotypes. The specific objective was to determine the effects of seasons and genotype×season (G×S) interactions for physiological traits concerning growth and development of peanut.
MATERIALS AND METHODS
Field experiment
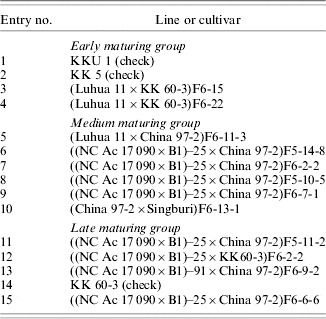
Fifteen peanut lines representing three maturity groups were used in the present study. Four were early maturing lines, six were medium maturing lines and five were late maturing lines (Table 1). They were selected from two preliminary yield trials conducted under the auspices of the peanut breeding programme of Khon Kaen University, Thailand to provide a range of yield levels and seed types apart from maturity durations. The lines were grown in field experiments that were conducted during four seasons, i.e. 2002 rainy season, 2003 dry season, 2003 rainy season, and 2004 dry season, at the Field Crops Research Station of Khon Kaen University, located in the province of Khon Kaen in Northeast Thailand (16°28′ N, 102°48′ E). A randomized complete block design with four replications was used. Each plot consisted of 12 rows, 7 m long, with a spacing of 0·5 m between rows and 0·2 m between plants, giving a plant population of 10 plants/m2. The planting dates were: 8 June 2002 for the 2002 rainy season trial, 14 December 2002 for the 2003 dry season trial, 5 May 2003 for the 2003 rainy season trial and 18 December 2003 for the 2004 dry season trial.
Peanut lines and cultivars used in the study

The experiments were managed to avoid drought, nutrient and other stresses as much as possible. Land preparation followed the normal procedure for yield trials of peanut lines, i.e. one disc ploughing followed by two to three passes with a disc harrow. Lime was applied at a rate of 625 kg/ha prior to planting. Seeds were treated with iprodione [3-(3,5-dichlorophenyl)-N-(1-methylethyl)2,4-dioxo-1-imidazoline-carboxamide 50% wettable powder (WP)] at a rate of 5 g/kg seed prior to sowing. Three seeds were planted together and 7 days after emergence the seedlings were thinned to one plant per location (hill). Fertilizer was applied at flowering at a rate of 23·4 kg N/ha, 10·2 kg P/ha and 19·4 kg K/ha. Gypsum (CaSO4) was applied at the pegging stage (Boote Reference Boote1982) at a rate of 313 kg/ha. Weeds were controlled by an application of alachlor (2-chloro-2′, 6′;-diethly-N-(methoxymethyl) acetanilide 48% W/V emulsifiable concentrate) at a rate of 3·75 l/ha at planting and hand weeding during the remainder of the season. Pests and diseases were controlled by weekly applications of monocrotophos [dimethyl (E)-1-methyl-2-(methylcarbamoyl) vinyl phosphate 60% w/v water soluble concentrate] at 2·5 l/ha, methomyl [S-methyl-N-((methylcarbamoyl)oxy) thioacetimidate 40% soluble powder] at 1·0 kg/ha, and benomyl [methyl-1-(butylcarbamoyl)-2-benzimidazole-2-ylcabamate 50% WP] at 1·68 kg/ha. Carbofuran (2,3-dihydio-2,2-dimethylbenzofuran-7-ylmethylcarbamate 3% granular) at a rate of 31·3 kg/ha was also applied during the early pod forming stage. The plots received supplementary irrigation during the dry periods of the rainy season and full irrigation at weekly intervals in the dry season with an overhead sprinkler system.
For each growing season, data were collected on plant development and growth traits. For crop development, vegetative and reproductive growth stages were determined using the system developed by Boote (Reference Boote1982). The development stages observed included emergence (VE), four nodes on the main stem with unifoliated leaves (V4), first flowering (R1), first peg (R2), first pod (R3), fully expanded pod (R4), first seed (R5), full seed (R6), physiological maturity (R7) and harvest maturity (R8; 0·7–0·8 mature pods). Each stage was defined to have occurred if at least half of the plants in a plot had reached that stage. The dates of VE to R2 stages were observed daily by inspecting all plants in each plot. After R2, four neighbouring plants in each plot were pulled for inspection every 3 days to determine if two or more plants had reached the specified developmental stage. For comparative analysis, the crop duration (from planting to R8) was divided into three periods, i.e. from planting to R1 (vegetative development), from R1 to R5 (pod formation) and from R5 to R8 (seed filling and maturity or, in short, seed filling). Data on daily maximum and minimum temperature (°C), solar radiation (MJ/m2/d) and rainfall (mm) recorded at the research station for these periods were also obtained.
Plant samplings for growth analysis were conducted at V4, R4, R6, R7 and R8 for the 2002 rainy and the 2003 dry seasons and every 15 days from planting to final harvest for the 2003 rainy and the 2004 dry seasons. For each sampling, five consecutive and bordered plants were harvested from each plot. The individual samples were separated into leaves, stems, pods with seeds, pods without seed and seeds. A sub-sample of 60 leaflets was measured with a leaf area meter (Hayashi DenKoh AAC-400, Tokyo, Japan) to determine the leaf area. The samples were oven-dried at 80°C for 48 h and weighed to determine dry matter. The leaf area index (LAI) and specific leaf area (SLA) were calculated from the dry weights of the leaf sub-samples. The dry weight of 100 seeds was also measured to determine individual seed weight.
The biomass data were used to determine the CGR, PGR and PC of the individual peanut lines. CGR was calculated as an average rate for the entire season by dividing the total biomass with crop duration. Similarly, PGR was calculated as an average rate for the entire pod development period (R3 to R8) by subtracting pod yield at R3 from pod yield at R8 and dividing by the duration from R3 to R8. In estimating PC, pod and total biomass were adjusted to account for energy cost for synthesis of kernels with high protein and oil by multiplying pod biomass by 1·65 once kernel development had been initiated. After adjustment, PC was then estimated as the ratio of the adjusted PGR to the adjusted CGR for the entire pod development period (Duncan et al. Reference Duncan, McCloud, McGraw and Boote1978; Bell et al. Reference Bell, Wright and Harch1993; Ntare et al. Reference Ntare, Williams and Ndunguru1998). Pod harvest index (HI) was calculated from pod yield divided by total biomass.
Statistical analysis
Comparisons were made between the seasonal responses for the development and growth traits of the test peanut lines. For statistical analysis of each character, a combined analysis of variance over all seasons was first conducted in a conventional manner, with genotype being a fixed factor and season, a combination of season and year, being a random factor (Gomez & Gomez Reference Gomez and Gomez1984). The sum of squares attributed to genotypes was partitioned into orthogonal comparisons between maturity groups and between genotypes within each group. The G×S interaction sum of squares was also partitioned into the interactions of individual comparisons with seasons. The error variances associated with individual comparisons were tested for homogeneity by Bartlett's test (Gomez & Gomez Reference Gomez and Gomez1984). The test indicated homogeneity of these variances. Therefore, the pooled error was used in testing for significance of the different G×S interactions. The between genotype groups and between genotypes within group comparisons were tested for significance by the F ratio using the pooled G×S mean square as the denominator.
Multiple regression analysis was used to examine the relationships between changes across seasons in important physiological traits and the corresponding changes across seasons in pod yield. Initially, changes in pod yield were modelled using a full model that included PGR, PC, HI, seed filling duration, pod number/plant, seed weight, CGR, LAI and SLA as dependent variables. This model was used to determine the relative importance of each fitted variable. A reduced model was then obtained by omitting variables that did not make a statistically significant contribution and was sequentially fitted starting with the most important variable. The proportion of the regression sum of squares to the total sum of squares was calculated for each fitted variable to indicate its importance for the determination of change in pod yield.
A similar multiple regression analysis was also done to determine the relationships between the G×S interaction for pod yield with the G×S interactions for related physiological traits. The G×S interaction for each trait was estimated using the following equation:

where (GS)ij=the G×S interaction associated with genotype i and season j, Ῡij.=mean over replications of genotype i in season j, Ῡi..=mean over replications and seasons of genotype i, Ῡ.j.=mean over replications and genotypes of season j, and Ῡ…=grand mean.
The initial full model fitted included the G×S estimates of PGR, HI, PC, pod number per plant, seed filling duration and biomass as dependent variables. A sequential fit was then performed on reduced model by fitting the most important variable first and omitting the variables that did not make a statistically significant contribution. The proportion of regression sum of squares to total sum of squares was also calculated for each variable.
RESULTS
Weather conditions
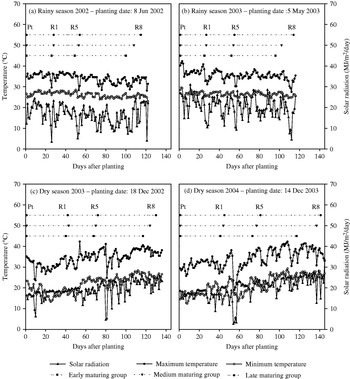
Daily temperatures and solar radiation for the cropping period of the two rainy seasons were similar, as were those for the two dry seasons (Fig. 1). However, both daily temperature and solar radiation for the dry seasons were considerably lower than those for the rainy seasons for the period from planting to first flowering (vegetative growth phase), but were higher for the period from first seed to maturity (seed filling duration). The rainfall data are not shown since the peanut crop was irrigated during both the rainy and the dry seasons However, in the dry season of 2004, there was a heavy rain (50 mm) on 4 February (53 days after planting) resulting from a cold wave from China, causing a drastic drop in temperature for the following 3 days. During this period, the maximum temperature dropped from 35·4 to 19°C and the minimum temperature dropped from 23·3 to 16·6°C and decreased further 2 days later to 13·6°C (Fig. 1d).
Daily maximum and minimum temperature and solar radiation for the 2002 rainy season (a), the 2003 rainy season (b), the 2003 dry season (c) and the 2004 dry season (d), (Pt=planting, R1=first flowering, R5=first seed and R8=harvest maturity).

Seasonal effects
Development traits
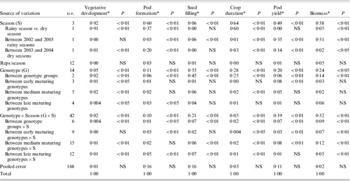
The combined analyses of variances indicated significant effects of seasonal environments on all stages of phenological development of the test peanut lines (Table 2). The seasonal effects accounted for 0·64, 0·92 and 0·60 of the total variation for the entire crop duration, the vegetative development duration and the pod forming duration, respectively, and were almost entirely from the difference between means of the rainy and the dry seasons. However, the seasonal effects for the seed filling duration were rather small, contributing to only 0·06 of its total variation.
Contribution of individual sources of variation for the combined analysis of variance for four seasons for the main development and yield traits

* Proportion of sum of squares to total sum of squares.
NS=not significant.
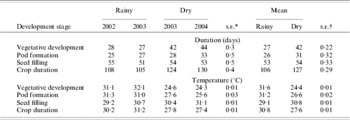
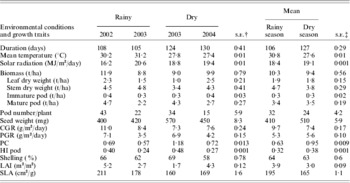
The mean crop duration for all peanut lines grown during the dry season was 21 days longer than during the rainy season (Table 3). The main cause was a substantially longer duration of vegetative development (15 days) and a slightly longer duration of pod formation (5 days) in the dry season. This could be accounted for by lower temperatures during these periods in the dry season. In the present study, the mean temperature for the dry season was 7·2°C lower than for the rainy season during the vegetative development period and 4·6°C lower during the pod forming period. The crop durations for the 2002 and 2003 rainy seasons were almost the same, while the crop duration for the 2004 dry season was 6 days longer than for the 2003 dry season because of a longer pod forming duration. This could also be explained by the lower temperatures during the pod forming period for the 2004 dry season (Table 3).
Means over all entries for the duration of the individual development periods for four seasons and the corresponding value for the mean daily temperature

* Standard error of the means for individual seasons (d.f.=12).
† Standard error of the means over the two rainy seasons and over the two dry seasons (d.f.=12).
Yield and growth traits
Seasonal effects for pod yield were highly significant and substantial, accounting for 0·49 of the total variation (Table 2). The differences, however, were mainly between the two rainy seasons and between the two dry seasons. The means for pod yield over all genotypes were high for the 2002 rainy and the 2003 dry seasons, i.e. 4·7 and 4·3 t/ha, respectively, but were rather low for the 2003 rainy and the 2004 dry seasons, i.e. 2·2 and 2·7 t/ha, respectively (Table 4). As a result, the difference between mean yields for the rainy season and the dry season was not significant. Apparently, high or low pod yield was not associated with either the rainy or the dry season in the present study. The differences in final biomass between seasons were less pronounced, accounting for 0·38 of the total variation, and were mainly between the two rainy seasons (Table 2). The biomass means for the 2002 and 2003 rainy seasons differed considerably, being 11·9 and 8·8 t/ha, respectively, while those for the 2003 and 2004 dry seasons were not much different, being 9·0 and 9·9 t/ha, respectively (Table 4). These amounts did not correspond with those of pod yield with respect to their relative performances for the four seasons.
Mean growth trait for all genotypes for each individual season at harvest maturity (R8)Footnote *

* Harvest maturity defined as 2/3 to 3/4 of plants in which all developed pods have testa or pericarp coloration (R8).
† Standard error of the peanut line means by seasons (d.f.=12).
‡ Standard error of the peanut line means over the two rainy and the two dry seasons (d.f.=12).
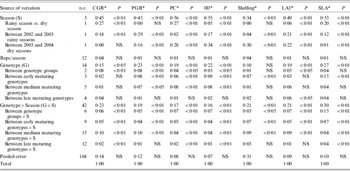
Highly significant seasonal effects (P<0·01) were also observed for all growth parameters that were measured and they accounted for the greatest share of their respective total variations in all the traits (Table 5). The contributions of the seasonal effects to total variations were >0·50 for PC and HI, >0·40 for CGR, PGR and LAI and >0·30 for shelling percentage and SLA.
Contribution of the individual sources of variation for the combined analysis of variance for four seasons for crop growth rate (CGR), pod growth rate (PGR), partitioning coefficient (PC), harvest index (HI), leaf area index (LAI) and specific leaf area (SLA)

* Proportion of sum of squares to total sum of squares.
NS, not significant.
The CGR for the rainy season was higher than for the dry season because of a slightly higher biomass production and shorter crop duration for the rainy season (Table 4). However, a considerable difference in CGR was also observed between the two rainy seasons in which biomass production differed significantly. The seasonal differences in SLA followed the same trend as biomass and CGR. Stem dry weights were high and about the same for three seasons, i.e. 4·5, 4·8 and 4·3 t/ha for the 2002 rainy, 2003 rainy and 2004 dry seasons, respectively, for which the latter two had low pod yields. Stem weight would be a good indicator for overall crop growth, thus, low pod yields in the 2003 rainy and 2004 dry season could not be accounted for by poor crop growth.
The seasonal differences in PGR, HI and number of pod per plant followed the same pattern as for pod yield. The PC values, however, did not follow this trend, and was higher for the 2003 dry season than for the other three seasons. For the 2003 rainy and 2004 dry seasons in which pod yields were low, PGR, HI and the number of pods per plant were much lower than those for the high yielding seasons (Table 4). The low pod yields for the 2003 rainy and 2004 dry seasons could, thus, be accounted for by the low values for these attributes.
Seasonal differences in LAI showed the same pattern as leaf weight, being low for the 2003 rainy and the 2003 dry seasons and high for the 2002 rainy and the 2004 dry seasons. The low leaf weights in these two seasons were because of defoliation due to late leaf spot (Phaeoisariopsis personata (Berk. & Curt.) V. Arx.), despite regular spraying of the crop with fungicides. However, pod yield was low for the 2003 rainy season only and was high for the 2003 dry season. In the 2003 rainy season, rainfalls were more frequent and the disease developed early, resulting in leaf losses starting as early as 80 days after planting. The data obtained from growth analysis also confirmed these observations (data not shown). The low pod yield for this season, therefore, could be accounted for by early infection of leaf spot disease. In contrast, late leaf spot came late in the 2003 dry season, and defoliation occurred when the plants were nearly mature. Therefore, pod yield was not affected.
For the 2004 dry season, which was another low yielding season, crop growth was good and no leaf loss occurred due to infection of diseases. However, at the time of flowering, there was a wave of cold weather that caused a drastic drop in temperatures from 35·4 to 19°C for maximum temperature and from 23·3 to 13·6°C for minimum temperature for 2 days. The low pod yield for this season might have been due to the cold temperature at the time of flowering.
Genotypic effects
The peanut genotypes differed significantly for all stages of phenological development. For crop duration, the genotypic differences were largely between the genotype maturity groups, with small differences between the medium maturing lines and no significant difference between lines within the early and the late maturing groups (Table 2). The means over four seasons for crop duration of the early, medium and late maturing lines were 107, 117 and 125 days, respectively (data not shown). For the individual periods of crop development, the differences between the peanut lines were rather small for the durations of vegetative development and pod formation but were quite substantial for seed filling duration, accounting for 0·05, 0·11 and 0·55 of their total variations, respectively. Most of these variations were between maturity groups of peanut lines (Table 2).
Significant differences between genotypes were also found for pod yield and biomass, with genotypic variations accounting for 0·20 and 0·24 of their total variations, respectively (Table 2). The major proportions of genotypic variations for these two traits were from the differences between the maturity groups. Differences between lines within each maturity group were significant only for pod yield between the early maturing lines, which ranged from 2·3 to 4·3 t/ha compared to 3·3 to 4·5 t/ha and 2·9 to 3·6 t/ha for the medium and the late maturing lines, respectively (data not shown).
For physiological traits, genotypic differences were significant for CGR, PGR, PC, HI, LAI and SLA, accounting for 0·15, 0·23, 0·19, 0·22, 0·19 and 0·27 of the total variation, respectively (Table 5). No significant difference between genotypes was observed for shelling proportion. There were differences between genotype groups for CGR, PGR, PC, HI and LAI, but not for SLA. The early maturing lines differed significantly for all these traits except CGR and LAI, while the medium maturing lines showed significant differences for PGR, PC and HI and the late maturing lines only differed for LAI.
Genotype by season interactions
Development traits
Significant G×S interactions were observed for all development traits (Table 2). However, variations due to G×S interactions were rather small for crop, vegetative development and pod forming durations, accounting for only 0·05, 0·02 and 0·10 of their total variation, respectively. Only the G×S interaction for the seed filling duration was considerable, contributing 0·21 of its total variation, corresponding to a relatively high variation among genotypes for this trait. The G×S interaction for seed filling duration came from differential responses to seasons among genotype groups as well as among genotypes within the medium and the late maturing groups.
Yield and growth traits
Considerable variations due to G×S interactions were observed for pod yield and biomass, accounting for 0·19 and 0·32 of the total variations, respectively. The contributions to G×S interactions for these two traits were from the differential responses to seasons between genotype groups as well as between genotypes within the individual maturity groups, except between genotypes within the late maturing group for pod yield (Table 2). The differential response to seasons of the test genotypes was also found for all the growth traits that were measured, i.e. CGR, PGR, PC, HI, shelling proportion, LAI and SLA, as indicated by their significant G×S interactions (P<0·01). The variations due to G×S interactions for these traits ranged from 0·16 to 0·30 of their respective total variations (Table 5). For all these traits, significant differential responses to seasons were shown between the genotype groups as well as between the genotypes within each maturity group, with the exception of the late maturing lines for PGR and LAI.
The patterns of seasonal responses of the genotypes for pod yield, PGR, PC and HI were similar, both between the maturity groups and between the genotypes within them. Similarly, the patterns of seasonal responses of the maturity groups and of the genotypes within each group for biomass, CGR, leaf dry weight and LAI were also similar (data not shown).
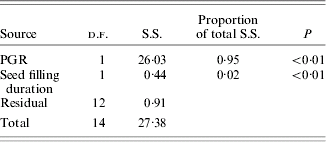
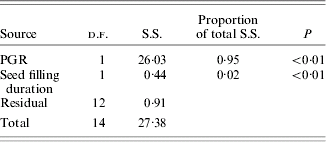
To identify the physiological traits that determined the G×S interaction for pod yield, regression analysis was first done for the changes in pod yield of the individual genotypes across the 2003 and 2004 dry seasons on the corresponding changes in related physiological traits. These two seasons were selected because they gave contrasting yield levels. The 2003 dry season was a season with high pod yield, while the 2004 dry season was a low yielding season presumably because of low temperature at flowering. The initial fitting of the full model identified PGR and seed filling duration as the only two significant variables, while PC, HI, pod number/plant, seed weight, CGR, LAI and SLA were not statistically significant. Results of the sequential fitted for the reduced model indicated that PGR was the dominant physiological trait determining the change in pod yield across the two seasons, accounting for 0·95 of the total variation, while the contribution of the change in seed filling duration was rather small, i.e. 0·02 of the total sum of squares (Table 6).
Sequential regression for changes across the 2003 and 2004 dry seasons for pod yield on the corresponding changes in related physiological traits
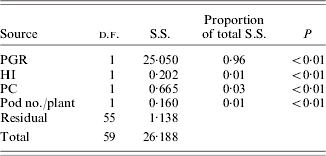
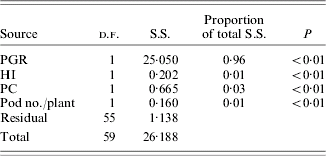
The regression analysis of the estimates of the G×S interaction for pod yield against the estimates of the G×S interactions for PGR, PC, HI, pod number per plant and biomass indicated significant contributions of the G×S interactions for all these traits except seed filling duration and biomass. The G×S interaction for PGR was most important followed by those for PC, HI and pod number per plant, respectively (data not shown). The sequential fit of these significant interactions in order of their importance showed that the G×S interaction for PGR accounted for 0·96 of the G×S interaction for pod yield, while the contributions of the G×S interactions for PC, HI and pod number per plants were very small, being 0·01, 0·03 and 0·01 of the G×S interaction for pod yield, respectively (Table 7). These results clearly indicated that PGR is the dominant physiological trait determining the G×S interaction for pod yield of peanut.
Sequential regression of G×S interaction for pod yield on G×S interactions for related physiological traits
DISCUSSION
The peanut lines used in the present study were selected from breeding lines under testing in various trials by the peanut breeding programme of Khon Kaen University in Thailand. They were intentionally selected to provide a range in maturity duration, seed type and yield performance that would represent the diversity of breeding lines under evaluation at the time. It was anticipated that these genotypes would capture the seasonal effects and the differential responses to seasons for physiological traits normally encountered between peanut breeding lines. The results showed that although these lines were not so diverse in parental background, they did provide a reasonable range of genotypic differences as they differed significantly in pod and biomass yields and in all the development and almost all the growth traits measured.
Seasonal effects on phenological development of the peanut lines were shown in substantially longer crop duration (21 days) during the dry season than during the rainy season, due to a considerable longer duration of vegetative development and a slightly longer pod forming duration. These periods coincided with the period of cool temperatures during the dry season. It is well-known that temperature is the major factor that determines phenological development of peanut (Cox Reference Cox1979; Ketring & Wheless Reference Ketring and Wheless1989; Bell et al. Reference Bell, Shorter and Mayer1991). The optimum temperature for development of peanut ranged between 25 and 30°C (Ntare et al. Reference Ntare, Williams and Ndunguru1998; Vara Prasad et al. Reference Vara Prasad, Craufurd and Summerfield2000), and a reduction in the rate of phenological development from planting to flowering had been reported when the mean air temperature was lower than 30°C (Bell et al. Reference Bell, Shorter and Mayer1991). The longer durations of vegetative development and pod forming periods in the dry season, thus, could have been caused by the lower temperatures during these periods. The same result was observed by Banterng et al. (Reference Banterng, Patanothai, Pannangpetch, Jogloy and Hoogenboom2003), who reported that cool temperatures during the dry season caused a delay in flowering of peanut lines and extended the period of vegetative growth, resulting in longer crop duration.
Seasonal effects for pod yields were shown in two high yielding seasons (the 2002 rainy and the 2003 dry seasons) against two low yielding seasons (the 2003 rainy and the 2004 dry seasons). Heavy defoliations due to late leaf spot, however, were observed for the 2003 rainy and the 2003 dry season. Leaf defoliation due to late leaf spot disease has been shown to reduce the growth rate of peanut, resulting in a decline in crop yield (Nutter & Littrell Reference Nutter and Littrell1996). Yield losses of more than 50% have been observed, particularly when the disease developed early during the growing season (McDonald et al. Reference McDonald, Subramanyam, Gibbons and Smith1985; Subrahmanyam et al. Reference Subrahmanyam, Moss, McDonald, Rao and Rao1985). In the present study, the low pod yield for the 2003 rainy season could be accounted for by late leaf spot disease, as rainfalls were more frequent and the disease developed early, resulting in an early leaf loss. In the 2003 dry season, however, the disease came late and defoliation occurred when the plants were nearly mature. Therefore, pod yield was not affected.
The crop in the 2004 dry season was not affected by the leaf spot disease, yet crop yields were low. However, during the time of crop flowering, there was a drastic drop in temperatures down to 13·6°C for 2 days. It has been found that a low temperature during flowering could cause a severe damage to peanut flowers, resulting in poor pod setting (Campbell Reference Campbell1980). Thus, low crop yield in the 2004 dry season could be due to cold temperature at the time of flowering. In this season, biomass was as high as that of the 2003 dry season in which pod yield was high, i.e. 9·9 t/ha compared to 9·0 t/ha for the 2003 dry season. Thus, biomass was not a good indicator for pod yield, and biomass evaluation would not have helped in the selection of peanut breeding lines. This is somewhat contradicted to the suggestion of Wallace et al. (Reference Wallace, Baudoin, Beaver, Coyne, Halseth, Masaya, Munger, Myers, Silbernagel, Yourstone and Zobel1993) to consider biomass production in breeding lines evaluation.
Differential responses to seasons were shown between the tested genotypes for pod and biomass yields and all the growth traits that were measured, i.e. CGR, PGR, PC, HI, Shelling, LAI and SLA. Regression analysis for the change in pod yield across two seasons with contrasting yield levels, i.e. the dry seasons of 2003 and 2004, on the corresponding changes in related physiological traits identified PGR as the dominant physiological traits determining the change in pod yield across the two seasons. The regression analysis of the G×S interaction for pod yield against the G×S interactions for related physiological traits also indicated PGR as the dominant trait determining the G×S interaction for pod yield. Although seed filling duration was found to be the development trait that showed the greatest G×S interaction, it only played a very minor role in determining the G×S interaction for pod yield. Biomass production also did not have any influence on the G×S interaction for pod yield, both across the two contrasting seasons and across all four seasons, confirming the earlier observation that biomass was not a good indicator for pod yield.
The regression analysis for the change in pod yield across the 2003 and 2004 dry seasons involved differential responses to temperatures of the test peanut lines, as cool temperature at flowering was thought to be the main factor causing the difference in pod yield between these two seasons. However, the regression analysis of the G×S interaction for pod yield utilized data from all four seasons, one of which showed low pod yield because of late leaf spot disease. The G×S interaction for pod yield over these four seasons, therefore, involved differential responses of the peanut lines not only to climatic factors but also to disease epidemic. Yet, both regression analyses identified PGR as the dominant factor accounting for the change or the G×S interaction for pod yield. These results, thus, indicated that PGR was the dominant physiological trait determining the G×S interaction for pod yield regardless of the factors involved in seasonal differences.
Including PGR as a secondary trait in selection for high pod yield would not give any advantage if it is done in a conventional manner, as pod yield has to be obtained to determine PGR. Furthermore, the magnitude of G×E interaction for PGR is also as high as that for pod yield, thus, multi-environment trials are required in the evaluation of breeding lines for this trait, the same as yield evaluation. However, the genetic control for PGR is expected to be much less complex than the genetic control for pod yield. This offers an opportunity for utilizing molecular tools in selection for this trait. Marker assisted selection would be of much advantage in overcoming the effect of G×E interaction, making selection more efficient. This approach should be further explored. Research, thus, should be done to identify QTLs and molecular markers associated with this trait so that marker assisted selection could be employed.
The conclusions of the present study were that seasonal effects greatly influenced all development and growth traits of the 15 tested peanut lines. Differential responses to seasons were also observed for almost all of these traits, both between genotype groups and between genotypes within the individual maturity groups, though G×S interactions were much smaller than season effect. Seed filling duration was the phenological trait that had the greatest G×S interaction and accounted for the significant G×S interaction that was found for crop duration. The peanut lines used differed considerably in pod and biomass yields and in all the growth traits that were measured. All yield and growth traits also showed significant G×S interactions, but the patterns of seasonal responses of the genotypes were somewhat different for the different traits. The patterns of G×S interactions for pod yield, PGR, HI and PC were similar, so were the patterns of G×S interactions for biomass, CGR, leaf dry weight and LAI. Regression analyses of the change in pod yield across two contrasting seasons and of the G×S interaction for pod yield across four seasons identified PGR as the dominant factor determining the G×S interaction for pod yield. Exploring marker assisted selection for this trait is suggested.
Financial support for this study was provided by the Thailand Research Fund through the Royal Golden Jubilee Ph.D. Program (Grant No. PHD/0109/2544) and the Senior Research Scholar Project of Professor Dr Aran Patanothai. Assistance was also received from the Peanut Project, Department of Plant Science and Agricultural Resources, Faculty of Agriculture, Khon Kaen University, Khon Kaen, Thailand. Thanks are extended to Professor Dr Kenneth J. Boote for his valuable comments and suggestions during the preparation of the manuscript.