

‘The truth is under attack’, I wrote earlier this decade (Levine, Reference Levine2012). As the replication crisis became apparent, the alarm was timely. But now, a counter-attack is raging. In its arsenal are replications, open data, shared instruments, pre-registration of hypotheses and now – data visualizations.
‘You can observe a lot by watching’, reflected Yogi Berra, and scientists knew that all along (or at least, should have known). More than 40 years ago, writing in The American Statistician, F. J. Anscombe (Reference Anscombe1973) warned us that numbers are not substitutes for figures. ‘Graphs are essential to good statistical analysis’, he concluded, because graphs validate the assumptions underlying the analysis.
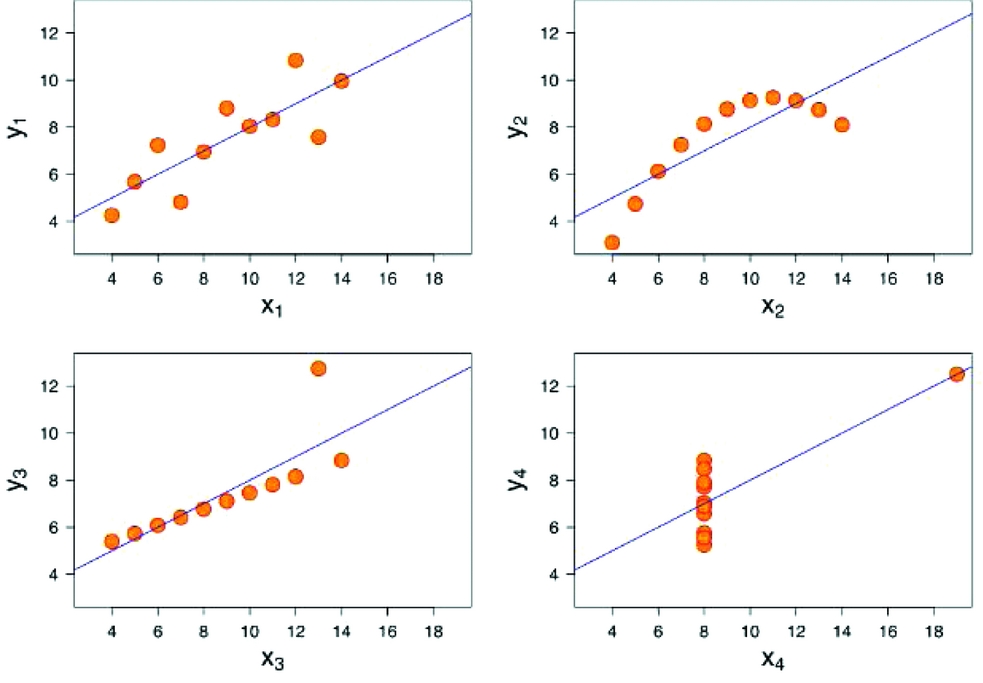
Quite naturally, Anscombe illustrated theory with a graph. He devised four data sets. To most regression methods, they would appear identical: the same means for X's and Y's, same standard deviations, same correlations, same measures of explained variance (R2), and same regression line (3+0.5x).
Limit yourself to regression, and the data are ostensibly identical. Add a graph, and their vast differences become apparent (Figure 1). One is exactly what you'd imagine from the regression line, but the three others tell a radically different story, empirically and hence theoretically. But without a graph, you would never know that.
Anscombe's (Reference Anscombe1973) quartet. The four datasets are visibly different but possess identical summary statistics.

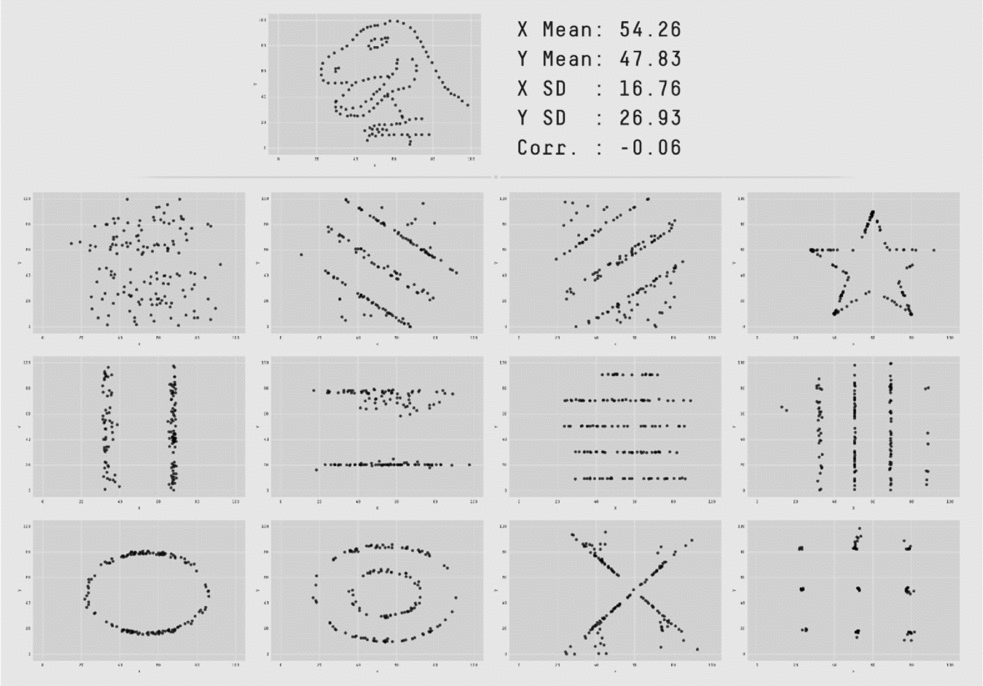
The Anscombe Four have recently been expanded to an almost-comical effect. The data could be visibly clustered around certain values, seemingly randomly distributed, or even be shaped like a beast – but you could never tell by the summary statistics (Figure 2).
The Datasaurus Dozen (Matejka & Fitzmaurice, Reference Matejka and Fitzmaurice2017), an extension of Anscombe's quartet. All of them have identical descriptive statistics (yes, even the Tyrannosaurus).

Graphs can test assumptions. They help diagnose data. Their utility in research, from beginning to end, has been known for decades (Healy & Moody, Reference Healy and Moody2014). So why do they remain rare? I can speculate: Perhaps we have become captive by a sociological institution telling us that ‘proper’ science precludes graphs.[Footnote 1] Or maybe we are confined by what game theoreticians call a coordination game, in which anyone who diverges from convention is penalized, even when correct.
Whatever the cause, the way forward is clear: disrupt the institution, change the game. And this is what researchers, editors, and most recently journals have been doing about other damaging conventions. Take, for instance, statistical significance or hypothesis testing: Statisticians have been warning for years that p-value is not a measure of hypothesis veracity (e.g., Gelman & Stern, Reference Gelman and Stern2006; Wasserstein & Lazar, Reference Wasserstein and Lazar2016), even if some mistakenly believe so (McShane & Gal, Reference McShane and Gal2015). A turning point came when two studies showed how popular research decisions can, intentionally or not, cause anything to become statistically significant (John, Loewenstein, & Prelec, Reference John, Loewenstein and Prelec2012; Simmons, Nelson, & Simonsohn, Reference Simmons, Nelson and Simonsohn2011). Psychologists heeded the problematic evidence by bolstering editorial policies (e.g., Eich, Reference Eich2014), adopting ‘new statistics’ (Cumming, Reference Cumming2012, Reference Cumming2014), and commencing a vast and ongoing effort to replicate findings (e.g., Open Science Collaboration, Reference Collaboration2015).[Footnote 2] Curatescience.org was established to coordinate replications and document their results. Institutions began reforming.
Management scholars, already wary (e.g., Bettis, Reference Bettis2012), took notice. The Strategic Management Journal (SMJ) moved to discourage talk of ‘statistically significant’ findings and encourage replication (Bettis, Ethiraj, Gambardella, Helfat, & Mitchell, Reference Bettis, Ethiraj, Gambardella, Helfat and Mitchell2016; Ethiraj, Gambardella, & Helfat, Reference Ethiraj, Gambardella and Helfat2016). Shortly thereafter, Management and Organization Review (MOR) extended these guidelines by adding incentives: Researchers who share data and instruments deserve recognition, and they receive it in the form of badges (Lewin et al., Reference Lewin, Chiu, Fey, Levine, McDermott, Murmann and Tsang2016). At MOR, recognition also goes to those who preregister their hypotheses, signaling that a counterintuitive finding was genuine, not the result of hypothesizing after the results were known (HARKing; Kerr, Reference Kerr1998). Soon thereafter, SMJ also began awarding badges for open data (full disclosure: this commentator's paper received such a badge, Levine, Bernard, & Nagel, Reference Levine, Bernard and Nagel2017).
VISUALIZING THE FUTURE
Henrich Greve counts the challenges we face – statistically significant but weak findings, vast unexplained variation, and proprietary data that blocks anyone from interpreting the findings, except the original authors.[Footnote 3] He shows the risk – static science – and offers an easy countermeasure. Graphs, while not resolving all these challenges, are a necessary addition to our shared grammar. And graphing is much easier than it was.
Whereas Anscombe (Reference Anscombe1973: 20) had to contend with a ‘line printer or typewriter terminal’, the contemporary, open-source statistical package R offers anything from a simple scatterplot to complex creations in two and three dimensions. Users have been adding to it through open collaboration: offering detailed examples, sharing statistical code, providing support (Levine & Prietula, Reference Levine and Prietula2014). With such expansive possibilities, graphing is within anyone's reach.
Now, the challenge is not statistical or technological, but institutional: Who would dare to doodle? Greve's journal, Administration Science Quarterly (ASQ), is set to make visuals legit again. Each of us can contribute, at ASQ and anywhere else:
1. Open your eyes to the wealth of graphing possibilities (Healy & Moody, Reference Healy and Moody2014) and understand how to construct, characterize, and interpret graphs (Cook & Weisberg, Reference Cook and Weisberg1999).
2. As an author, include in your manuscript graphs such as scatterplot matrixes, residual plots, and Cook's distance (Cook, Reference Cook1977). Explain to your readers how the graphs aid exploration, improve evidence, encourage extensions, and promote collaboration and accumulation of evidence. As a reviewer, communicate why you expect to see graphs.
3. Train peers and students in graphing and interpretation thereof, regardless of method or approach (Healy, Forthcoming).[Footnote 4] Graphs have an important place in empirical papers, but they can also play a useful role in visualizing theory (e.g., Levine & Prietula, Reference Levine and Prietula2012; Levinthal & Posen, Reference Levinthal and Posen2007).
There is a light at the end of the tunnel. I can see it.