INTRODUCTION
Increasing air pollution by tropospheric ozone (O3) is occurring globally (Gauss et al. Reference Gauss, Myhre, Isaksen, Grewe, Pitari, Wild, Collins, Dentener, Ellingsen, Gohar, Hauglustaine, Iachetti, Lamarque, Mancini, Mickley, Prather, Pyle, Sanderson, Shine, Stevenson, Sudo, Szopa and Zeng2006). Even with the implementation of legislation to control emissions of its precursors, ambient O3 concentrations are expected to increase throughout much of the world during the 21st century (Royal Society 2008). The IPCC (Reference Solomon, Qin, Manning, Chen, Marquis, Averyt, Tignor and Miller2007) predicted that ambient O3 levels may increase by 20–25% between 2015 and 2050, and a further 40–60% by 2100. In China, atmospheric O3 pollution is very serious due to rapid economic development, urban expansion and transportation facilities, especially in areas undergoing rapid development such as the Yangtze River Delta (28°45′–33°25′N, 118°20′–123°25′E) (Wang et al. Reference Wang, Kiang, Tang, Zhou and Chameides2005; Liu et al. Reference Liu, Wang and Zhu2009), the Pearl River Delta (21°30′–23°40′N, 112°10′–115°30′) (Zheng et al. Reference Zheng, Zhang, Che, Zheng and Yin2009; Liu et al. Reference Liu, Lam, Jiang, Wang, Xie, Zhuang and Jiang2013) and the Beijing–Tianjin Region (38°34′–40°15′N, 116°43′–118°194′E) (Streets et al. Reference Streets, Fu, Jang, Hao, He, Tang, Zhang, Wang, Li, Zhang, Wang, Wang and Yu2007; Tang et al. Reference Tang, Li, Wang, Xin and Ren2009). Rising O3 concentration has produced a great threat to vegetation ecosystems and human health, especially to crop yield in China. Avnery et al. (Reference Avnery, Mauzerall, Liu and Horowitz2011) predicted that elevated O3 would cause significant decreases in crop yields of wheat, soybean and maize by 2030, based on accumulated exposure over a threshold of 40 nl/l (the AOT40 metric) in China. Nawahda & Yamashita (Reference Nawahda and Yamashita2013) estimated that relative yield loss in wheat and soybean crops in China in 2020 based on AOT40 are c. 30·5 and 19·0%, respectively. A method for alleviating the adverse effects of elevated O3 on crop yield is necessary in China, which has 20% of the world's population and faces great challenges for food security (Wang et al. Reference Wang, Manning, Feng and Zhu2007).
The adverse effects of O3 on plants have been studied for more than 50 years since the first description of O3 as a toxic air pollutant by Richards et al. (Reference Richards, Middleton and Hewitt1958). It is well documented that chronic exposure to elevated O3 causes a range of adverse effects on plants including reduced photosynthetic activity, altered carbon allocation, diminished biomass accumulation, reduced yield and accelerated senescence, with or without visible injury (Biswas et al. Reference Biswas, Xu, Li, Sun, Wang, Han and Jiang2008; Feng et al. Reference Feng, Kobayashi and Ainsworth2008; Black et al. Reference Black, Stewart, Roberts and Black2012; Mills et al. Reference Mills, Wagg and Harmens2013). Photosynthesis has been shown to be particularly sensitive to O3 and often shows a downward trend under elevated O3. This reduction may result from stomatal closure, impairment in chlorophyll fluorescence, inhibition of carbon dioxide (CO2) assimilation and a decrease in electron transport rate (Guidi et al. Reference Guidi, Bongi, Ciompi and Soldatini1999; Fiscus et al. Reference Fiscus, Booker and Burkey2005). Improving photosynthesis under elevated O3 is vital because of its relationship with plant growth and crop yield.
Arbuscular mycorrhizal (AM) symbiosis is the most widespread mycorrhizal association type in plants that have true roots (Read et al. Reference Read, Duckett, Francis, Ligrone and Russell2000). AM symbiosis can increase uptake of phosphorus and other less mobile elements in sub-optimal situations, improve plant–water relationships (Augé Reference Augé2001) and enhance plant resistance to environmental stress (Smith & Read Reference Smith and Read2008). Hence, the role of AM symbiosis in mediating plant responses to atmospheric change may be an important consideration in predicting effects of atmospheric pollutants on plants in agricultural lands and managed ecosystems (Shafer & Schoeneberger Reference Shafer and Schoeneberger1991). One of the most significant effects of AM inoculation on plants is to increase plant photosynthesis regardless of environmental stresses (Wu & Xia Reference Wu and Xia2006; Talaat & Shawky Reference Talaat and Shawky2014; Xiao et al. Reference Xiao, Hu, Chen, Yang and Hua2014). The possible reasons are that AM inoculation increases phosphorus supply (Black et al. Reference Black, Mitchell and Osborne2000), total chlorophyll and carotenoid contents (Mathur & Vyas Reference Mathur and Vyas1995), opening of stomata, photochemical processes and CO2 gas exchange (Boldt et al. Reference Boldt, Pörs, Haupt, Bitterlich, Kühn, Grimm and Franken2011). Up to now, however, only a few studies have provided any assessment of the impacts of elevated O3 on mycorrhizal colonization and structure (Brewer & Heagle Reference Brewer and Heagle1983; McCool & Menge Reference McCool and Menge1984; Miller et al. Reference Miller, Shafer, Schoeneberger, Pursley, Horton and Davey1997), and the effects of AM fungi inoculation on plant growth and nutrition status (Duckmanton & Widden Reference Duckmanton and Widden1994; Fangmeier et al. Reference Fangmeier, De Temmerman, Black, Persson and Vorne2002; Wang et al. Reference Wang, Feng, Wang and Gong2011; Cui et al. Reference Cui, Hu, Lin, Wang, Chen, Wang and Zhu2013) and rhizosphere microbes (Wang et al. Reference Wang, Wang, Diao and He2014). It is still unclear how AM symbiosis affects plant photosynthetic function under elevated atmospheric O3.
Snap bean (Phaseolus vulgaris L.) is one of the most popular crops in China and is planted on 120·51 × 104 ha. In the present study, two snap bean genotypes (line S156: O3-sensitive; line R123: O3-tolerant) with different O3 sensitivity were selected, and it was hypothesized that AM symbiosis would alter plant photosynthetic function under elevated O3, while AM function would be affected by O3 stress. In order to test this hypothesis, leaf injury was evaluated for the two genotypes, and the effects of AM fungi inoculation on plant photosynthetic function were determined.
MATERIALS AND METHODS
Arbuscular mycorrhizal fungi and soil
The AM fungus used was Glomus aggregatum, which proved to have a good symbiotic relationship with snap bean (Phaseolus vulgaris L.) in a pre-experiment. The inoculum for the mycorrhizal treatment was a mixture of spores, mycelium, sandy soil and root fragments, which was purchased from the Beijing Academy of Agriculture and Forestry Sciences (China). The inoculum dose was 50 g/kg of soil in the mycorrhizal treatment. In the non-mycorrhizal treatment, plants received 100 ml of washing filtrate from the equivalent amount of AM inoculums (which eliminates AM hyphae and spores), sterilized to correct the possible difference in the microbial community between the mycorrhizal and non-mycorrhizal treatments.
The soil was collected from the sub-surface (0–20 cm) in Haidian District, Beijing, China. The basic soil properties were as follows: fine-loamy, pH 8·0, 21·8 g organic matter/kg, 1·30 g nitrogen/kg, 37·2 mg extractable phosphorus/kg soil, 123·5 mg available potassium/kg. After air drying, the soil samples for cultivation were passed through a 2 mm mesh sieve. All soil samples were steamed at 121°C for 30 min on 3 consecutive days to eliminate indigenous mycorrhizal fungi.
Plant growth and ozone exposure
Two snap bean genotypes with known differences in O3 sensitivity were used: line R123 (O3-tolerant) and line S156 (O3-sensitive) (Flowers et al. Reference Flowers, Fiscus, Burkey, Booker and Dubois2007). The seeds were surface-sterilized with 10% H2O2 solution for 10 min and then washed thoroughly with de-ionized water. The seeds were germinated at 25°C in the dark for 48 h. Five germinated seeds were sown per pot (diameter 250 mm, volume 3 litres), and thinned to one plant per pot when the first true leaves had emerged (GS 11). Three weeks later, after seed germination, the plants received 30 ml Hoagland's solution per week. During the growth stage plants were watered daily with de-ionized water.
Pots were randomly moved to plant growth chambers (PGCs) used by Chen et al. (Reference Chen, Wang, Feng, Xiao and Duan2009) at Beijing Urban Ecological Station, Chinese Ecosystem Research Network with a plant growth lamp modification. Photosynthetically active radiation of daytime maximum intensities at plant height was 480 μmol/(m2/s). Temperature in the PGCs was controlled at 20–25 °C and 15–20 °C during day and night, relative humidity of 50–85%, 10 h light and 14 h darkness. All pots in each PGC were rotated every day to minimize possible position effects. To reduce microclimate differences among the chambers (radiation, temperature and humidity), plants were rotated among the three chambers at 1-week intervals.
Three O3 treatments were used, namely C AMB (8 h O3 mean concentration 20 nl/l), C MID (8 h O3 mean concentration 50 nl/l) and C HIG (8 h O3 mean concentration 80 nl/l). The AOT40 values were 0, 5·6 and 22·4 nl/l/h in C AMB, C MID and C HIG, respectively. O3 concentrations were achieved by mixing charcoal-filtered air with O3 generated by electric discharge (O3 generator, QHG-1, Yuyao, China) from pure oxygen. O3 concentrations within the chambers were monitored by an O3 analyser (Model 49i, Thermo Electron Corporation, USA). O3 fumigation started after seedling thinning and scored as 0 day. O3 exposure was from 09:00 to 17:00 h each day and lasted for 60 days.
The treatment design was a 3 × 2 × 2 factorial with three O3 treatments (C AMB, C MID and C HIG), two mycorrhizal treatments (with AM inoculation [+AM] and without [−AM]) and two genotypes (S156 and R123). Each treatment had six replicates including two PGC replicates and three pot replicates in each PGC.
Symptom evaluation
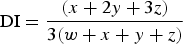
Leaves were assessed for O3 damage (bronze-coloured lesions) at the initial growth stage (GS 11–13, 0–5 days after O3 the beginning of fumigation) and the blooming stage (GS 61–65, 30–35 days after O3 the beginning of fumigation) according to the experimental protocol stated in the ‘International Cooperative Programme (ICP) Vegetation: yield response and O3 injury on Phaseolus vulgaris. Due to leaf ageing, O3 damage on leaves was not assessed at the pod filling stage (GS 71–77). The foliar injury included four levels: 0, no damage; 1, 0–25% of the leaf surface damaged; 2, 26–50% of the leaf surface damaged; 3, >50% of the leaf surface damaged. All trifoliate leaves per plant were scored. A damage index (DI) for each assessment was expressed as a proportion of the maximum possible damage as follows (Finnan et al. Reference Finnan, Donnelly, Burke and Jones2002):
 $${\rm DI} = \displaystyle{{(x + {\rm 2}y + {\rm 3}z)} \over {{\rm 3(}w + x + y + z{\rm )}}}$$
where w = number of leaves in class 0, x = number of leaves in class 1, y = number of leaves in class 2, z = number of leaves in class 3.
TIM after exposure to O3 fumigation was scored as follows: (1) at the initial growth stage (GS 11–13), all fully developed leaves were examined at 2-h intervals after leaf emergence until foliar injury was found on any leaf; (2) at the blooming stage (GS 61–65), all new sprouted and fully developed leaves were scored at 2-h intervals after 30 days’ O3 exposure until foliar injury was found. Foliar injury refers to bronze-coloured lesions.
Pigment concentration
For the determination of chlorophyll (Chl) a, Chl b and carotenoid concentrations, five pieces of fresh sub-leaf (12 mm in diameter) were punched out of the newest fully expanded trifoliate leaf of each plant before harvest. The leaf sample was placed in a stoppered test tube (10 ml) containing 5 ml of 95% ethanol and stored at 4 °C in the dark until the leaf faded. The test tube was shaken twice every day. When the absorbance difference between 2 continuous days was <5%, leaf discolouration was complete. The volume was corrected before analysis to the initial volume (5 ml). Absorbance was measured at wavelengths of 470, 646 and 663 nm. The concentrations of Chl a, b and carotenoids were calculated according to Lichtenthaler (Reference Lichtenthaler1987).
Chlorophyll fluorescence
Fluorescence measurements were carried out on discs punched from the newest fully expanded trifoliate leaf in each pot, using a LI-6400 photosynthesis system fitted with an integral fluorescence chamber (LI-6400, Li-Cor, USA). Prior to analysis, each leaf was dark-adapted for 45 min. Dark-adapted measurements were obtained for minimal fluorescence (Fo), maximal fluorescence (Fm) and variable fluorescence (Fv) as well as the maximum quantum yield of photosystem II (PSII) photochemistry (Fv/Fm ratio). Measurements of the minimal fluorescence of a light-adapted leaf (Fo′), maximal fluorescence during a saturating pulse (Fm′) and steady-state fluorescence (Fs) were also obtained. From these measurements, photochemical quenching components were calculated as the effective quantum efficiency of PSII (ФPSII)/(Fv/Fm) according to Maxwell & Johnson (Reference Maxwell and Johnson2000). Quenching due to non-photochemical dissipation of absorbed light energy (NPQ) was calculated using the equation NPQ = (Fm-Fm′)/Fm′ (Bilger & Björkman Reference Bilger and Björkman1991). Electron transport rate was calculated as (1-Fs/Fm′) × 0·5 × photon flux density × leaf absorption (0·8) according to Genty et al. (Reference Genty, Briantais and Baker1989). The ratio of fluorescence decrease (Fd) (from Fm to Fs) to the steady-state fluorescence Fs (R Fd = Fd/Fs) was also determined in order to avoid errors of judgment caused by using only Fv/Fm (Lichtenthaler & Buschmann Reference Lichtenthaler and Buschmann1987).
Photosynthetic function was not performed at the initial growth stage (GS 11–13) due to the lower leaf area available. Photosynthetic rate, stomatal conductance, transpiration rate and intercellular CO2 concentration were measured in the same leaves as used for fluorescence determination at the blooming stage (GS 61–65) and the pod filling stage (GS 71–77) using LI-6400 photosynthesis system (LI-6400, Li-Cor, USA). The measurements were made on the first fully expanded mature leaf from the top of each plant at 09:00 and 12:00 h local time. The conditions were photon flux density of 1500 μmol/(m2/s), temperature 32 °C, relative humility of 50–70% and CO2 concentration 360 μmol/mol.
Measurement of mycorrhizal colonization rate
Sub-samples of fresh root were cleaned in 10 g/ml potassium hydroxide (KOH) and stained with trypan blue. The proportion of root colonization was estimated through a grid-intersect method by examination of 100 intersects under a compound microscope at 40 × magnification (McGonigle et al. Reference McGonigle, Miller, Evans, Fairchild and Swan1990). All determinations were carried out by the same person to minimize possible observation errors. Root-intersects that contained vesicles and hyphae were scored as mycorrhizal. Roots that did not have cortex were excluded from the analysis.
Statistical analysis
Analysis of variance (ANOVA) with General Linear Model (Multiverate) procedure of SPSS (Ver. 13, SPSS, Chicago, USA) was employed to detect the effects of O3, AM fungi, genotypes and their interactions. Duncan's HSD test was performed to identify significant differences between treatments.
RESULTS
Mycorrhizal colonization rate
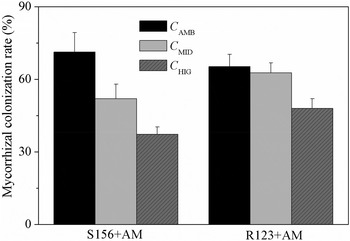
No mycorrhizal colonization was found in the roots of −AM plants, i.e. inoculated with sterilized AM fungi, while mycorrhizal colonization rates in +AM plants were >0·35 (Fig. 1). Mycorrhizal colonization rates in S156 plants were significantly lower (P < 0·05) in the C MID and C HIG treatments relative to the C AMB treatment (decreasing by 27·1 and 47·7%, respectively), whereas in R123 plants it decreased in the C HIG treatment only (by 26·5%; P < 0·05), indicating that elevated O3 produced greater effects on S156 plants. In addition, mycorrhizal colonization rates showed no significant differences between the two genotypes under ambient O3 (C AMB treatment).
Effect of elevated O3 on mycorrhizal colonization rate in the two genotypes (means ± standard deviation, n = 6). Bars indicate standard deviations.

Leaf injury
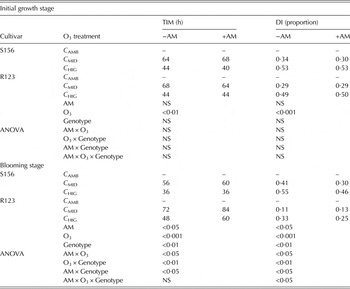
Leaves of the two genotypes showed no typical, visible symptoms under ambient O3 during the whole experiment (Table 1). In C MID and C HIG treatments, however, visible symptoms were found on the leaves of both genotypes. No significant differences were found between the two genotypes at the initial growth stage (GS 11–13) with regard to TIM or DI, but lower TIM and higher DI were found in S156 plants compared to R123 at the blooming stage (GS 61–65) (P < 0·05). Inoculation with AM fungi did not significantly affect TIM and DI in either genotype at the initial growth stage (GS 11–13), but delayed TIM significantly in R123 plants in C MID and C HIG treatments (P < 0·05), and decreased DI in both genotypes at the blooming stage (GS 61–65) (P < 0·05), except for R123 plant in the C MID treatment.
DI and TIM in leaves of the two genotypes at different O3 concentrations

−AM, without mycorrhiza; +AM, with mycorrhiza; –, no visible symptom is observed; NS, not significant.
No interactive effects of AM treatment, O3 and genotype on TIM and DI were found at the initial growth stage (GS 11–13), but at the blooming stage (GS 61–65) significant interactive effects on TIM and DI were found (P < 0·05), indicating that AM function and the difference in plant O3 sensitivity produced interactive effects on plant response to O3 stress (Table 1).
Pigment concentrations
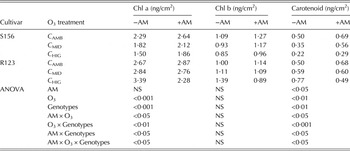
In S156 plants, the concentrations of Chl a, Chl b and carotenoids showed downward trends with elevated O3, independent of AM fungi inoculation (Table 2), although in most cases they were significantly higher (P < 0·05) in +AM plants than −AM plants. In R123 plants, the concentrations of Chl a, Chl b and carotenoids presented upward trends with rising O3 in −AM plants, but downward trends with rising O3 in +AM plants. Compared to −AM R123 plants, AM fungi inoculation increased the concentrations of Chl a, Chl b and carotenoids in the C AMB treatment but decreased their concentrations in the C HIG treatment.
Effect of AM inoculation on pigment concentrations in the two genotypes at different O3 concentrations

−AM, without mycorrhiza; +AM, with mycorrhiza; NS, not significant.
No interactive effects of AM, O3 and genotype on Chl b were found, but significant interactive effects were found on Chl a and carotenoids (P < 0·05) (Table 2), possibly because Chl b has a different synthesis path from the other two pigments, resulting in different responses to the interactive effects of AM fungi and O3 in the two genotypes.
Photosynthetic function
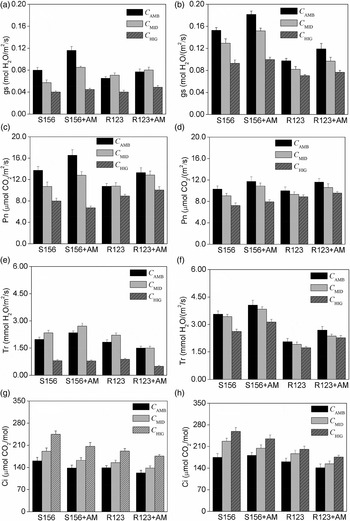
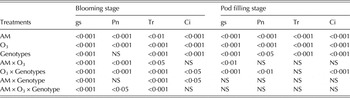
At the blooming stage (GS 61–65) and the pod filling stage (GS 71–77), both photosynthetic rate and stomatal conductance for the two genotypes showed downward trends with elevated O3 independent of AM fungi inoculation (Figs 2(a)–(d)). Inoculation with AM fungi increased photosynthetic rate and stomatal conductance compared to −AM plants (P < 0·05) in C AMB and C MID treatments, but not in the C HIG treatment. Stomatal conductance for the two genotypes at the blooming stage (GS 61–65) was lower than that at the pod filling stage (GS 71–77). In most cases, significant interactive effects of O3, AM and genotype on photosynthetic rate and stomatal conductance were found at the blooming stage (GS 61–65), but fewer significant interactive effects were found at the pod filling stage (GS 71–77) (Table 3). This indicated that decreased photosynthetic rate and stomatal conductance caused by elevated O3 and increased photosynthetic rate and stomatal conductance caused by AM produced different effects in the two genotypes.
Effect of AM inoculation on stomatal conductance (gs), photosynthetic rate (Pn), transpiration (Tr) and intercellular CO2 concentration (Ci) in the two genotypes under elevated O3 at the blooming stage (a, c, e, g) and the pod filling stage(b, d, f, h) under rising O3. Bars indicate standard deviations (n = 6).

Analysis of variance for stomatal conductance (gs), photosynthetic rate (Pn), transpiration rate (Tr) and intercellular CO2 concentration (Ci) at the blooming stage and the pod filling stage in various treatments

NS, not significant.
At the blooming stage (GS 61–65), transpiration for the two genotypes increased in C MID and decreased in C HIG treatments, compared to the C AMB treatment (Fig. 2(e)). The AM fungi inoculation increased transpiration for S156 plants in C AMB and C MID treatments compared to the non-mycorrhizal plants (P < 0·05), but not in the C HIG treatment. Inoculation with AM fungi decreased transpiration rate for R123 plants under all three O3 levels (P < 0·05). At the pod filling stage (GS 71–77), transpiration rate for the two genotypes showed a downward trend with rising O3, but the differences were not significant. Inoculation with AM fungi significantly increased transpiration rate for the two genotype relative to the non-mycorrhizal plants (P < 0·05) (Fig. 2(f)). Significant interactive effects of O3, AM and genotype on transpiration rate were found at the blooming stage (GS 61–65) but not at the pod filling stage (GS 71–77) (Table 3). This could be due to the combined effects of decreased transpiration caused by elevated O3 and increased transpiration caused by AM inoculation at the blooming stage (GS 61–65), while at pod filling stage (GS 71–77) leaf senescence occurred and transpiration rate could no longer be regulated by AM or the plants.
At the two growth stages, intercellular CO2 concentration for the two genotypes presented upward trends with elevated O3 regardless of AM fungi inoculation (P < 0·05). Inoculation with AM fungi generally decreased intercellular CO2 concentration compared to the non-mycorrhizal plant, though only some differences were significant (Figs 2(g) and (h)). Significant interactive effects of O3 × genotype and AM × genotype were seen on intercellular CO2 concentration at the blooming stage (GS 61–65) (Table 3), possibly because O3 and AM produced different effects on stomatal conductance and carbon assimilation in the two genotypes. At the pod filling stage (GS 71–77), fewer significant interactive effects were found, possibly because leaves were in senescence and stomatal regulation was difficult after long-term O3 fumigation.
Chlorophyll fluorescence
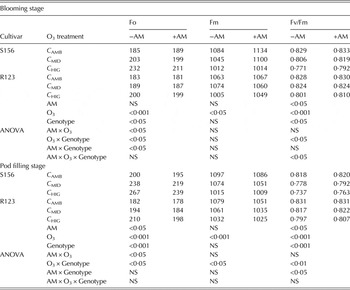
At the blooming and pod filling stages, the minimum Chl a fluorescence (Fo) for the two genotypes presented upward trends with elevated O3 regardless of AM fungi inoculation; however the increase was less with AM fungi inoculation (Table 4). The maximum Chl a fluorescence (Fm) and Fv/Fm for the two genotypes showed downward trends with elevated O3 regardless of AM fungi inoculation, but again the effect was reduced with AM fungi inoculation. In most cases, significant interactive effects of O3, AM and genotype on Fo were observed at the two growth stages (P < 0·05), but fewer significant interactive effects on Fm and Fv/Fm were found, especially on Fm (Table 4).
Effects of AM inoculation on fast kinetics parameters of chlorophyll fluorescence in the two genotypes at different O3 concentrations

−AM, without mycorrhiza; +AM, with mycorrhiza; NS, not significant.
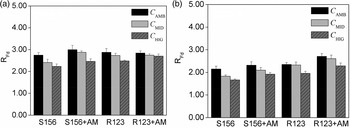
At both the blooming (GS 61–65) and pod filling (GS 71–77) stages, R Fd for the two genotypes showed downward trends with increased O3 regardless of AM fungi inoculation, though only some differences were significant. Compared to the non-mycorrhizal treatment, AM fungi inoculation increased this downward trend in R Fd for S156 plants under elevated O3 but not under ambient O3 at the two growth stages. In R123 plants, AM fungi inoculation increased R Fd only in the C HIG treatment at the blooming stage (GS 61–65) compared to the non-mycorrhizal treatment, but increased R Fd under all three O3 levels at the pod filling stage (GS 71–77) (Fig. 3).
Effect of AM inoculation on R Fd for the two genotypes at the blooming stage (a) and the pod filling stage (b) under rising O3. Bars indicate standard deviations (n = 6).

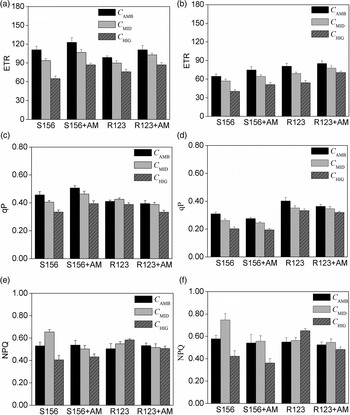
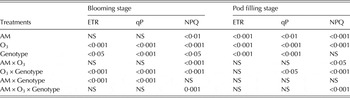
At the blooming (GS 61–65) and pod filling (GS 71–77) stages, electron transportation rate for the two genotypes decreased significantly (P < 0·05) with elevated O3 regardless of AM fungi inoculation, but again the effect was significantly increased in inoculated plants compared to the non-mycorrhizal plants (P < 0·05), especially at the blooming stage (GS 61–65) (Figs 4(a) and (b)). Electron transportation rate was significantly affected by the interaction of O3 × genotype and AM × genotype at the blooming stage (GS 61–65) (P < 0·05), indicating that effects of O3 and AM on electron transportation rate were related to genotype (Table 5).
Effect of AM inoculation on electron transport rate (ETR), photochemical quenching (qP) and non-photochemical quenching (NPQ) in the two genotypes at the blooming stage (a, c, e) and the pod filling stage (b, d, f) under rising O3. Bars indicate standard deviations (n = 6).

Analysis of variance for electron transport rate (ETR), photochemical quenching (qP) and NPQ at the blooming stage and the pod filling stage in various treatments

NS, not significant.
At the blooming (GS 61–65) and pod filling (GS 71–77) stages, photochemical quenching for the two non-mycorrhizal genotypes generally showed downward trends with rising O3, while non-photochemical quenching for the two genotypes showed different responses to rising O3. For S156 plants, non-photochemical quenching increased in the C MID treatment and decreased in the C HIG treatment compared to the C AMB treatment, while non-photochemical quenching for R123 plants increased only in the C HIG treatment (Figs 4(c) and (d)). Relative to the non-mycorrhizal plants, AM fungi inoculation increased photochemical quenching for S156 plants at the blooming stage (GS 61–65) while decreasing photochemical quenching at the pod filling stage (GS 71–77). In R123 plants, however, AM fungi inoculation generally decreased photochemical quenching at both growth stages. In most cases, AM fungi inoculation caused a decrease in non-photochemical quenching for both genotypes at both growth stages, though only some differences were significant. Significant interactive effects of O3, AM and genotype on non-photochemical quenching were found except for AM × genotype at the two growth stages, but for photochemical quenching fewer interactive effects were found (Table 5).
DISCUSSION
Mycorrhizal colonization rate is generally used to evaluate the degree of mycorrhization, which is related to the association function (Abbott & Gazey Reference Abbott and Gazey1994). In the present study, mycorrhizal colonization rate in the two genotypes decreased under elevated O3, especially in S156 plants. This result is consistent with the findings of McCool & Menge (Reference McCool and Menge1984) and a previous study by the present authors (Wang et al. Reference Wang, Wang, Diao and He2014). This is possibly because rising O3 levels reduce photosynthesis and the transportation of carbohydrates to roots (Morgan et al. Reference Morgan, Ainsworth and Long2003; Feng et al. Reference Feng, Kobayashi and Ainsworth2008), thus reducing food supply for AM fungi. However, the present results are not consistent with other previous studies. Duckmanton & Widden (Reference Duckmanton and Widden1994) and Wang et al. (Reference Wang, Feng, Wang and Gong2011) found that O3 had no effect on overall levels of AM colonization, but changed the proportional frequency of arbuscules, vesicles, hyphal coils and internal hypha. A possible reason is that in the study of Duckmanton & Widden (Reference Duckmanton and Widden1994), mycorrhizal colonization was produced by indigenous AM fungi and O3 fumigation lasted more than 1 year, whereas in the present study soil was sterilized and O3 fumigation only lasted 2 months. Although the plant species used in the present study is the same as in Wang et al. (Reference Wang, Feng, Wang and Gong2011), the genotypes are different, thus the responses of mycorrhizal colonization rate to elevated O3 may be different. Yoshida et al. (Reference Yoshida, Gamon and Andersen2001) found that elevated O3 significantly decreased total colonization (percentage of arbuscules, vesicles and hyphae in the roots) of wild rye (Elymus glaucus) and thought this effect depended on the genotype of grass tested. In addition, Cui et al. (Reference Cui, Hu, Lin, Wang, Chen, Wang and Zhu2013) found that elevated O3 accelerated mycorrhizal colonization rate in wheat roots, a result that differs from all previous studies, possibly because roots were colonized by one or more indigenous AM fungi in their study.
Leaf injury, often as necrotic spots, is a common response of plants to O3 stress, though the visible symptoms do not necessarily indicate sensitivity in terms of growth reduction. Leaf injury is often used to evaluate O3 effects on vegetation in many studies (Finnan et al. Reference Finnan, Donnelly, Burke and Jones2002; Bermejo et al. Reference Bermejo, Gimeno, Sanz, De La Torre and Gil2003). In the present study, although elevated O3 caused evident injury in the leaves of two genotypes at the initial growth stage (GS 11–13, 0–5 days after starting O3 fumigation) and the blooming stage (GS 61–65, 30–35 days after starting O3 fumigation), no significant differences were seen in TIM and DI between the two genotypes at the initial growth stage (GS 11–13), possibly because the plants were too young to show differences in O3 tolerance. Inoculation with AM fungi did not produce significant effects on TIM and DI in the two genotypes at the initial growth stage (GS 11–13), but did at the blooming stage (GS 61–65). This is possibly because AM formation is in progress and its function minimal at the initial growth stage (GS 11–13) (<1 week), while at the blooming stage (GS 61–65) (>4 weeks), formation of AM symbiosis is complete and its function is perfect. Drew et al. (Reference Drew, Murray and Smith2006) found that a positive growth response was evident 5 weeks after AM fungi inoculation, but not for the first 3 weeks. Certainly, the formation and function of AM symbiosis may vary considerably with fungal species.
Pigment concentrations show contrasting trends of change with rising O3 in the two genotypes. In S156 plants, concentrations of chlorophyll and carotenoids decrease with elevated O3, which is consistent with many previous studies (Kollner & Krause Reference Kollner and Krause2000; Leitao et al. Reference Leitao, Dizengremel and Biolley2008), possibly because O3 destroys the structure of thylakoids (Pereira et al. Reference Pereira, De Siqueira, Martinez and Puiatti2000). Compared to the non-mycorrhizal plant, AM fungi inoculation significantly increased pigment concentration, though their downward trends with elevated O3 were not altered. A possible reason is that AM fungi inoculation increases enzyme activity related to Chl synthesis, such as Chl synthetase in thylakoid membranes (Schoefts & Bertrand Reference Schoefts and Bertrand2000), or that AM symbiosis avoids photo-oxidative damage and chlorophyll degradation. In R123 plants, however, pigment concentrations show upward trends with elevated O3. A possible reason is that leaf growth and expansion decreases under O3 stress, but leaf structure and chlorophyll synthesis is less affected due to plant O3 tolerance, resulting in Chl accumulation. Inoculation with AM fungi causes lower chlorophyll concentrations relative to non-mycorrhizal plants. This result is consistent to the finding of Boldt et al. (Reference Boldt, Pörs, Haupt, Bitterlich, Kühn, Grimm and Franken2011), in which chlorophyll content was lower in mycorrhizal tomato plants than that in non-mycorrhizal tomato plants. Inoculation with AM fungi showed different effects on pigment concentrations, which might depend on the combined effects of AM fungi inoculation on leaf expansion, pigment synthesis rate and plant O3 tolerance.
Photosynthesis has been shown to be particularly sensitive to O3. In the present study, photosynthetic rate for the two genotypes showed downward trends with elevated O3 at the blooming stage (GS 61–65) and the pod filling stage (GS 71–77) regardless of AM inoculation, which is consistent with previous results (Bortier et al. Reference Bortier, De Temmerman and Ceulemans2000; Calatayud et al. Reference Calatayud, Iglesias, Talon and Barreno2004). Possible reasons for this include lower concentrations of Chl a and b, lower stomatal conductance, lower electron transport rate, lower photochemical quenching, higher non-photochemical quenching, or their combined effects caused by elevated O3. Lower concentrations of Chl a and b (especially Chl a) cause a strong loss of photosynthetic reaction centres (PSI and PSII), alter the luminous energy capture and transfer into the PSII reaction centre (RC) complex in the photosynthetic tissue of the etiolated plant (The Royal Society 2008). Stomatal conductance is one of the most important factors affecting gas exchange in the leaf. Lower stomatal conductance reduces CO2 uptake and then decreases photosynthetic rate (Karnosky et al. Reference Karnosky, Zak, Pregitzer, Awmack, Bockheim, Dickson, Hendrey, Host, King, Kopper, Kruger, Kubiske, Lindroth, Mattson, Mcdonald, Noormets, Oksanen, Parsons, Percy, Podila, Riemenschneider, Sharma, Thakur, Sôber, Sôber, Jones, Anttonen, Vapaavuori, Mankovska, Heilman and Isebrands2003), though plant O3 uptake may be also decreased. Electron transport rate reflects the efficiency of the light reactions in overall photosynthetic performance and it generally decreases under O3 stress (Francini et al. Reference Francini, Nali, Picchi and Lorenzini2007). Lower electron transport rate indicates that one or several of the steps in the electron transport process is affected negatively, and carboxylation efficiency is decreased (Calatayud et al. Reference Calatayud, Alvarado and Barreno2002). Lower photochemical quenching indicates that O3 decreases the capacity for re-oxidizing plastoquinone (QA) during actinic illumination, and the excitation pressure on PSII also increases, suggesting a decrease in the fraction of open PSII. Non-photochemical quenching reflects the capacity of plants to carry out non-radiative dissipation of excess energy (Demmig-Adams et al. Reference Demmig-Adams, Adams, Heber, Neimanis, Winter, Krüger, Czygan, Bilger and Björkman1990) and it generally increases under O3 stress.
Inoculation with AM fungi significantly improved photosynthetic rate for both genotypes in C AMB and C MID treatments, which should benefit from the increase in Chl concentrations, stomatal conductance, electron transport rate, photochemical quenching or decrease in non-photochemical quenching caused by AM inoculation. The fact that AM fungi inoculation increased Chl concentrations has been found in many previous studies regardless of environmental stress (Zuccarini Reference Zuccarini2007; Zhu et al. Reference Zhu, Song, Liu and Liu2011). Higher Chl concentrations are helpful for increasing photosynthetic rate, since pigments can capture much light energy (Mathur & Vyas Reference Mathur and Vyas1995). AM inoculation often increases stomatal conductance under environmental stress, such as drought (Wu & Xia Reference Wu and Xia2006) and salt stress (Cho et al. Reference Cho, Toler, Lee, Ownley, Stutz, Moore and Augé2006), which may be related to AM effect on abscisic acid in leaves (Estrada-Luna & Davies Reference Estrada-Luna and Davies2003). Although higher stomatal conductance for the mycorrhizal plant may cause great O3 flux, it also causes higher net CO2 assimilation and carbohydrate supply for AM fungi (Augé et al. Reference Augé, Toler, Sams and Nasim2008). Increases of electron transport rate by AM fungi have been reported in several studies (Tsimilli-Michael et al. Reference Tsimilli-Michael, Eggenberg, Biro, Köves-Pechy, Vörös and Strasser2000; Boldt et al. Reference Boldt, Pörs, Haupt, Bitterlich, Kühn, Grimm and Franken2011), possibly because AM increases the quantum yields of PSII photochemistry or amounts of ‘open’ PSII centres. Inoculation with AM fungi increases photochemical quenching for S156 plants relative to the non-mycorrhizal plant at the blooming stage (GS 61–65) but not at the pod filling stage (GS 71–77). This is possibly because mycorrhizal S156 plants can use the excitation energy more efficiently at the blooming stage (GS 61–65) than at the pod filling stage (GS 71–77); moreover, much carbohydrate is also transported to the pods at the pod filling stage (GS 71–77), and thus AM function may be affected negatively. Boldt et al. (Reference Boldt, Pörs, Haupt, Bitterlich, Kühn, Grimm and Franken2011) also found that mycorrhizal plants had higher photochemical quenching despite significantly lower chlorophyll content compared to control plants. In most cases, however, AM fungi inoculation affects photochemical quenching slightly for R123 plants at the two growth stages compared to non-mycorrhizal plants. No reasonable explanation is available at present, and the present authors think this phenomenon may be related to the decreased pigments. Inoculation with AM fungi decreases non-photochemical quenching for the two genotypes at the two growth stages in most cases though only some differences are significant, indicating AM fungi inoculation may enable plants to use sunlight more effectively. This result is consistent with the findings of Boldt et al. (Reference Boldt, Pörs, Haupt, Bitterlich, Kühn, Grimm and Franken2011), in which mycorrhizal plants had lower non-photochemical quenching of chlorophyll fluorescence.
Intercellular CO2 concentration for the two genotypes significantly increased under O3 stress at both growth stages, which is possibly due to the inhibition of carbon assimilation (Heath & Taylor Reference Heath, Taylor, Sandermann, Wellburn and Heath1997). In mycorrhizal plants, however, intercellular CO2 concentration was lower than in non-mycorrhizal plants, possibly because AM fungi increased stomatal conductance and photosynthetic rate, and thus increase CO2 consumption as well as gas exchange in leaves.
The ratio Fv/Fm, the maximum quantum yield of PSII photochemistry, is frequently used as an indicator of the photo-inhibition or of other kinds of stress caused to the PSII. In present study, Fv/Fm for the two genotypes showed downward trends with increasing O3 at the blooming (GS 61–65) and pod filling stages (GS 71–77), though only some differences were significant. This may be a result of an increase in protective non-radiative energy dissipation associated with a regulated decrease in photochemistry and photosynthetic rate, photo-damage of PSII centres, or both (Osmond Reference Osmond, Baker and Bowyer1994). However, Flowers et al. (Reference Flowers, Fiscus, Burkey, Booker and Dubois2007) found that Fv/Fm had a downward trend with increasing O3 in S156 plants, but not in R123 plants. The difference between the present results and the report of Flowers et al. (Reference Flowers, Fiscus, Burkey, Booker and Dubois2007) in R123 plants may be related to the O3 concentration and plant growth environment. Inoculation with AM fungi caused an increase in Fv/Fm for both genotypes at both growth stages in the present study, though only some differences were significant. This result is consistent with previous studies. For example, Zhu et al. (Reference Zhu, Song, Liu and Liu2011) found that AM inoculation increased Fv/Fm for maize plants under high temperature stress. Bagheri et al. (Reference Bagheri, Shamshiri, Shirani and Roosta2011) found that photochemical quantum yield of PSII in pistachio plants was enhanced by AM inoculation and this effect was more pronounced under water stress. Boldt et al. (Reference Boldt, Pörs, Haupt, Bitterlich, Kühn, Grimm and Franken2011) found that mycorrhizal colonization increased efficiency and yield of the PSII photochemistry (maximum and apparent quantum yields of PSII photochemistry) and amounts of ‘open’ PSII centres. However, the present result is also contrary to several studies. For example, Rai et al. (Reference Rai, Shende and Strasser2008) found that AM fungi inoculation did not change maximum quantum yield of PSII photochemistry for maize plants compared to non-mycorrhizal plants. Paradi et al. (Reference Paradi, Bratek and Lang2003) found AM fungi inoculation decreased Fv/Fm ratios for Plantago lanceolata L. plants relative to non-mycorrhizal plants. Unfortunately, no reasonable explanation is provided to interpret this difference at present.
The R Fd is also used to reflect the whole photosynthetic efficiency from the primary photochemical event to the activity of Calvin cycle enzymes, since it can more accurately estimate effect of elevated O3 on plant photosynthesis than Fv/Fm in some cases (Georgieva & Lichtenthaler Reference Georgieva and Lichtenthaler1999). The R Fd presented a downward trend with increasing O3, especially in S156 plants, indicating PSII photochemistry and CO2 fixation may be partly destroyed. This result is consistent with the report of Calatayud et al. (Reference Calatayud, Alvarado and Barreno2002), in which elevated O3 decreased R Fd for the three cabbage varieties. In the present study, R Fd increased in the two genotypes under O3 stress after AM fungi inoculation relative to the non-mycorrhizal plants in most cases, indicating that photosynthetic efficiency increased in the mycorrhizal plant. This is possibly because AM fungi increase utilization of light energy, CO2 fixation or partly reduce photo-damage of PSII centres.
CONCLUSION
The present study focused on the effect of AM fungi inoculation on photosynthetic function of two genotypes with different O3 sensitivity under rising O3. The hypothesis that AM would improve plant photosynthetic function of the two genotypes to some extent and enhance plant tolerance to O3 stress was supported by the present experiment. Decreased mycorrhizal colonization rate showed that mycorrhization was negatively affected by O3 stress. Arbuscular mycorrhizae could alleviate leaf injury and delay TIM. Relative to non-mycorrhizal plants, mycorrhizal plants had higher Fv/Fm, R Fd and carotenoid concentration, indicating AM fungi inoculation may enhance plant O3 tolerance. Higher photosynthetic rate, stomatal conductance, transpiration, electron transport rate and pigments in mycorrhizal plants indicated that AM improved plant photosynthetic function under rising O3, but these positive effects did not always occur. The detailed mechanism about effect of AM fungi inoculation on chlorophyll fluorescence requires further study.