Implications
Results of the present study help to better understand adaptation to feed additive-based methane (CH4)-mitigating feeding strategies. Essential oils had a short-term effect on CH4 production, which may indicate microbial adaptation, whereas the CH4-mitigating effect of lauric acid (LA) persisted. Data obtained from in vitro analyses should be interpreted with care and be confirmed in vivo, before drawing definite conclusions with regard to CH4 mitigation using feed additives.
Introduction
Several feed additives may mitigate CH4 emissions from ruminants (Hristov et al., Reference Hristov, Lee, Cassidy, Long, Heyler, Corl and Forster2013). However, the rumen microbial ecosystem can adapt to feed additives, which results mostly in a short-term decrease of CH4 production only. For example, promising results on CH4 reduction using essential oils or their active ingredients have been obtained using in vitro batch cultures, whereas no or only a temporary effect on fermentation characteristics was found in continuous cultures or in vivo (Benchaar and Greathead, Reference Benchaar and Greathead2011; Van Zijderveld et al., Reference Van Zijderveld, Dijkstra, Perdok, Newbold and Gerrits2011). Cardozo et al. (Reference Castro-Montoya, Peiren, Cone, Zweifel, Fievez and De Campeneere2004) reported a short-term effect of plant extracts on fermentation characteristics that disappeared after 6 days. The latter indicates that microbial adaptation can occur after short-term exposure. The response in CH4 production to plant extracts evaluated in vitro may also vary with composition of the diet consumed by the donor animals (O’Brien et al., Reference O’Brien, Navarro-Villa, Purcell, Boland and O’Kiely2014), as diet composition affects the microbial activity in rumen inoculum.
In broilers, shuttle programmes with two or more anticoccidial compounds, usually with different modes of action, are widely used to reduce resistance of protozoan parasites (Chapman, 2001). Similarly, the alternating use of two or more CH4 reducing feed additives with a different mode of action may alleviate the problem of microbial adaptation in the rumen. If successful, a persistently lower CH4 production could be achieved without the requisite for a persistent CH4 reduction by a single feed additive. Before testing this concept in vivo, more information is needed on the duration and persistency of the CH4 reducing effect of the selected additives. Not only endpoint measurements, but also the kinetics of CH4 production are important in this respect. For example, Hariadi and Santoso (Reference Hansen, Storm and Sell2010) found shifts in relative ranking of impact of several plant species on CH4 production after incubation for 6, 24 or 48 h. Similarly, Pellikaan et al. (Reference Pellikaan, Hendriks, Uwimana, Bongers, Becker and Cone2011) found differences in ranking of additives at different time points during the incubation. The aim of the present study was therefore to examine the adaptation of dairy cows to CH4 reducing feed additives that have different modes of action in vivo, using the in vitro gas production (GP) technique and evaluating the extent and dynamics of CH4 and total GP.
Material and methods
Animals, diets and feeding
All experimental procedures were approved by the Animal Care and Use Committee of Wageningen University (Wageningen, the Netherlands). Nine rumen cannulated, second parity cows (105±6.5 days in milk (DIM); mean±SD at the start of the experiment) were assigned to three blocks based on milk yield. Within blocks, cows were randomly assigned to one of three diets: Control (CON; no feed additive), Agolin Ruminant® (AR) (Agolin SA, Bière, Switzerland; 0.05 g/kg dry matter (DM)) or LA (C12:0) (Sigma Aldrich, Zwijndrecht, the Netherlands; 30 g/kg DM). AR contains 0.2 g essential oils/g product (Castro-Montoya et al., Reference Cardozo, Calsamiglia, Ferret and Kamel2015) with eugenol, geranyl acetate and coriander oil being the main components.
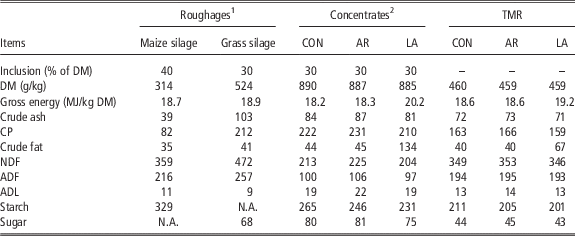
Additives were included in the concentrate meals (Table 1). The CON concentrate was composed of maize (310 g/kg), maize gluten feed (140 g/kg), rapeseed meal (94 g/kg), soyabean meal (90 g/kg), rumen-protected soyabean meal (formaldehyde treated; 86 g/kg), beet pulp (75 g/kg), palm kernel expeller (70 g/kg), rumen-protected rapeseed meal (formaldehyde treated; 57 g/kg), cane molasses (40 g/kg), limestone (13 g/kg), soyabean hulls (10 g/kg), vitamin and mineral premix (8 g/kg), salt (3.6 g/kg), sodium bicarbonate (2.5 g/kg) and magnesium oxide (1.5 g/kg). Given the low concentration of AR in concentrate, the ingredient composition of AR concentrate was the same as of the CON concentrate. AR was first homogenously mixed with other ingredients, before it was included in the large concentrate mixture. In the LA concentrate, ingredients were proportionally exchanged against C12:0, except for the minerals and the vitamin and mineral premix, which were kept at the same level as in the other two concentrates. Before introduction of the additives in the diets, cows were adapted for a period of 19 days to a total mixed ration (TMR) that consisted of grass silage, maize silage and CON concentrate in a 30 : 40 : 30 ratio on a DM basis. During the first 7 days of this period, animals were housed in a freestall barn. Thereafter, cows were individually housed in tie-stalls to determine dry matter intake (DMI) of each cow. Feed was supplied in equal portions at 0600 and 1600 h. A mixture of grass silage and maize silage was prepared twice weekly and stored in a cooled room (±7°C). The concentrate was weighed separately into buckets and manually mixed into the roughage mixture at the moment of feeding. After 5 days in the tie-stalls, feed supply to each cow was restricted to 95% of voluntary to minimize the risk of feed refusals during the experiment. For cows assigned to either the AR or LA diet, the CON concentrate in the TMR was replaced by the respective treatment concentrate from day 12 in the tie-stalls onwards.
Analysed, average chemical composition of maize silage, grass silage and concentrates and calculated average composition of the total mixed ration (TMR) for the different diets fed (g/kg DM unless otherwise stated)

DM=dry matter; N.A.=not analysed.
1 Maize silage: NEL (net energy for lactation: MJ/kg DM)=6.9; DVE (protein digested in the small intestine (g/kg DM); Tamminga et al., Reference Tamminga, Van Straalen, Subnel, Meijer, Steg, Wever and Blok1994)=52; pH=3.8; ammonia-N (% total N)=7. Grass silage: NEL (MJ/kg DM)=6.6; DVE (g/kg DM)=90; pH=5.8; ammonia-N (% total N)=8.
2 Control (CON; no additive), Agolin Ruminant® (AR; 0.05 g/kg DM) or lauric acid (C12:0) (LA; 30 g/kg DM).
Sampling and analyses of feed, substrate components and milk
Representative samples (~0.5 kg) of all individual TMR components were collected at the moments of feed preparation before one of the 6 rumen fluid collection days. The average DMI per time point was calculated based on the 2 days before rumen fluid collection. Milk samples of four milkings before each rumen fluid collection day were collected from all cows and analysed for fat, protein and lactose according to Hatew et al. (Reference Hariadi and Santoso2015b). Fat- and protein-corrected milk yield (FPCM; kg/day) was calculated as (0.337+0.116×fat%+0.06×protein%)×milk yield (kg/day) (Centraal Veevoederbureau, Reference Chapman2008). Samples of TMR components, incubation substrate components, and orts were analysed for chemical composition as described by Klop et al. (Reference Klop, Hatew, Bannink and Dijkstra2016) except for crude fat analysis, which was based on NEN-ISO 1735 (International Standards Organization, 2004). A modification to the standard procedure was that samples were hydrolyzed with hydrochloric acid at 75°C and subsequently, the solution containing hydrochloric acid and ethanol was extracted with diethyl ether and petroleum ether. Solvents were removed by distillation before the mass of the extracted material was determined.
Rumen fluid, in vitro gas production equipment and methods of incubation
Rumen fluid from each cow was collected just before morning feeding in pre-warmed thermos flasks filled with CO2 as described by Hatew et al. (Reference Hariadi and Santoso2015b) on days −4, 1, 4, 8, 15 and 22 relative to the introduction of the additives in the diets. Volatile fatty acid (VFA) concentrations were determined in a subsample of strained rumen fluid from each cow. The equipment described by Pellikaan et al. (Reference Pellikaan, Hendriks, Uwimana, Bongers, Becker and Cone2011) was used to determine in vitro gas and CH4 production. Rumen fluid from individual cows was used as inoculum and after straining through cheesecloths, mixed with a pre-warmed, semi-defined incubation medium (medium B; Lowe et al., Reference Lowe, Theodorou, Trinci and Hespell1985 as modified by Williams et al., Reference Williams, Bosch, Boer, Verstegen and Tamminga2005). Each bottle contained 84 ml of incubation medium mixed with 5 ml of filtrated rumen fluid. Bottles were directly placed into a shaking water bath (Haake SWB25, Clausthal-Zellerfeld, Germany) at 39°C, connected to the automated GP system.
The incubation substrate (0.5 g) was a TMR of grass silage, maize silage and one of the three concentrates at a 30 : 40 : 30 ratio on a DM basis. Silages were dried at 60°C and all components were ground to pass a 1-mm screen before incubation. The three different substrate components were weighed separately into each bottle and originated from the same batches that were fed to the animals (Table 1). In each of the six runs, 90 bottles were incubated for 48 h (nine cows×three substrate components×three replicate bottles per cow–substrate combination, and in addition also one blank bottle for each donor cow). Total GP was continuously measured in triplicate and CH4 concentration was measured in duplicate at 2, 4, 6, 8, 10, 12, 14, 16, 24, 36 and 48 h of incubation for all inoculum×substrate combinations.
Sampling and analyses of fermentation fluid and gas
CH4 was determined using gas chromatography (see Ellis et al., Reference Ellis, Bannink, Hindrichsen, Kinley, Pellikaan, Milora and Dijkstra2016 for details). At the end of each 48-h incubation, bottles were placed on ice and a subsample (0.6 ml) of fermentation fluid was mixed with an equal volume of ortho-phosphoric acid, containing isocaproic acid as internal standard, and stored at −20°C pending VFA analysis. The VFA were separated by gas chromatography using a 30 m×0.53 mm×1.0 μm Agilent J&W HP-FFAP (Santa Clara, CA, USA) column, hydrogen as mobile phase and a flame ionization detector. The residual incubation substrates were analysed for DM and ash following Williams et al. (Reference Williams, Bosch, Boer, Verstegen and Tamminga2005) to calculate organic matter degradation (OMD).
Calculations and curve fitting
For all analyses, the experimental unit was the average of the replicate bottles for each inoculum×substrate combination. Triplicates for each inoculum×substrate combination were visually explored for outliers. In the second run (day 1 after introduction of additives in the diets), gas data from two out of eight units of the automated GP system had to be excluded because of a technical problem. For three diet×substrate combinations (CON×LA, AR×AR and AR×LA), the gas and CH4 results of the second run are therefore based on rumen fluid from two instead of three cows.
Cumulative gas and CH4 production data were fitted with the following modified monophasic Michaelis–Menten equation (Groot et al., Reference Groot, Cone, Williams, Debersaques and Lantinga1996) using the NLIN procedure in SAS (SAS 9.2; SAS Institute Inc., Cary, NC, USA):
 $$G\,{\rm {\equals}}\,A{\rm \,/\, }\left[ {{\rm 1 {\plus} }\left( {C{\rm \,/\,}t} \right)^{B} } \right]$$
where G (ml/g organic matter (OM)) is the cumulative amount of gas or CH4 produced, A the asymptotic G (ml/g OM), B the switching characteristic of the curve, C the time at which half of the asymptotic G has been reached (half-time, h) and t the time during the in vitro incubation (h). Measured CH4 concentrations in individual bottles were expressed relative to the maximum concentration in each bottle and fitted with the monophasic Michaelis–Menten model, with further details presented by Pellikaan et al. (Reference Pellikaan, Hendriks, Uwimana, Bongers, Becker and Cone2011). Unlike the model estimated kinetic parameters for gas- and CH4 production, VFA concentration and OMD are endpoint measurements only. As technical issues with the recording of gas and CH4 do not affect these parameters, no VFA and OMD data were excluded.
Statistical analysis
All data were analysed using PROC MIXED (SAS 9.2). Two-day averages of individual cow data for DMI, milk production and milk composition at each incubation day (−4, 1, 4, 8, 15 or 22 days relative to the introduction of the additives in the diets) were analysed using a model containing block, diet, day and diet×day interaction as fixed effects. Repeated measures for each cow×diet combination were accounted for. Data on gas and CH4 production parameter estimates, VFA and OMD for each cow×diet×substrate combination were averaged per incubation day and analysed using repeated measures ANOVA. Block and the main effects of diet, substrate and day and their interactions were included as fixed effects. In all statistical analyses, a spatial power covariance structure was fitted, because of unequal time intervals between incubation days. Denominator degrees of freedom were estimated using the Kenward–Roger method. In case of significant interaction terms, between-treatment comparisons for each incubation day, or between-day comparisons within treatments, were made using a SLICE statement and P-values were corrected using the Tukey–Kramer method. Results are reported as least squares means. Significance of effects was declared at P⩽0.05 and trends at 0.05<P⩽0.10.
Results and discussion
The objective of this study was to examine adaptation to CH4-mitigating feed additives with different modes of action in vivo using the in vitro GP technique. The selection of AR and C12:0 as feed additives for the present study was based on a pilot study (data not shown) in which the following substrates were screened for their potential to reduce CH4 production in vitro: AR, C12:0, activated charcoal, l-ascorbic acid, coconut oil, krabok oil and myristic acid (C14:0). The additive selection for the pilot study was based on recent literature (Benchaar and Greathead, Reference Benchaar and Greathead2011; Hansen et al. Reference Hatew, Podesta, Van Laar, Pellikaan, Ellis, Dijkstra and Bannink2012; Panyakaew et al., Reference Panyakaew, Goel, Lourenço, Yuangklang and Fievez2013; O’Brien et al., Reference O’Brien, Navarro-Villa, Purcell, Boland and O’Kiely2014) and unpublished data from our research group.
Dry matter intake and milk yield
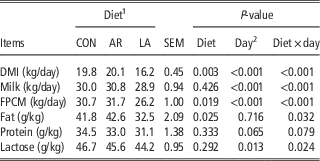
DMI was similar for all treatments on days −4 and 1. From day 4 onwards, DMI of LA cows was significantly lower than for CON and AR, which resulted in a significant diet×day interaction for DMI (Table 2). A DMI depression after supplementation with medium-chain fatty acids (MCFA) is frequently reported in literature. As discussed by Faciola and Broderick (Reference Faciola and Broderick2014), dosage, delivery method and characteristics of the basal diet all affect the DMI response to C12:0, and comparison of effect of doses among experiments is, therefore, complicated. In their study, 13 g C12:0 /kg DM did not affect DMI, but did reduce total tract digestibility of NDF. Dohme et al. (Reference Dohme, Machmüller, Wasserfallen and Kreuzer2001) found that MCFA, in particular C10:0 and C12:0, supplemented at 50 g/kg DM, negatively affected NDF degradation using the rumen simulation technique. A treatment×day interaction was also observed for FPCM yield, which declined from day 8 onwards in cows receiving the LA diet. Based on the extent of the observed milk fat depression, it is likely that not only the lower DMI, but also impaired fibre digestion contributed to the lower FPCM yield of LA cows.
Average dry matter intake (DMI), milk production and milk composition of dairy cattle fed the control diet (CON) or a diet with Agolin Ruminant® (AR) or lauric acid (LA) as feed additives

FPCM=fat- and protein-corrected milk.
1 CON (no additive), AR (0.05 g/kg dry matter (DM)) or LA (C12:0) (30 g/kg DM).
2 Relates to each day an in vitro run was conducted (−4, 1, 8, 15 and 22 days relative to the introduction of the additives in the diets).
In vitro gas and methane production
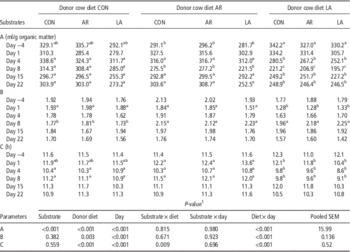
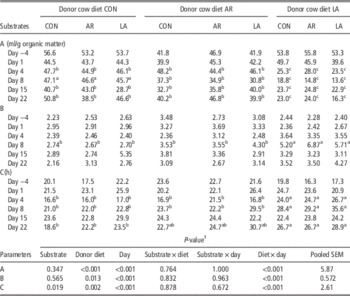
The asymptotic GP (ml/g OM incubated) was lower for the LA substrate, but did not differ between AR and CON substrate (Table 3). No substrate×day or substrate×diet interactions were found (except for a substrate×diet interaction for GP half-time), indicating that the effect of the LA substrate on GP was largely constant throughout the experiment and independent of the effect of donor cow diets. The half-time of CH4 production, but not the asymptotic CH4 production, was affected by substrate (Table 4). The effect of donor cow diet on gas and CH4 production varied after introduction of an additive in the diet, which resulted in a significant diet×day interaction. Using rumen fluid at day −4 from cows assigned to the AR diet resulted in a lower (P=0.003) GP compared with cows assigned to the LA diet. This difference on day −4 was unexpected, because all cows received the same basal diet. However, no between-diet differences were observed on day 1 (less than 24 h after introduction of the additives in the diets). From day 4 onwards, the LA diet always resulted in a lower (P<0.05) gas and CH4 production than the CON or AR diet. The findings of Zhou et al. (Reference Zhou, Meile, Kreuzer and Zeitz2013) using pure ruminal Methanobrevibacter ruminantium cell suspensions support such a delay in the effect of C12:0. A significant effect of C12:0 on survival was observed after 3 h, and after 24 h almost all M. ruminantium cells were dead, which indicates a delay in the effect of C12:0 on cell death. Results of the present study indicate that similar effects may be present in a mixed culture environment.
Average gas production curve fit parameters for each combination of donor cow diet (top row) and incubation substrate (second row) during 48-h incubations at −4, 1, 4, 8, 15 and 22 days relative to the introduction of the additives in the diets of the donor cows

A=asymptotic gas production, ml/g organic matter incubated; B=switching characteristic of the curve; C=time at which half of the asymptotic gas production has been reached (half-time).
Composition of the incubation substrates (g/kg dry matter (DM)) was similar to the experimental diets: Control (CON), Agolin Ruminant® (AR; 0.05 g/kg DM) or lauric acid (LA; 30 g/kg DM).
a,b,cSignificance of diet×day interaction term. Diets within rows with different superscripts are significantly (P<0.05) different from each other.
1 P-value for substrate×diet×day interaction non-significant (P>0.05) and not presented.
Average gas production curve fit parameters of methane (CH4) production for each combination of donor cow diet (top row) and incubation substrate (second row) during 48-h incubations at −4, 1, 4, 8, 15 and 22 days relative to the introduction of the additives in the diets of the donor cows

A=asymptotic gas production; B=switching characteristic of the curve; C=time at which half of the asymptotic gas production has been reached (half-time).
Composition of the incubation substrates (g/kg dry matter (DM)) was similar to the experimental diets: Control (CON), Agolin Ruminant® (AR; 0.05 g/kg DM) or lauric acid (LA; 30 g/kg DM).
a,b,cSignificance of diet×day interaction term. Diets within rows, with different superscripts are significantly (P<0.05) different from each other.
1 P-value for substrate×diet×day interaction non-significant (P>0.05) and not presented.
Asymptotic gas and CH4 production from rumen fluid of cows on the AR diet differed (P<0.05) from that of cows on the CON diet on day 8 but not on days 15 and 22. The latter observation may indicate adaptation to effects of AR in the diet. A tendency for a reduced CH4 production in g/day and g/kg DMI in dairy cows, but not in beef cattle, fed 1.0 g AR per day was reported by Castro-Montoya et al. (Reference Cardozo, Calsamiglia, Ferret and Kamel2015). One of the components of AR is eugenol, a phenolic compound that has antimicrobial effects on gram-positive and gram-negative bacteria (Calsamiglia et al., Reference Calsamiglia, Busquet, Cardozo, Castillejos and Ferret2007). In a dose response experiment, eugenol did not affect in vivo CH4 production of dairy cattle (Benchaar et al., Reference Benchaar, Hassanat and Petit2015). In the latter study, the CH4 measurement period was preceded by an 18-day adaptation period to the experimental diets. Based on the observations in the present study, the absence of an effect of eugenol in the experiment of Benchaar et al. (Reference Benchaar, Hassanat and Petit2015) may be a result of adaptation to the additive. In an in vitro study of Durmic et al. (Reference Durmic, Moate, Eckard, Revell, Williams and Vercoe2013), AR significantly reduced CH4 production (ml/g DM) by almost 30% when added to rumen fluid from non-adapted sheep at a 10-fold higher dose (0.1 mg/g substrate) than used in the present experiment. In contrast to such observations, Pirondini et al. (Reference Pirondini, Colombini, Malagutti, Rapetti, Galassi, Zanchi and Crovetto2015) found no effect of AR on in vitro CH4 production using rumen fluid from non-adapted cows. The dose of AR was similar to the dose used in the present study, but it was dissolved in ethanol before incubation. This was not done in the present experiment, as this would not mimic in vivo conditions.
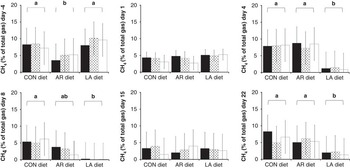
Effects of additives on gas and CH4 production may appear at initial stages of in vitro fermentation only, and be absent at the end of the incubation (48 h) (Ellis et al., Reference Ellis, Bannink, Hindrichsen, Kinley, Pellikaan, Milora and Dijkstra2016). Endpoint in vitro measurements may not reflect substrate degradation and gas and CH4 production in vivo because retention time of feed in the rumen may differ from the endpoint retention time in vitro. Therefore, we examined the in vitro CH4 to total gas ratio after 12-h incubation for all diet×substrate combinations on all six measurement days (Figure 1). The numerical difference between the CON and AR diet was larger on day 8 than on days 15 and 22, but variation was also large and therefore the difference was not significant (P=0.112). Compared with days −4 and 1, the CH4 to total gas ratio with the LA diet was significantly reduced from day 4 onwards, to almost 0 at day 8, and to increase again on days 15 and 22. The difference in CH4 to total gas ratio between day 8 on the one hand and day 15 or day 22 on the other is not significant, indicating that for the duration of the present trial (22 days) the CH4 reducing effect of C12:0 in the diet persisted. The greater half-time for CH4 production from the LA diet at day 8 compared with day 15, but not when compared with day 22, may indicate that the CH4 depressing effect is not fully persistent.
In vitro methane (CH4) production (% of total gas) at 12 h after the start of the incubation on days −4, 1, 4, 8, 15 and 22 relative to the introduction of the additives in the diets of the donor cows. Donor cow diets were as follows: Control (CON; no additive), Agolin Ruminant ® (AR; 0.05 g/kg dry matter (DM)) and lauric acid (C12:0) (LA; 30 g/kg DM). Incubation substrates CON (black bars), AR (dotted bars) and LA (white bars) were similar to the three donor cow diets and consisted of the same diet components. Error bars indicate pooled SEM. Statistical analysis indicated a significant effect of diet (P<0.001), of substrate (P=0.825), of day (P<0.001) and of diet×day (P<0.001) (substrate×diet, P=0.969; substrate×day, P=0.997; substrate×diet×day, P=0.997). Superscripts indicate between-diet differences within runs. Within diet CON, days 1 and 15 differed from days −4, 4, 8 and 22. Within diet AR, day 4 was significantly different from days 8 and 15. Within diet LA, day −4 differed significantly from all other days, and day 1 was significantly different from day 8.

Results on CH4 production in vitro should be interpreted with care and may not reflect the in vivo situation (Flachowsky and Lebzien, Reference Flachowsky and Lebzien2012). The relationship between in vitro and in vivo CH4 production may also depend on the units of expression of CH4 production. In an experiment in which rumen inocula was obtained from dairy cattle adapted to the same experimental diet as incubated in vitro, Hatew et al. (Reference Hatew, Cone, Pellikaan, Podesta, Bannink, Hendriks and Dijkstra2015a) reported CH4 production in vitro (ml/g OM incubated) to be moderately related (R 2=0.54) with in vivo CH4 production (ml/g of estimated rumen-fermentable OM). However, no association was found when in vivo CH4 production was expressed per unit of ingested OM (R 2=0.05). Thus, even inoculum obtained from specifically adapted animals may still lead to large differences between CH4 production observed in vitro and in vivo.
Volatile fatty acids and in vitro organic matter degradability
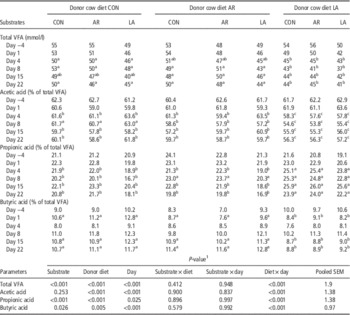
Overall, significant diet×day interactions indicate that the LA diet reduced VFA concentrations and relative molar proportions of acetate and butyrate in fermentation fluid, and increased molar proportions of propionate, for all three substrates from day 4 onwards (Table 5). Such changes in VFA molar proportions correspond to an observed reduction in CH4 production. Reductions in VFA concentration and acetate molar proportion following C12:0 supplementation have been reported previously (Hristov et al., Reference Hristov, Oh, Firkins, Dijkstra, Kebreab, Waghorn, Adesogan, Yang, Tricarico, Lee, Gerber, Henderson and Makkar2011; Faciola and Broderick, Reference Faciola and Broderick2014). Similar effects were observed for filtrated rumen fluid before incubation after introduction of C12:0 into the diet of the cows (data not shown). Only 5 ml of rumen fluid was added to 84 ml buffer solution, and thus this similarity in results may indicate that the microbial composition of the rumen fluid was affected by the donor cow diets. However, microbial composition of rumen fluid was not measured in the present experiment.
Average concentrations and molar proportions of volatile fatty acids (VFA) in fermentation fluid for each combination of donor cow diet (top row) and incubation substrate (second row) at the end of 48-h incubations at −4, 1, 4, 8, 15 and 22 days relative to the introduction of the additives in the diets of the donor cows

Composition of the incubation substrates (g/kg dry matter (DM)) was similar to the experimental diets: Control (CON), Agolin Ruminant® (AR; 0.05 g/kg DM) or lauric acid (LA; 30 g/kg DM).
a,b,cSignificance of diet×day interaction term. Diets within rows, with different superscripts are significantly (P<0.05) different from each other.
1 P-value for substrate×diet×day interaction non-significant (P>0.05) and not presented.
Compared with the CON diet, the acetate and propionate molar proportions for the AR diet were significantly lower and higher, respectively, on day 8 only, whereas total VFA concentration in fermentation fluid was not different. This shift in relative proportions of VFA is in line with the results for CH4 production on this day. Similar to the absence of differences in CH4 production between the CON diet and the AR diet at days 15 and 22, the relative proportions of acetate and propionate also did not differ between AR and CON at days 15 and 22. Benchaar et al. (Reference Benchaar, Hassanat and Petit2015) and Pirondini et al. (Reference Pirondini, Colombini, Malagutti, Rapetti, Galassi, Zanchi and Crovetto2015) found no treatment effect of eugenol or AR on total VFA concentrations or acetate : propionate ratio, which is in line with the absence of a CH4 reduction in their studies.
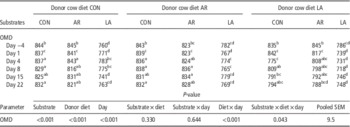
The OMD results (Table 6) generally are in line with the data of the in vitro gas and CH4 production and VFA concentration for the various diet×substrate combinations. A significant substrate×diet×day interaction was observed, with the OMD results for the CON and AR diets being fairly consistent over time, whereas OMD was reduced for both the LA diet and by the LA substrate at various time points (Table 6). The latter is in line with earlier findings in vitro (Dohme et al., Reference Dohme, Machmüller, Wasserfallen and Kreuzer2001) and in vivo (Faciola and Broderick, Reference Faciola and Broderick2014).
Organic matter degradability (OMD; g/kg organic matter incubated) for each combination of donor cow diet (top row) and incubation substrate (second row) at the end of 48-h incubations at −4, 1, 4, 8, 15 and 22 days relative to the introduction of the additives in the diets of the donor cows

Composition of the incubation substrates (g/kg dry matter (DM)) was similar to the experimental diets: Control (CON), Agolin Ruminant® (AR; 0.05 g/kg DM) or lauric acid (LA; 30 g/kg DM).
a,b,c,dSignificance of substrate×diet×day interaction term. Diet×substrate combinations within rows, with different superscripts are significantly (P<0.05) different from each other.
Conclusions
The LA diet persistently reduced in vitro gas and CH4 production from day 4 onwards, but also decreased DMI and FPCM production of the donor cows. No negative effects on DMI and FPCM production were observed in cows receiving the AR diet. In vitro gas and CH4 production was reduced by the AR diet on day 8, but not on days 15 and 22, which may indicate a short-term effect of AR on CH4 production and adaptation of the rumen microbial ecosystem to AR. Overall, in vitro GP determinations were variable over time and seem to depend more strongly on the diet fed to the rumen fluid donor animals than on the single substrates. Data obtained from in vitro analyses should therefore be confirmed in vivo before drawing definite conclusions.
Acknowledgements
Staff of the experimental facilities ‘Carus’ (Wageningen, the Netherlands) and laboratory staff of Wageningen UR Animal Nutrition Group are gratefully acknowledged for their assistance during the implementation of the experiment. This study is part of the Low Emission Animal Feed project. The authors acknowledge financial support of the Dutch Ministry of Economic Affairs (the Hague, the Netherlands), the Product Board Animal Feed (Zoetermeer, the Netherlands) and the Dutch Dairy Board (Zoetermeer, the Netherlands).