Implications
Combining several reduction statistics (Delta, F st and principal component analyses (PCA)) with Random Forest (RF) classification we could select and test population informative single nucleotide polymorphism (SNP) panels containing 96 and 48 SNPs. Single nucleotide polymorphisms were selected among about 50 000 markers analysed in 3304 cattle from six breeds (three cosmopolitan and three autochthonous). The obtained SNP panels might be suitable for breed authentication of cattle-derived products and breed allocation with a low-error rate. The statistical approaches used in this study introduce a useful methodology that can be extended when it is needed to select informative SNPs.
Introduction
The variability within and among livestock populations is the result of natural and artificial selection, genetic drift and admixture events that have contributed to shape the genetic uniqueness and diversity of many different breeds (Notter,Reference Notter1999; Andersson and Georges, Reference Andersson and Georges2004; Decker et al. Reference Decker, McKay, Rolf, Kim, Molina Alcalá, Sonstegard, Hanotte, Götherström, Seabury, Praharani, Babar, Correia de Almeida Regitano, Yildiz, Heaton, Liu, Lei, Reecy, Saif-Ur-Rehman, Schnabel and Taylor2014). Commercial SNP genotyping tools have been recently developed for several species, including cattle, providing information from many polymorphic sites (Matukumalli et al., Reference Matukumalli, Lawley, Schnabel, Taylor, Allan, Heaton, O’Connell, Moore, Smith, Sonstegard and Van Tassell2009). These tools can be used to identify informative markers, creating reduced panels that might be able to differentiate breeds and populations for several downstream applications. Part of these applications could be breed allocation of individuals, breeds of origin of crossbred animals, authentication of mono-breed products and comparative analyses of selection signatures (Wilkinson et al., Reference Wilkinson, Wiener, Archibald, Law, Schnabel, McKay, Taylor and Ogden2011; Bertolini et al., Reference Bertolini, Galimberti, Calò, Schiavo, Matassino and Fontanesi2015).
To identify the most discriminating genetic markers among thousands of genotyped SNPs, a few statistical approaches have been proposed. For example, one of the simplest method uses the Delta values that are the absolute allele frequency differences at each polymorphic site in pairwise comparisons between populations (Shriver et al., Reference Shriver, Smith, Jin, Marcini, Akey, Deka and Ferrell1997; Smith et al., Reference Smith, Lautenberger, Shin, Chretien, Shrestha, Gilbert and O’Brien2001). Delta analysis has been explored by Wilkinson et al. (Reference Wilkinson, Wiener, Archibald, Law, Schnabel, McKay, Taylor and Ogden2011) and Hulsegge et al. (Reference Hulsegge, Calus, Windig, Hoving-Bolink, Maurice-van Eijndhoven and Hiemstra2013) to find informative SNPs in several cattle breeds. Another statistic useful for these purposes is Wright’s F st analysis that measures the standardized variance in allele frequencies among populations (Wright, Reference Wright1951). F st has been extensively applied to identify informative genetic markers and population structures in humans and livestock species, including cattle (e.g. Bowcock et al., Reference Bowcock, Ruiz-Linares, Tomfohrde, Minch, Kidd and Cavalli-Sforza1994; Wilkinson et al., Reference Wilkinson, Wiener, Archibald, Law, Schnabel, McKay, Taylor and Ogden2011; Hulsegge et al., Reference Hulsegge, Calus, Windig, Hoving-Bolink, Maurice-van Eijndhoven and Hiemstra2013). A third approach is the PCA that is an unsupervised linear technique for dimension reduction and allows to extract axes of maximal variation from data sets (Jolliffe, Reference Jolliffe2002; Jolliffe and Cadima, Reference Jolliffe and Cadima2016). Principal component analysis has been already used in human populations to characterize their structure based on SNP genotyping data (Paschou et al., Reference Paschou, Ziv, Burchard, Choudhry, Rodriguez-Cintron, Mahoney and Drineas2007) and in cattle to reduce dimensionality of large SNP data sets and to identify breed informative SNPs (Lewis et al., Reference Lewis, Abas, Dadousis, Lykidis, Paschou and Drineas2011; Wilkinson et al., Reference Wilkinson, Wiener, Archibald, Law, Schnabel, McKay, Taylor and Ogden2011; Bertolini et al., Reference Bertolini, Galimberti, Calò, Schiavo, Matassino and Fontanesi2015).
These pre-filtering steps normally are coupled with approaches that can classify and assign breeds or individuals. One of these methods is the RF approach, that is an algorithm used for classification and regression and is based on an ensemble of low-correlated decision trees (Breiman, Reference Breiman2001). To guarantee low correlation among decision trees, each tree is built on a different randomly perturbed version of the data set. In a classification context, RF allows to assign an unknown sample to a pre-determined group. This classification technique has been used for genome-wide association studies (GWAS) in case and control analyses for a few human diseases (e.g. Lunetta et al., Reference Lunetta, Hayward, Segal and Van Eerdewegh2004; Jiang et al., Reference Jiang, Tang, Wu and Fu2009), and more recently it has been tested to perform association analyses on sheep pigmentation, comparing and combining RF with most traditional GWAS methodologies (Kijas et al., Reference Kijas, Serrano, McCulloch, Li, Salces Ortiz, Calvo and Pérez-Guzmán2013). We recently applied RF to predict breed allocation using SNP chip data on four major cattle breeds after a marker preselection obtained by using PCA performed chromosome by chromosome to reduce the dimensionality of the data set (Bertolini et al., Reference Bertolini, Galimberti, Calò, Schiavo, Matassino and Fontanesi2015). In our previous study, we evaluated the performance of this SNP selection procedure (PCA-chrom+RF) in a few breeds showing that breed classification can be obtained without any error. This strategy could identify informative SNPs that had also been located in genes or close to genes that are known to affect breed-specific traits.
In this work, we extended our previous study by testing and comparing several methods of SNP preselection (Delta, F st and PCA) in addition to RF classifications to analyse thousands of SNP genotypes from several cattle breeds, including cosmopolitan (Holstein, Brown and Simmental) and autochthonous (Cinisara, Modicana and Reggiana) breeds. These latter breeds are raised in the Italian regions of Sicily (Cinisara and Modicana) and Emilia Romagna (Reggiana). They have been adapted for a long time to local environmental conditions and their milk is used to produce mono-breed protected designation of origin cheeses. For each preselection approach (Delta, F st and PCA), reduced panels of 96 and 48 SNPs have been created and evaluated in terms of ability to discriminate both cosmopolitan and autochthonous breeds using RF classification. Linkage disequilibrium (LD) within the selected SNP panels has been also evaluated. Moreover, we analysed the gene content of the regions nearby the selected SNPs, showing that several of them are close to genes that might be responsible for defining breed-specific traits or other economically important traits.
Material and methods
Data set description
A total of 3304 animals belonging to cosmopolitan cattle breeds (2091 Holstein, 738 Brown and 475 Simmental), genotyped with the Illumina BovineSNP50 v1 BeadChip array (Illumina, San Diego, CA, USA) and 311 animals belonging to three Italian local cattle breeds (71 Cinisara, 72 Modicana and 168 Reggiana) genotyped with the Illumina BovineSNP50 v2 BeadChip array (Illumina) were considered for the analysis. Genotyped animals are derived from previous studies that describe in details these data sets (Mastrangelo et al., Reference Mastrangelo, Saura, Tolone, Salces-Ortiz, Di Gerlando, Bertolini, Fontanesi, Sardina, Serrano and Portolano2014 and 2016; Bertolini et al., Reference Bertolini, Galimberti, Calò, Schiavo, Matassino and Fontanesi2015). Reggiana samples represent almost all sires available for this breed (Fontanesi et al., Reference Fontanesi, Scotti, Samorè, Bagnato and Russo2015; Mastrangelo et al., Reference Mastrangelo, Tolone, Di Gerlando, Fontanesi, Sardina and Portolano2016). Several steps of filtering were applied to remove SNPs not useful for the analysis: (1) SNPs what were not shared between the two SNP chip versions; (2) SNPs that were mapped on the sex chromosomes or unmapped; (3) SNPs with call rate <0.95 in at least one breed. Minor allele frequency (MAF) was not used to pre-filter SNPs. Missing SNPs were imputed within breed using Beagle 3.3.2 (Browning and Browning, Reference Browning and Browning2007).
Validation step
Each cattle breed was divided into a reference population and a test population. The test population, generated by randomly sampling about 10% of the animals within each breed (209 Holstein, 74 Brown, 47 Simmental, 7 Cinisara, 7 Modicana and 16 Reggiana), was used for the validation of the breed assignment. However, it is worth to mention that RF does not need any cross-validation on a separate test set to get an unbiased estimate of the test set error. Error in the RF classification is estimated internally, directly during the run. Therefore, the test population could be considered a further validation of the results.
The reference population was composed by the remaining animals and was used for all reduction and allocation analyses. A multidimensional scaling (MDS) plot of the considered breeds was obtained using Plink 1.07 (Purcell et al., Reference Purcell, Neale, Todd-Brown, Thomas, Ferreira, Bender, Maller, Sklar, de Bakker, Daly and Sham2007).
Single nucleotide polymorphism reduction techniques
A total of four reduction techniques was applied to the reference population of the six investigated breeds: (i) Delta analysis; (ii) F st statistics; (iii) PCA carried out separately on SNPs assigned to each chromosome (chromosome by chromosome PCA or PCA-chrom); and (iv) PCA carried out considering at the same time all SNPs (whole genome PCA or PCA-whole). Each of the four approaches identified a reduced SNP panel including a total of 580 markers, retaining those with the highest values of the corresponding statistic for the whole genome approaches (Delta, F st, and PCA-whole) or the 20 highest ranked SNPs for each chromosome in the chromosome by chromosome approach (PCA-chrom). For this study, no pre-filtering of SNPs in LD was performed as this will be one of the parameters to evaluate the SNP panels.
Average Delta
For a biallelic marker the Delta value is given by |pAi−pAj|, where pAi and pAj are the frequencies of allele A in the ith and jth populations, respectively. Because Delta can be only estimated between pairs of populations, and the data set contained six different populations, values were averaged across all pairwise comparisons to produce an estimated value for each SNP (Wilkinson et al., Reference Wilkinson, Wiener, Archibald, Law, Schnabel, McKay, Taylor and Ogden2011).
Average F st
Breed allele frequency was calculated for each SNP. Then, for every breed combination (15 in total), F st was calculated for each marker by adapting the formula reported by Karlsson et al. (Reference Karlsson, Baranowska, Wade, Salmon Hillbertz, Zody, Anderson, Biagi, Patterson, Pielberg, Kulbokas, Comstock, Keller, Mesirov, von Euler, Kämpe, Hedhammar, Lander, Andersson, Andersson and Lindblad-Toh2007):
 $$F_{{{\rm st}_{k} }} \, {\equals}\, {{N_{k} } \mathord{\left/ {\vphantom {{N_{k} } {D_{k} }}} \right. \kern-\nulldelimiterspace} {D_{k} }}$$
where k is the SNP marker k, with frequency p 1 [k], p 2 [k]
 $$N_{k} \, {\equals}\, p_{1}^{[k]} \left( {q_{2}^{{[k]}} \, {\minus}\, q_{1}^{{[k]}} } \right){\plus}p_{2}^{{[k]}} \left( {q_{1}^{{[k]}} \, {\minus}\, q_{2}^{{[k]}} } \right)$$
 $$D_{k} \, {\equals}\, p_{1}^{{[k]}} \,q_{2}^{{[k]}} {\plus}q_{1}^{{[k]}} \,p_{2}^{{[k]}} \, {\equals}\, N_{k} {\plus}p_{1}^{{[k]}} \,q_{1} ^{{[k]}} {\plus}p_{2}^{{[k]}} \,q_{2}^{{[k]}} $$
The value of each SNP was finally averaged between the 15 breed-by-breed comparisons.
Principal component analysis
Principal component analysis was computed using the prcomp function of the R software 2.12 (http://www.R-project.org) based on SNP allele frequencies of each breed. The principal components that range from PC1 to PC5 explained 100% of the variance (Supplementary Figure S1). Therefore, they were considered for the SNP ranking and selection (see Jolliffe, Reference Jolliffe2002, for more details about the selection of the relevant principal components). The analysis was carried out autosome by autosome (PCA-chrom) and on the whole SNP list (PCA-whole) on the reference populations. According to Paschou et al. (Reference Paschou, Ziv, Burchard, Choudhry, Rodriguez-Cintron, Mahoney and Drineas2007), for each SNP marker, the scores on the five selected Principal Components were squared and summed. These quantities were used to rank the SNP markers.
Breed assignment and further reduction with Random Forest
Random Forest based on the preselected 580 SNPs for each reduction technique (Delta, F st, PCA-chrom and PCA-whole) were built on the reference population using the ‘randomForest’ package in R (Liaw and Wiener, Reference Liaw and Wiener2002; www.stat.berkeley.edu/~breiman/RandomForests/). To select the most discriminant SNPs, ranking based on the mean decrease in the Gini index implemented in the function ‘importance’ of the R package was examined. The mean decrease in the Gini index is a variable importance measure that was specifically devised for ensemble of classification trees, such as RFs. It is based on the contribution of each variable in reducing the within-node heterogeneity of a tree. These contributions are averaged over all the trees that compose the RF (see Hastie et al., Reference Hastie, Tibshirani and Friedman2009 for further details).
For each reduction technique and based on the mean decrease in the Gini index ranking of the 580-SNP panel, two different SNP panels were then created: a 96-SNP panel (a larger panel of 96 SNPs) and 48-SNP panel (a smaller panel of 48 SNPs that included the 48 highest ranked SNPs of the 96-SNP panel). For each of the reduced panel (the 96 and the 48 SNPs panels), a new RF was fitted and the corresponding Out Of Bag (OOB) error rate (a method of measuring the prediction error of the RF classifier) was by default calculated by the R package. The choice of a reduced numbers of SNPs (96 and 48 SNPs) was due to the practical possibilities to develop multiplex SNP panels that might contain a reduced number of SNPs for field applications.
Classification performance of these RFs was also assessed using the test population, not used in determining the SNP panels and for this reason considered as an independent subset of samples. For each breed, LD and MAF were calculated in the 96-SNP panels with the highest mean decrease in the Gini Index value using the software PLINK 1.07 (Purcell et al., Reference Purcell, Neale, Todd-Brown, Thomas, Ferreira, Bender, Maller, Sklar, de Bakker, Daly and Sham2007). Selected SNPs included in the 96-SNP panel with the lowest OOB were checked in the Bos taurus reference genome (UMD 3.1, GCA_000003055.3; http://www.ensembl.org/index.html). The adjacent genes before and after each selected SNP were identified using the software BEDTools (Quinlan and Hall, Reference Quinlan and Hall2010) and the most recent annotated version of the Bos taurus genome was derived by the application Biomart (http://www.ensembl.org).
Results
Population genetics overview
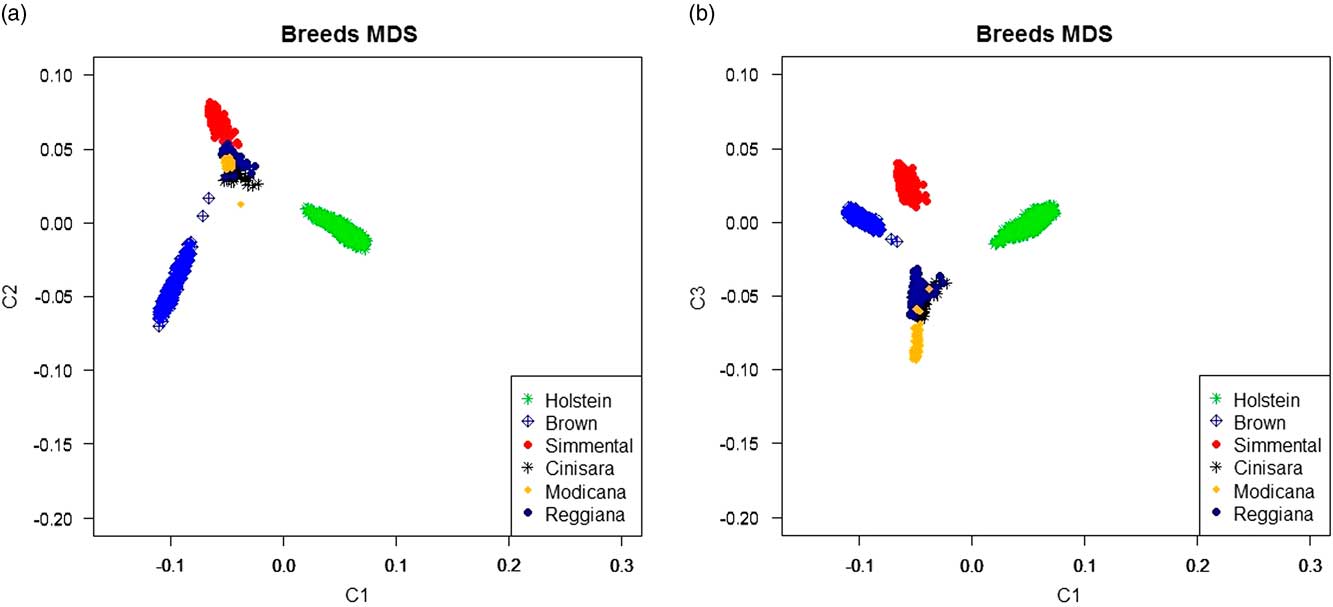
A total of 50 761 SNPs was shared between the two SNP chips and was assigned to an autosomal chromosome. Among these SNPs, 39 878 passed the final filter step of the call rate and were considered for the subsequent analyses. A multi-dimensional scaling plot considering the components 1 and 2 (Figure 1a) shows a clear separation of the three commercial breeds and a clustering of the autochthonous breeds, which is confirmed also considering the components 1 and 3 (Figure 1b). This clustering of the autochthonous breeds included not only Cinisara and Modicana breeds, that are raised in the same area, but also Reggiana breed (raised in Emilia Romagna region, Province of Reggio Emilia – North of Italy), which is located about 1300 km far away from the region of sampling of Cinisara and Modicana. Reggiana is also historically and geographically separated from the two Sicilian breeds.
Multidimensional scaling (MDS) of the six analysed breeds considering components 1 and 2 (a) and components 1 and 3 (b).

Description of the 580-single nucleotide polymorphism panels
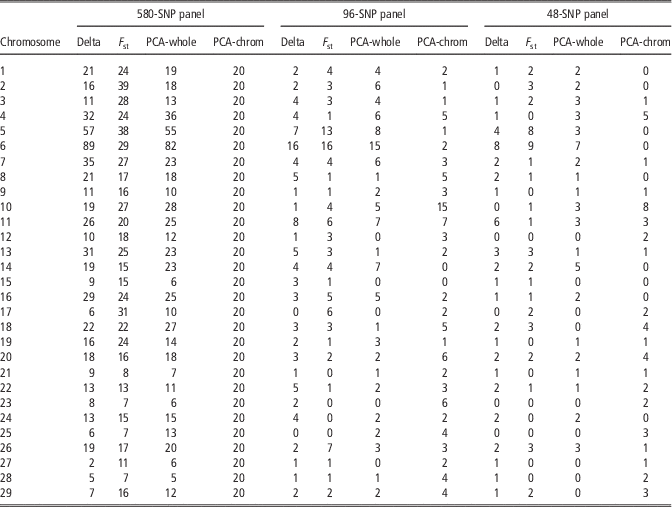
PCA-chrom selected a 580-SNP panel including 20 SNPs for each autosome, independently from the across chromosome ranking of SNPs located on each chromosome. All the three whole genome SNP preselection approaches (Delta, F st and PCA-whole), selected SNPs located in all autosomes but with different density according to the applied method (Table 1). The lowest number of retained SNPs for F st was on bovine chromosome (BTA) 27 (n=2), BTA23, BTA25, and BTA28 (n=7). Five SNPs (on BTA28) was the lowest number of preselected SNPs with the PCA-whole method. The highest numbers of preselected SNPs for both Delta and PCA-whole approaches were on BTA6 (89 and 82 SNPs, respectively). F st preselected the highest number of SNPs (39) on BTA2. A total of 51 SNPs was shared among the four 580-SNP panels (i.e. Delta, F st, PCA-whole and PCA-chrom). Delta and PCA-whole shared the highest number of preselected SNPs (340; 58.6% of the panels). Delta and PCA-chrom shared 268 common SNPs (46.2%). The two PCA approaches (PCA-whole and PCA-chrom) had 295 common SNPs (50.9%). The most divergent 580 panels were obtained by Delta and F st that shared only 15.7% of SNPs. The Venn diagram with all the combinations of shared SNPs is reported in Supplementary Figure S2a.
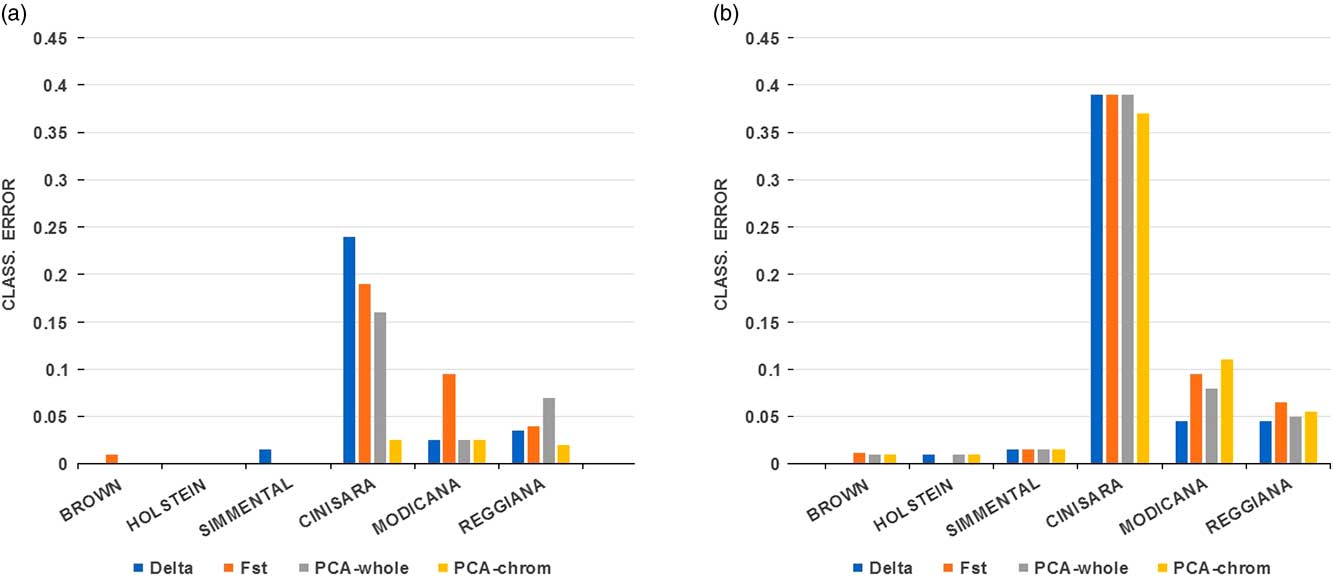
Classification error (from 0 to 1.0) of the single breeds (Brown, Holstein, Simmental, Cinisara, Modicana, Reggiana) using (a) the 96-SNP panels (b) the 48-SNP panels. SNP=single nucleotide polymorphism; PCA=principal component analyses.

Chromosome distribution of single nucleotide polymorphisms (SNPs) of the 580-SNP panel selected with the whole genome-based approaches: Delta, F st, PCA-whole (PCA-chrom has a fixed number of 20 SNPs each chromosome) and chromosome distribution of the 96-SNP panels and 48-SNP panels considering the reduction techniques from which they derived

PCA=principal component analyses.
Characteristics of the reduced SNP panels
Two reduced SNP panels (96 and 48 SNPs) were selected according to the mean decrease in Gini coefficient, where a high value means a high contribution of the SNP in shaping the structure of the trees that compose the RF, and hence in determining category assignments. These lists of SNPs are reported in the Supplementary Table S1. The 96-SNP panels contained SNPs on many different chromosomes (except: BTA17 and BTA25 for Delta; BTA21, BTA24 and BTA25 for F st; BTA12, BTA15, BTA17 and BTA27 for PCA-whole; BTA14 and BTA15 for PCA-chrom). BTA6 still contained the highest number of SNPs in Delta, F st and PCA-whole (16, 16 and 15, respectively), while the highest number of SNPs for PCA-chrom was located on BTA10, with 15 SNPs (Table 1). The reduced 48-SNP panel contained more chromosomes without SNPs: eight chromosomes for Delta; nine for PCA-chrom; 10 for F st and PCA-whole (Table 1). Again, the chromosomes with the highest number of SNPs were BTA6 for Delta, F st and PCA-whole and BTA10 for PCA-chrom (Table 1). No SNPs were common by all the four 96-SNP panels. A total of six SNPs was shared among three panels: Delta, F st and PCA-whole that shared one SNP on BTA6 (6 : 38576012); Delta, F st and PCA-chrom that shared one SNP on BTA8 (8 : 96594716) and BTA11 (11 : 67559090); Delta, PCA-whole and PCA-chrom that shared one SNP on BTA10 (10 : 19366262), BTA11 (11 : 9851948) and BTA20 (20 : 30398960). Pairs of 96-SNP panels shared from 7 to 10 SNPs (Supplementary Figure S2b), whereas pairs of 48-SNP panels only had in common two to four SNPs (Supplementary Figure S2c).
As no pre-filtering step was performed to remove SNPs in high LD, we evaluated if part of the SNP data set could include highly correlated SNPs. Considering r 2=0.6 as a threshold, the LD calculated considering all markers of the 96-SNP panels identified different numbers of SNPs in LD with r 2>0.6 among three groups, while no SNP in LD were identified in the PCA-chrom panel (Supplementary Table S1). The PCA-whole 96-SNP panel includes two SNPs on BTA25 that were in LD in Holstein and Modicana, two SNPs on BTA24 and two SNPs on BTA6 that were in LD only in Simmental. Two additional SNPs located on BTA6 (positions: 71421017 and 71452210 on UMD3.1) were in LD in Simmental, Cinisara and Reggiana. The Delta 96-SNP panel included a few SNPs in LD on BTA3 (two SNPs in Modicana), on BTA6 (two in Holstein, Brown, Modicana and Reggiana; two SNPs in Brown) and BTA22 (two SNPs in Holstein, Brown and Simmental). The largest number of SNPs in LD (n=20) in different breeds was in the list of the F st 96-SNP panel. BTA6 was the chromosome with the highest number of SNP in LD (two in Holstein, 10 in Brown, four in Cinisara, 12 in Modicana, four in Reggiana). Two of these SNPs located on BTA6 (positions: 39257620 and 39346170 in UMD3.1) and other two SNPs were in LD across all breeds (Supplementary Table S1).
Out Of Bag values in the different single nucleotide polymorphism panels
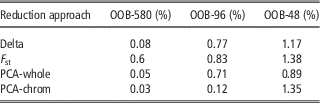
After the preselection of the 580-SNP panels, and the reduction of this list to 96 and 48-SNP panels based on their ranking in terms of informativeness, RF analyses were applied separately to the four panels with the purpose of learning a classification rule to assign animals to the six pre-defined groups (the six cattle breeds considered in this study) using information based on the three different SNP levels. Mean OOB rates using the different 580-SNP, 96-SNP and 48-SNP panels of the four reduction techniques are reported in Table 2. The highest OOB rate for the 580-SNP panel was reached by the F st approach (0.60%) whereas the lowest OOB rate was observed for the PCA-chrom approach (0.03%). PCA-whole and Delta reached 0.06% and 0.08% OOB rates, respectively.
Out Of Bag (OOB) error rate (%) of the whole training population using the single nucleotide polymorphism (SNP) panels (580, 96 and 48 SNPs) derived from the four reduction techniques

PCA=principal component analyses.
For details breed-by-breed see Figure 2.
The OOB error rates of the different preselection methods for the 96-SNP panels increased according to the following order (Table 2): PCA-chrom (0.12%), PCA-whole (0.71%), F st (0.77%) and then Delta (0.83%). The 48-SNP panel showed an expected but not linear increase of the OOB. The lowest rate was for the PCA-whole method (0.89%), followed by Delta (1.17%), PCA-chrom (1.35%) and then F st (1.38%). In Figure 2 it is shown the classification errors for each breed using the 96-SNP panels (a) and the 48-SNP panels (b). The local breeds showed the highest error rates for all preselection methods. Cinisara showed the highest number of miss-assigned animals for all approaches and for both reduced panels, reaching about 0.40 for all methods in the 48-SNP panel. The Cinisara only reached almost 100% of correct allocation using PCA-chrom with the 96-SNP panel. The Modicana showed the highest error rate using F st. The Reggiana was the local breed with the lowest error rates for both 96 and 48-SNP panels. The cosmopolitan breeds were almost always correctly assigned with the 96-SNP panels. Few errors rate values (<0.006) were observed for the 48-SNP panels while the 96-SNP panels show only a very limited number of not correctly assigned animals (error rate around 0.004). The analyses of the test populations confirmed the general low error rate of assignment, with the minimum value of 0.53% reached by PCA-chrom with the 96-SNP panel and the maximum value of 1.86% reached by Delta with the 48-SNP panel (Supplementary Table S2).
Gene annotation of the 96-SNP panels
Each SNP of the 96-SNP panel (obtained with the different approaches) was investigated to detect genes within or nearby the selected SNPs (Supplementary Table S1). A total of 39 SNPs on the Delta panel are within annotated genes, 37 SNPs for the F st panel, 45 SNPs for the PCA-whole panel, and 38 SNPs for PCA-chrom. Considering the whole list of genes, whose SNPs are within or nearby, several of those have already been shown to be associated with cattle production traits or coat colour such as the KIT proto-oncogene receptor tyrosine kinase (KIT) gene detected by PCA-whole, the kirre like nephrin family adhesion molecule 3 (KIRREL3) gene), the platelet derived growth factor receptor alpha (PDGFRA), detected by PCA-whole and PCA-chrom, the secreted phosphoprotein 1 (SPP1) detected by PCA-whole and F st, and ligand dependent nuclear receptor corepressor like (LCORL), detected by the four approaches.
Discussion
In this study, we tested several SNP reduction techniques (Delta, F st and PCA-based) combined with RF for breed assignment in a large cohort of dairy and dual purpose cattle that belong not only to cosmopolitan breeds but also to local breeds that might have been influenced by cosmopolitan breeds. Thousands of SNPs provided by a high-throughput genotyping platform were analysed in a scalable manner and their number was reduced to define sets of population informative markers useful for breed allocation. Similar reduction techniques (Delta, Wright’s F st, Weir & Cockerham’s F st and PCA-whole) were already tested in cattle, using different commercial breeds, but each represented by <30 animals (Wilkinson et al., Reference Wilkinson, Wiener, Archibald, Law, Schnabel, McKay, Taylor and Ogden2011). In that study, the reduction method that required the lowest number of SNP markers to verify the animal’s breed origin was the Wright’s F st approach, while PCA showed a lower individual assignment power. Wilkinson et al. (Reference Wilkinson, Wiener, Archibald, Law, Schnabel, McKay, Taylor and Ogden2011) did not report the level of LD among selected SNPs and how this parameter could be affected by the different statistical methods of SNP preselection. Hulsegge et al. (Reference Hulsegge, Calus, Windig, Hoving-Bolink, Maurice-van Eijndhoven and Hiemstra2013), who followed the process described by Wilkinson et al. (Reference Wilkinson, Wiener, Archibald, Law, Schnabel, McKay, Taylor and Ogden2011), did not obtain relevant differences for most statistical measures in the number of SNPs and informativeness if LD restrictions were or were not applied in selecting SNPs.
Comparing these previous findings with the approaches used in our study, the power of assignment is comparable in all the strategies, but the 96-SNP panel derived by the PCA selected chromosome by chromosome (PCA-chrom), derived and modified by Bertolini et al. (Reference Bertolini, Galimberti, Calò, Schiavo, Matassino and Fontanesi2015), reached the lowest OOB rate. The F st-based approach using a formula that slightly differed from Wilkinson et al. (Reference Wilkinson, Wiener, Archibald, Law, Schnabel, McKay, Taylor and Ogden2011) was the method with the highest number of total miss-assigned animals, and one of the highest considering the autochthonous breeds. Moreover, PCA-chrom reduced the number of SNPs with high LD limiting the need of a preselection step based on this measure. This is probably because working chromosome by chromosome reduces the risk to select multiple SNPs because they are in LD, rather than for their importance, thus reducing the risk of bias. The 96-SNP panel derived by PCA-chrom could select informative SNPs that were particularly useful for the assignment of minor breeds that reached the lowest value of OOB error even in the Cinisara, whose value was quite high in all the other panels. While Holstein, Simmental and Brown are worldwide distributed with specific breeding plans, Cinisara and Modicana are not subject to breeding programmes, whereas Reggiana is characterized by limited selection programme that has been developed during the last 20 years (Mastrangelo et al., Reference Mastrangelo, Tolone, Di Gerlando, Fontanesi, Sardina and Portolano2016; http://www.razzareggiana.it). This selection plan could have influenced the differentiation of the Reggiana breed among the others. In fact, the Reggiana was the local breed with the lowest error rates for both 96 and 48-SNP panels, closer to the cosmopolitan breeds than the local breeds. Despite this, the MDS plot does not show a clear separation among these minor breeds that clustered with each other and partially overlap the Simmental breed. This is also confirmed by the RF analysis that underlines the lowest efficiency in breed discrimination for the local breeds. Therefore, despite the reduced genetic variability in these breeds, the lack of specific breeding programme (Cinisara and Modicana) and external influences before the recent development of breed-specific consortia, might have facilitated their admixture with cosmopolitan breeds. This might point to the need of specific breeding plans that on one hand can protect genetic variability within each local breed, but on the other hand can emphasize breed-specific characteristics, increasing the value of breed-labelled products that are linked to them.
Random Forest has been recently proposed as an alternative approach to GWAS studies for simple and complex traits. In our previous work (Bertolini et al., Reference Bertolini, Galimberti, Calò, Schiavo, Matassino and Fontanesi2015), RF selected SNPs that were close to genes related to production traits. Even if the current study applied several different reduction approaches to select SNPs, they provide a confirmation of the observations of our previous work. In both studies, several genes located nearby the selected SNPs are associated with production traits and coat colour suggesting a potential role of these markers to capture phenotypic differences among the investigated breeds. The KIT gene is well known to be associated with spotted phenotypes (Reinsch et al., Reference Reinsch, Thomsen, Xu, Brink, Looft, Kalm, Brockmann, Grupe, Kühn, Schwerin, Leyhe, Hiendleder, Erhardt, Medjugorac, Russ, Förster, Reents and Averdunk1999; Fontanesi et al., Reference Fontanesi, Tazzoli, Russo and Beever2010b) and markers within this gene have already been proposed for breed traceability including the Reggiana breed (Fontanesi et al., Reference Fontanesi, Scotti and Russo2010a and 2015). The KIRREL3 gene was recently located in a breed-specific large-effect pleiotropic QTL, after analyzing 10 different US breeds (Saatchi et al., Reference Saatchi, Schnabel, Taylor and Garrick2014). The PDGFRA gene was associated with milk composition (Cole et al., Reference Cole, Wiggans, Ma, Sonstegard, Lawlor, Crooker, Van Tassell, Yang, Wang, Matukumalli and Da2011) and the SPP1 gene was associated with growth-related traits (Cohen-Zinder et al., Reference Cohen-Zinder, Seroussi, Larkin, Loor, Everts-van der Wind, Lee, Drackley, Band, Hernandez, Shani, Lewin, Weller and Ron2005; Allan et al., Reference Allan, Thallman, Cushman, Echternkamp, White, Kuehn, Casas and Smith2007). The LCORL gene, which was found using all the reduction approaches, is strongly related to body weight/height in several species including cattle (Takasuga, Reference Takasuga2016).
The results obtained showed that when increasing the number of breeds the error rate increases mainly for local breeds, probably as a consequence of their admixed origin or lower selection pressure that did not fix many SNPs. The 96-SNP panel constituted by the approach of applying PCA chromosome by chromosome, derived by our previous study (Bertolini et al., Reference Bertolini, Galimberti, Calò, Schiavo, Matassino and Fontanesi2015) and implemented here is the panel with the lowest error rate and the lowest number of SNPs in LD with each other. The applicability of reduced SNP panels with low classification error rate is therefore still possible also for autochthonous breeds in which the total or partial lack of selection programmes have not shaped the genome as it might be the case for cosmopolite breeds. Many selected SNPs are located close to genes that are important for several economic and breed-specific traits, confirming the possibility of using RF as an alternative and complementary approach to identify indirectly putative selection signature regions in the investigated populations.
In conclusion, our study tested different solutions for SNP preselection and identified which one of those, in combination with RF, allowed the definition of the most breed informative 96 and 48-SNP panels. PCA-chrom preselection method, previously applied on cosmopolitan breeds only, was confirmed to be the best preselection strategy to be combined with RF, with no SNPs in LD, and therefore would not need any previous LD-filtering steps, and its application is potentially suitable also for local admixed breeds.
Acknowledgements
This work was funded by Innovagen MiPAAF and by PON01_02249 –R& C 2007–2013 – MIUR projects.
Supplementary Material
To view supplementary material for this article, please visit https://doi.org/10.1017/S1751731117001355