1 Introduction
Wing-tip vortices generated by a finite wing continue to be of particular interest in aeronautical applications due to their significant contribution to the overall drag of an aircraft, and to their persistence in runways which poses a potential hazard and a flight safety concern in congested airports (Spalart Reference Spalart1998). Over the past few decades, considerable effort has been devoted to understanding the structure and development of wing-tip vortices in the near, intermediate and far fields, in order to design effective control strategies capable of alleviating their undesirable effects. It has been recognized in the literature that the dominant mechanisms in the natural decay of wing-tip vortices are the inherent long- and short-wave instabilities, namely Crow (Reference Crow1970) and Widnall, Bliss & Zalay (Reference Widnall, Bliss and Zalay1971) instabilities, respectively. It has been shown that perturbing the natural instabilities of a wing-tip vortex may result in an early breakup and a rapid decay of the trailing vortices in the wake. In fact, Heyes, Jones & Smith (Reference Heyes, Jones and Smith2004) studied the effect of pulsed spanwise blowing, at frequencies closer to those of the cooperative instabilities, on the structure of a wing-tip vortex. The authors were able to achieve a remarkable increase in the core radius accompanied by a decrease in the peak circumferential velocity and an increase in the core axial velocity deficit close to the trailing edge. In their study, they showed that the trajectory of the vortex could be altered by changing the angle of the jet with respect to the mid-plane of the wing. Margaris & Gursul (Reference Margaris and Gursul2006) conducted a particle image velocimetry (PIV) investigation of the effect of synthetic jet (SJ) actuation on a tip vortex using a wing equipped with several blowing slot geometries placed at different positions around the tip region. They found that the introduction of SJ actuation led to a diffuse tip vortex by reducing its maximum azimuthal velocity. However, no conclusions were drawn as to the choice of the actuation parameters and the SJ blowing locations. Greenblatt (Reference Greenblatt2012) used a different technique to control the wing-tip vortex consisting of deflecting an outboard flap mounted on a wing semi-span and then modifying the shear layer above the flap by means of SJ perturbations. The author showed that a relatively small control momentum coefficient can produce large changes in the shear layer deflection and the flap pressure distribution with relatively small changes in the local aerodynamic loads. The author also reported a substantial increase in the core axial vorticity and an overshoot in circulation with actuation. In a recent study, Dghim et al. (Reference Dghim, Ferchichi, Perez and BenChiekh2016) used a curved-nozzle SJ blowing in the spanwise direction in an attempt to diffuse a wing-tip vortex. Those authors showed that proper selection of an optimal actuation frequency, in the range of the wing-tip natural instabilities, led to a more diffuse vortex with a reduced azimuthal velocity. In their study, a single tip geometry was tested and the chord Reynolds number was limited to  $8\times 10^{4}$ with a particular focus on the near-wake region (downstream positions up to two chord lengths) using hot-wire anemometry.
It has been well documented in the literature that tip vortices exhibit a broadband, low-frequency motion of their core which is referred to as vortex meandering. This movement is characterized by a side-to-side drift of the vortex core about an average location, at frequencies much lower than those associated with turbulent motion (Corsiglia, Schwind & Chigier Reference Corsiglia, Schwind and Chigier1973; Shekarriz et al. Reference Shekarriz, Fu, Katz and Huang1993; Devenport et al. Reference Devenport, Rife, Liapis and Follin1996; Heyes et al. Reference Heyes, Jones and Smith2004; Bailey & Tavoularis Reference Bailey and Tavoularis2008). Meandering in wind tunnel flows has been attributed to free-stream background turbulence (Corsiglia et al. Reference Corsiglia, Schwind and Chigier1973; Baker et al. Reference Baker, Barker, Bofah and Saffman1974; Devenport et al. Reference Devenport, Rife, Liapis and Follin1996). Gursul & Xie (Reference Gursul and Xie1999) proposed that meandering is a by-product of the interaction of the vortex with secondary vortices. Rokhsaz, Foster & Miller (Reference Rokhsaz, Foster and Miller2000) and Jacquin et al. (Reference Jacquin, Fabre, Geffroy and Coustols2001) attributed vortex meandering to self-induced Biot–Savart induction from Kelvin–Helmholtz vortices forming in the shear layer, but suggested that the vortex induces its own motion when its trajectory is mildly perturbed. Jacquin et al. (Reference Jacquin, Fabre, Sipp, Theofilis and Vollmers2003) explained vortex meandering by the amplification of bending waves triggered by external free-stream turbulence and linear cooperative instabilities. Similarly, Beninati & Marshall (Reference Beninati and Marshall2005) found no evidence for vortex meandering but a bending wave resulting from the interaction of the vortex with free-stream turbulence. Recently, Edstrand et al. (Reference Edstrand, Davis, Schmid, Taira and Cattafesta2016) conducted both proper orthogonal decomposition (POD) and a stability analysis of a wing-tip vortex flow and suggested that the underlying mechanism of vortex meandering is mainly attributed to a self-induced instability originating in the vortex. Regardless of the source of vortex meandering, this phenomenon is known to influence the mean measured properties of a vortex and to obscure important flow features therein. In fact, it has been reported (Baker et al. Reference Baker, Barker, Bofah and Saffman1974; Devenport et al. Reference Devenport, Rife, Liapis and Follin1996; Heyes et al. Reference Heyes, Jones and Smith2004; Bailey & Tavoularis Reference Bailey and Tavoularis2008; Beresh, Henfling & Spillers Reference Beresh, Henfling and Spillers2010; Beresh, Wagner & Pruett Reference Beresh, Wagner and Pruett2012) that meander creates a smearing effect that causes the mean vortex to appear more diffuse with a reduced peak azimuthal velocity and increased artificial turbulent stresses at its core. These effects were found to be more pronounced when turbulence (Bailey & Tavoularis Reference Bailey and Tavoularis2008; Beresh et al. Reference Beresh, Henfling and Spillers2010) or low-frequency forcing (Heyes & Smith Reference Heyes and Smith2004; Margaris & Gursul Reference Margaris and Gursul2006, Reference Margaris and Gursul2010; Greenblatt Reference Greenblatt2012) were applied to the vortex.
Despite the appreciable complications that vortex meandering introduces to experimental studies, it has been shown that its effect can be removed from the measured velocity field generated by the vortex. In fact, Devenport et al. (Reference Devenport, Rife, Liapis and Follin1996) and Bailey & Tavoularis (Reference Bailey and Tavoularis2008) developed analytical techniques to correct single-point flow-field measurements and remove the meandering effect in order to recover the true velocity field of the tip vortex. However, a major limitation of these techniques is their inability to separate the effects of both coherent and random components of the turbulence fluctuations on the measured turbulence within the vortex since they rely on the assumption that all the measured turbulence within the core is essentially attributed to meandering. Heyes et al. (Reference Heyes, Jones and Smith2004) developed a more robust technique to correct for vortex meandering using PIV data. This method consists of realigning the vortex velocity fields such that the instantaneous vortex positions collocate with the mean vortex centre position, directly removing the effect of meandering while retaining the true random fluctuations of the velocity field within the vortex core. In the study reported here, the stereoscopic PIV (SPIV) technique was used to experimentally explore the behaviour of a wing-tip vortex under the effect of SJ actuation in the near- and mid-wake regions. Through a triple decomposition of the SPIV data and a POD analysis, the various physics involved in the effect of SJ actuation on the diffusion of a wing-tip-vortex structure were then identified and isolated.
2 Experimental apparatus and instrumentation
2.1 Wind tunnel set-up
The experiments were conducted in a closed-circuit, low-speed wind tunnel located in the Department of Mechanical Engineering at the Université de Sherbrooke (Canada). The wind tunnel has a test cross-section of  $1.82\times 1.82~\text{m}^{2}$. The flow in the empty wind tunnel is uniform to within
 $\pm 3\,\%$ at about 0.2 m away from the walls, and has a turbulence level of less than 0.5 %. The model used in this study is a rectangular planform half-wing with a NACA 0012 airfoil section. The square-tipped half-wing has a chord
 $c_{w}=0.3~\text{m}$ and a semi-span
 $b/2=0.9~\text{m}$, corresponding to an aspect ratio
 $AR=3$. The origin of the coordinate system was anchored to the wing tip at the quarter-chord location with
 $X$,
 $Y$ and
 $Z$ axes aligned, respectively, with the streamwise, spanwise and transverse directions of the wind tunnel reference frame. Moreover, the local Cartesian coordinate system,
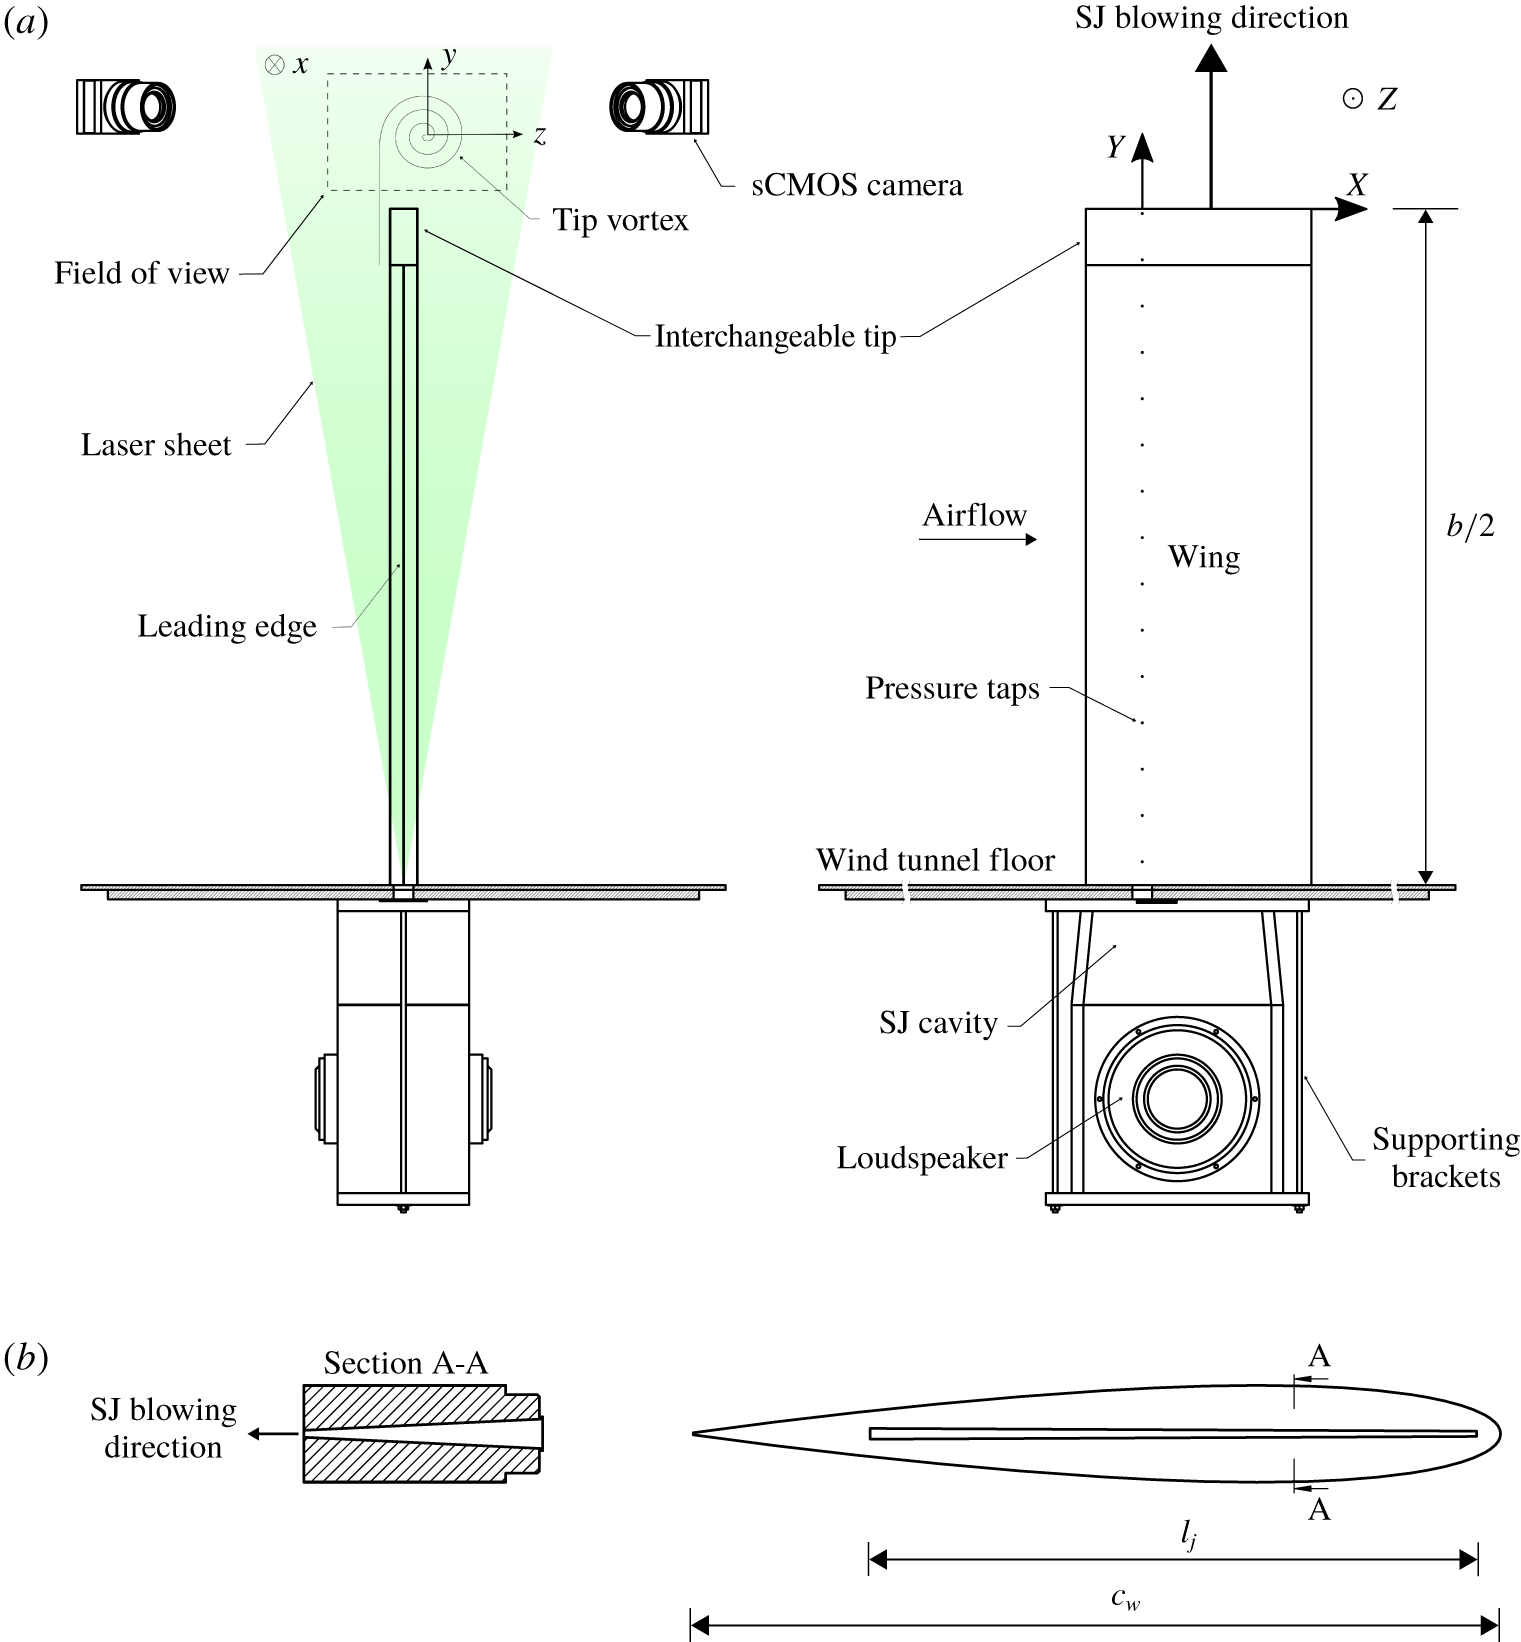
 $(x,y,z)$, was defined at each field of view such that its origin moved along with the ensemble-averaged axis of the vortex (figure 1a). The half-wing was manufactured from glass-filled nylon powder using a high-resolution three-dimensional printer (Synergeering Group LLC). It has a hollow rectangular chamber throughout the wingspan for the supply of airflow generated by loudspeakers. The cavity consisted of a contraction nozzle placed outside the wind tunnel where two loudspeakers (Visaton GF200) were attached. The loudspeakers were controlled by a function generator connected to a power amplifier (QSC PLX 2402). The blowing slot at the wing tip was in fluidic communication with the hollow plenum. The slot has a trapezoidal shape of 2 mm in height close to the leading edge and 4 mm in height near the trailing edge, as illustrated in figure 1(b). The total slot length,
 $l_{j}$, was about 0.23 m. The edges of the slot were located at
 $X/c_{w}=-0.2$ and
 $X/c_{w}=0.55$ relative to the coordinate system. The slot was designed such that the exit velocity is non-uniform along the chord direction. The design of the slot shape takes into account the decreasing angular velocity of the rolling vortex along the wing chord as reported previously (Chow, Zilliac & Bradshaw Reference Chow, Zilliac and Bradshaw1997; Birch & Lee Reference Birch and Lee2005; Holloway & Richardson Reference Holloway and Richardson2007). Furthermore, Dghim et al. (Reference Dghim, Ferchichi, Graveline and BenChiekh2014) showed that the non-uniform velocity generated by the SJ along the chordwise direction induced increased turbulence levels within the vortex core region which led to a higher turbulent mixing and consequently an effective diffusion of the vortex. The experiments were carried out at an angle of attack of
 $5^{\circ }$ and a chord Reynolds number,
 $Re_{c_{w}}$, of about
 $2\times 10^{5}$.
(a) Schematic of the experimental set-up and (b) SJ slot geometry.

2.2 Stereoscopic PIV measurement
The instantaneous three components of the velocity vector field were measured using SPIV. The system consisted of a Quantel Evergreen dual-cavity laser with a maximum pulse frequency of 15 Hz emitting visible green light at a wavelength of 532 nm. The maximum pulse energy of the laser was 200 mJ. A laser light steering arm was used to deliver the laser beam to the light-sheet optics which was mounted on an optical rotary table and a two-axis traversing system. This arrangement allowed five degrees of freedom for the laser sheet, covering much of the viewing area of the test section. The airflow was seeded with water–glycol-based fog particles generated by a thermal smoke generator (Pea Soup Rocket) that produced particles with a typical diameter of  $1~\unicode[STIX]{x03BC}\text{m}$. Recording of particle image pairs was accomplished with two 16-bit double-frame sCMOS cameras having a
 $2560\times 2160~\text{px}^{2}$ sensor resolution, equivalent to a sensor size of approximately
 $16.64\times 14.04~\text{mm}^{2}$, and a pixel pitch of
 $6.5~\unicode[STIX]{x03BC}\text{m}$. The cameras were equipped with Nikon Nikkor fixed focal length of 200 mm adjusted to a numerical aperture of
 $f_{\#}=11$. A total of 2000 images were recorded in double-frame mode at a frequency of 15 Hz. The stereo calibration, self-calibration and analysis of the PIV datasets were performed using LaVision Davis 8.4®. The velocity vector fields were calculated at a final correlation window size of 32 px by 32 px with an overlap of 75 %. The resulting measurement resolution,
 $L_{m}$, was found to be 0.425 mm. Assuming that
 $r_{c}\sim 0.05c_{w}$, the ratio
 $L_{m}/r_{c}$ was estimated to be 0.04 which is well within the range (
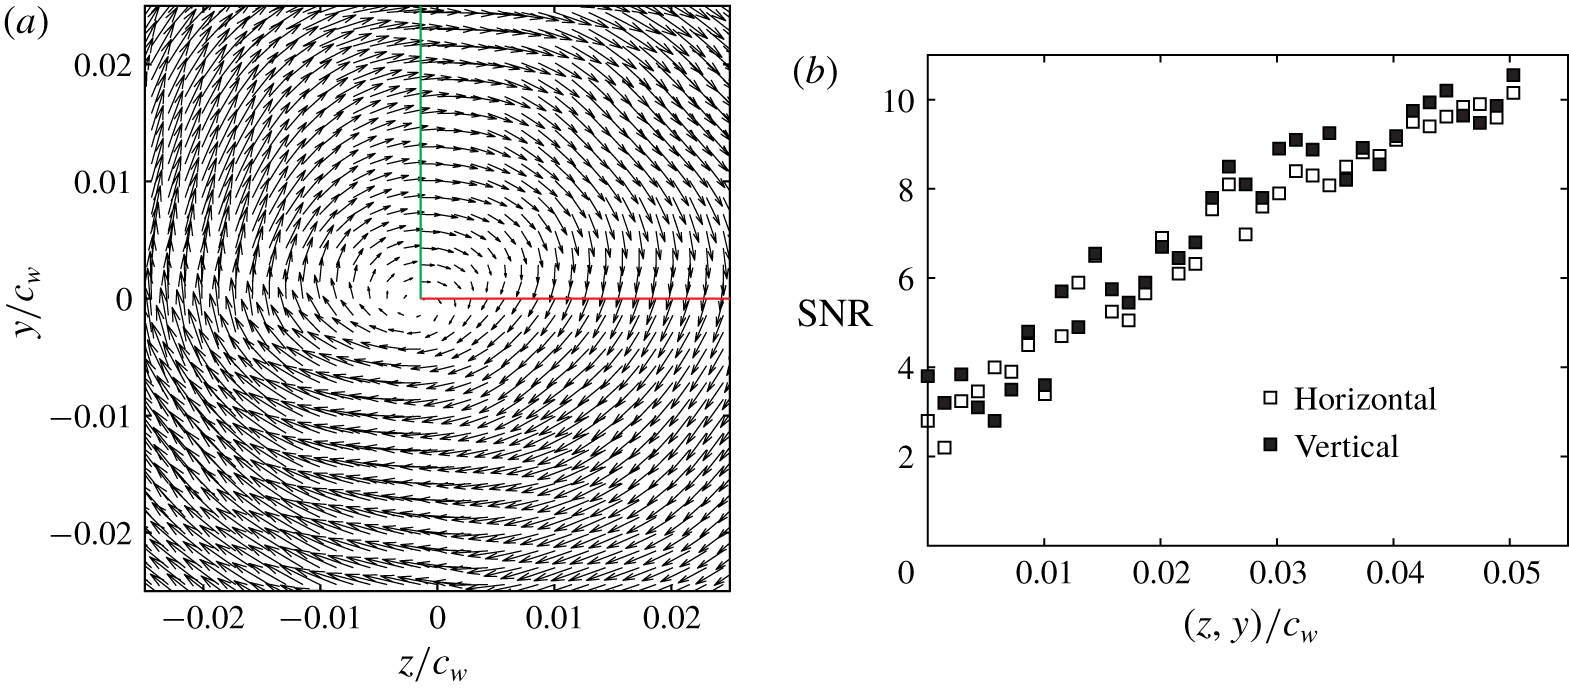
 ${<}0.2$) suggested by Grant (Reference Grant1997), Martin et al. (Reference Martin, Leishman, Pugliese and Anderson2000), Mula et al. (Reference Mula, Stephenson, Tinney and Sirohi2013) and Mula & Tinney (Reference Mula and Tinney2015) for the accurate measurement of the vortex core radius. Spurious vectors were detected by establishing a threshold of 2 for the signal-to-noise ratio (SNR), followed by the removal of group vectors (of less than five vectors) before applying a five-pass regional median filter using a universal outlier detection algorithm (Westerweel Reference Westerweel1994). A post-processed vector map of a sample raw snapshot is illustrated in figure 2(a). In this figure, horizontal and vertical lines were drawn along which the SNR was measured. Figure 2(b) depicts that recorded SNR levels were well above the specified threshold in the inner and outer regions of the vortex core. The measurement uncertainty level for the velocity vectors was estimated to be within 2 %.
(a) Post-processed vector map of a raw PIV snapshot and (b) SNR along the horizontal and vertical lines in (a).

2.3 Spectral measurement
Spectra of the velocity fluctuations were measured using a custom-built miniature cross-wire probe (Auspex Scientific, AHWX-100) with tungsten sensors having a diameter of  $5~\unicode[STIX]{x03BC}\text{m}$, a length of 0.9 mm and a nominal separating distance of about 1 mm. The two sensors were powered with a multichannel constant-temperature anemometer (TSI IFA 300). The hot-wire signals were low-pass-filtered at a cut-off frequency of 10 kHz (3 dB point) and were simultaneously digitized at a frequency of 20 kHz, using a 16-bit, 1 MHz analogue-to-digital converter (National Instruments PCI-6230). To ensure a good statistical representation of the coherent structures of the flow, records of
 $2^{20}$ data points were acquired at each measuring position. The hot-wire probe is positioned in the flow using a two-dimensional motorized traversing system (Velmex BiSlide®) having a resolution of 0.02 mm and automatically controlled by a computer.
3 Synthetic jet actuation parameters
The characterization of the SJ actuator was performed using a fast-response four-hole pressure probe (TFI Cobra®) capable of simultaneously measuring the three components of the velocity field (Mousley & Vino Reference Mousley and Vino2004). At each measurement point along the centreline of the SJ exit slot, the velocity signals consisting of  $2^{15}$ data points were sampled at 2 kHz, covering between 200 and 1000 actuation cycles. The measurement uncertainty of the four-hole pressure probe was estimated to be within 3 %.
The SJ momentum coefficient,  $C_{\unicode[STIX]{x1D707}}$, was estimated as
 $$\begin{eqnarray}C_{\unicode[STIX]{x1D707}}=\frac{A_{j}}{A_{w}}\frac{\unicode[STIX]{x1D70C}_{j}\bar{v}_{j}^{2}}{\unicode[STIX]{x1D70C}_{\infty }\bar{u}_{\infty }^{2}},\end{eqnarray}$$
where  $A_{j}$ is the slot area,
 $A_{w}$ is the half-wing planform area and
 $\bar{u}_{\infty }$ is the free-stream velocity. The SJ time- and spatial-averaged velocity scale,
 $\bar{v}_{j}$, measured along the slot centreline, was proposed by Holman et al. (Reference Holman, Utturkar, Mittal, Smith and Cattafesta2005) as
 $$\begin{eqnarray}\bar{v}_{j}=\frac{2}{T}\frac{1}{A_{j}}\int _{A}\int _{0}^{T/2}v_{j,m}(t,X)\,\text{d}t\,\text{d}A,\end{eqnarray}$$
where  $v_{j,m}$ is the peak velocity measured during the blowing phase of the SJ along the centreline of the slot exit.
The actuation frequency was non-dimensionalized as
 $$\begin{eqnarray}F^{+}=\frac{f_{a}\cdot c_{w}}{\bar{u}_{\infty }},\end{eqnarray}$$
where  $f_{a}$ and
 $c_{w}$ are the actuation frequency and wing chord, respectively.
The characteristics of the SJ actuator, used in this study, were first investigated in a quiescent free stream. The SJ centreline velocities were measured as the actuator was operated at various actuation voltages,  $v_{rms}$, ranging between 2.8 and 8.5 V, and various actuation frequencies,
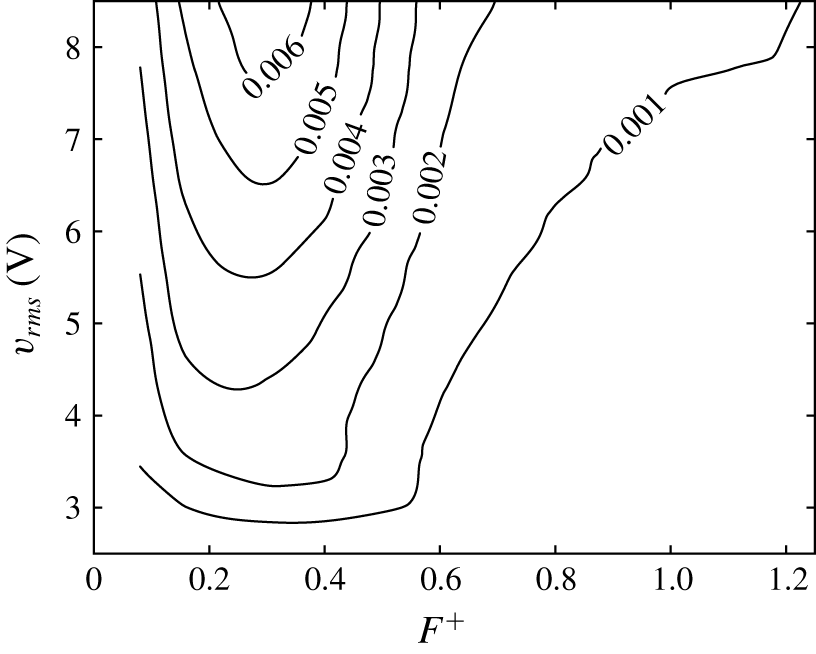
 $F^{+}$, ranging between 0.075 and 1.2. Figure 3 illustrates the contours of the momentum coefficient,
 $C_{\unicode[STIX]{x1D707}}$, as a function of both actuation voltage and frequency. As depicted in this figure, the momentum coefficient,
 $C_{\unicode[STIX]{x1D707}}$, was found to increase with increasing driving voltage. However, the bandwidth of the SJ flat frequency response was found to narrow down with increasing
 $v_{rms}$. It was also observed that, for a given
 $C_{\unicode[STIX]{x1D707}}$, the minimum required driving voltage was reached for frequencies between 0.2 and 0.4. It is believed that the local minima in the contours of
 $C_{\unicode[STIX]{x1D707}}$ were achieved at the SJ Helmholtz resonant frequency, which is a function of the SJ cavity volume, slot area and, more importantly, driving voltage (Holman et al. Reference Holman, Utturkar, Mittal, Smith and Cattafesta2005; Chaudhari et al. Reference Chaudhari, Verma, Puranik and Agrawal2009; Cattafesta III & Sheplak Reference Cattafesta and Sheplak2011). This suggests that, for effective tip vortex control, it is recommended to operate the current SJ near its Helmholtz resonance frequency, i.e.
 $0.2\lesssim F^{+}\lesssim 0.4$. Considering the SJ design characteristics, a few control cases were selected to further investigate the effect of the actuation frequency on the overall efficiency of the control process. For this, six different control configurations with a constant momentum coefficient,
 $C_{\unicode[STIX]{x1D707}}=0.001$, and increasing actuation frequency,
 $F^{+}$, were tested in the present study: C0,
 $F^{+}=0$ (natural vortex); C1,
 $F^{+}=0.075$; C2,
 $F^{+}=0.15$; C3,
 $F^{+}=0.3$; C4,
 $F^{+}=0.6$; C5,
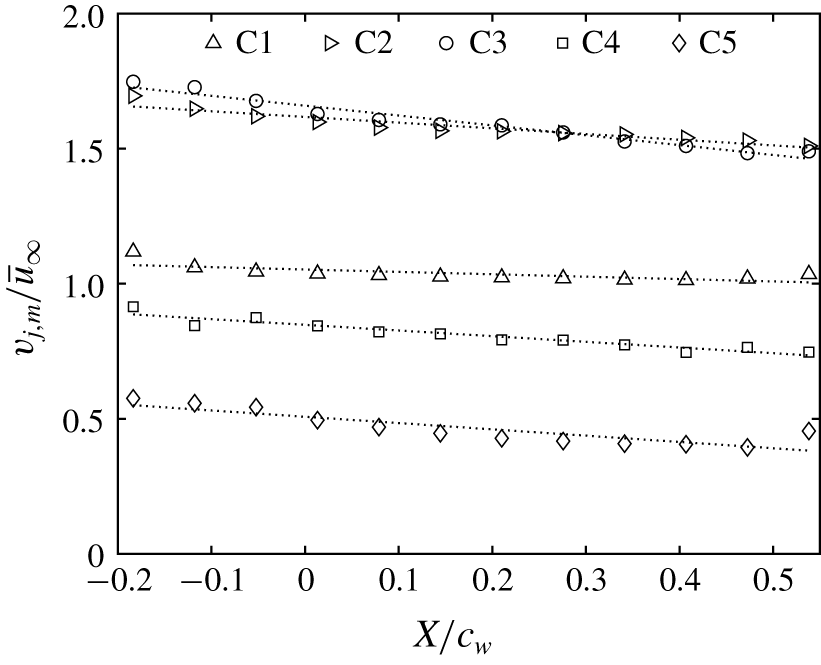
 $F^{+}=1.2$. Typical profiles of the maximum velocity,
 $\bar{v}_{j}$, measured along the centreline of the SJ slot exit at
 $Y/c_{w}=0$, normalized by the free-stream velocity,
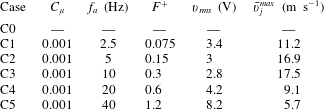
 $\bar{u}_{\infty }$, are shown in figure 4. For all the cases studied, a noticeable velocity gradient was observed as a result of the trapezoidal shape of the SJ exit slot. Furthermore, for a given momentum coefficient,
 $C_{\unicode[STIX]{x1D707}}=0.001$, tuning the SJ to
 $F^{+}=0.3$ resulted in the highest peak jet velocity,
 $\bar{v}_{j}^{max}$, along the centreline of the SJ slot using the lowest driving voltage,
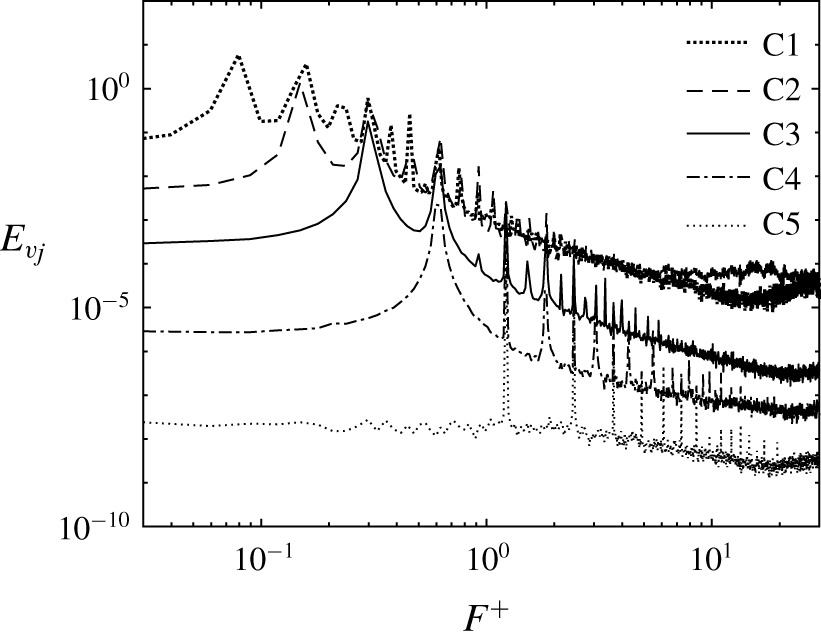
 $v_{rms}=2.8$ V, amongst all cases studied. This observation is corroborated by the spectra of the SJ exit velocity,
 $v_{j}(t)$, measured at the location
 $(X/c_{w},Y/c_{w},Z/c_{w})=(0.18,0,0)$ for all the cases studied, as illustrated in figure 5. For clarity, spectra of cases C2, C3, C4 and C5 were shifted down by one, two, three and four decades, respectively. The frequency spectra exhibited dominant sharp peaks at the corresponding actuation frequencies of the cases studied and their respective higher harmonics. The magnitude of the dominant peak in the frequency spectra of case C3 was 66 %, 24 %, 87 % and 92 % higher than those of cases C1, C2, C4 and C5, respectively. Additionally, the turbulent kinetic energy (TKE) generated by the SJ under control case C3 was measured to be the largest.
Map of SJ characteristics: momentum coefficient,  $C_{\unicode[STIX]{x1D707}}$, as a function of the driving voltage,
 $v_{rms}$, and the actuation frequency,
 $F^{+}$.

Profiles of the maximum exit velocities along the centreline of the SJ slot at  $Y/c_{w}=0$.

Spectra of the SJ exit velocity at the centre of the slot located at  $(X/c_{w},Y/c_{w},Z/c_{w})=(0.18,0,0)$.

4 Analysis techniques
4.1 Vortex centre identification
In order to determine the location of the instantaneous wing-tip vortex in each PIV snapshot, a precise and robust method is required. Various vortex identification schemes have been proposed in the literature, namely the swirling strength (Zhou et al. Reference Zhou, Adrian, Balachandar and Kendall1999; Beresh et al. Reference Beresh, Henfling and Spillers2010),  $Q$ and
 $\unicode[STIX]{x1D706}_{2}$ criteria (Hunt, Wray & Moin Reference Hunt, Wray and Moin1988; Jeong & Hussain Reference Jeong and Hussain1995; Bulathsinghala et al. Reference Bulathsinghala, Jackson, Wang and Gursul2017), centroid of vorticity and normalized helicity (Degani, Seginer & Levy Reference Degani, Seginer and Levy1990; Cerretelli & Williamson Reference Cerretelli and Williamson2003; Heyes et al. Reference Heyes, Jones and Smith2004; Edstrand et al. Reference Edstrand, Davis, Schmid, Taira and Cattafesta2016) and the geometric centre (Mula et al. Reference Mula, Stephenson, Tinney and Sirohi2013; Mula & Tinney Reference Mula and Tinney2015). Comprehensive reviews of the most common vortex identification techniques have been reported (Cucitore, Quadrio & Baron Reference Cucitore, Quadrio and Baron1999; McAlister Reference McAlister2004; Chakraborty, Balachandar & Adrian Reference Chakraborty, Balachandar and Adrian2005; van der Wall & Richard Reference van der Wall and Richard2006; Ramasamy et al. Reference Ramasamy, Johnson, Huismann and Leishman2009). Despite being widely used in the literature, the techniques listed above lack sufficient accuracy in determining the physical location of the vortex centre owing to their mathematical formulation which is mostly based on the divergence of the velocity field. To overcome this limitation, Graftieaux, Michard & Grosjean (Reference Graftieaux, Michard and Grosjean2001) introduced a non-Galilean invariant approach which provides a robust and accurate way of identifying the location of vortex centres in a flow. This method defines a scalar function
 $\unicode[STIX]{x1D6E4}_{1}$ as (bold indicates a vector quantity)
 $$\begin{eqnarray}\unicode[STIX]{x1D6E4}_{1}(P)=\frac{1}{N}\mathop{\sum }_{S}\frac{(\boldsymbol{P}\boldsymbol{M}\times \boldsymbol{u}_{M})\boldsymbol{\cdot }\hat{\boldsymbol{e}}_{x}}{|\boldsymbol{P}\boldsymbol{M}||\boldsymbol{u}_{M}|},\end{eqnarray}$$
where  $\boldsymbol{P}\boldsymbol{M}$ is the vector from the centre point P to a subregion point M in the region S, which may be of any arbitrary shape that encloses the point P for an estimate of
 $\unicode[STIX]{x1D6E4}_{1}(P)$. Here
 $\boldsymbol{u}_{M}$ is the total velocity vector at point M and
 $\hat{\boldsymbol{e}}_{x}$ is the unit vector normal to the measurement plane. The vortex centre corresponds then to the measurement point where the scalar function
 $\unicode[STIX]{x1D6E4}_{1}$ is maximum. The
 $\unicode[STIX]{x1D6E4}_{1}$ function was developed such that the velocity fluctuations caused by large-scale vortices are separated from those related to small-scale turbulence (Graftieaux et al. Reference Graftieaux, Michard and Grosjean2001).
4.2 Triple decomposition
In order to extract the coherent meandering motion of the trailing vortex, the triple decomposition of Reynolds & Hussain (Reference Reynolds and Hussain1972) was applied to the SPIV instantaneous flow fields. The instantaneous velocity vector  $\boldsymbol{u}(\boldsymbol{x},t_{k})$ can be decomposed into a strictly spatial mean term
 $\bar{\boldsymbol{u}}(x)$, a coherent term
 $\tilde{\boldsymbol{u}}(\boldsymbol{x},t_{k})$ and a random term
 $\boldsymbol{u}^{\prime }(\boldsymbol{x},t_{k})$, given by
 $$\begin{eqnarray}\boldsymbol{u}(\boldsymbol{x},t_{k})=\bar{\boldsymbol{u}}(\boldsymbol{x})+\tilde{\boldsymbol{u}}(\boldsymbol{x},t_{k})+\boldsymbol{u}^{\prime }(\boldsymbol{x},t_{k}).\end{eqnarray}$$
If the vortex meandering is assumed to be the consequence of a coherent motion, a meandering-corrected flow field can be obtained by subtracting the coherent term from each of the instantaneous velocity fields. In this study, the meandering correction was achieved following the method reported in Mula & Tinney (Reference Mula and Tinney2014) and Edstrand et al. (Reference Edstrand, Davis, Schmid, Taira and Cattafesta2016), where the instantaneous vortex centres,  $\boldsymbol{x}_{\boldsymbol{c}}(t_{k})$, determined using the
 $\unicode[STIX]{x1D6E4}_{1}$ method for each of the SPIV snapshots, were linearly translated and superimposed at the location of the mean vortex centre. Consequently, the instantaneous velocity fields were systematically shifted by the same displacement vector and then interpolated into a common grid centred around the mean vortex position. This resulted in a meandering-corrected instantaneous velocity field,
 $\hat{\boldsymbol{u}}(\boldsymbol{x}-\boldsymbol{x}_{\boldsymbol{c}}(t_{k}),t_{k})$. The meandering-corrected mean flow field,
 $\bar{\hat{\boldsymbol{u}}}(x)$, was then obtained by time-averaging the meandering-corrected instantaneous velocity fields, as follows:
 $$\begin{eqnarray}\bar{\hat{\boldsymbol{u}}}(\boldsymbol{x})=\frac{1}{N}\mathop{\sum }_{k=1}^{N}\hat{\boldsymbol{u}}(\boldsymbol{x}-\boldsymbol{x}_{\boldsymbol{ c}}(t_{k}),t_{k}).\end{eqnarray}$$
The meandering-corrected velocity fluctuation,  $\boldsymbol{u}^{\prime }$, was obtained by subtracting the mean meandering-corrected flow field from each of the ‘re-centred’ snapshots such that
 $$\begin{eqnarray}\boldsymbol{u}^{\prime }(\boldsymbol{x},t_{k})=\hat{\boldsymbol{u}}(\boldsymbol{x}-\boldsymbol{x}_{\boldsymbol{c}}(t_{k}),t_{k})-\bar{\hat{\boldsymbol{u}}}(\boldsymbol{x}).\end{eqnarray}$$
The coherent meandering flow field,  $\tilde{\boldsymbol{u}}$, can be directly inferred from (4.2) and (4.3):
 $$\begin{eqnarray}\tilde{\boldsymbol{u}}(\boldsymbol{x},t_{k})=[\boldsymbol{u}(\boldsymbol{x},t_{k})-\bar{\boldsymbol{u}}(\boldsymbol{x})]-[\hat{\boldsymbol{u}}(\boldsymbol{x},t_{k})-\bar{\hat{\boldsymbol{u}}}(\boldsymbol{x})],\end{eqnarray}$$
where the first term on the right-hand side contains both the coherent meandering motion and the background turbulence, while the second term on the right-hand side removes turbulence.
4.3 Snapshot POD
In this study, POD was used in order to extract the most energetic features of the turbulence fluctuations within the trailing vortex. This technique was first introduced in the context of fluid mechanics by Lumley (Reference Lumley1967). Further details of the mathematical implementation of the POD technique can be found in Berkooz, Holmes & Lumley (Reference Berkooz, Holmes and Lumley1993). Owing to its computational efficiency, the so-called snapshot POD (SPOD) approach outlined by Sirovich (Reference Sirovich1987) was adopted in this study. This technique was used because the number of instantaneous snapshots,  $N$, was generally smaller than the number of velocity vectors,
 $N_{zy}$, calculated in each snapshot (Mohammed-Taifour & Weiss Reference Mohammed-Taifour and Weiss2016). Note that, in this study, the SPOD analysis was performed on
 $2000$ statistically independent snapshots, encompassing about
 $10^{5}$ vectors each. In practice, the SPOD approach consists of decomposing the coherent vector field into deterministic spatial functions
 $\unicode[STIX]{x1D731}^{k}(\boldsymbol{x})$ weighted by random time coefficients
 $a^{k}(t)$ such that
 $$\begin{eqnarray}\tilde{\boldsymbol{u}}(\boldsymbol{x},t_{k})=\mathop{\sum }_{k=1}^{N}a^{k}(t)\unicode[STIX]{x1D731}^{k}(\boldsymbol{x}).\end{eqnarray}$$
The coherent velocities  $\tilde{w}$ and
 $\tilde{v}$ were first rearranged into two
 $N\times N_{zy}$ matrices of snapshots
 $\unicode[STIX]{x1D64E}_{w}$ and
 $\unicode[STIX]{x1D64E}_{v}$. The autocovariance matrix of the velocity fields is defined as
 $$\begin{eqnarray}\unicode[STIX]{x1D63E}=\frac{1}{N}(\unicode[STIX]{x1D64E}_{w}\unicode[STIX]{x1D64E}_{w}^{T}+\unicode[STIX]{x1D64E}_{v}\unicode[STIX]{x1D64E}_{v}^{T}).\end{eqnarray}$$
The corresponding eigenvalue problem is then formulated as
 $$\begin{eqnarray}\unicode[STIX]{x1D63E}\boldsymbol{A}^{k}=\unicode[STIX]{x1D706}^{k}\boldsymbol{A}^{k},\end{eqnarray}$$
where  $\unicode[STIX]{x1D706}^{k}$ and
 $\boldsymbol{A}^{k}$ are the eigenvalues and eigenvectors of the autocovariance matrix
 $\unicode[STIX]{x1D63E}$, respectively. As
 $\unicode[STIX]{x1D63E}$ is symmetric and positive semi-definite, all the eigenvalues are real and non-negative and sorted in descending order that relates to the decreasing energy of the corresponding modes:
 $$\begin{eqnarray}\unicode[STIX]{x1D706}^{1}>\unicode[STIX]{x1D706}^{2}>\cdots >\unicode[STIX]{x1D706}^{N}=0.\end{eqnarray}$$
The scalar modes  $\unicode[STIX]{x1D719}_{w}^{k}(\boldsymbol{x})$ and
 $\unicode[STIX]{x1D719}_{v}^{k}(\boldsymbol{x})$, which, respectively, correspond to the coherent velocities
 $\tilde{w}$ and
 $\tilde{v}$, are obtained by the projections
 $$\begin{eqnarray}\displaystyle & \displaystyle \unicode[STIX]{x1D719}_{w}^{k}(\boldsymbol{x})=\unicode[STIX]{x1D64E}_{w}^{T}\boldsymbol{A}^{k}, & \displaystyle\end{eqnarray}$$
 $$\begin{eqnarray}\displaystyle & \displaystyle \unicode[STIX]{x1D719}_{v}^{k}(\boldsymbol{x})=\unicode[STIX]{x1D64E}_{v}^{T}\boldsymbol{A}^{k}. & \displaystyle\end{eqnarray}$$
The spanwise and transverse components of the scalar modes  $\unicode[STIX]{x1D753}^{k}(\boldsymbol{x})$ are subsequently normalized to form an orthonormal basis:
 $$\begin{eqnarray}\unicode[STIX]{x1D731}^{k}(\boldsymbol{x})=\frac{\unicode[STIX]{x1D753}^{k}(\boldsymbol{x})}{\Vert \unicode[STIX]{x1D753}^{k}(\boldsymbol{x})\Vert }.\end{eqnarray}$$
The time coefficients are then determined by projecting the coherent velocity field onto the scalar modes:
 $$\begin{eqnarray}a^{k}(t)=\unicode[STIX]{x1D64E}_{w}\unicode[STIX]{x1D731}_{w}^{k}(\boldsymbol{x})+\unicode[STIX]{x1D64E}_{v}\unicode[STIX]{x1D731}_{v}^{k}(\boldsymbol{x}).\end{eqnarray}$$
The main advantage of the SPOD approach is its ability to give the best approximation of the flow in an energetic sense. In that, the total resolved energy of the flow is given by the sum of the eigenvalues:
 $$\begin{eqnarray}\boldsymbol{E}=\mathop{\sum }_{k=1}^{N}\unicode[STIX]{x1D706}^{k}.\end{eqnarray}$$
An energy percentage, based on the corresponding mode eigenvalue, can be determined to quantify the energy contribution of each mode to the total resolved energy:
 $$\begin{eqnarray}\boldsymbol{E}^{k}(\%)=\frac{\unicode[STIX]{x1D706}^{k}}{\boldsymbol{E}}.\end{eqnarray}$$
5 Results and discussion
5.1 Effect of actuation frequency on the meandering-corrected vortex characteristics
In order to assess the sensitivity of the wing-tip vortex structure to the SJ actuation frequency,  $F^{+}$, a comprehensive comparative study was conducted at the downstream location
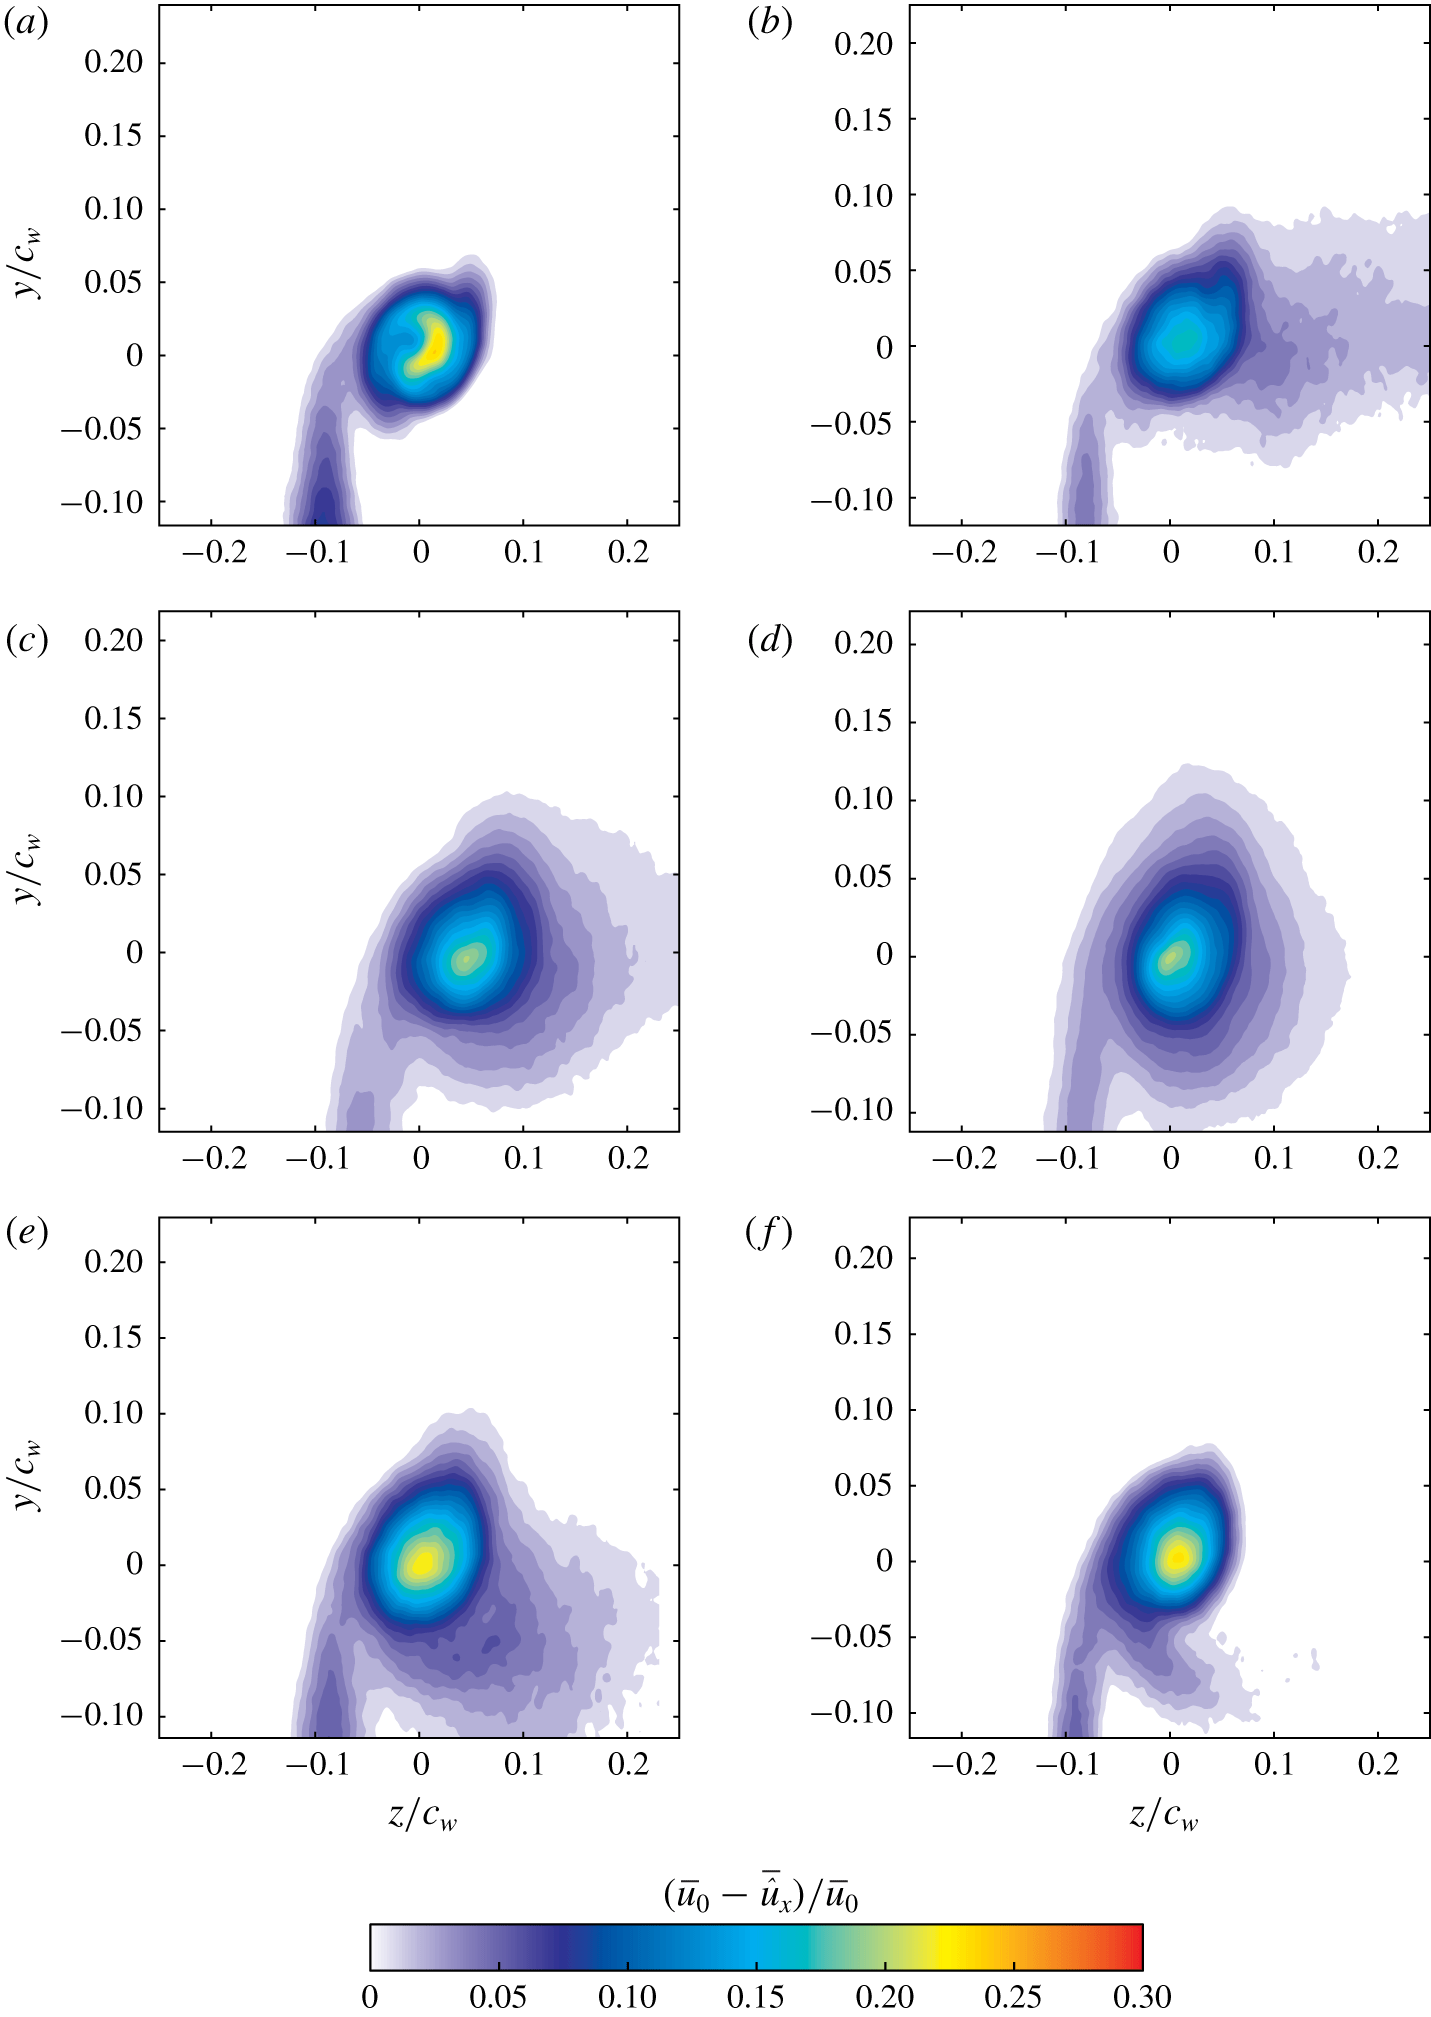
 $X/c_{w}=1.25$. The configurations considered in this study were those summarized in table 1. Contour plots of the normalized meandering-corrected axial velocity deficit,
 $(\bar{u}_{0}-\bar{\hat{u} }_{x})/\bar{u}_{0}$, where
 $\bar{u}_{0}$ is the local free-stream velocity which was at worst 3 % higher than the undisturbed free-stream velocity,
 $\bar{u}_{\infty }$, are shown in figure 6 for cases C0, C1, C2, C3, C4 and C5. For case C0 (figure 6a), the wing-tip vortex was evidenced by a nearly axisymmetric core region of strong velocity deficit with a peak of about 0.3. Outside the core region, velocity contours showed a curved region indicating the wake shear layer being drawn and fully wrapped around the main vortex core as a result of the strong pressure gradient. With control, the wake shear layer was found to be stretched in the spanwise direction and was slightly thinned where its maximum velocity deficit slightly increased by up to 25 % (in case C5) with respect to case C0, as illustrated in figure 6. Velocity contours of the controlled cases exhibited a nearly elliptic and a rather diffuse core region compared to C0 with maximum velocity deficits at the core being 30 %, 38 %, 28 %, 8 % and 4 % lower than C0 for cases C1, C2, C3, C4 and C5, respectively. Note that, as the actuation frequency increases, the extent of the vortex stretching was found to decrease and the contours of the velocity deficit appeared less elongated in the blowing direction. This suggests that the stroke length of the SJ penetrated smaller distances into the vortex core with increasing actuation frequency (Dghim, Ferchichi & Fellouah Reference Dghim, Ferchichi and Fellouah2017).
Contours of the normalized meandering-corrected axial velocity deficit at  $X/c_{w}=1.25$: (a) C0, (b) C1, (c) C2, (d) C3, (e) C4 and (f) C5.

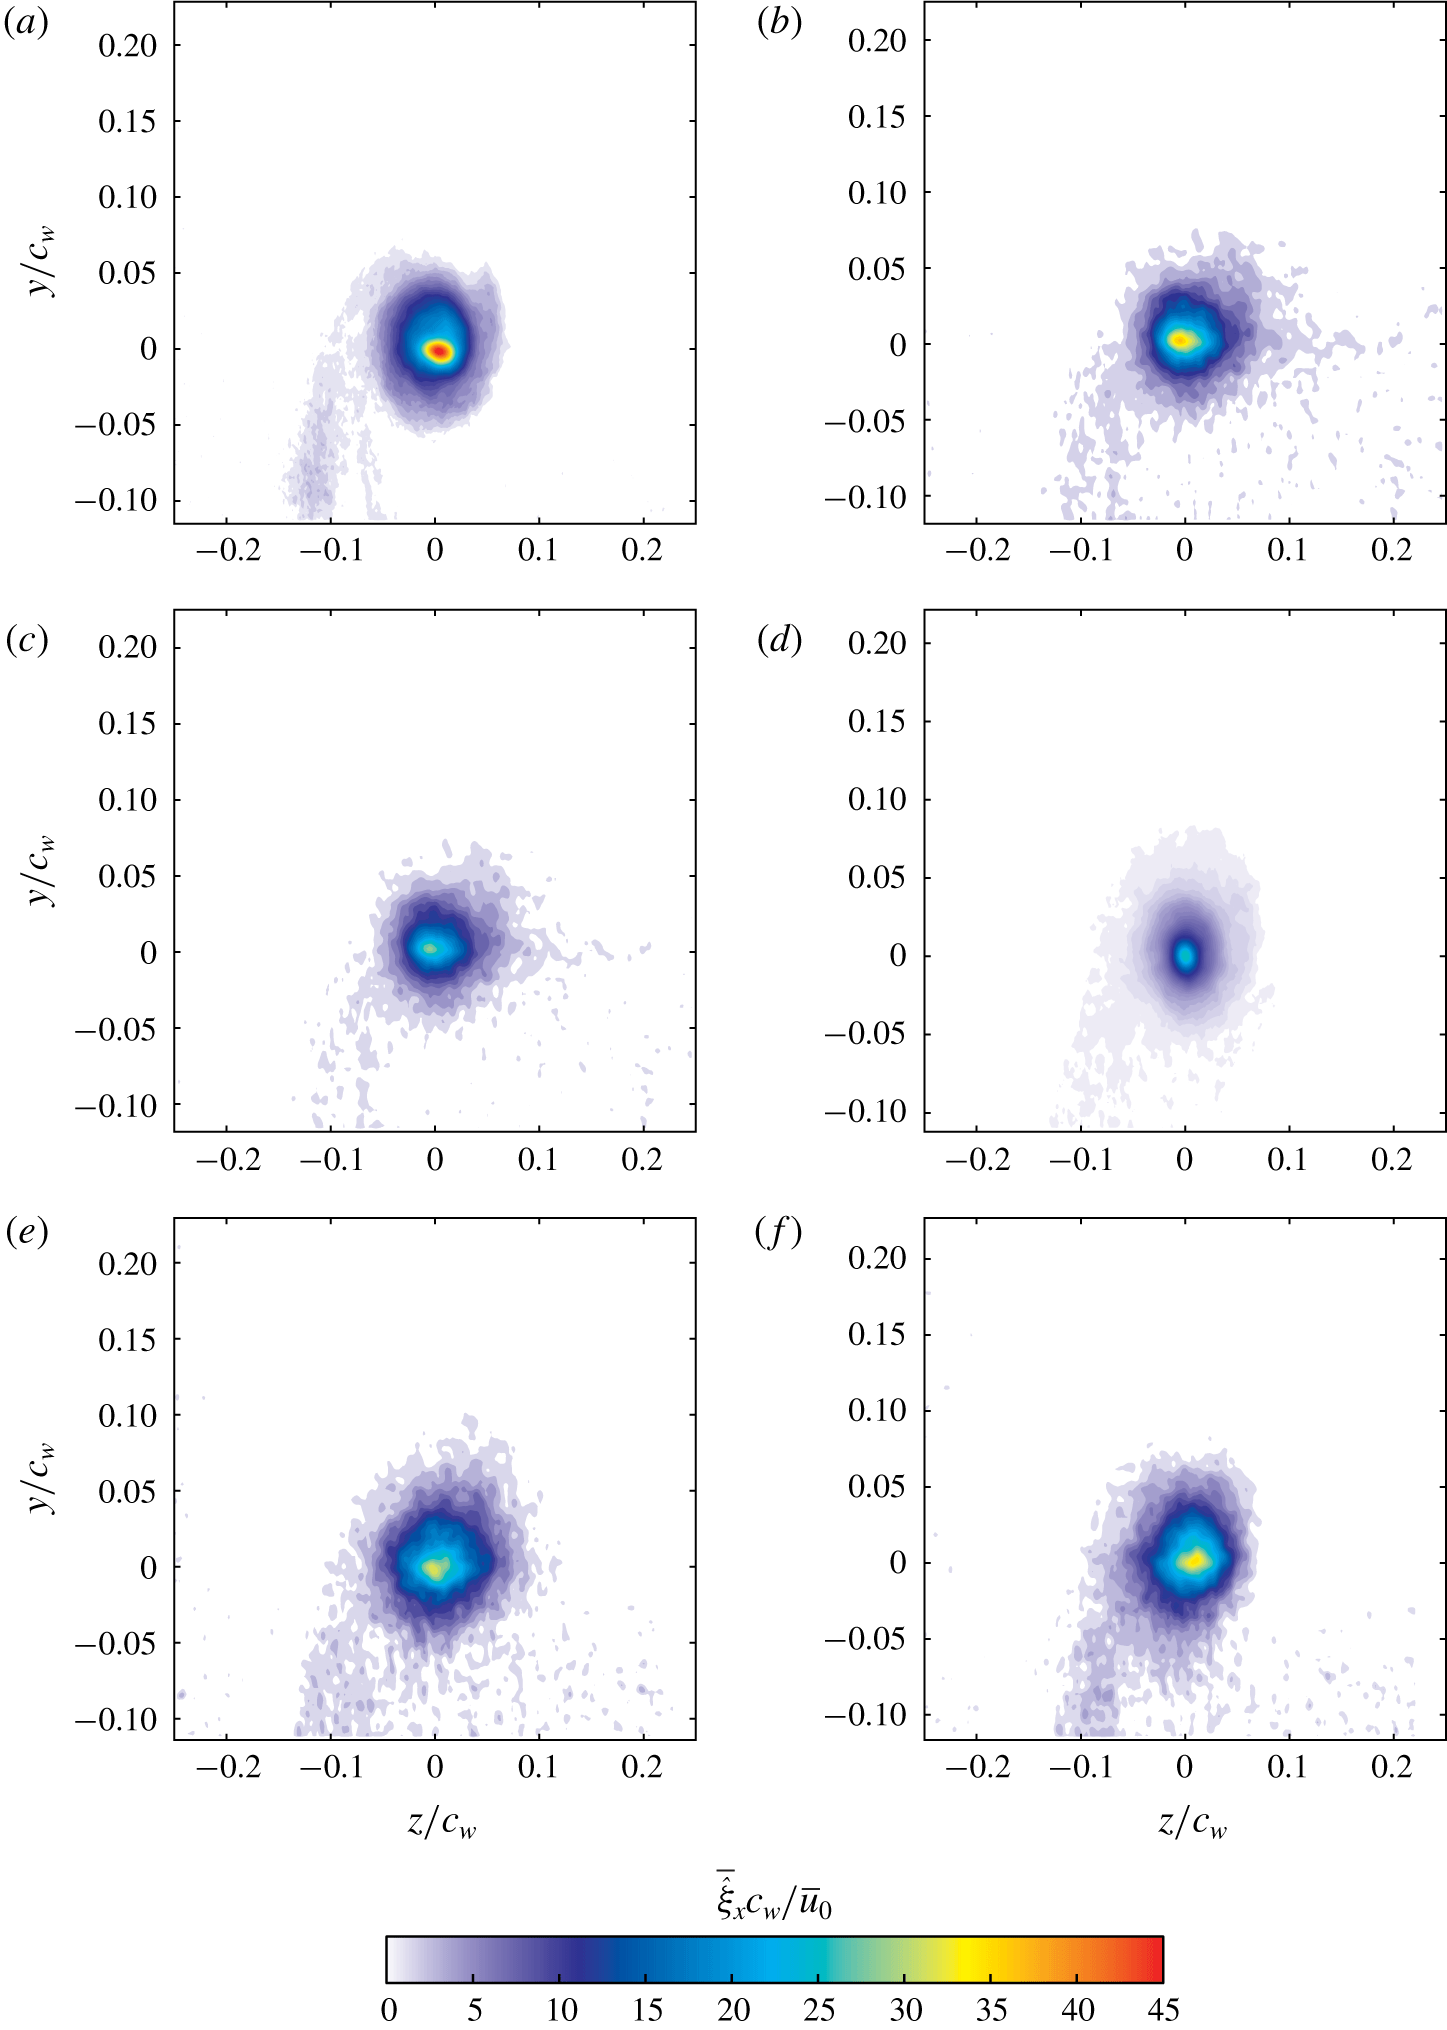
Contours of the normalized meandering-corrected axial vorticity at  $X/c_{w}=1.25$: (a) C0, (b) C1, (c) C2, (d) C3, (e) C4 and (f) C5.

Summary of the control configurations studied.

Contours of the normalized meandering-corrected axial vorticity,  $\bar{\hat{\unicode[STIX]{x1D709}}}_{x}\;c_{w}/\bar{u}_{0}$, at
 $X/c_{w}=1.25$, are displayed in figure 7 for cases C0, C1, C2, C3, C4 and C5. In figure 7(a), the axial vorticity contours of C0 clearly depict two distinct regions: the wake shear layer with relatively low vorticity levels, and a vortex structure where vorticity dominates. The latter shows a nearly circular shape with a radius of about
 $0.05c_{w}$ and a peak value of 35. A measurable stretching of the vorticity contours, similar to that of the contours of the velocity deficit, was clearly observed in the controlled cases. The outward diffusion of the vortex was also accompanied by a 32 %, 27 %, 50 %, 38 % and 36 % decrease in the peak value of the axial vorticity of cases C1, C2, C3, C4 and C5, respectively, compared to C0. It can readily be inferred from figure 7 that, although the vorticity contours of case C2 appeared more stretched, the control case C3 had the most significant impact on the axial vorticity of the core amongst all control configurations. In that, contours of the axial vorticity in the vortex core of case C3 were found to be more diffuse, hence covering a larger area around the mean vortex centre.
The effect of the SJ actuation frequency on the wing-tip vortex may be further quantified by evaluating the radial profiles of the mean azimuthal velocity using the method detailed in Dghim et al. (Reference Dghim, Ferchichi, Perez and BenChiekh2016, Reference Dghim, Ferchichi and Fellouah2017). In that, the mean meandering-corrected azimuthal velocity,  $\bar{\hat{v}}_{\unicode[STIX]{x1D703}}$, was evaluated using the following expression:
 $$\begin{eqnarray}\bar{\hat{v}}_{\unicode[STIX]{x1D703}}=(\bar{\hat{u} }_{z}-\bar{\hat{u} }_{z_{c}})\cos \unicode[STIX]{x1D703}-(\bar{\hat{u} }_{y}-\bar{\hat{u} }_{y_{c}})\sin \unicode[STIX]{x1D703},\end{eqnarray}$$
where  $\bar{\hat{u} }_{z_{c}}$ and
 $\bar{\hat{u} }_{y_{c}}$ are the local spanwise and transverse velocities in the meandering-corrected ensemble-averaged vortex centre, respectively. The azimuthal velocity was calculated using the radial,
 $r$, and angular,
 $\unicode[STIX]{x1D703}$, coordinates directly determined from the Cartesian coordinates of the raw PIV velocity fields. The azimuthal velocity was then plotted as a function of the radial distance from the mean vortex centre. The scatter was then averaged at each of the radial intervals.
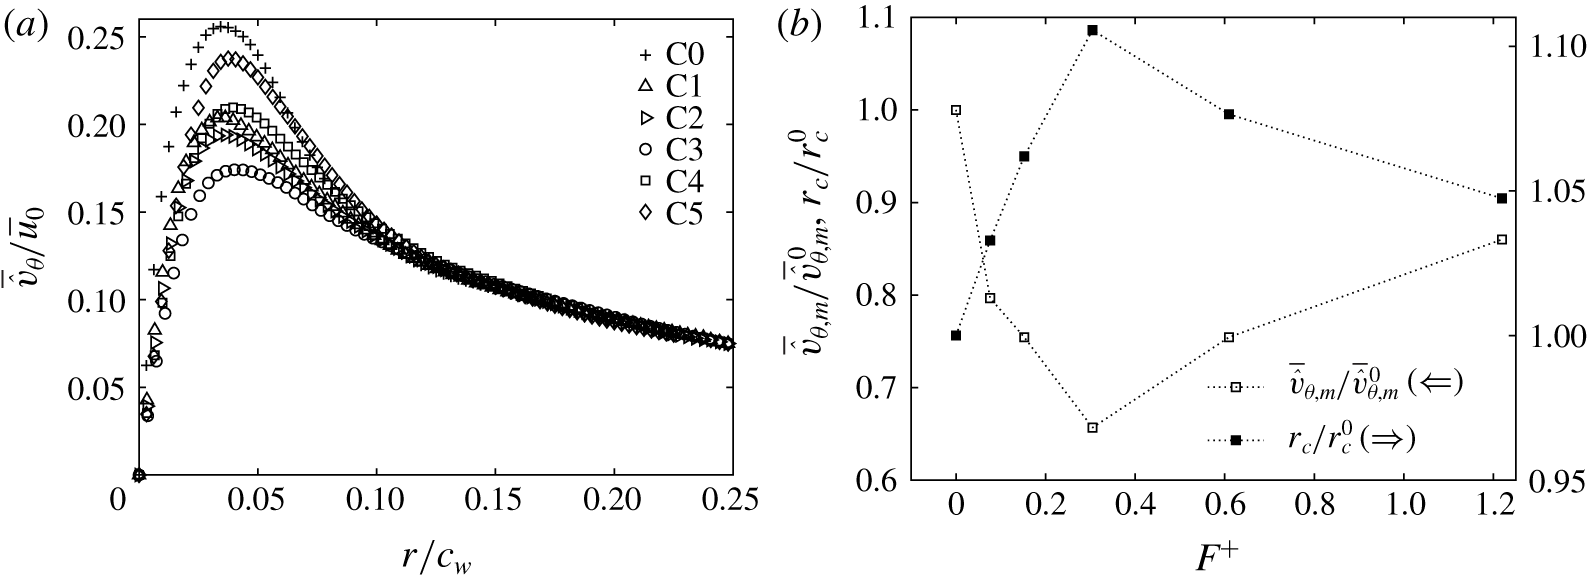
In figure 8(a), the distribution of  $\bar{\hat{v}}_{\unicode[STIX]{x1D703}}/\bar{u}_{0}$ reached a peak value before slowly decreasing to a nearly asymptotic value. The region between the ensemble-averaged vortex location (
 $r/c_{w}=0$) and the radial location at which the peak value of
 $\bar{\hat{v}}_{\unicode[STIX]{x1D703}}/\bar{u}_{0}$ occurs is often referred to as the inner vortex region and the size of this region corresponds to the vortex radius,
 $r_{c}$. The outer vortex region, however, lies in the region where
 $r/c_{w}>r_{c}$. For case C0, the radial profile of
 $\bar{\hat{v}}_{\unicode[STIX]{x1D703}}/\bar{u}_{0}$ reached a peak value of nearly 0.26 corresponding to a normalized radial location,
 $r/c_{w}$, of about 0.038. With actuation, the gradient of
 $\bar{\hat{v}}_{\unicode[STIX]{x1D703}}/\bar{u}_{0}$ slightly decreased with increasing actuation frequency, causing the peak value of
 $\bar{\hat{v}}_{\unicode[STIX]{x1D703}}/\bar{u}_{0}$ to drop by about 40 % under case C3, before slowly rising again. This increase in the core velocity gradient was also accompanied by a remarkable increase in the peak value of
 $\bar{\hat{v}}_{\unicode[STIX]{x1D703}}/\bar{u}_{0}$ which reached a value of about 0.24 under the highest actuation frequency of case C5.
Effect of the actuation frequency on (a) the radial distributions of the ensemble-averaged meandering-corrected azimuthal velocity and on (b) the peak azimuthal velocities and the normalized vortex radii. Values were evaluated at  $X/c_{w}=1.25$ for all the configurations studied.

This behaviour is clearly illustrated in figure 8(b) which indicates that the control case C3 resulted in the lowest ratio of the peak value of the azimuthal velocity,  $\bar{\hat{v}}_{\unicode[STIX]{x1D703},m}$, to the peak azimuthal velocity of the reference case C0,
 $\bar{\hat{v}}_{\unicode[STIX]{x1D703},m}^{0}$, amongst all the cases studied, indicating a significant vortex diffusion. Interestingly, however, the normalized vortex radius,
 $r_{c}$, at
 $X/c_{w}=1.25$, was found to be slightly affected by the actuation frequencies
 $F^{+}<0.3$. Furthermore, the 35 % reduction in the peak azimuthal velocity of case C3 with respect to case C0 was accompanied by a more than 10 % increase in the vortex radius,
 $r_{c}$, with respect to the radius of case C0,
 $r_{c}^{0}$. At higher control frequencies, the vortex radius marginally increased compared to cases C1, C2 and C3, reaching a nearly 7 % increase in size with respect to C0 under the control case C4. The effectiveness of the low actuation frequency in promoting vortex diffusion is in close agreement with the findings of Margaris & Gursul (Reference Margaris and Gursul2006) and Dghim et al. (Reference Dghim, Ferchichi, Perez and BenChiekh2016).
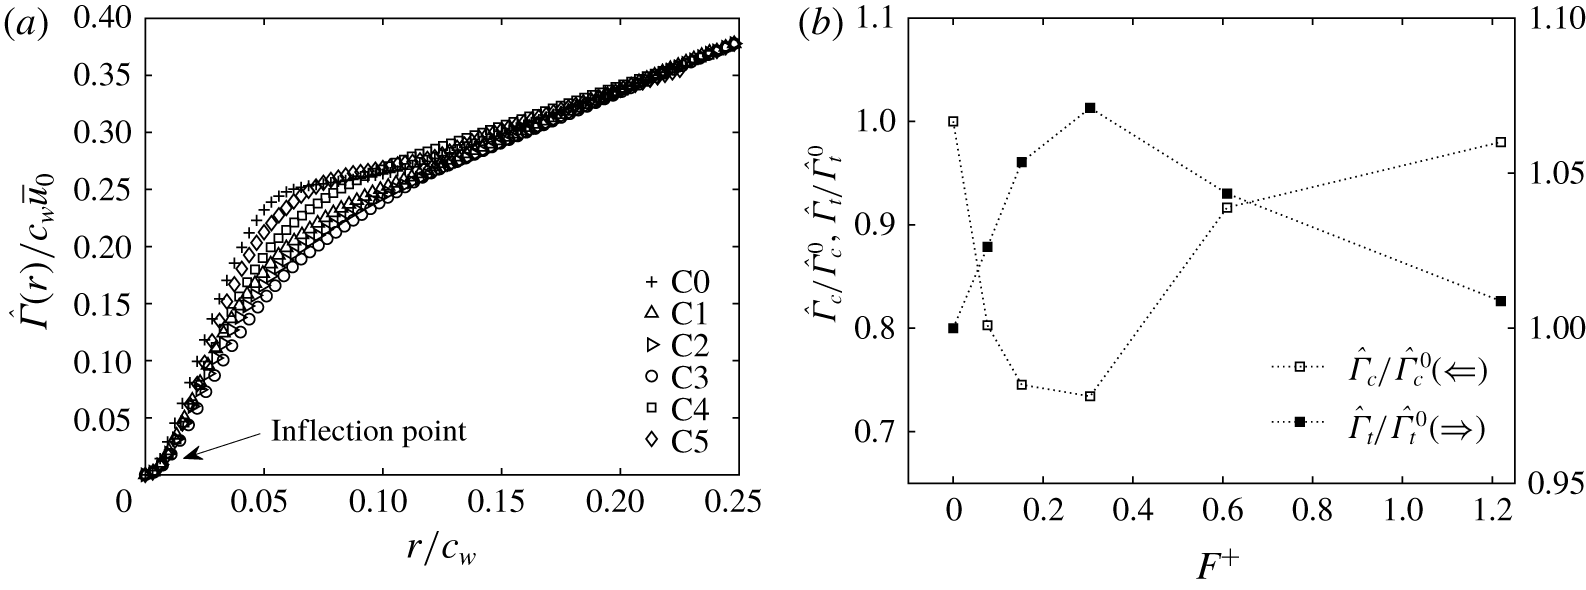
Circulation was also used as a vortex property to assess the effect of the actuation frequency on the vortex strength. Figure 9(a) shows the radial distributions of the vortex circulation evaluated at  $X/c_{w}=1.25$ for all configurations. In this figure, profiles of the normalized circulation showed an inflection point in the inner core region at
 $r/c_{w}\sim 0.01$, beyond which the circulation increased monotonically with increasing radial distance. Outside the core region, the circulation continued to increase with increasing radial position until reaching a second inflection point at
 $r/c_{w}\sim 0.06$, marking the extent of the wake shear layer. In the inner vortex region, the actuation caused the circulation gradient to measurably decrease with respect to C0 with the effect being more pronounced under C3. Consequently, the vortex core circulation,
 $\hat{\unicode[STIX]{x1D6E4}}_{c}$, was found to decrease by nearly 30 % with respect to the core circulation of case C0,
 $\hat{\unicode[STIX]{x1D6E4}}_{c}^{0}$, as illustrated in figure 9(b). In this figure, the vortex core circulations of each of the cases studied,
 $\hat{\unicode[STIX]{x1D6E4}}_{c}$, were normalized with that of the reference case C0,
 $\hat{\unicode[STIX]{x1D6E4}}_{c}^{0}$, and were plotted against the actuation frequency,
 $F^{+}$. Similar to the ratio of the peak value of the azimuthal velocities to that of case C0,
 $\bar{\hat{v}}_{\unicode[STIX]{x1D703},m}/\bar{\hat{v}}_{\unicode[STIX]{x1D703},m}^{0}$ (figure 8b), the lowest vortex core circulation ratio,
 $\hat{\unicode[STIX]{x1D6E4}}_{c}/\hat{\unicode[STIX]{x1D6E4}}_{c}^{0}$, was achieved under the control case C3. Moreover, as the vortex radii of the control cases were slightly affected, the reduction in their core circulations was mainly attributed to the decreased vorticity in this region (as seen in figure 7). Beyond the second inflexion point, the circulation profiles started to increase at a much lower rate than that of the inner core as the vortex flow field approaches a nearly irrotational state outside the core region (Waldman & Breuer Reference Waldman and Breuer2012; Dghim et al. Reference Dghim, Ferchichi and Fellouah2017). In this region, the circulation profile of case C0 exhibited a marginally asymptotic state which might be attributed to the remnants of the vortex sheet spiral around the core region (Van Jaarsveld et al. Reference Van Jaarsveld, Holten, Elsenaar, Trieling and Van Heijst2011). With control and in the outer region of the vortex, the profiles of the normalized circulation exhibited similar behaviour to that of C0, with slightly higher values under case C3. This increase was clearly reflected in the values of the total circulation ratio,
 $\hat{\unicode[STIX]{x1D6E4}}_{t}/\hat{\unicode[STIX]{x1D6E4}}_{t}^{0}$, as indicated in figure 9(b). It can be inferred from this figure that forcing the wing-tip vortex at the SJ resonance frequency (case C3) caused the total circulation to increase by nearly 7 % with respect to case C0, which might indicate an increase of the wing-bound circulation (Holloway & Richardson Reference Holloway and Richardson2007; Greenblatt Reference Greenblatt2012). Although no information on aerodynamic forces can be inferred from this study, it would be reasonable to expect the lift to have increased as a result of the SJ actuation.
Effect of the actuation frequency on (a) the radial distributions of the normalized meandering-corrected circulation and on (b) the normalized core circulations and the normalized total circulations. Values were evaluated at  $X/c_{w}=1.25$ for all the configurations studied.

Next, the effect of the actuation frequency on the normalized meandering-corrected TKE,  $\bar{\hat{k}}/{\bar{u}_{0}}^{2}$, in the vortex wake was evaluated. Normalized TKE was estimated as
 $$\begin{eqnarray}\frac{\bar{\hat{k}}}{\bar{u}_{0}^{2}}=\frac{1}{2}(\hat{R}_{uu}+\hat{R}_{vv}+\hat{R}_{ww}),\end{eqnarray}$$
where  $\hat{R}_{uu}=\overline{u^{\prime }u^{\prime }}/\bar{u}_{0}^{2}$,
 $\hat{R}_{vv}=\overline{v^{\prime }v^{\prime }}/\bar{u}_{0}^{2}$ and
 $\hat{R}_{ww}=\overline{w^{\prime }w^{\prime }}/\bar{u}_{0}^{2}$ are the normalized streamwise, spanwise and transverse coherent Reynolds stresses, respectively. Velocities
 $u^{\prime }$,
 $v^{\prime }$ and
 $w^{\prime }$ are the meandering-corrected fluctuating velocities in the
 $x$,
 $y$ and
 $z$ directions, respectively. Note that
 $u^{\prime }$,
 $v^{\prime }$ and
 $w^{\prime }$ only contain the coherent component of the velocity fluctuations.
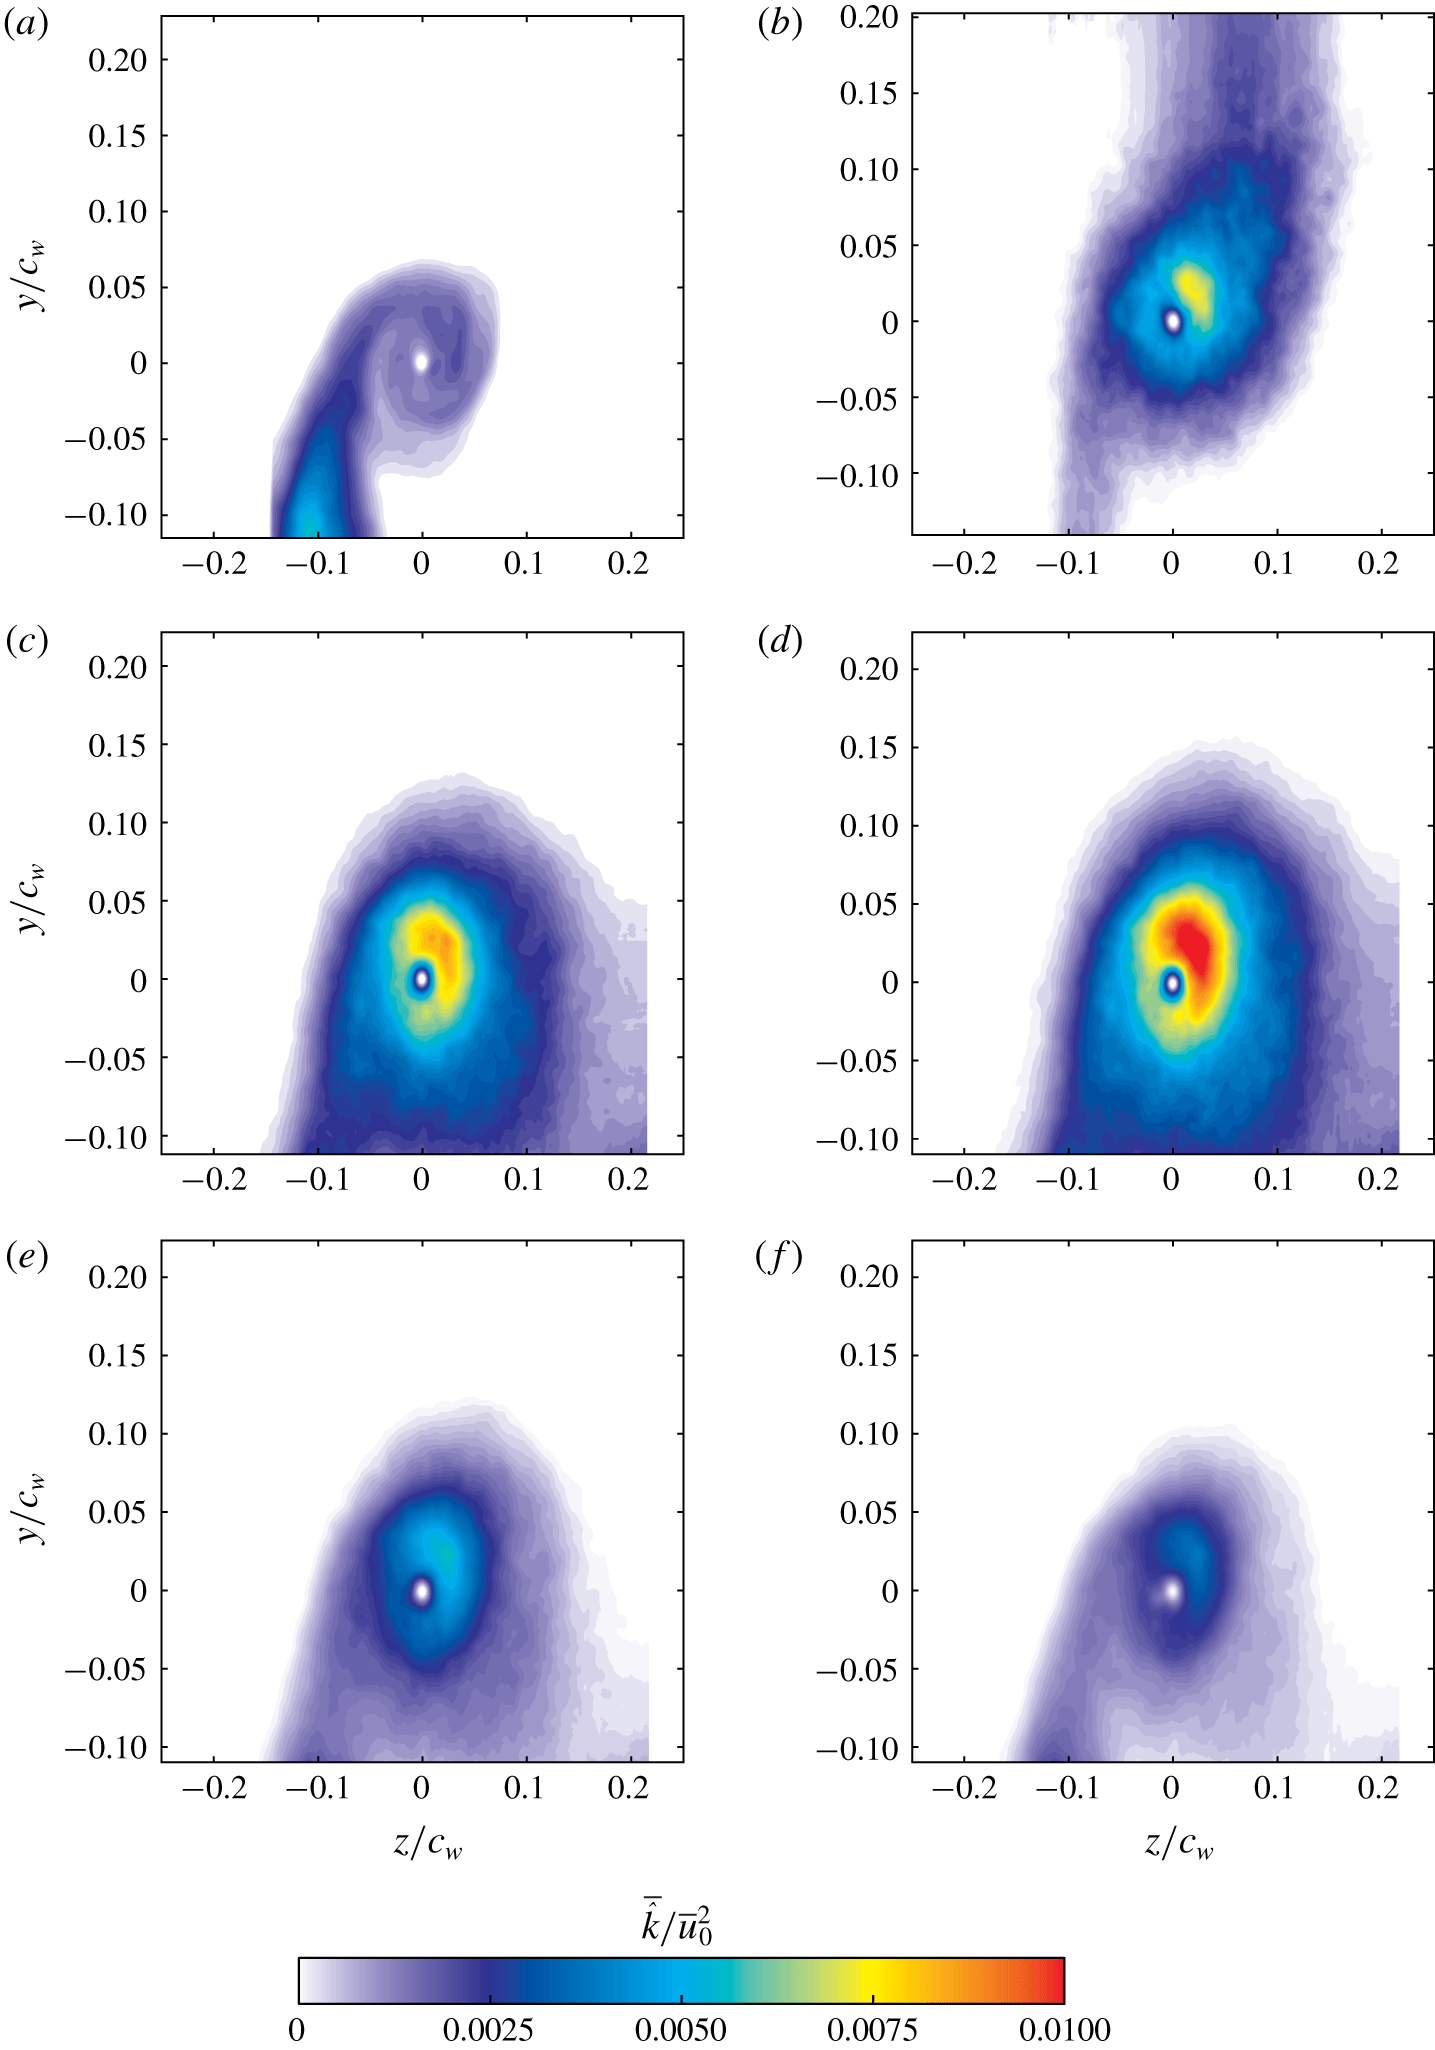
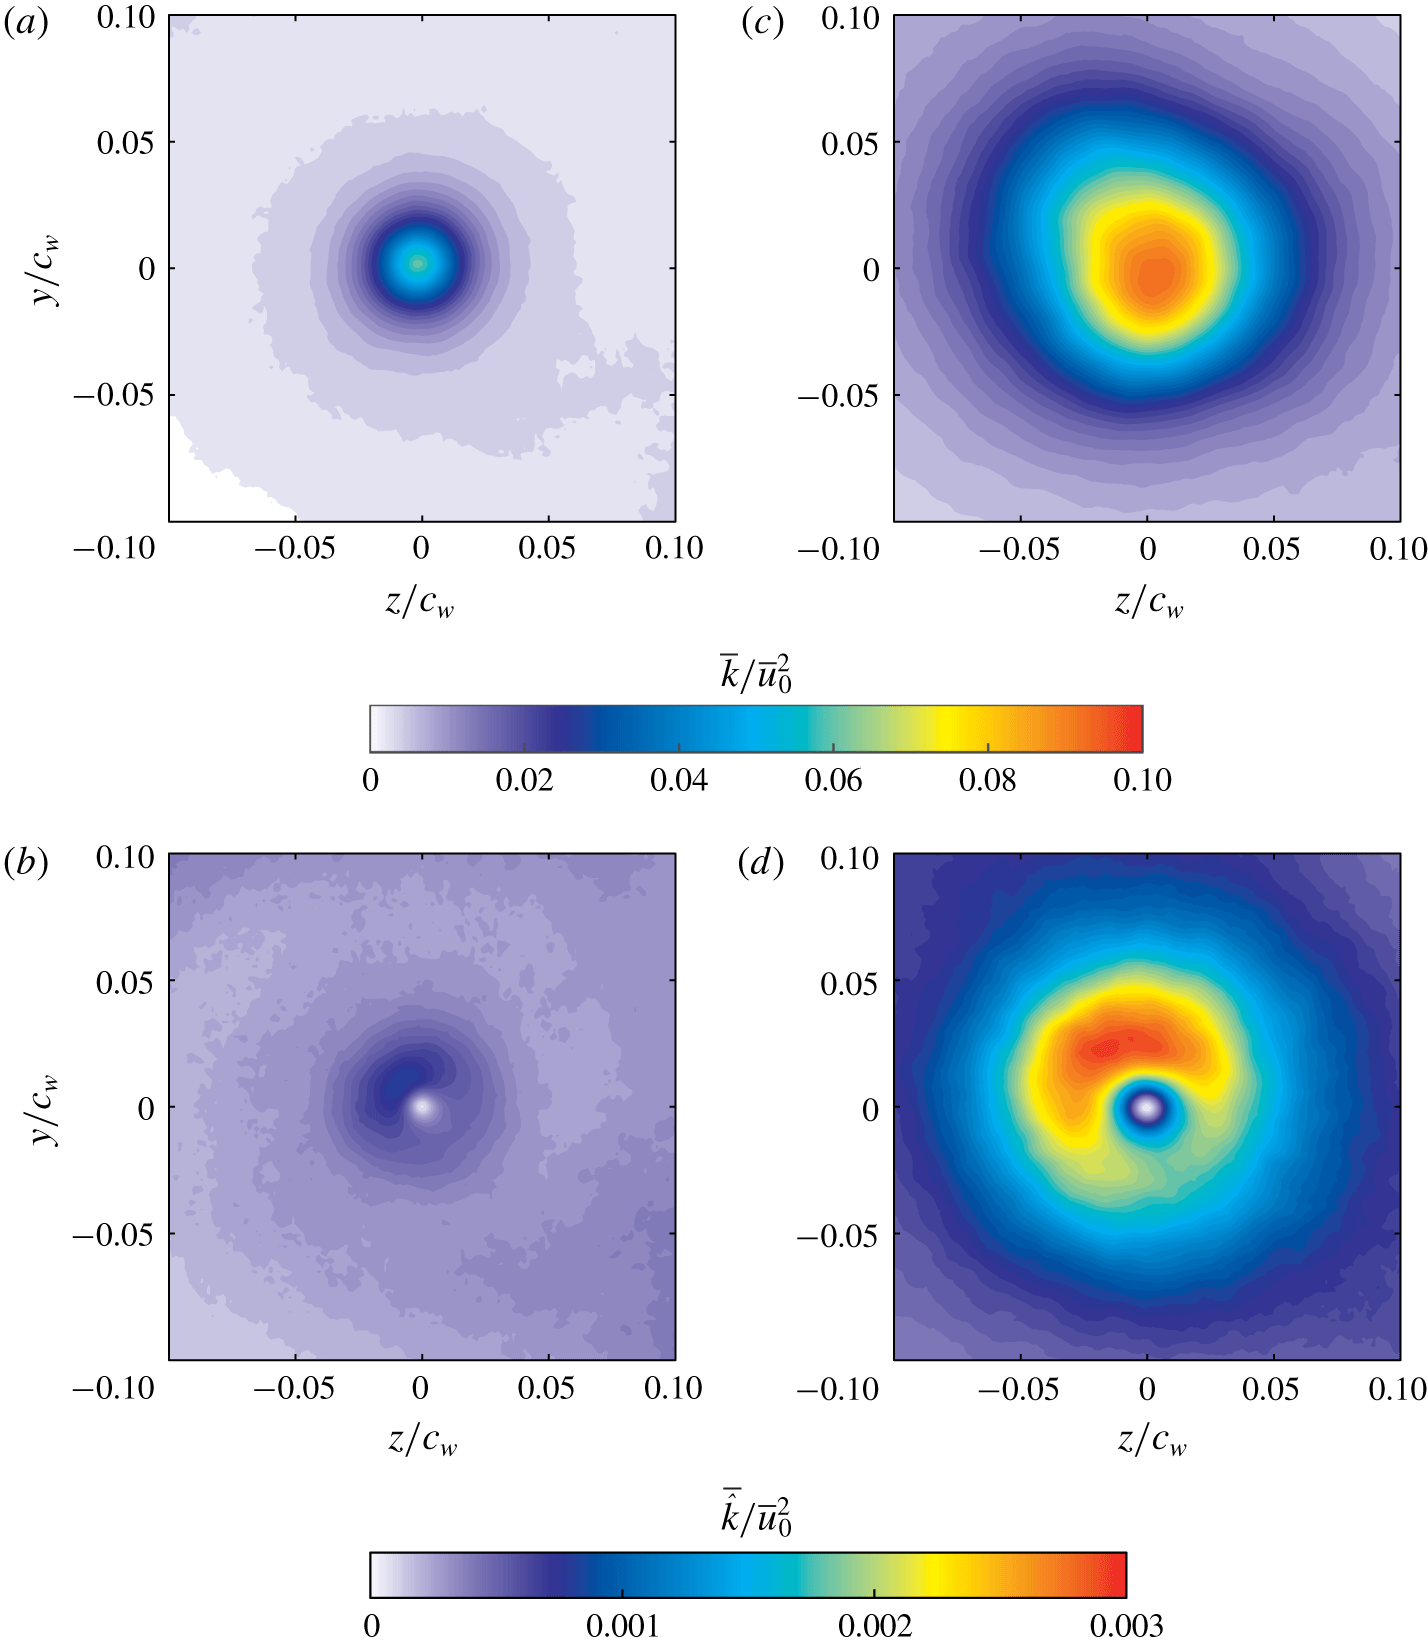
Contour plots of the meandering-corrected TKE are plotted in figure 10 for cases C0, C1, C2, C3, C4 and C5 at the measurement plane  $X/c_{w}=1.25$. For all the cases studied, contours of the meandering-corrected TKE showed a turbulence-free core with nearly zero TKE levels. For case C0, figure 10(a) shows a small region of TKE located near the ensemble-averaged vortex centre position with a peak value of about
 $6\times 10^{-3}$, while most of the TKE was concentrated in the wake shear layer. With control, a region of high TKE values appeared to be concentrated in the periphery of the vortex core region. In particular, peak values of
 $\bar{\hat{k}}/{\bar{u}_{0}}^{2}$ were measured to be
 $0.006$,
 $0.009$,
 $0.012$,
 $0.005$ and
 $0.004$ for cases C1, C2, C3, C4 and C5, respectively. The region of high TKE was stretched in the spanwise direction, similar to the behaviour observed for the velocity deficit (figure 5) and vorticity (figure 7) contours. Furthermore, for all control cases, contours of high TKE levels appeared to cover a larger area around the vortex core with noticeably larger effect under control case C3. This observation suggests that the high-TKE region in the vortex core was essentially triggered by the high turbulence contained in the counter-rotating structures injected into the vortex at a frequency analogous to the resonance frequency of the SJ actuator used in this study (Dghim et al. Reference Dghim, Ferchichi, Perez and BenChiekh2016).
Contours of the normalized meandering-corrected TKE at  $X/c_{w}=1.25$: (a) C0, (b) C1, (c) C2, (d) C3, (e) C4 and (f) C5.

5.2 The streamwise development of the actuated vortex
It was shown in § 5.1 that control case C3 had the largest impact on the wing-tip vortex amongst all configurations studied. For this reason, SJ actuation of case C3 was selected to examine its effect on the wing-tip vortex in the near- and mid-wake regions. To this end, SPIV measurements were conducted at downstream positions  $X/c_{w}=1.25,3.25,6.25$ and
 $7.75$.
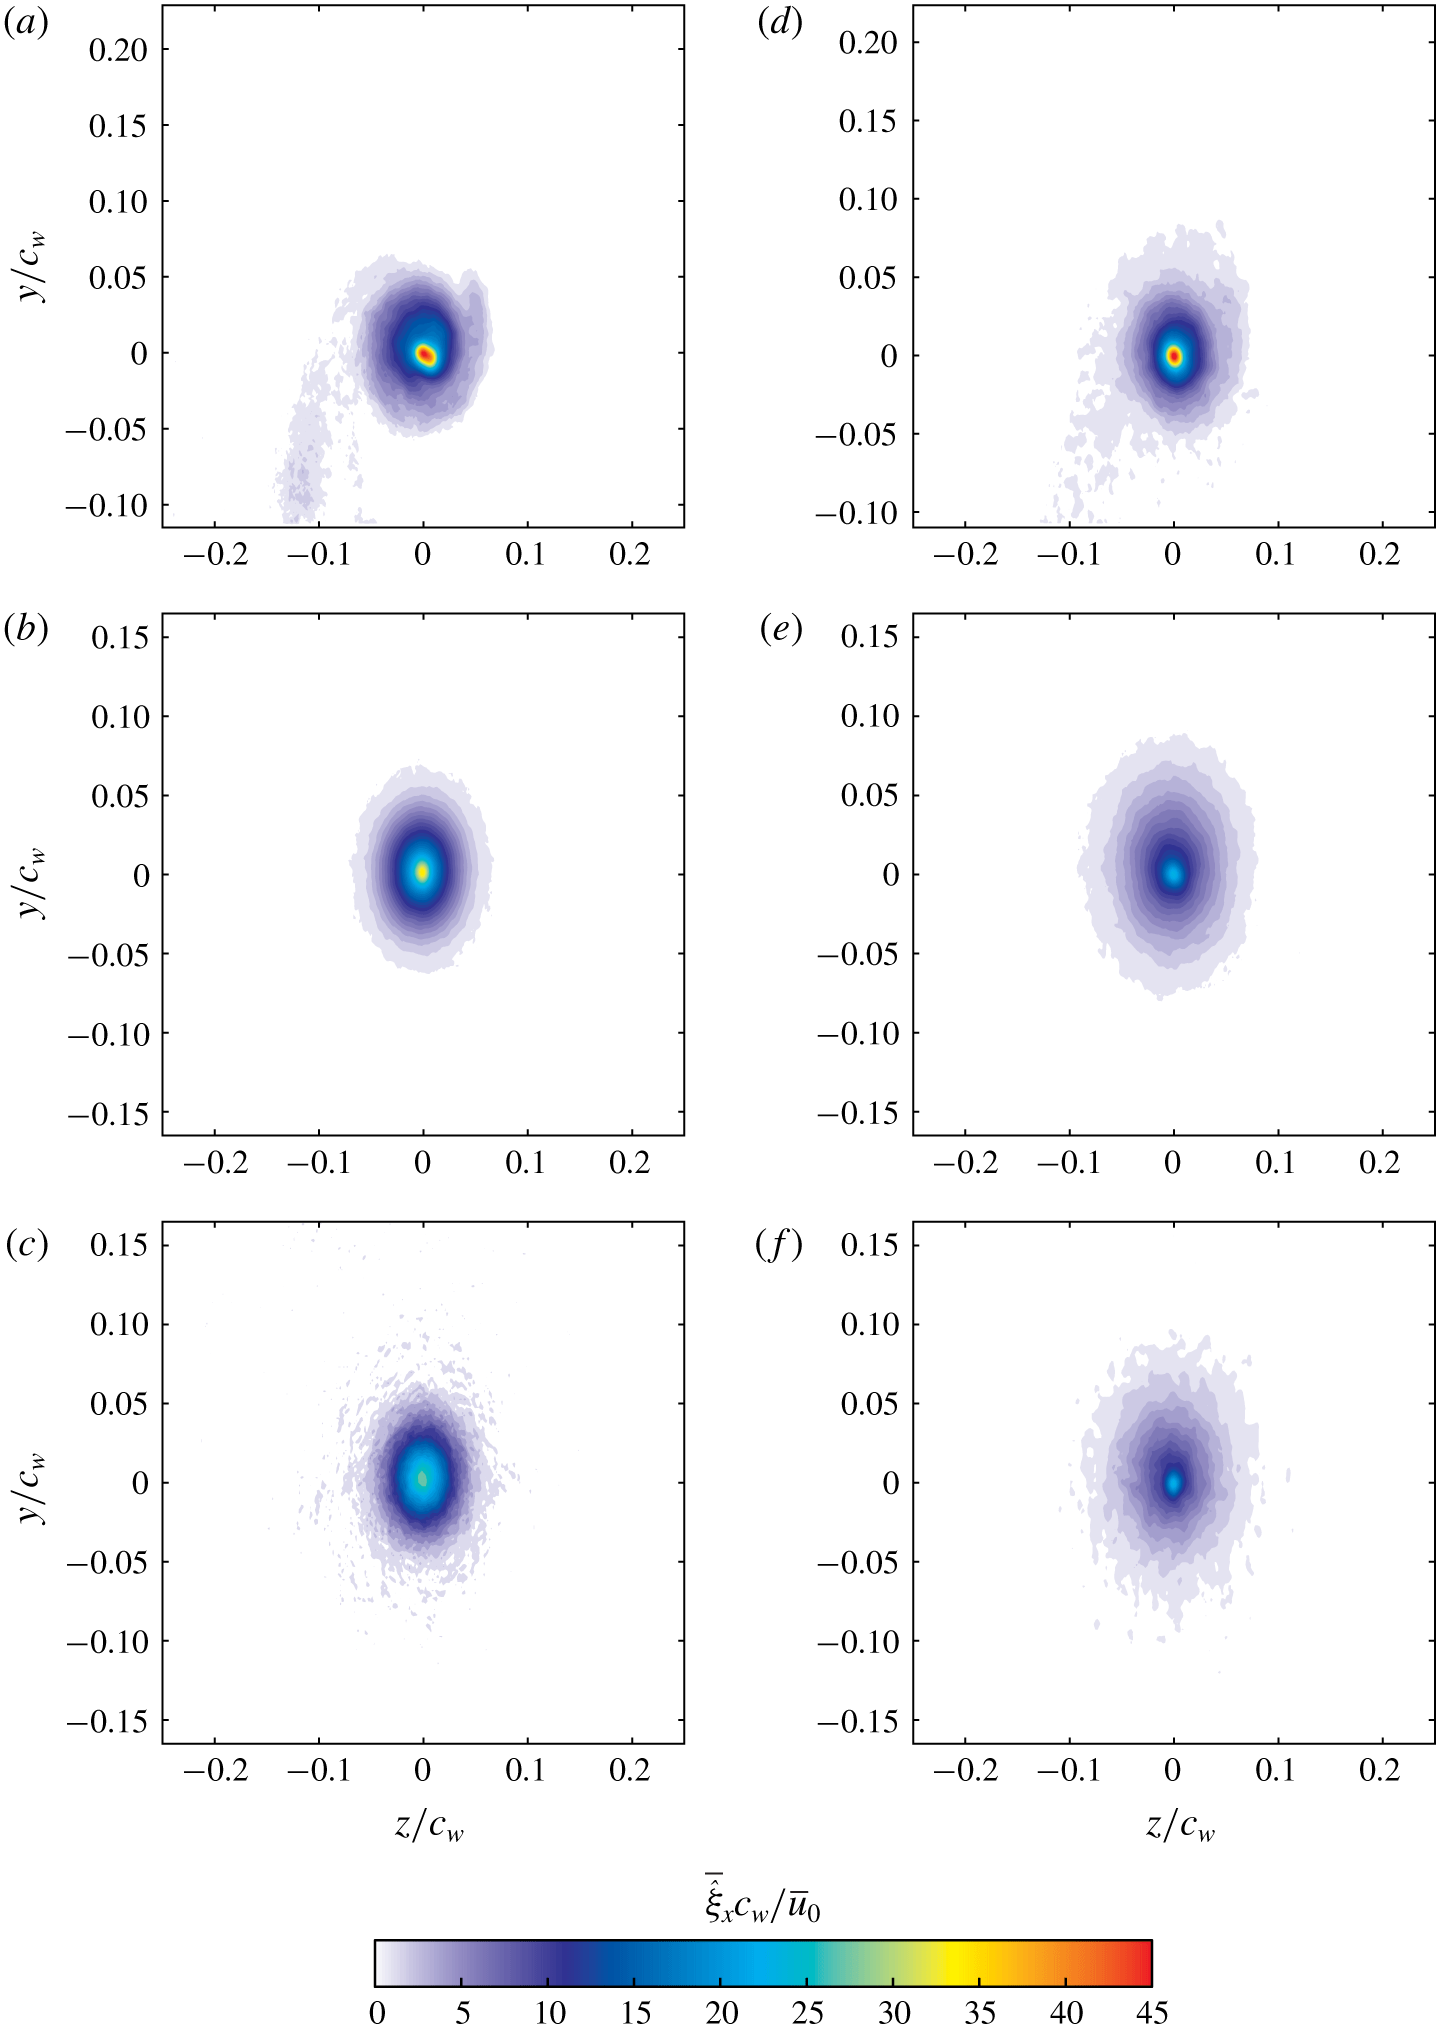
Contours of the normalized meandering-corrected axial vorticity,  $\bar{\hat{\unicode[STIX]{x1D709}}}_{x}\;c_{w}/\bar{u}_{0}$, are plotted in figure 11(a–c) for case C0 and figure 11(d–f) for case C3 at the measurement planes
 $X/c_{w}=1.25,6.25$ and
 $7.75$. For case C0, as the vortex developed downstream, the wake shear layer weakened and its vorticity levels decreased by nearly 50 % at
 $X/c_{w}=7.75$ compared to
 $X/c_{w}=1.25$. With actuation and under case C3, vorticity contours appeared to be more diffuse than C0 and covered a larger area around the vortex core (Margaris & Gursul Reference Margaris and Gursul2006; Dghim et al. Reference Dghim, Ferchichi, Graveline and BenChiekh2014, Reference Dghim, Ferchichi, Perez and BenChiekh2016, Reference Dghim, Ferchichi and Fellouah2017). At
 $X/c_{w}=1.25$, the peak value of
 $\bar{\hat{\unicode[STIX]{x1D709}}}_{x}\;c_{w}/\bar{u}_{0}$ decreased by nearly 20 % compared to C0, in agreement with Dghim et al. (Reference Dghim, Ferchichi and Fellouah2017). As the vortex progressed downstream, its core vorticity decreased substantially from a value of about
 $38$ at
 $X/c_{w}=1.25$ to a value of about
 $20$ at
 $X/c_{w}=7.75$.
Contours of the normalized meandering-corrected axial vorticity for (a–c) C0 and (d–f) C3: (a,d)  $X/c_{w}=1.25$, (b,e)
 $X/c_{w}=6.25$ and (c,f)
 $X/c_{w}=7.75$.

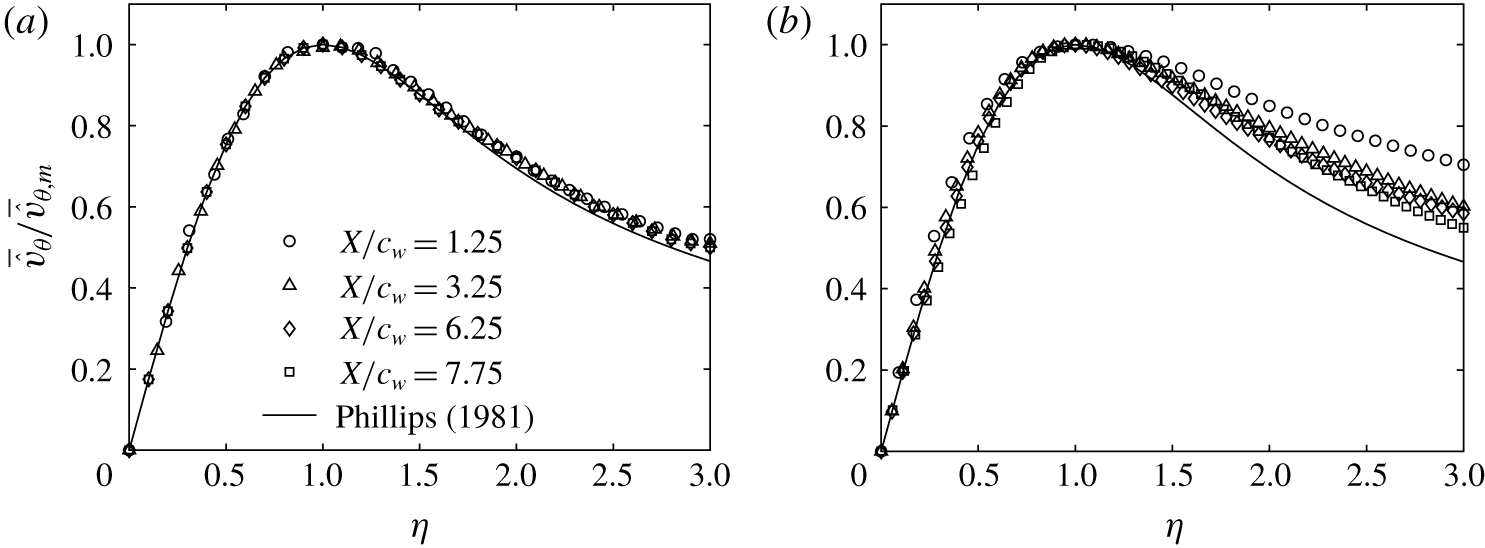
Despite the fact that very crucial three-dimensional effects dominate the genesis of vortex roll-up and formation, Phillips (Reference Phillips1981) reported that the circumferential velocity profiles in the core of a wing-tip vortex adopt a self-similar behaviour, when  $\bar{\hat{v}}_{\unicode[STIX]{x1D703}}$ and
 $r$ are normalized by the peak value,
 $\bar{\hat{v}}_{\unicode[STIX]{x1D703},m}$, and the corresponding radial location,
 $r_{c}$, respectively. The normalized radial positions are denoted with the self-similar variable,
 $\unicode[STIX]{x1D702}=r/r_{c}$. The profiles of the normalized azimuthal velocities fit the following model equation:
 $$\begin{eqnarray}\frac{\bar{\hat{v}}_{\unicode[STIX]{x1D703}}}{\bar{\hat{v}}_{\unicode[STIX]{x1D703},m}}=\left(1+\frac{1}{2\unicode[STIX]{x1D6FC}}\right)\frac{1}{\unicode[STIX]{x1D702}}(1-\text{e}^{-\unicode[STIX]{x1D6FC}\unicode[STIX]{x1D702}^{2}}),\end{eqnarray}$$
where  $\unicode[STIX]{x1D6FC}$ is defined by
 $\text{e}^{\unicode[STIX]{x1D6FC}}=1+2\unicode[STIX]{x1D6FC}$, yielding
 $\unicode[STIX]{x1D6FC}\approx 1.256$. Equation (5.3) along with the experimental data are shown in figure 12(a) for case C0.
Radial profiles of the normalized meandering-corrected azimuthal velocity in a self-similar coordinate system at different downstream positions for (a) C0 and (b) C3.

Inside the vortex core ( $\unicode[STIX]{x1D702}\leqslant 1.2$), a good collapse with the theoretical fit was clearly noticeable at
 $X/c_{w}=1.25$. For larger downstream distances
 $X/c_{w}\geqslant 3$, the profiles of the normalized meandering-corrected azimuthal velocity were found to collapse fairly well with the curve fit proposed in Phillips (Reference Phillips1981), indicating a self-preserved vortex structure. It may be inferred from the data of figure 11(a) that, at
 $X/c_{w}\sim 3$, the roll-up process was completed and the vortex core had evolved asymptotically to reach a nearly axisymmetric distribution. Outside the vortex core (
 $\unicode[STIX]{x1D702}>1.2$), the profiles of
 $\bar{\hat{v}}_{\unicode[STIX]{x1D703}}/\bar{\hat{v}}_{\unicode[STIX]{x1D703},m}$ exhibited a measurable departure from the vortex model (5.3). This departure was observed in previous studies (Sousa & Pereira Reference Sousa and Pereira2000; Bailey, Tavoularis & Lee Reference Bailey, Tavoularis and Lee2006; Del Pino et al. Reference Del Pino, Parras, Felli and Fernandez-Feria2011b; Waldman & Breuer Reference Waldman and Breuer2012) and may be attributed to the large turbulence levels around the vortex core and the smoothing velocity gradients which may lead to a higher spreading rate along the radial direction, as reported in Hoffmann & Joubert (Reference Hoffmann and Joubert1963). Saffman (Reference Saffman1992), however, suggested that the lack of collapse with the theoretical model is presumably caused by the gradual transition between the viscous core region and the outer region dominated by the irrotational flow of the rolling vortex sheet. Under case C3, figure 12(b) shows that the actuation did not appear to alter the structure of the vortex core as the profiles of
 $\bar{\hat{v}}_{\unicode[STIX]{x1D703}}/\bar{\hat{v}}_{\unicode[STIX]{x1D703},m}$ exhibited a reasonable collapse with the theoretical fit at all downstream locations, suggesting an asymptotic state of the vortex core. Outside the core region, profiles of
 $\bar{\hat{v}}_{\unicode[STIX]{x1D703}}/\bar{\hat{v}}_{\unicode[STIX]{x1D703},m}$ were found to move further upward away from the theoretical fit with the effect of being more pronounced at
 $X/c_{w}=1.25$. This atypical behaviour suggests that the SJ of case C3 had significantly affected the region around the vortex core (rolling shear layer) where high-turbulence mixing smeared out velocity gradients of the rotational field, causing a slow deceleration of the azimuthal velocity and, therefore, an increased outward diffusion of vorticity. As the vortex evolved further downstream, it started to gradually regain its axisymmetric shape as the shear layer continued to wrap around the now weakened vortex, resulting in a higher decrease of the azimuthal velocity in the outer region of the vortex.
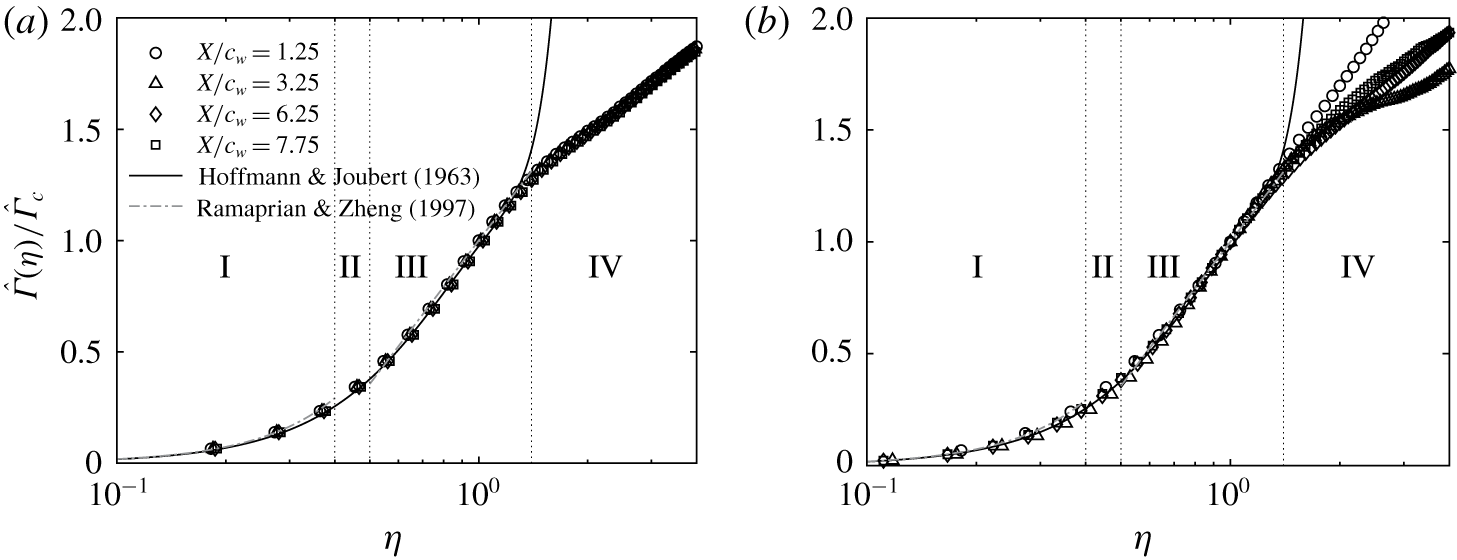
The effect of control on the vortex core structure can be further demonstrated from a close examination of the radial distribution of the normalized circulation,  $\hat{\unicode[STIX]{x1D6E4}}/\hat{\unicode[STIX]{x1D6E4}}_{c}$, plotted against the similarity variable,
 $\unicode[STIX]{x1D702}$, for different downstream positions as illustrated in figure 13(a) and 13(b) for cases C0 and C3, respectively. Empirical curve fitting relationships suggested by Hoffmann & Joubert (Reference Hoffmann and Joubert1963), which describe the circulation behaviour within the inner core and the logarithmic regions of the vortex, were fitted to the radial profiles of
 $\hat{\unicode[STIX]{x1D6E4}}(\unicode[STIX]{x1D702})/\hat{\unicode[STIX]{x1D6E4}}_{c}$ of cases C0 and C3 with the following expressions:
 $$\begin{eqnarray}\displaystyle & \displaystyle \frac{\hat{\unicode[STIX]{x1D6E4}}(\unicode[STIX]{x1D702})}{\hat{\unicode[STIX]{x1D6E4}}_{c}}=A\unicode[STIX]{x1D702}^{2}\quad \text{for }\unicode[STIX]{x1D702}<0.4, & \displaystyle\end{eqnarray}$$
 $$\begin{eqnarray}\displaystyle & \displaystyle \frac{\hat{\unicode[STIX]{x1D6E4}}(\unicode[STIX]{x1D702})}{\hat{\unicode[STIX]{x1D6E4}}_{c}}=1+B\log (\unicode[STIX]{x1D702})\quad \text{for }0.5<\unicode[STIX]{x1D702}<1.4, & \displaystyle\end{eqnarray}$$
where the constants  $A$ and
 $B$ are 1.83 and 0.93, respectively. In figure 13(a), a reasonable agreement between the measured profiles of
 $\hat{\unicode[STIX]{x1D6E4}}(\unicode[STIX]{x1D702})/\hat{\unicode[STIX]{x1D6E4}}_{c}$ of case C0 with the curve fit equations (5.4) and (5.5) was evident for the downstream positions
 $X/c_{w}>3$. In the region
 $X/c_{w}\leqslant 3$, the profile of
 $\hat{\unicode[STIX]{x1D6E4}}(\unicode[STIX]{x1D702})/\hat{\unicode[STIX]{x1D6E4}}_{c}$ exhibited a departure from the empirical curve fits in the inner and outer region of the vortex, suggesting that the roll-up process was incomplete and that the vortex has yet to reach a self-similar state. These observations corroborate the results of figure 11(a). For
 $0<\unicode[STIX]{x1D702}<1.2$, these profiles collapsed together onto a sixth-order polynomial suggested by Ramaprian & Zheng (Reference Ramaprian and Zheng1997) and Birch et al. (Reference Birch, Lee, Mokhtarian and Kafyeke2004) following the expression
 $$\begin{eqnarray}\frac{\hat{\unicode[STIX]{x1D6E4}}(\unicode[STIX]{x1D702})}{\hat{\unicode[STIX]{x1D6E4}}_{c}}=a_{0}\unicode[STIX]{x1D702}^{2}+a_{1}\unicode[STIX]{x1D702}^{4}+a_{2}\unicode[STIX]{x1D702}^{6},\end{eqnarray}$$
where the constants  $a_{0}$,
 $a_{1}$ and
 $a_{2}$ are 1.756,
 $-1.044$ and 0.263, respectively. With control, circulation profiles in the inner region of the vortex were in excellent agreement with the curve fits suggested by Hoffmann & Joubert (Reference Hoffmann and Joubert1963), Ramaprian & Zheng (Reference Ramaprian and Zheng1997) and Birch et al. (Reference Birch, Lee, Mokhtarian and Kafyeke2004), as shown in figure 13(b). Inside the inner core region (I), the self-similar circulation profiles of cases C0 and C3 were
 $\propto \unicode[STIX]{x1D702}$ and exhibited a parabolic shape. This indicated that this region was mainly dominated by the viscous effect where the vortex core had an approximately rigid-body rotation (Hoffmann & Joubert Reference Hoffmann and Joubert1963; Devenport et al. Reference Devenport, Rife, Liapis and Follin1996). As opposed to case C0, no collapse between the circulation profiles was observed in the outer region (IV) of the controlled vortex. This suggests that, although the vortex core under the control case C3 regained a well-organized and axisymmetric structure while being convected downstream, the increase in circulation caused by the SJ momentum injection would require larger downstream distances before the outer region of the vortex can reach an asymptotic state (Dghim et al. Reference Dghim, Ferchichi, Perez and BenChiekh2016).
Self-similar meandering-corrected circulation profiles of the inner region at different downstream positions for (a) C0 and (b) C3: I, inner core; II, buffer region; III, logarithmic region; IV, outer region.

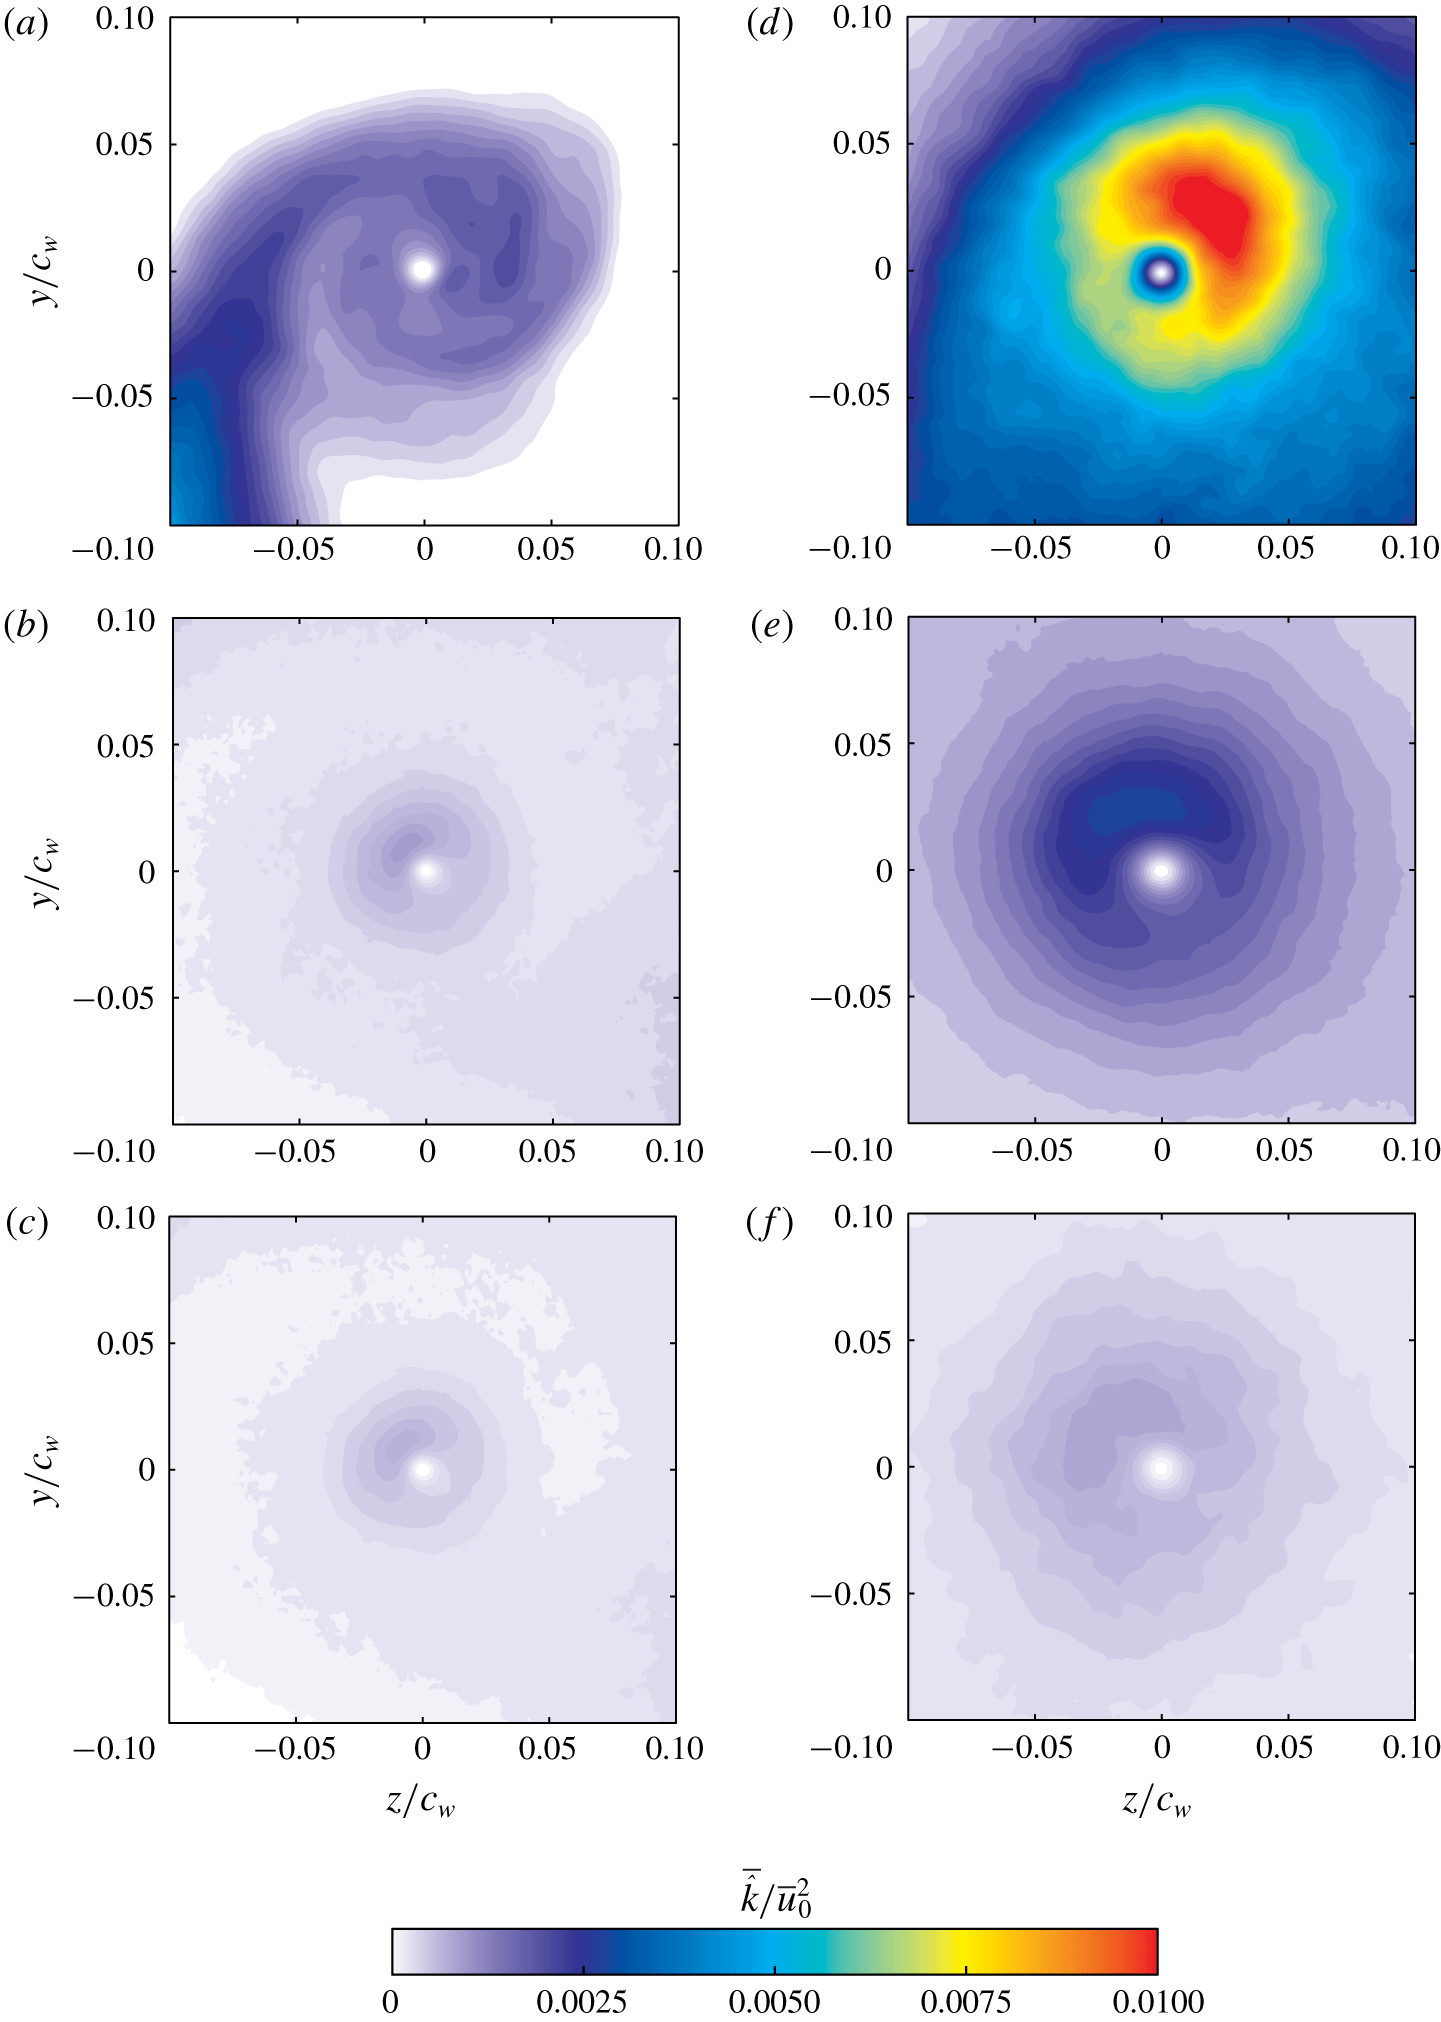
In order to gain more insight into the mechanisms of vortex weakening and diffusion under the effect of the SJ actuation, the normalized TKE,  $\bar{\hat{k}}/{\bar{u}_{0}}^{2}$, is plotted in figure 14(a–c) for case C0 and figure 14(d–f) for case C3 at measurement planes
 $X/c_{w}=1.25,6.25$ and
 $7.75$. For case C0 at
 $X/c_{w}=1.25$, the highest values of
 $\bar{\hat{k}}/{\bar{u}_{0}}^{2}$ were concentrated in the wake shear layer region with a peak value of about
 $5\times 10^{-3}$. Contours of
 $\bar{\hat{k}}/{\bar{u}_{0}}^{2}$ showed also a turbulence-free region at the mean vortex centre location. Furthermore, a region of weak TKE levels was concentrated around the vortex core where the peak value was about
 $3\times 10^{-3}$. As the vortex evolved downstream, the TKE in the shear layer decreased as a result of the wake shear layer thickening. The vortex core remained turbulence-free and the peak value of the TKE in the periphery of the vortex core decreased by nearly 60 % as the vortex was convected to
 $X/c_{w}=7.75$. This can be attributed to the high viscous effects and the strong stabilizing Coriolis effect surrounding the vortex core region. For case C3, the turbulence introduced by the SJ into the vortex was found to cover a larger region around the vortex core region, with a peak value of about 0.012. Note that the region of high turbulence appeared to be stretched in the spanwise direction, similar to the stretching observed in both velocity and vorticity contours. The croissant-shaped region of concentrated turbulence evolved into a more axisymmetric shape around the core as the vortex was convected downstream. Furthermore, the region of high TKE levels was found to spread over a larger radial area compared to case C0. The increased turbulent diffusion of the vortex under case C3 caused the peak value of
 $\bar{\hat{k}}/{\bar{u}_{0}}^{2}$ to decrease by nearly 60 % as the vortex was convected to
 $X/c_{w}=7.75$.
Contours of the normalized meandering-corrected TKE at different downstream positions for (a–c) C0 and (d–f) C3: (a,d)  $X/c_{w}=1.25$, (b,e)
 $X/c_{w}=6.25$ and (c,f)
 $X/c_{w}=7.75$.

5.3 Effect of active flow control on vortex meander
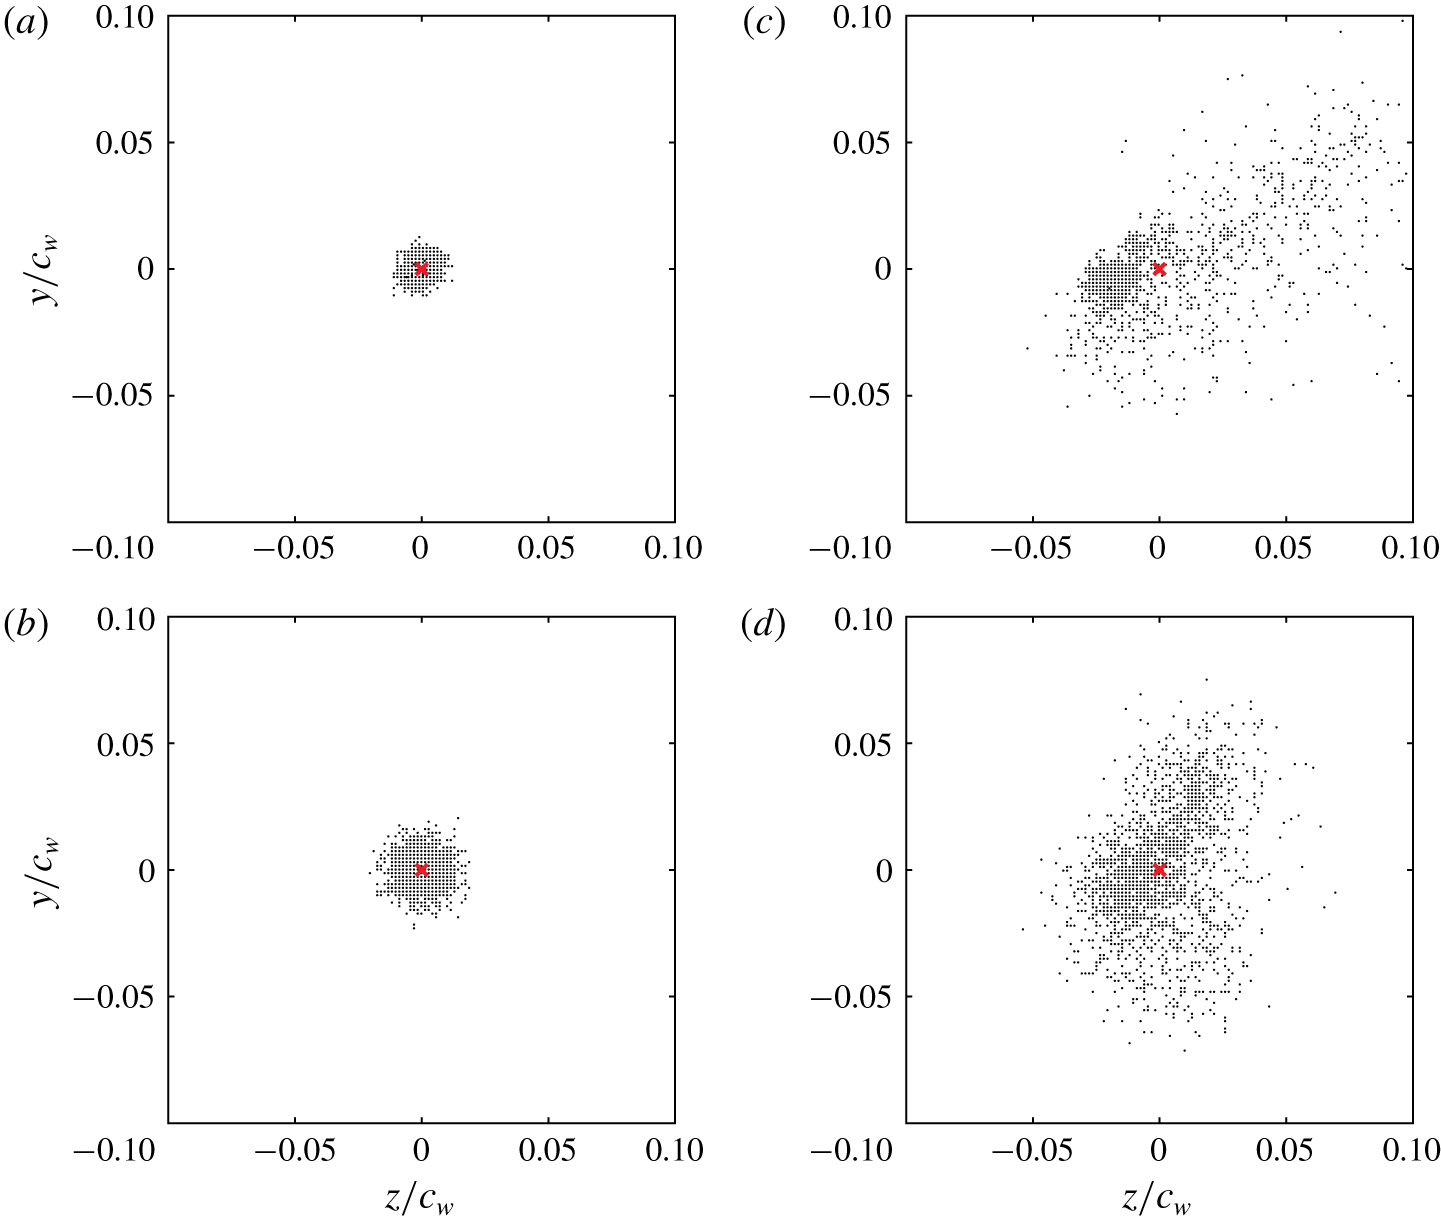
Vortex meandering can be quantified by examining the instantaneous position of the vortex centre. In practice, these positions are extracted from each individual SPIV velocity field by computing the  $\unicode[STIX]{x1D6E4}_{1}$ function defined by Graftieaux et al. (Reference Graftieaux, Michard and Grosjean2001), as detailed in § 4.1. The in-plane coordinates of the vortex centre locations were then plotted with respect to the ensemble-averaged vortex position
 $(z_{w},y_{w})=(0,0)$, as indicated by the red cross symbols plotted in figure 15. In figure 15(a), the scatter of the instantaneous vortex positions of case C0 at
 $X/c_{w}=1.25$ exhibited a nearly symmetric distribution around the mean vortex position with no particularly preferred direction. As the vortex evolved to
 $X/c_{w}=6.25$, the magnitude of the vortex position scatter, referred to as meandering amplitude, was found to increase; however, the dispersion pattern was similar to that observed at
 $X/c_{w}=1.25$. It is reasonable to assume that, within the experimental uncertainty of the present study, the vortex centre positions may be fitted fairly well with a joint probability distribution function (j.p.d.f.) where the meandering amplitudes can be represented by their corresponding standard deviations
 $\unicode[STIX]{x1D70E}_{z}$ and
 $\unicode[STIX]{x1D70E}_{y}$ in
 $z$ and
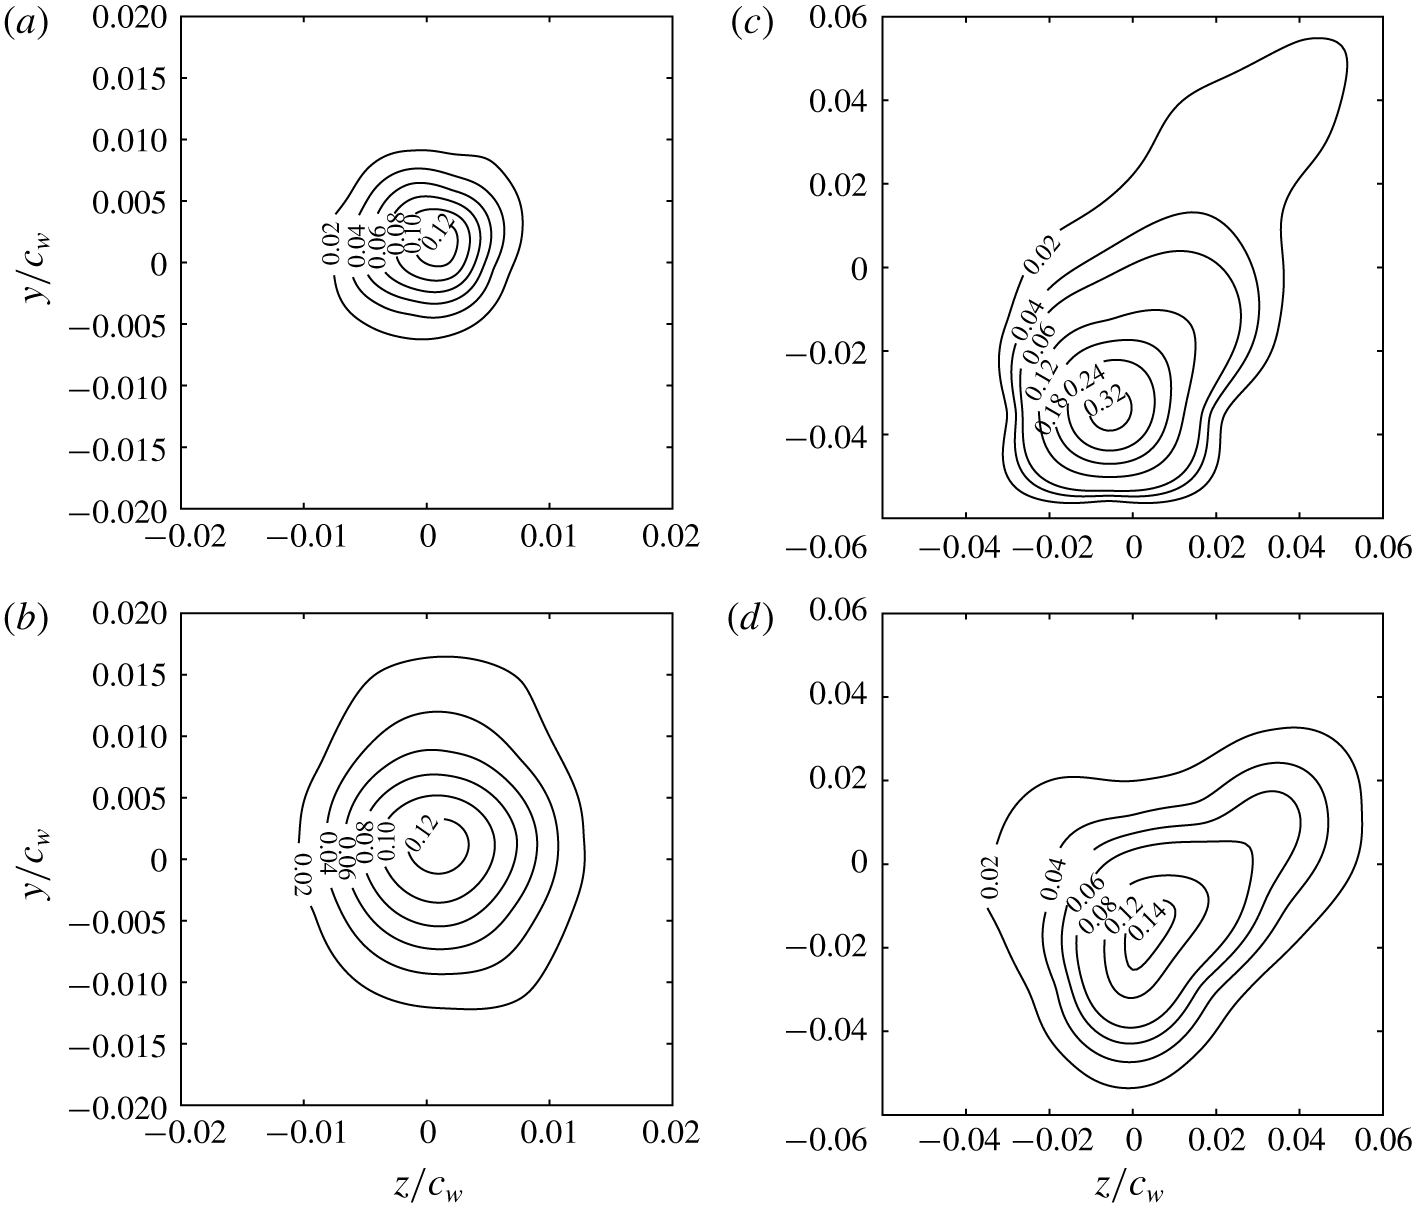
 $y$ directions, respectively (Devenport et al. Reference Devenport, Rife, Liapis and Follin1996; Bailey & Tavoularis Reference Bailey and Tavoularis2008; Bailey et al. Reference Bailey, Estejab, Robert and Tavoularis2011; Edstrand et al. Reference Edstrand, Davis, Schmid, Taira and Cattafesta2016). In figure 17(a,b), the j.p.d.f. of case C0 showed concentric iso-contours with nearly circular shapes, covering larger radii with increased downstream distances. With control, figure 15(c,d) indicates a rather less organized motion of the instantaneous vortex centres about the mean vortex location. Note that the scatter of the vortex positions displayed an oblique angle canted at approximately
 $45^{\circ }$ with respect to the spanwise direction. At
 $X/c_{w}=1.25$, the amplitude of meandering in the upper right quadrant,
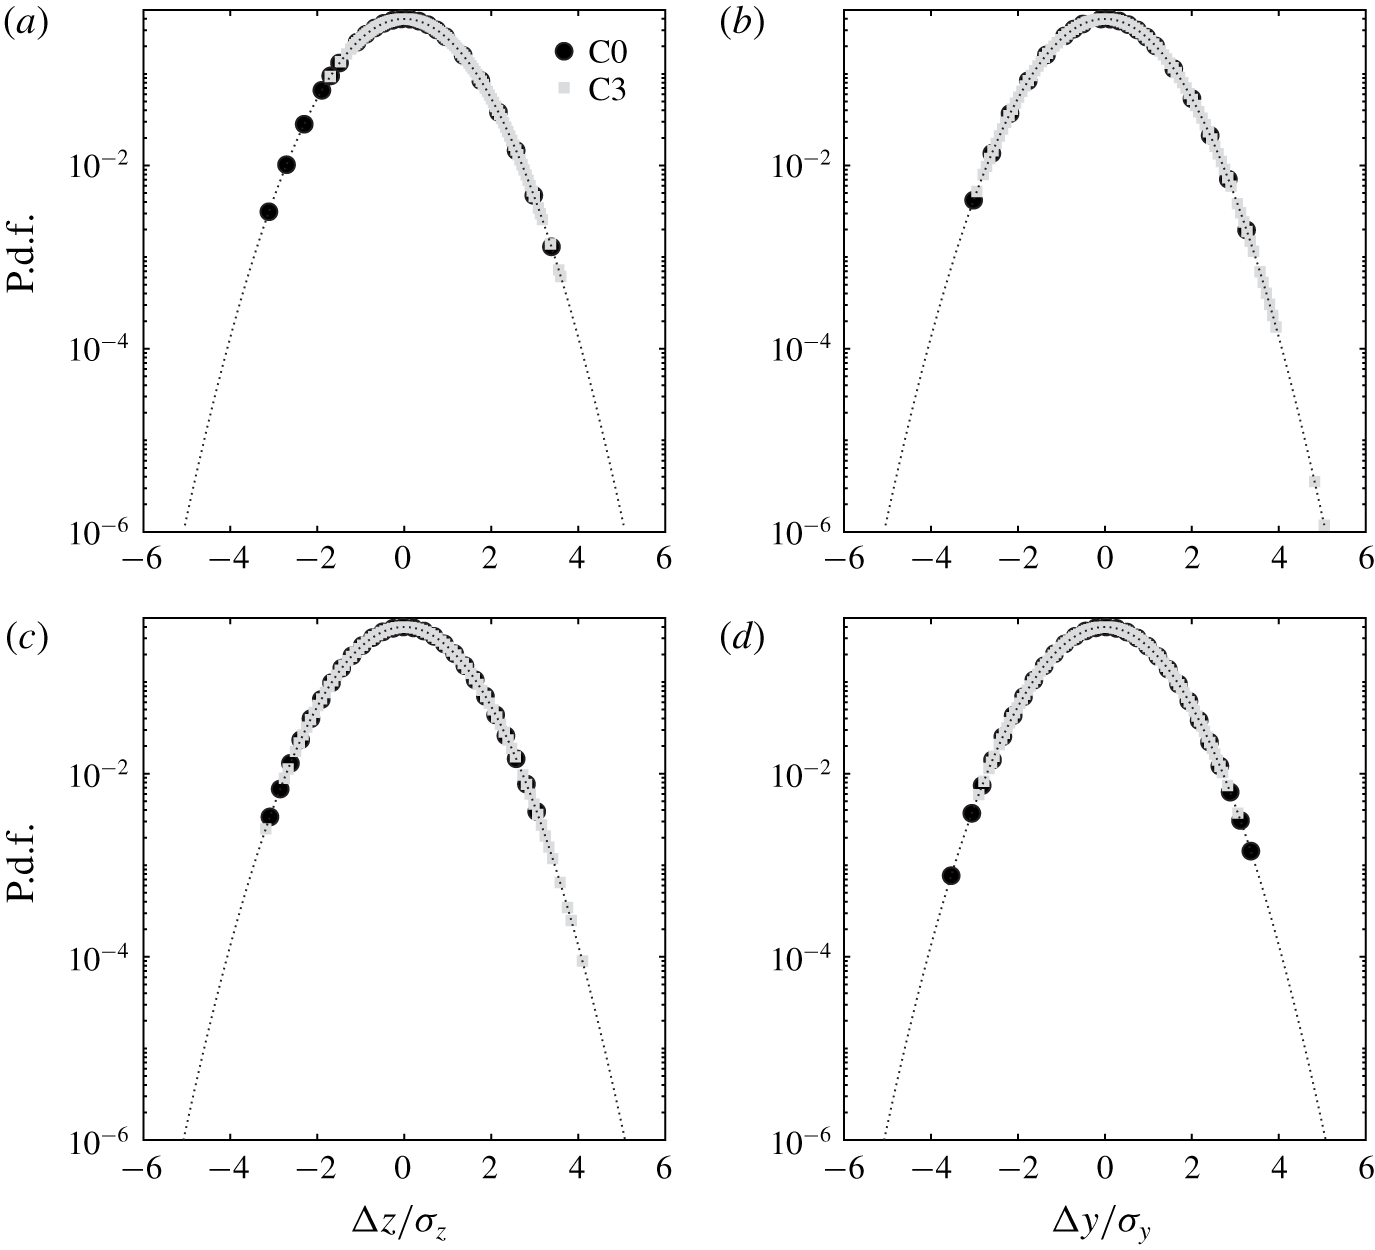
 $(z,y)>0$, was measured to be approximately three times larger than the amplitudes in the other directions. The asymmetry in the scatter of the vortex centre positions appeared to be consistent with the stretching observed in the contours of the mean flow field (see § 5.2), and is believed to be triggered by the SJ actuation which tends to push the vortex away from the wing tip. This is clearly illustrated in the p.d.f. of the instantaneous vortex centre displacement of case C3 shown in figure 16. In this figure, short excursions of the vortex centre positions were mostly clustered around the mean vortex centre for both cases C0 and C3. Their occurrences were characterized with high probabilities and were associated with occurrences clustered around the mean vortex centre position, whereas large excursions of the vortex centre positions under the effect of SJ actuation were characterized with low probabilities. Moreover, the asymmetry of the meandering direction was corroborated by the elliptical j.p.d.f. contours which showed slightly eccentric probability levels towards the preferred meandering direction. Further downstream, the helical nature of the rolling vortex forced the oblique angle of the meandering scatter to rotate around the mean vortex axis and, as the vortex reached
 $X/c_{w}=6.25$, the meandering direction was found to be predominately aligned with the spanwise direction (figure 15d). The scatter remained essentially anisotropic and the j.p.d.f. iso-contours exhibited eccentric ellipsoidal shapes with the major axis canted at approximately
 $60^{\circ }$ with respect to the spanwise direction, as illustrated in figure 17(d).
Instantaneous vortex centre positions at  $X/c_{w}=1.25$ (a,c) and 6.25 (b,d) for (a,b) C0 and (c,d) C3.

The p.d.f. of the displacement of the instantaneous vortex centre positions in both  $z$ (a,c) and
 $y$ (b,d) directions at (a,b)
 $X/c_{w}=1.25$ and (c,d)
 $X/c_{w}=6.25$. Dotted lines indicate Gaussian p.d.f.

Contours of the j.p.d.f. of the instantaneous vortex centre positions evaluated at  $X/c_{w}=1.25$ (a,c) and
 $6.25$ (b,d) for (a,b) C0 and (c,d) C3.

The streamwise development of the  $z$ and
 $y$ meandering amplitudes,
 $\unicode[STIX]{x1D70E}_{z}$ and
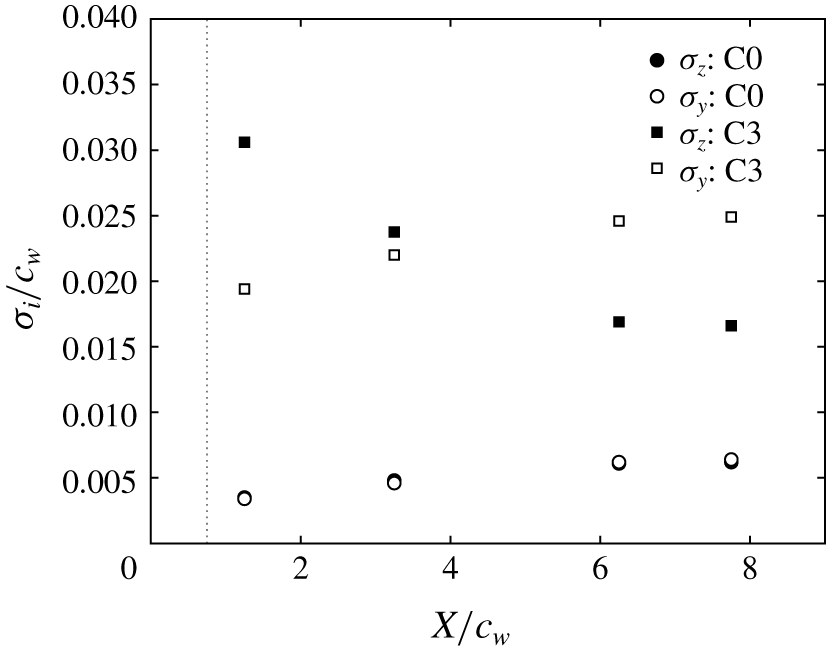
 $\unicode[STIX]{x1D70E}_{y}$, is summarized in figure 18. For case C0, the meandering amplitudes were found to grow with increasing streamwise distance, consistent with previous observations (Devenport et al. Reference Devenport, Rife, Liapis and Follin1996; Heyes & Smith Reference Heyes and Smith2004; Bailey & Tavoularis Reference Bailey and Tavoularis2008; Beresh et al. Reference Beresh, Henfling and Spillers2010). More interestingly, at
 $X/c_{w}=6.25$, the meandering amplitudes, under the SJ actuation of case C3, were 8 and 5 times higher than those of C0 in the
 $z$ and
 $y$ directions, respectively. The higher meandering amplitude in the
 $z$ direction was consistent with the iso-contours of the j.p.d.f. displayed in figure 17(c). As the vortex evolved downstream,
 $\unicode[STIX]{x1D70E}_{z}/c_{w}$ was seen to rapidly drop from a value of 0.03 at
 $X/c_{w}=1.25$ to a value of 0.017 at
 $X/c_{w}=6.25$, where it appeared to reach a nearly asymptotic value. In contrast,
 $\unicode[STIX]{x1D70E}_{z}/c_{w}$ exhibited an exact opposite behaviour as it increased from a value of about 0.02 to an asymptotic value of about 0.025 at
 $X/c_{w}>6$. The mirrored behaviours of the meandering amplitudes clearly substantiate the angular inversions observed in the skewed j.p.d.f. iso-contours caused by the helical structure of the rolling vortex. Despite reaching nearly asymptotic values for
 $X/c_{w}>6$,
 $\unicode[STIX]{x1D70E}_{z}/c_{w}$ and
 $\unicode[STIX]{x1D70E}_{y}/c_{w}$ remained substantially larger than those evaluated for case C0.
Vortex meandering amplitudes  $\unicode[STIX]{x1D70E}_{z}$ and
 $\unicode[STIX]{x1D70E}_{y}$ at different downstream positions.

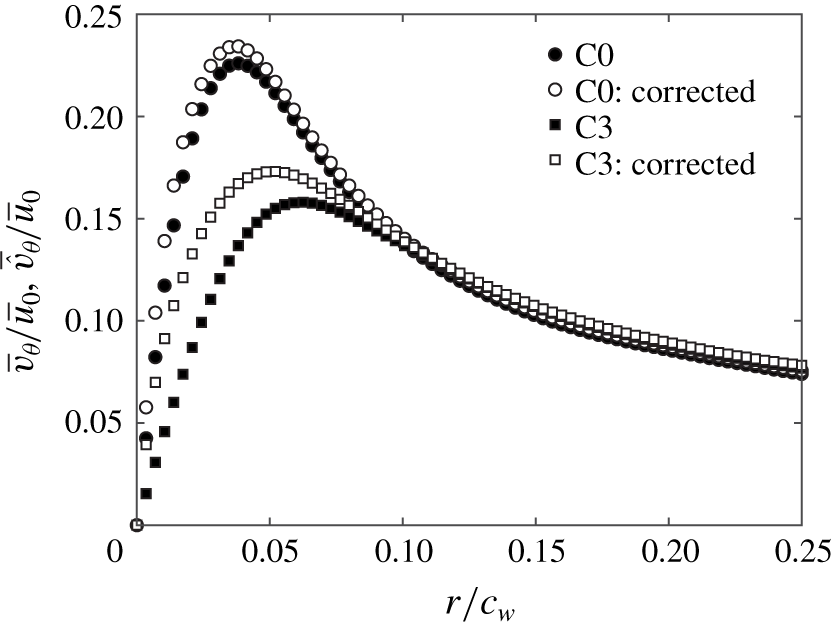
As noted earlier, meandering was known to create artificially reduced azimuthal velocity and increased vortex core radius (Baker et al. Reference Baker, Barker, Bofah and Saffman1974; Devenport et al. Reference Devenport, Rife, Liapis and Follin1996; Heyes et al. Reference Heyes, Jones and Smith2004; Bailey & Tavoularis Reference Bailey and Tavoularis2008; Beresh et al. Reference Beresh, Henfling and Spillers2010, Reference Beresh, Wagner and Pruett2012). In fact, Devenport et al. (Reference Devenport, Rife, Liapis and Follin1996) reported that the azimuthal velocity and the vortex radii were altered by nearly 15 %, while Bailey & Tavoularis (Reference Bailey and Tavoularis2008) found velocity changes nearing 50 % at high free-stream turbulence levels. Insignificant meandering effects were, however, found in Heyes et al. (Reference Heyes, Jones and Smith2004) and Beresh et al. (Reference Beresh, Henfling and Spillers2010). Considering the significant meandering amplitudes reported in this study, an ultimate correction was believed to be necessary in order to isolate the effect of vortex meander from the effect of active flow control on both mean and turbulence flow fields. Profiles of the corrected and uncorrected ensemble-averaged azimuthal velocities,  $\bar{\hat{v}}_{\unicode[STIX]{x1D703}}/\bar{u}_{0}$ and
 $\bar{v}_{\unicode[STIX]{x1D703}}/\bar{u}_{0}$, respectively, are plotted in figure 19 for both cases C0 and C3 at the selected streamwise position
 $X/c_{w}=6.25$. For case C0, a nearly 5 % increase in the peak value of the azimuthal velocity was achieved with meandering correction; however, no significant effect was observed on the vortex radius. It is believed that the indistinguishable effect of the meandering correction on the mean azimuthal velocity of case C0 is probably attributed to the higher turbulent fluctuations within the vortex core compared to the meandering-induced turbulence, as suggested in Shah et al. (Reference Shah, Atsavapranee, Hsu, Wei and McHugh1999) and Beresh et al. (Reference Beresh, Henfling and Spillers2010). With control, the peak value of the corrected azimuthal velocity,
 $\bar{\hat{v}}_{\unicode[STIX]{x1D703}}/\bar{u}_{0}$, was measured to be 10 % higher than that of
 $\bar{v}_{\unicode[STIX]{x1D703}}/\bar{u}_{0}$. This increase was associated with a nearly 20 % decrease in the vortex radius.
Profiles of the raw and meandering-corrected azimuthal velocities for cases C0 and C3, evaluated at  $X/c_{w}=6.25$.

The significant vortex diffusion caused by the increased meandering effect under the SJ actuation can be inferred by closely examining the contours of the normalized TKE for both uncorrected and corrected flow fields. In figure 20(a), contours of the uncorrected TKE,  $\bar{k}/\bar{u}_{0}$, of case C0 exhibited a peak value of about 0.006 within the vortex core surrounded by low TKE levels in the core periphery and the wake shear layer. On the other hand, contours of the meandering-corrected TKE,
 $\bar{\hat{v}}_{\unicode[STIX]{x1D703}}/\bar{u}_{0}$, revealed a strikingly different behaviour. In that, figure 20(b) shows a turbulence-free vortex core where TKE levels at the vortex centre were measured to be zero. Outside the core region, turbulence was evidenced by a croissant-shaped lobe of lower TKE levels surrounding the vortex core. The existence of a laminar core at the centre of the vortex surrounded by low turbulence levels near the core radius has previously been observed experimentally by Bandyopadhyay, Ash & Stead (Reference Bandyopadhyay, Ash and Stead1991), Devenport et al. (Reference Devenport, Rife, Liapis and Follin1996) and Beresh et al. (Reference Beresh, Henfling and Spillers2010) and computationally by Ragab & Sreedhar (Reference Ragab and Sreedhar1995), and has been further supported by the analytical studies of Cotel & Breidenthal (Reference Cotel and Breidenthal1999) and Jacquin & Pantano (Reference Jacquin and Pantano2002). This behaviour arises from the stabilizing Coriolis effects of the strong rotational motion inside the vortex core which tends to relaminarize the turbulent fluid crossing the periphery of the vortex. The existence of the turbulent region around the vortex core is mainly attributed to the strong shearing between the laminar core and the rolling turbulent wake. It is noteworthy that the meandering correction was found to reduce the peak level of TKE around the vortex core by nearly 90 % compared to the values measured at the vortex centre of the uncorrected results. Despite the higher TKE levels recorded for the actuated vortex, the core region exhibited virtually similar behaviour to that observed in the uncorrected flow field of case C0, as illustrated in figure 20(c). In fact, the peak value of
 $\bar{v}_{\unicode[STIX]{x1D703}}/\bar{u}_{0}$ at the vortex centre was approximately 70 % higher than that of the natural vortex and higher TKE levels were found to cover a larger area of the vortex core. With correction, the meandering-induced turbulence at the centre of the vortex was essentially removed, as shown in figure 20(d), and the peak value of
 $\bar{\hat{v}}_{\unicode[STIX]{x1D703}}/\bar{u}_{0}$ near the vortex radius was nearly three times higher that that of case C0. Additionally, the size of the croissant-shaped annulus of turbulence around the core was noticeably larger and covered larger radial area. This suggests that more turbulent fluid is believed to be ingested into the vortex core under the effect of the SJ actuation causing higher turbulent mixing and therefore larger momentum transfer between the turbulent shear layer and the vortex core. The latter plays a key role in smoothing the velocity gradient of the rotational field across the periphery of the vortex core which results in a decreased azimuthal velocity and an enhanced outward diffusion of vorticity (Bailey & Tavoularis Reference Bailey and Tavoularis2008). Note that, despite the high level of turbulence injected by the SJ turbulent structures, a relaminarization process was observed at the vortex core owing to the strong stabilizing nature of the rotating flow field therein (Bailey & Tavoularis Reference Bailey and Tavoularis2008; Beresh et al. Reference Beresh, Henfling and Spillers2010).
Contours of the normalized TKE at  $X/c_{w}=6.25$ evaluated using (a) raw data of case C0, (c) raw data of case C3, (b) meandering-corrected data of case C0 and (d) meandering-corrected data of case C3.

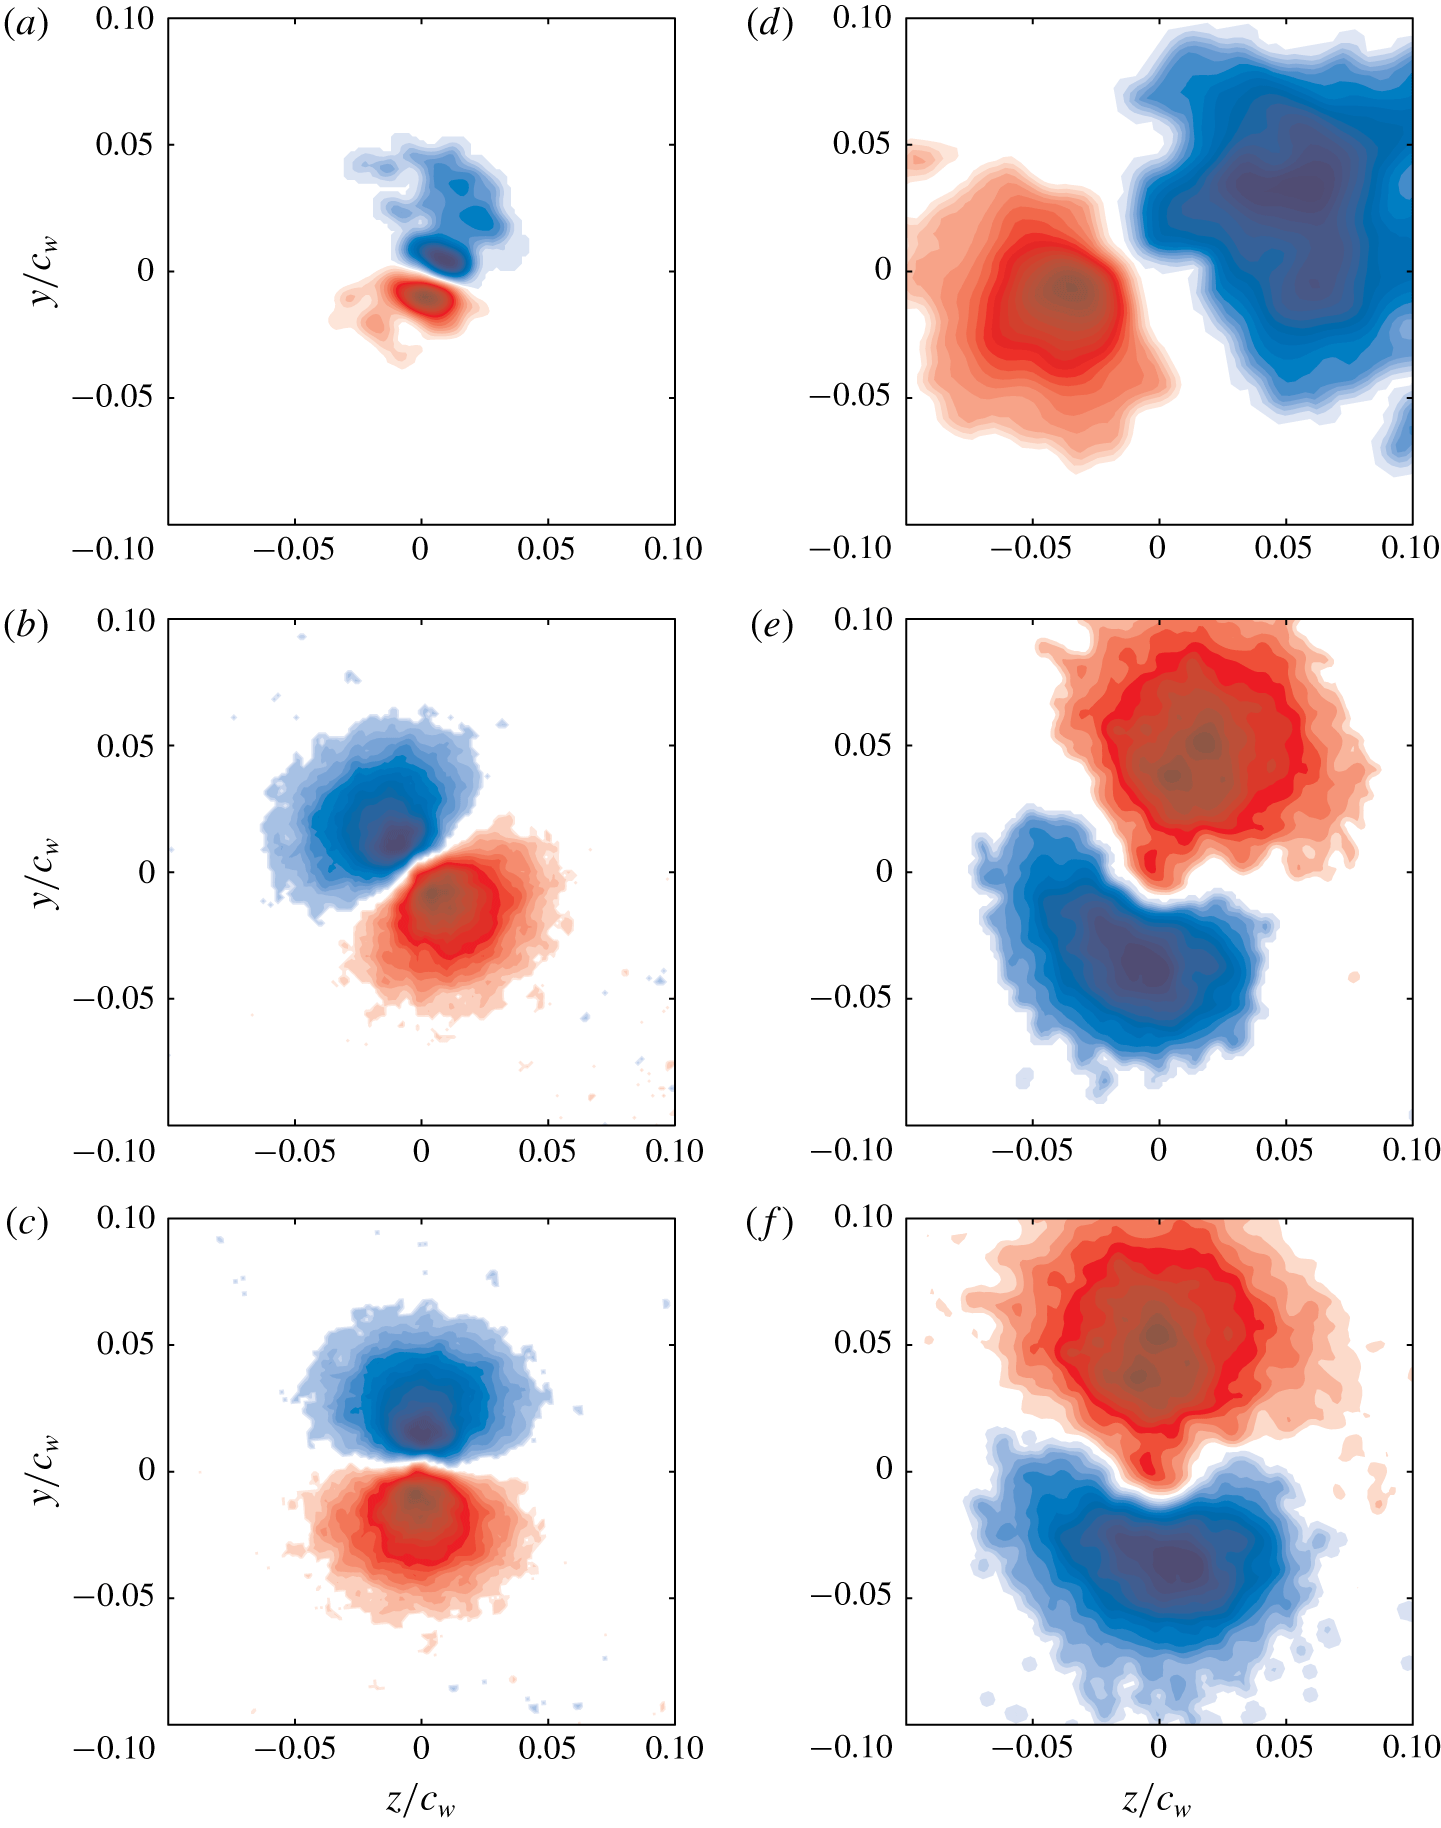
Axial vorticity contours of the first POD mode evaluated at  $X/c_{w}=1.25$ (a,d),
 $6.25$ (b,e) and
 $7.75$ (c,f) for (a–c) C0 and (d–f) C3.

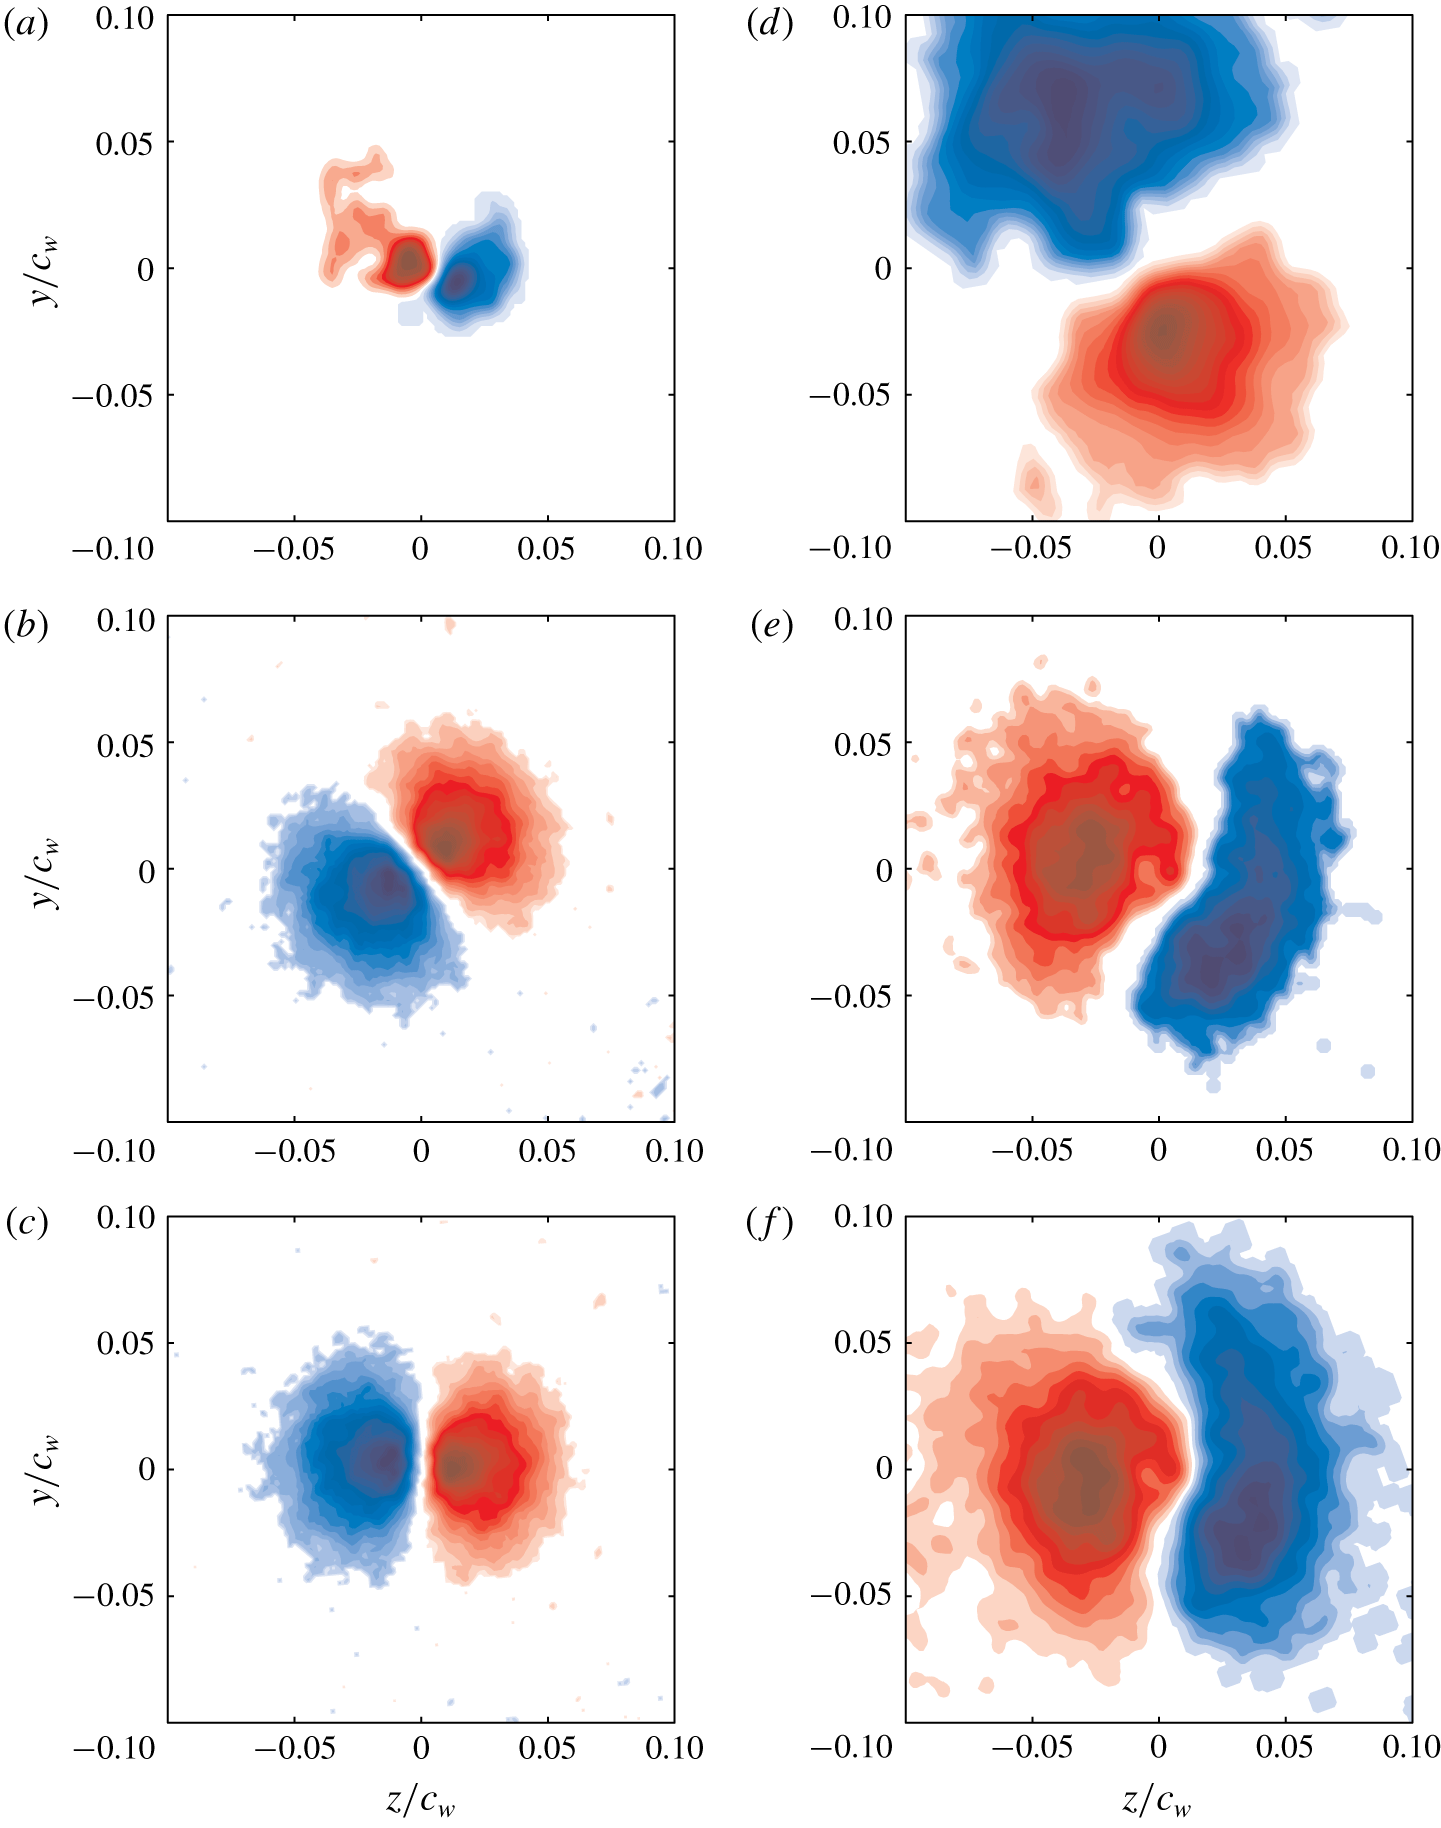
Axial vorticity contours of the second POD mode evaluated at  $X/c_{w}=1.25$ (a,d),
 $6.25$ (b,e) and
 $7.75$ (c,f) for (a–c) C0 and (d–f) C3.

5.4 Modal analysis of the mechanism of vortex diffusion
In order to elucidate the most energetic flow features responsible for vortex diffusion under the effect of SJ actuation, SPOD, detailed in § 4.3, was performed on the coherent component of the velocity field. The vorticity contours of the first POD mode are shown in figure 21(a–c) for case C0 and figure 21(d–f) for case C3 at the measurement planes  $X/c_{w}=1.25,6.25$ and
 $7.75$. Vorticity contours of the second POD mode are illustrated in figure 22(a–c) for case C0 and figure 22(d–f) for case C3 at the measurement planes
 $X/c_{w}=1.25,6.25$ and
 $7.75$. At
 $X/c_{w}=1.25$, the first mode of case C0 showed spiralling vorticity contours which are associated with the coherent wake shear layer. Around the vortex centre location, two opposite regions of relatively high vorticity were clearly observed. At distances further downstream, the two symmetric vorticity regions of opposite signs were seen to grow into a nearly circular vortex dipole centred around the mean vortex centre, as illustrated in figure 21(b,c). This vortex dipole constitutes the helical displacement of the vortex with an azimuthal wavenumber
 $m=1$, in agreement with the observations of Roy & Leweke (Reference Roy and Leweke2008), Roy et al. (Reference Roy, Leweke, Thompson and Hourigan2011), Del Pino et al. (Reference Del Pino, Lopez-Alonso, Parras and Fernandez-Feria2011a), Mula & Tinney (Reference Mula and Tinney2015) and Edstrand et al. (Reference Edstrand, Davis, Schmid, Taira and Cattafesta2016). The azimuthal symmetry of the vortex dipole is mainly associated with the global lateral displacement of the vortex where the decrease in one of the vortex doublets is compensated by an increase in the other, resulting in an overall helical displacement of the vortex core (Fabre, Sipp & Jacquin Reference Fabre, Sipp and Jacquin2006). It can be inferred from figure 22 that the second POD mode exhibits a similar behaviour the first mode with the vortex dipoles being orthogonal to those of the first mode. It is believed that the first two modes are paired and orthogonally rotate together as the vortex evolves downstream, as reported in Mula & Tinney (Reference Mula and Tinney2014, Reference Mula and Tinney2015). However, no conclusions on the direction of rotation can be drawn from figures 21 and 22 due to the insufficient temporal resolution of the measurements. The helical displacement illustrated with the two symmetric counter-rotating eddies resembles the spatial structure of the helical
 $(m=1)$ mode associated with the first
 $(n=1)$ POD mode decomposition reported in Mula & Tinney (Reference Mula and Tinney2015). Due to the nature of the Fourier functions used in their study, the spatial structure of the imaginary component was identical to that of its real counterpart. Interestingly, the imaginary component was oriented at
 $\unicode[STIX]{x03C0}/(2m)$ relative to the real counterpart, similar to the orthogonal structure of the two leading modes shown in figures 21 and 22. Mula & Tinney (Reference Mula and Tinney2015) reported that the helical mode
 $(m,n)=(1,1)$ is typical of a base vortex flow undergoing an elliptical deformation.
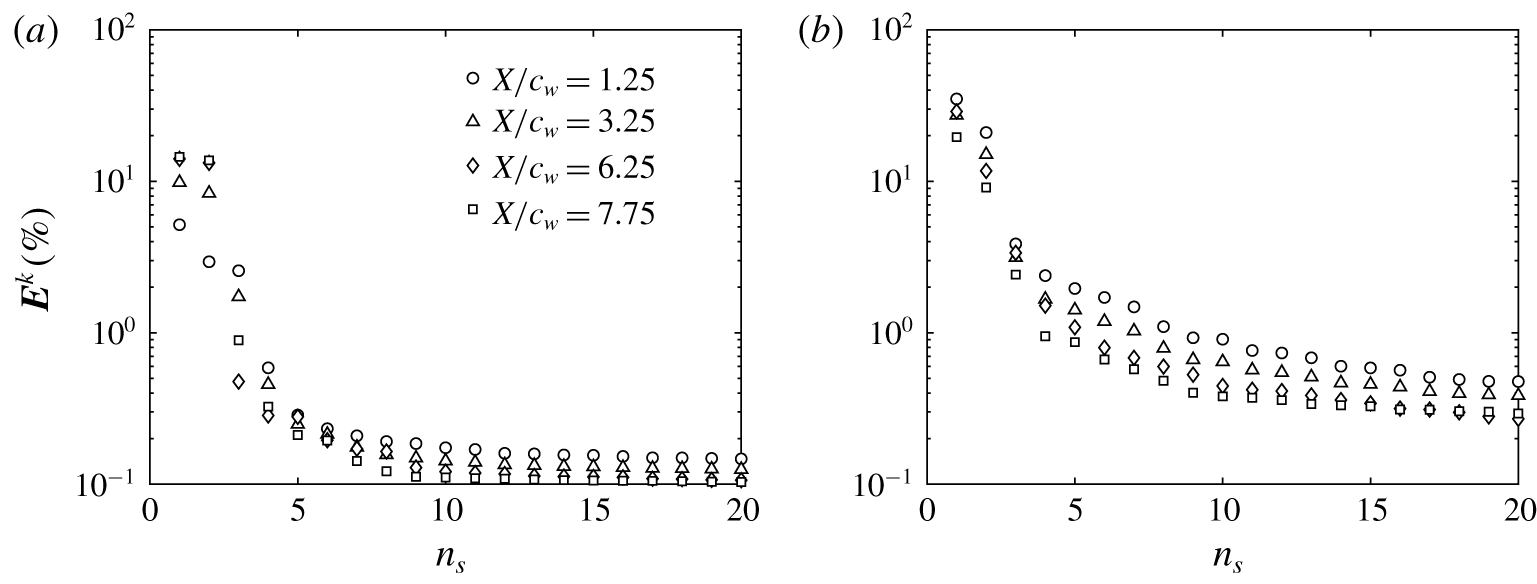
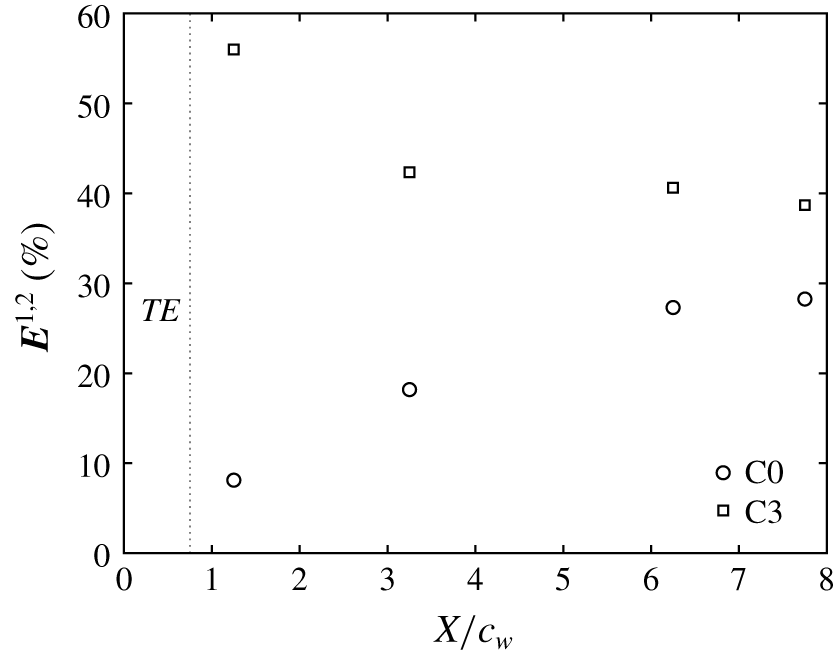
The energies contained in the two leading modes were very similar but much higher than in the remaining POD modes, as indicated in the POD energy spectra of the first 20 modes shown in figure 23(a) for case C0 and figure 23(b) for case C3. It is reasonable to associate the two dominant modes with a Kelvin wave of azimuthal wavenumber  $m=1$. The lower-energy modes consist of higher-order azimuthal modes. The linear combination of the two dominant modes resulted in a relatively large fraction of the total resolved energy being contained in the vortex core, as shown in figure 24. This portion of the energy is mainly used to displace the vortex which resulted in its meandering motion. In figure 24, the meandering energy increases with increasing downstream distance, in a manner similar to that observed in the streamwise evolution of the meandering amplitudes (figure 18). With control, the azimuthal symmetry of the helical structure was found to be disrupted as the two vortex doublets exhibited different shapes and largely asymmetric vorticity levels. At
 $X/c_{w}=1.25$, the positive vorticity contours (coloured in blue) were seen to be stretched at an oblique angle similar to that observed in the scatter of the instantaneous vortex positions. The size and vorticity levels associated with the vortex doublet were larger than those recorded in case C0, indicating an increased meandering amplitude of the controlled vortex. As the vortex evolved downstream, the helical mode seemed to rotate at an azimuthal angle homologous with the angular displacement of the preferred vortex meander, as displayed in figure 17(d). In figure 24, the streamwise development of the meandering energy (associated with the dominant modes) corroborates the results observed in figure 18, as in the case of a controlled vortex, a substantially higher energy is required to displace the vortex with larger meandering amplitudes.
Energy spectra of the first 20 POD modes for (a) C0 and (b) C3.

Energy content of the dominant helical modes (two first modes) as a function of streamwise distance.

5.5 Discussion of the mechanism of vortex diffusion: enstrophy balance
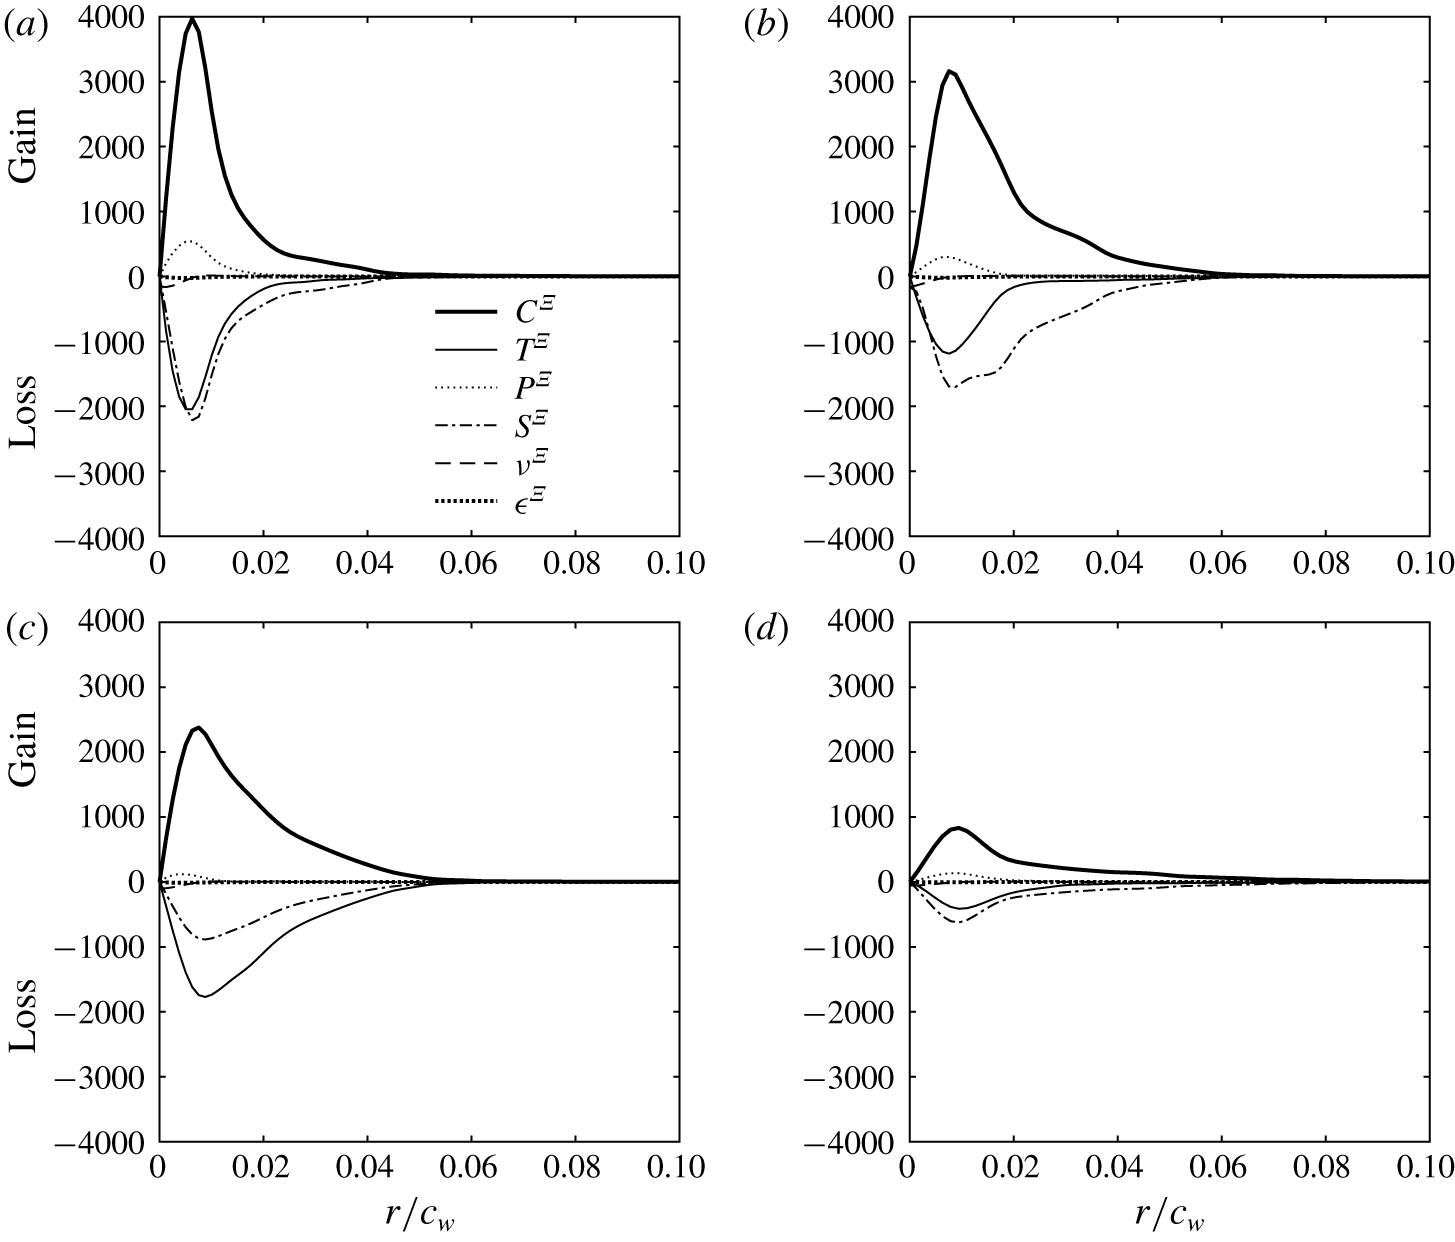
A quantitative description of the physical mechanisms associated with the outward diffusion of the vortex core observed in this study can be further examined using the transport equation of the enstrophy,  $\unicode[STIX]{x1D6EF}$, defined as the trace of the meandering-corrected time-averaged vorticity covariance,
 $\bar{\hat{\unicode[STIX]{x1D709}}}_{i}\bar{\hat{\unicode[STIX]{x1D709}}}_{i}$. Tennekes & Lumley (Reference Tennekes and Lumley1972) and Balint, Vukoslavcevic & Wallace (Reference Balint, Vukoslavcevic and Wallace1990) derived the transport equation of the mean enstrophy from the momentum equation as
 $$\begin{eqnarray}\displaystyle \frac{\unicode[STIX]{x2202}}{\unicode[STIX]{x2202}t}\left(\frac{1}{2}\unicode[STIX]{x1D6EF}\right) & = & \displaystyle \underbrace{-\bar{\hat{u} }_{j}\frac{\unicode[STIX]{x2202}}{\unicode[STIX]{x2202}x_{j}}\left(\frac{1}{2}\unicode[STIX]{x1D6EF}\right)}_{C^{\unicode[STIX]{x1D6EF}}}-\underbrace{\frac{\unicode[STIX]{x2202}}{\unicode[STIX]{x2202}x_{j}}(\bar{\hat{\unicode[STIX]{x1D709}}}_{i}\overline{\unicode[STIX]{x1D709}_{i}^{\prime }u_{j}^{\prime }})}_{T^{\unicode[STIX]{x1D6EF}}}+\underbrace{\overline{u_{j}^{\prime }\unicode[STIX]{x1D709}_{i}^{\prime }}\frac{\unicode[STIX]{x2202}\bar{\hat{\unicode[STIX]{x1D709}}}_{i}}{\unicode[STIX]{x2202}x_{j}}}_{P^{\unicode[STIX]{x1D6EF}}}\nonumber\\ \displaystyle & & \displaystyle +\,\underbrace{\bar{\hat{\unicode[STIX]{x1D709}}}_{i}\overline{\unicode[STIX]{x1D709}_{j}^{\prime }s_{ij}}}_{S^{\unicode[STIX]{x1D6EF}}}+\underbrace{\unicode[STIX]{x1D708}\frac{\unicode[STIX]{x2202}^{2}}{\unicode[STIX]{x2202}x_{j}\unicode[STIX]{x2202}x_{j}}\left(\frac{1}{2}\unicode[STIX]{x1D6EF}\right)}_{\unicode[STIX]{x1D708}^{\unicode[STIX]{x1D6EF}}}-\underbrace{\unicode[STIX]{x1D708}\frac{\unicode[STIX]{x2202}\bar{\hat{\unicode[STIX]{x1D709}}}_{i}}{\unicode[STIX]{x2202}x_{j}}\frac{\unicode[STIX]{x2202}\bar{\hat{\unicode[STIX]{x1D709}}}_{i}}{\unicode[STIX]{x2202}x_{j}}}_{\unicode[STIX]{x1D716}^{\unicode[STIX]{x1D6EF}}},\end{eqnarray}$$
where  $\bar{\hat{\unicode[STIX]{x1D709}}}_{i}$ and
 $\hat{\unicode[STIX]{x1D709}}_{i}^{\prime }$ are the components of the vorticity vector of the time-averaged and fluctuating fields, respectively, and are given by
 $$\begin{eqnarray}\displaystyle & \displaystyle \bar{\hat{\unicode[STIX]{x1D709}}}_{i}=\unicode[STIX]{x1D716}_{ijk}\frac{\unicode[STIX]{x2202}\bar{\hat{u} }_{k}}{\unicode[STIX]{x2202}x_{j}}, & \displaystyle\end{eqnarray}$$
 $$\begin{eqnarray}\displaystyle & \displaystyle \hat{\unicode[STIX]{x1D709}}_{i}^{\prime }=\unicode[STIX]{x1D716}_{ijk}\frac{\unicode[STIX]{x2202}u_{k}^{\prime }}{\unicode[STIX]{x2202}x_{j}}, & \displaystyle\end{eqnarray}$$
where  $\unicode[STIX]{x1D716}_{ijk}$ is the Levi-Civita symbol,
 $\bar{u}_{k}$ and
 $u_{k}^{\prime }$ are the components of the time-averaged and the fluctuating parts of the meandering-corrected velocity fields, respectively, and
 $s_{ij}$ is the fluctuating strain rate.
Although not shown here, the spanwise and transverse components of the vorticity vector were found to be negligible compared to the axial component. Thus, the mean enstrophy can be reasonably approximated as  $\unicode[STIX]{x1D6EF}\approx \bar{\hat{\unicode[STIX]{x1D709}}}_{x}\bar{\hat{\unicode[STIX]{x1D709}}}_{x}$. Consequently, the different terms of (5.7) reduce to
 $$\begin{eqnarray}\displaystyle & \displaystyle C^{\unicode[STIX]{x1D6EF}}=-\bar{\hat{u} }_{z}\frac{\unicode[STIX]{x2202}}{\unicode[STIX]{x2202}z}\left(\frac{1}{2}\unicode[STIX]{x1D6EF}\right)-\bar{\hat{u} }_{y}\frac{\unicode[STIX]{x2202}}{\unicode[STIX]{x2202}y}\left(\frac{1}{2}\unicode[STIX]{x1D6EF}\right); & \displaystyle\end{eqnarray}$$
 $$\begin{eqnarray}\displaystyle & \displaystyle T^{\unicode[STIX]{x1D6EF}}=-\frac{\unicode[STIX]{x2202}}{\unicode[STIX]{x2202}z}(\bar{\hat{\unicode[STIX]{x1D709}}}_{x}\overline{\unicode[STIX]{x1D709}_{x}^{\prime }u_{z}^{\prime }})-\frac{\unicode[STIX]{x2202}}{\unicode[STIX]{x2202}y}(\bar{\hat{\unicode[STIX]{x1D709}}}_{x}\overline{\unicode[STIX]{x1D709}_{x}^{\prime }u_{y}^{\prime }}); & \displaystyle\end{eqnarray}$$
 $$\begin{eqnarray}\displaystyle & \displaystyle P^{\unicode[STIX]{x1D6EF}}=\overline{u_{z}^{\prime }\unicode[STIX]{x1D709}_{x}^{\prime }}\frac{\unicode[STIX]{x2202}\bar{\hat{\unicode[STIX]{x1D709}}}_{x}}{\unicode[STIX]{x2202}z}+\overline{u_{y}^{\prime }\unicode[STIX]{x1D709}_{x}^{\prime }}\frac{\unicode[STIX]{x2202}\bar{\hat{\unicode[STIX]{x1D709}}}_{x}}{\unicode[STIX]{x2202}y}; & \displaystyle\end{eqnarray}$$
 $$\begin{eqnarray}\displaystyle & \displaystyle S^{\unicode[STIX]{x1D6EF}}=\bar{\hat{\unicode[STIX]{x1D709}}}_{x}\overline{\unicode[STIX]{x1D709}_{z}^{\prime }s_{xz}}+\bar{\hat{\unicode[STIX]{x1D709}}}_{x}\overline{\unicode[STIX]{x1D709}_{y}^{\prime }s_{xy}}; & \displaystyle\end{eqnarray}$$
 $$\begin{eqnarray}\displaystyle & \displaystyle \unicode[STIX]{x1D708}^{\unicode[STIX]{x1D6EF}}=\unicode[STIX]{x1D708}\left[\frac{\unicode[STIX]{x2202}^{2}}{\unicode[STIX]{x2202}z\unicode[STIX]{x2202}z}\left(\frac{1}{2}\unicode[STIX]{x1D6EF}\right)+\frac{\unicode[STIX]{x2202}^{2}}{\unicode[STIX]{x2202}y\unicode[STIX]{x2202}y}\left(\frac{1}{2}\unicode[STIX]{x1D6EF}\right)\right]; & \displaystyle\end{eqnarray}$$
and
 $$\begin{eqnarray}\unicode[STIX]{x1D716}^{\unicode[STIX]{x1D6EF}}=-\unicode[STIX]{x1D708}\left[\frac{\unicode[STIX]{x2202}\bar{\hat{\unicode[STIX]{x1D709}}}_{x}}{\unicode[STIX]{x2202}z}\frac{\unicode[STIX]{x2202}\bar{\hat{\unicode[STIX]{x1D709}}}_{x}}{\unicode[STIX]{x2202}z}+\frac{\unicode[STIX]{x2202}\bar{\hat{\unicode[STIX]{x1D709}}}_{x}}{\unicode[STIX]{x2202}y}\frac{\unicode[STIX]{x2202}\bar{\hat{\unicode[STIX]{x1D709}}}_{x}}{\unicode[STIX]{x2202}y}\right],\end{eqnarray}$$
where the term  $C^{\unicode[STIX]{x1D6EF}}$ represents the advection of enstrophy by the mean flow,
 $T^{\unicode[STIX]{x1D6EF}}$ is the transport of enstrophy by turbulent vorticity–velocity interactions,
 $P^{\unicode[STIX]{x1D6EF}}$ is the turbulence production term,
 $S^{\unicode[STIX]{x1D6EF}}$ corresponds to the production (or removal) of enstrophy caused by stretching (or squeezing) of fluctuating vorticity components by fluctuating strain rate and
 $\unicode[STIX]{x1D708}^{\unicode[STIX]{x1D6EF}}$ and
 $\unicode[STIX]{x1D716}^{\unicode[STIX]{x1D6EF}}$ represent viscous diffusion and dissipation of enstrophy, respectively.
Radial distributions of the dominant terms in the mean enstrophy transport equation are illustrated in figure 25(a,c) for case C0 and figure 25(b,d) for case C3 at the measurement planes  $X/c_{w}=1.25$ and
 $6.25$. Figure 25(a) shows that the dominant term in the transport equation: the convection term,
 $C^{\unicode[STIX]{x1D6EF}}$, was essentially balanced with both stretching,
 $S^{\unicode[STIX]{x1D6EF}}$, and turbulent transport,
 $T^{\unicode[STIX]{x1D6EF}}$, terms which mainly contributed to the destruction of the mean enstrophy within the vortex core of case C0. The transport of the mean enstrophy, which is generated over the wing tip and then convected downstream, was found to trigger other production terms within the core region. In fact, the fluctuating strain rate stretched the transported vorticity resulting in a further production of enstrophy (
 $P^{\unicode[STIX]{x1D6EF}}$). It can be inferred from figure 25(a) that
 $T^{\unicode[STIX]{x1D6EF}}$,
 $S^{\unicode[STIX]{x1D6EF}}$,
 $\unicode[STIX]{x1D708}^{\unicode[STIX]{x1D6EF}}$ and
 $\unicode[STIX]{x1D716}^{\unicode[STIX]{x1D6EF}}$ were balanced by the advection due to the mean flow,
 $C^{\unicode[STIX]{x1D6EF}}$, and the enstrophy production term,
 $P^{\unicode[STIX]{x1D6EF}}$. Note that, outside the core region, all the terms asymptotically approach zero where the flow is nearly irrotational. Further downstream and at
 $X/c_{w}=6.25$, the significant reduction in the peak value of the transported enstrophy in the vortex core was accompanied by a noticeable decrease in the peak values of both transport and stretching terms. The production term, however, was found to significantly decrease as the vortex evolved from
 $X/c_{w}=1.25$ to
 $X/c_{w}=6.25$ suggesting that the vorticity field reached a self-similar state. Therefore, the mechanism of enstrophy dissipation was mainly limited to vorticity stretching by fluctuating strain rate. With control and at
 $X/c_{w}=1.25$, the peak value of the advection term was found to decrease by nearly 25 % with respect to that of case C0 which is mainly attributed to the decrease in the peak levels of the mean vorticity under the effect of SJ actuation. The turbulent transport term,
 $T^{\unicode[STIX]{x1D6EF}}$, decreased with respect to case C0. This significant decrease in the turbulent transport may be attributed to the increase in the velocity and vorticity fluctuations caused by turbulence injection from the SJ. Furthermore, the vorticity stretching and the increased fluctuating strain rate caused the turbulent production term,
 $P^{\unicode[STIX]{x1D6EF}}$, to decrease by roughly 50 % compared to case C0. It is noteworthy that the radial positions of the peak values of these terms were seen to move further away from the vortex centre indicating an increased outward transport of enstrophy under the effect of the SJ actuation. When the vortex was convected to
 $X/c_{w}=6.25$, all the terms decreased significantly, as illustrated in figure 25(d). In this figure, the contribution of the vorticity stretching appeared to be the dominant term in the dissipation of the mean enstrophy. In contrast, the turbulent production term appeared to be of the same level of magnitude of the dissipation terms indicating that the vortex has reached an equilibrium state.
Radial distribution of the mean enstrophy budget at  $X/c_{w}=1.25$ (a,b) and 6.25 (c,d) for (a,c) C0 and (b,d) C3. All terms are normalized by
 $(\bar{u}_{\infty }/c_{w})^{3}$.

6 Conclusions
In this study, SPIV experiments have been conducted to document the development of a wing-tip vortex under the effect of SJ actuation for a rectangular, square-tipped wing having a NACA 0012 airfoil at a chord Reynolds number  $Re_{c_{w}}=2\times 10^{5}$. A total of five control configurations were considered for a comparative study: case C1 with momentum coefficient
 $C_{\unicode[STIX]{x1D707}}=0.001$ and an actuation frequency
 $F^{+}=0.075$, case C2 with
 $C_{\unicode[STIX]{x1D707}}=0.001$ and
 $F^{+}=0.15$, case C3 with
 $C_{\unicode[STIX]{x1D707}}=0.001$ and
 $F^{+}=0.3$, case C4 with
 $C_{\unicode[STIX]{x1D707}}=0.001$ and
 $F^{+}=0.6$ and case C5 with
 $C_{\unicode[STIX]{x1D707}}=0.001$ and
 $F^{+}=1.2$. Amongst all the cases studied, case C3 was shown to have the most pronounced effect on the structure of the wing-tip vortex in the near-wake region at
 $X/c_{w}=1.25$. In fact, under case C3, the vortex was stretched and appeared to be diffuse with a nearly 40 % decrease in the peak circumferential velocity and 50 % decrease in the core axial vorticity. The vortex core radius largely broadened suggesting that the lower-frequency control configuration allowed the SJ to travel larger distances into the vortex bringing turbulent structures within its core resulting in increased mixing and subsequently a more diffuse vortex. Consequently, a comprehensive SPIV survey has been conducted at the downstream positions
 $X/c_{w}=1.25,3.25,6.25$ and 7.75 covering both near- and mid-wake vortex regions. Further insights into the contribution of SJ actuation to the vortex meandering have been provided using SPOD. The meandering coherent motion was extracted via a triple decomposition of the meandering-corrected raw velocity field at different streamwise positions. An in-depth characterization of the physical mechanisms associated with the vortex diffusion was provided by quantifying the different terms of the transport equation of the streamwise enstrophy. The dominant terms responsible for the destruction of enstrophy in the budget equation were shown to be attributed to increased vorticity stretching and fluctuating strain rate as a result of the fluidic actuation.
Acknowledgements
This work was supported by the Natural Sciences and Engineering Research Council (NSERC) of Canada and the Directorate of Technical Airworthiness and Engineering Support (DTAES) office of the Royal Canadian Air Force.
Declaration of interests
The authors report no conflict of interest.