I. INTRODUCTION
Among the two-dimensional (2D) materials, transition metal dichalcogenides (TMDs) have attracted great attention due to their unique physical properties that render them numerous potential applications in the fields of catalysis, energy storage, and optoelectronics.Reference Kibsgaard, Chen, Reinecke and Jaramillo1–Reference Park, Seob So, Kim, Choi, Lee, Lee, Lee and Kim10 These are a class of materials with the formula MX2, where M is a transition metal element (Mo, W, etc.) and X is a chalcogen (S, Se, or Te). These materials form layered structures of the form X–M–X, with the chalcogen atoms in two hexagonal planes separated by a plane of metal atoms through van der Waals interactions. For instance, MoS2 is a semiconductor with an indirect band gap of ∼1.3 eV in the bulk, turning to a direct gap of 1.85 eV in monolayer form. Furthermore, few-layered nanocrystalline (NC) MoS2 is being widely studiedReference Kibsgaard, Chen, Reinecke and Jaramillo1–Reference Liu, Robertson, Li, Kuo, Darby, Muhieddine, Lin, Suenaga, Stamatakis, Warner and Tsang6 for its promising and attractive electrocatalytic properties in the hydrogen evolution reaction due to increasing number of active sites and enhanced intrinsic conductivity, compared to MoS2 bulk counterparts.
However, the performance of the devices, which incorporate these materials, is strongly determined by the presence of intrinsic and extrinsic defects. For instance, Addou and colleagues have extensively studied the extrinsic defects in natural MoS2 bulk crystals.Reference Addou, McDonnell, Barrera, Guo, Azcatl, Wang, Zhu, Hinkle, Q-Lopez, Alshareef, Colombo, Hsu and Wallace11 Most interestingly, intrinsic defects such as sulfur vacancies, molybdenum antisites, and grain boundaries can actually enhance catalytic propertiesReference Tsai, Pedersen and Nørskov12–Reference Yin, Han, Zhang, Zhang, Xu, Yuan, Samad, Wang, Wang, Zhang, Zhang, Cao, Song and Jin14 and introduce magnetic functionality.Reference Gao, Si, Li, Zhang, Zhang, Yang and Xue15–Reference Cai, He, Liu, Yao, Chen, Yan, Hu, Jiang, Zhao, Hu, Sun and Wei17 Although, it has been largely ignored in most of the literature studies, it is critical to identify the grown-in native defects. They can significantly alter physicochemical properties such as many hydrogenation and hydrodesulphurization catalytic processes and even their magnetic properties. Of particular importance, due to the unexpected physical characteristics (such as spin-valley coupling), 2D materials have provided novel platforms in probing the spin interactions with other degrees of freedom of electrons. Thus, incorporating ferromagnetism, either by introducing defects, dopants, or proximity effect in 2D semiconducting materials such as MoS2 NCs can open doors to applications in the rapidly emerging spintronics field, data storage, and for low power nonvolatile memory applications at room temperature. Hence, it is extremely important to better understand and control the defects at the atomic level that are present in 2D TMD NCs to realize their potential applications.
Several theoretical and experimental effortsReference Lu and Leburton18–Reference Hong, Jin, Yuan and Zhang21 were made to investigate defects in these TMD NCs. Previous researchers have used several techniques such as transmission electron microscopy (TEM), Raman spectroscopy, and scanning tunneling microscopy to characterize the structural defects present in these materials. Unfortunately, these techniques have no capability in atomically identifying the defects, particularly those that are associated with unpaired electron spins. In addition, these techniques have limited sampling volume, and they tend to introduce artifacts. Among all, the main drawbacks of the TEM imaging technique are an increased possibility of damaging the delicate 2D material and much complex sample preparation processes. On the other hand, electron spin resonance (ESR) spectroscopy probes the entire sample volume, and it is nondestructive. It is an exclusive technique of choice in atomically identifying the paramagnetic spin species in advanced semiconducting materials, compared to other bulk techniques.Reference Rao, Stesmans, Novyen, Jacobs and Sels22–Reference Arcon, Zorko, Cevc, Mrzel, Remškar, Dominko, Gaberšček and Mihailovic30 Previously, one of us (Singamaneni) has demonstratedReference Rao, Stesmans, van Tol, Kosynkin and Tour24–Reference Stesmans, Iacovo, Chiappe, Radu, Huyghebaert, De Gendt and Afanas’ev29 the power of ESR spectroscopy in atomically identifying the paramagnetic point defects and impurities present in graphene-derived materials and carbon nanotubes, not accessible by other techniques.
As early as 30–40 years ago, ESR spectroscopy was extensively usedReference Khulber, Mann and Ternan31–Reference Louis and Che35 to understand the relationship between paramagnetic active defect sites and their catalytic performance in a wide range of bulk MoS2-supported materials. There are few initial reports publishedReference Panich, Shames, Rosentsveig and Tenne28–Reference Arcon, Zorko, Cevc, Mrzel, Remškar, Dominko, Gaberšček and Mihailovic30 on the ESR studies of polycrystalline MoS2 thin films, nanotubes, and fullerene-like structures prepared through gas phase synthesis. These studies have uncovered grain boundary paramagnetic point defects such as sulfur antisite defects and paramagnetic dangling bonds. While these studies are encouraging, to date, there has been no in-detailed work reported that investigates the paramagnetic point defects using the ESR technique, particularly on hydrothermally grown MoS2 NCs, which will broaden the current knowledge and understanding in elucidating the nature of defects in 2D materials, in general. Hydrothermal method is the commonly used synthesis method in laboratories to prepare catalytic materials at large scale. During the catalytic reactions, the intermediate reaction products are formed, which contain unpaired electron spins. ESR is the ideal experimental probe to identify such paramagnetic centers and their environment, which are catalytically and magnetically active.
This paper reports four distinct paramagnetic point defects that occur in hydrothermally grown MoS2 NCs. The crystallinity, morphology, phase formation, and valence states of the elements were investigated using X-ray diffraction (XRD), TEM, Raman spectroscopy, and X-ray photoelectron spectroscopy (XPS), respectively. At cryogenic temperatures, X-band (∼9.43 GHz) ESR spectroscopy was used to identify the paramagnetic spin species in the as-prepared MoS2 and Ar-annealed NCs. Measured at 7 K, on the as-prepared MoS2 NCs, at least seven ESR signals were detected which are associated with g 1 = 2.1144, g 2 = 2.0300, g 3 = 1.9863, g 4 = 1.9417, g 5 = 1.8984, and g 6 = 1.8541, and g 7 = 1.8146. These centers were assigned to adsorbed oxygen species, sulfur vacancies, thio-, and oxo-Mo5+-related defects, respectively.
II. EXPERIMENTAL METHODS
MoS2 NCs were prepared using a most common facile, bottom-up “hydrothermal method”.Reference Yin, Han, Zhang, Zhang, Xu, Yuan, Samad, Wang, Wang, Zhang, Zhang, Cao, Song and Jin14,Reference Gao, Si, Li, Zhang, Zhang, Yang and Xue15,Reference Gu, Yan, Zhang, Ding and Xian36,Reference Liang, Zhang, Liu, Tang, Zhang and Ji37 Hydrothermal method is a flexible, scalable, and widely used approach in preparing the freestanding nanoscale (nanosheets and nanowires) 2D chalcogenide materials and their doped (Co, Cu, and Mn) counterparts. For instance, ZhangReference Zhang, Li, Qi and Gao16 and co-authors have prepared MoS2 nanosheets using the hydrothermal method.
Unlike other “top-down” approaches (chemical exfoliation, sonication of bulk MoS2, electro-Fenton processing, etc.), this route does not employ harsh synthesis conditions, and expensive and hazardous chemicals. In addition, the yield is higher and is a fast route. Previously, this method was successfully usedReference Rao, Anuradha, Sarangi and Bhat38,Reference Anuradha, Rao and Bhat39 in preparing NC magnetic oxide nanowires by one of us (Singamaneni). All the precursors were used as purchased from Alfa-Aeser without further purification. To describe the procedure briefly, in a typical synthesis method, 0.4 g of Na2MoO4–2H2O was dissolved in 30 mL distilled water under sonication for 20 min (At this step, the desired metal precursor is added). Then 0.38 g of dibenzyl disulfide was added to the solution along with 30 mL of ethanol and sonicated for 30 min. The solution was then transferred into a 100 mL Teflon-lined stainless steel autoclave and was maintained at 250 °C for 18 h. Then the reaction system was allowed to cool down to room temperature naturally. The obtained products were collected by centrifugation and washed with deionized water. Then the stoichiometric MoS2 NCs were filtered and left to dry over night at room temperature in vacuum. Using this approach, a series of samples including 10% Co, Ni, and Mn-doped MoS2 NCs have been prepared. However, in this work, the discussion is restricted only to undoped MoS2 NCs.
An automated Bruker D8 Advance X-ray diffractometer (Bruker, Billerica, Massachusetts) was used in the θ–2θ configuration with the Cu Kα X-ray radiation. The mean crystallite size was estimated using the Scherrer equation. TEM specimens were prepared by dispersing the powders on holey carbon grids. TEM studies were carried out using a JEOL JEM 2100 HR (JEOL Ltd., Tokyo, Japan) operated at 200 kV. XPS were collected on a Physical Electronics Versa probe using microfocused monochromatic Al Kα X-ray (1486.7 eV) source with a pass energy of 23.5 eV at a 45° take-off angle. The X-ray source spot size was about 100 µm and the spectral resolution was 0.2 eV. Spectra from the MoS2 samples were charge corrected by shifting the recorded scans to adventitious carbon (C1s) peak at 284.4 eV. The nature of occurring paramagnetic structural point defects was assessed by low temperature (7–40 K) ESR spectroscopy. ESR data were recorded on a Bruker EMX Plus X-band (∼9.43 GHz) ESR spectrometer (Bruker, Billerica, Massachusetts), equipped with a high sensitivity probe head. A ColdEdge™ ER 4112HV In-Cavity Cryo-Free VT system (ColdEdge Technologies, Allentown, Pennsylvania) connected with an Oxford temperature controller (Oxford Instruments, Abingdon, United Kingdom) was used for low temperature measurements at 7 K. The complete system was operated by Bruker Xenon software (Billerica, Massachusetts). In addition, all ESR experimental settings were kept constant for reproducibility and consistency. ESR settings: microwave frequency ∼9.365 GHz, microwave power = 3.17 mW, modulation amplitude = 2 G (peak-to-peak), modulation frequency = 100 kHz, number of scans = 5, and time constant = 5 ms. Apart from Ar annealing (ultrahigh purity, 4 h, 300 °C) of MoS2 nanocrystals, it should be noted that the samples studied here were not deliberately exposed to oxygen ambient but were handled under normal ambience. For all ESR measurements, the samples were sealed in a quartz tube under air.
III. RESULTS AND DISCUSSION
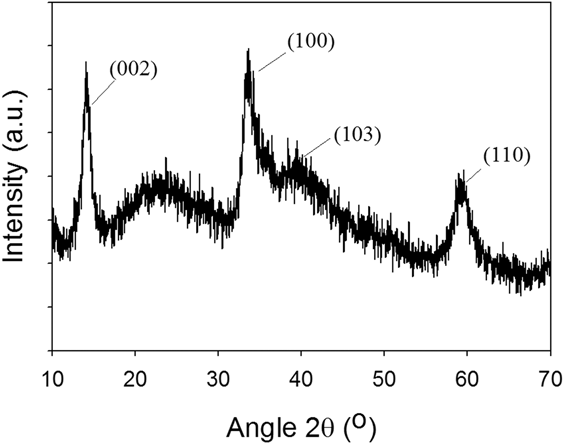
To verify the crystal structure of MoS2 NCs, XRD was used. Figure 1(a) shows the powder XRD pattern of MoS2 NCs, which can be indexed to hexagonal MoS2 (PDF 73-1508). Four main peaks are observed at 14, 33, 40, and 59° corresponding to the (002), (100), (103), and (110) planes for MoS2 NCs, respectively.Reference Gao, Si, Li, Zhang, Zhang, Yang and Xue15,Reference Zhang, Li, Qi and Gao16 The broad peak appeared at 25° is found to arise from the glass holder used for placing MoS2 NCs for XRD measurements. Ojha et al. reportedReference Ojha, Saha, Banerjee and Ganguli40 a similar XRD pattern for MoS2 NCs synthesized by the hydrothermal process. The peak broadening clearly shows the NC nature of MoS2. The Scherrer formula, D hkl = kλ/βhkl cos θ, was used to estimate the crystallite size of MoS2. Here, k is a coefficient (k = 0.9), βhkl is the full-width-at-half maximum of the (002) peak, and λ is the wave length (λ = 1.5405 Å). The calculated crystallite size from XRD line broadening is of 10 nm.
XRD pattern of MoS2 nanocrystallites.

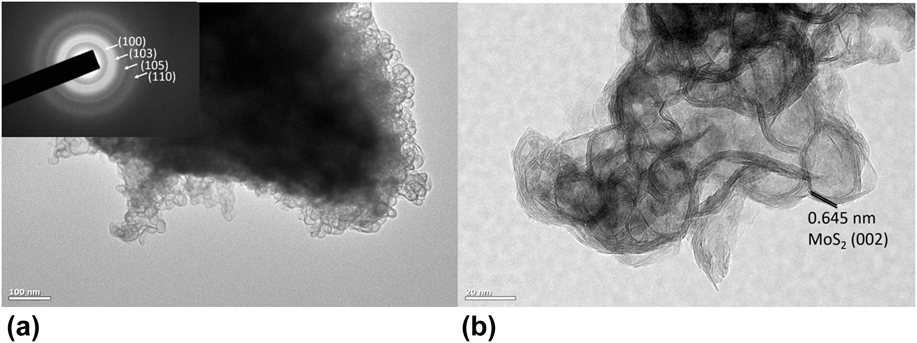
Morphological studies were conducted using TEM. Figures 2(a) and 2(b) show the low magnification bright field and the high resolution lattice images, respectively. The indexed selected area diffraction pattern (SAED) is shown as the inset to the bright field image. As can be seen in Fig. 2(b), the MoS2 NCs (size of 25–30 nm) show the hexagonal structures made up of a few layers of MoS2 basal planes. The apparent difference in the sizes estimated from XRD and TEM might be because XRD measures crystallite size whereas the TEM shows the grain size. The SAED pattern shown as the inset to Fig. 2(a) contains rings with uniform intensity—confirmed the NC nature of the material. The interlayer spacing measured from the lattice images is 6.45 Å, consistent with the previous reportsReference Kibsgaard, Chen, Reinecke and Jaramillo1–Reference Liu, Robertson, Li, Kuo, Darby, Muhieddine, Lin, Suenaga, Stamatakis, Warner and Tsang6 (6.3 Å) of monolayer MoS2 grown by the CVD methods, and it corresponds to the (002) planes of MoS2.
(a) Bright field TEM image of MoS2 nanocrystallites. The inset shows the SAED patterns confirming the NC nature of the material. (b) High resolution transmission electron microscopy image of MoS2 nanocrystallites. The spacing between the layers along the (002) plane is about 0.645 nm.

XPS survey spectra of MoS2 NCs indicate the presence of peaks with binding energies (BEs) consistent with molybdenum and sulfur elements besides a lower intensity oxygen and carbon. Absence of other elements demonstrates the purity of the sample. To further probe the chemical composition and surface chemistry, high-resolution core-level XPS spectra were collected on the selected BE intervals. The BE positions were referenced and adjusted to adventitious carbon because of the charging effects on the sample. Shirley method background signal was subtracted and BE peaks were curve-fitted (deconvolution) using Gaussian/Lorentzian functions. Multiple BEs associated with C1s spectra are observed at 284.4, 286.3, and 287.9 eV which are assigned to adventitious carbon and C–O impurities from the hydrothermal process. The O1s spectral region peak appearing at 532.6 eV is assigned to C–O bonding while the lower BE peak at 530.8 eV is ascribed to Mo–O bonding. The deconvoluted Mo3d region had multiple peaks observed at 228.9 (Mo3d 5/2), 229.9 (Mo3d 5/2), and 232.48 (Mo3d 5/2) and their corresponding spin–orbit splitting doublet peaks were noticed at 232.08 (Mo3d 3/2), 233.1 (Mo3d 3/2), and 235.6 (Mo3d 3/2) respectively. In addition, the peak observed at 226.3 eV was assigned to S2s. Spin–orbit split peak separation is found to be around 3.16 eV, which is consistent with the existing literature.Reference Spevack and Mclntyre41–Reference Spevack and Mclntyre43 The peaks corresponding to the S 2p 3/2 and S 2p 1/2 orbital of divalent sulfide ions (S2−) are observed at 161.8 and 162.98 eV associated with another set of deconvoluted peaks appearing at 163.6 and 164.8 eV with an estimated spin–orbit splitting of 1.18 eV. Multiple BE peaks observed in this sample are apparently indicating different phases. The high intensity peak at 228.9 eV (Mo3d 5/2) resulting from the Mo4+ oxidation state is ascribed to the MoS2 phaseReference Spevack and Mclntyre41 with the corresponding S2p 3/2 161.8 eV. In addition, the BE peak at 229.9 (Mo3d 5/2) is associated with higher oxidation state molybdenum, along with a secondary peak that corresponds to S2p 3/2 (161.8 eV) ascribed to the MoS3 phase.Reference Zhang, Zhou, Zheng, Hong, Pan and Xu42 Furthermore, the BE peak at 232.48 eV (Mo3d 5/2) relating to the higher oxidation state of Mo6+ in conjunction with O1s (530.8 eV) is attributed to a mostly stable MoO3 phase.Reference Spevack and Mclntyre43 XPS technique could be used to quantify the ratio of different phases within a given sample. Based on the deconvoluted Mo3d peaks, it is estimated that there is about 65% MoS2 phase and the remaining is a combination of MoS3 and MoO3.
Raman spectrum was used to confirm the few-layered MoS2 NCs. Raman spectra measured on MoS2 NCs showed two distinct characteristicReference Chiappe, Asselberghs, Sutar, Iacovo, Afanas’ev, Stesmans, Balaji, Peters, Heyne, Mannarino, Vandervorst, Sayan, Huyghebaert, Caymax, Heyns, De Gendt, Radu and Thean44 peaks at 384 and 408 cm−1, which are associated with the in-plane vibrational (E12g) and the out-of-plane vibrational (A1g) modes of Mo–S bonds in 2H–MoS2, respectively. The Raman peaks are in agreement with that of MoS2 bulk crystals.
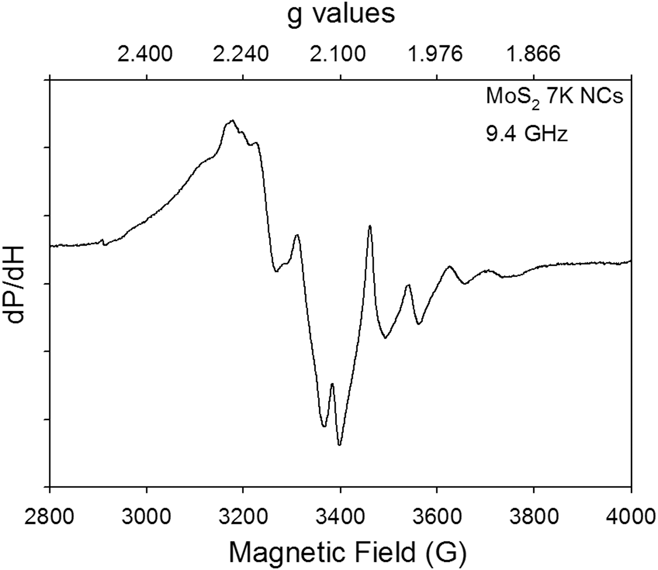
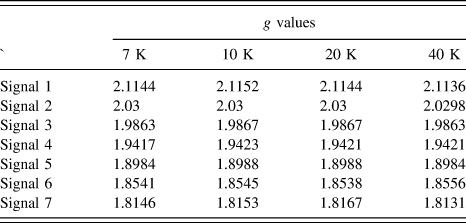
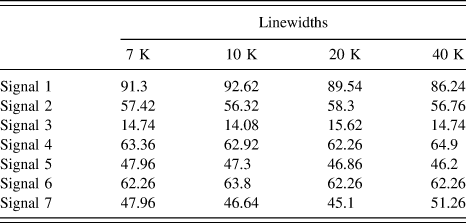
Figure 3 presents an overview of the representative first derivative X-band ESR spectrum measured at 7 K. The spectrum exhibits a wealth of information pertaining to intrinsic paramagnetic spin centers. To authors’ knowledge, this is the first single richest spectrum reported to date on any MoS2 NCs and amorphous/less-crystalline compounds. ESR spectral parameters provide characteristic signatures of paramagnetic defects by analyzing the signal position, width, and shape. From this spectrum, at least seven well-resolved ESR lines are identified, marked from 1 to 7. Only those peaks that are clearly observable are indicated. Since the signals show considerable overlap, it is difficult to determine the ESR parameters of each signal accurately. Nevertheless, within experimental accuracy, the g-values of all the well-resolved peaks and their peak-to-peak line widths that could be detected separately are tabulated in Tables I and II, respectively. The g-values were determined using the resonance condition hν = gβH, where h = Planck’s constant, ν = microwave frequency, g = g-value, β = Bohr magneton, and H = resonance field (measured at the turning points). Collected at 7 K, on the as-prepared MoS2 NCs, at least seven ESR signals are detected, associated with g 1 = 2.1144, g 2 = 2.0300, g 3 = 1.9863, g 4 = 1.9417, g 5 = 1.8984, g 6 = 1.8541, and g 7 = 1.8146. No half-field lines were detected that might correspond to electron spin >1/2. This infers that, most likely, the signals that are observed in the present work arise from spin 1/2 paramagnetic spin centers. Although it has been intensely searched for, no hyperfine interaction originating from 33S (nuclear spin I = 3/2; 0.75% abundance) and 95Mo and 97Mo (both I = 5/2; 25.5% added abundance) could be traced. No external impuritiesReference Spackman45–Reference Stesmans, Iacovo and Afanas’ev47 from MoS2 NCs are observed. In addition, as verified from the controlled measurements, no similarity between the ESR spectra measured on MoS2 NCs and ESR spectra recorded from sulfur and Mo precursors could be found, which clarifies that the unreacted compound could not account for the observed ESR spectra. It has been observed that the ESR spectra do not resemble to the spectra collected from the Teflon tape, quartz tube, and empty cavity. In the absence of relevant ESR literature studies, some of the low intense overlapping ESR peaks appeared on the low magnetic field side could not be identified with certainity. Further high frequency ESR spectroscopic measurements in collaboration with National High Magnetic Field Laboratory (NHMFL) Electron Magnetic Resonance (EMR) facility at Florida will be performed in resolving the overlapping ESR signals.
First-derivative representative X-band (9.40 GHz) ESR spectra measured on MoS2 nanocrystals at 7 K. One can see that there are at least seven well-resolved ESR lines as marked from 1 to 7. The spectrum is plotted on both the magnetic field and g-value axes.

Temperature dependences of g-values.

Temperature dependences linewidths.

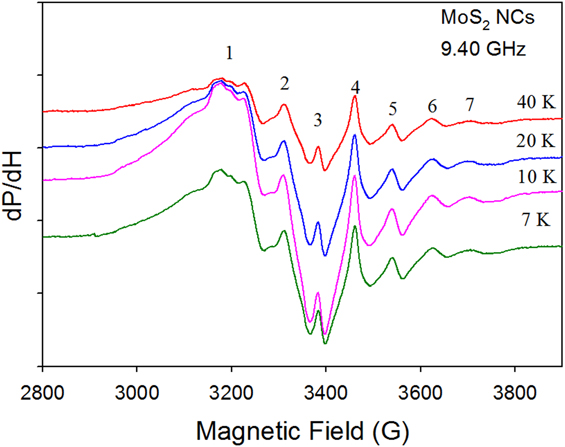
The attention will be paid on the well-resolved ESR signals. To better understand the behavior of observed paramagnetic centers, temperature-dependent ESR measurements (7–40 K) were performed on the as-prepared MoS2 NCs. The data are presented in Fig. 4. As presented in Tables I and II, the g-values and the linewidths of all the ESR signals did not vary significantly as a function of temperature (7–40 K). This observation is consistent with the previous reportsReference Konings, van Doormen, Koningsberger, De Beer, Farragher and Schuit48,Reference Khulbe, Mann and Ternan49 in support of Mo5+ species (discussed later), whose ESR spectra were shown to be temperature-independent. This leads us to believe that these are isolated intrinsic paramagnetic defects and do not interact with each other.
Temperature dependence (7–40 K) of ESR spectra measured on MoS2 nanocrystals.

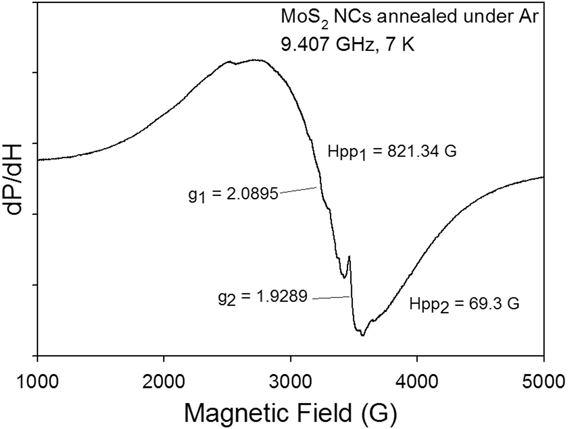
Annealing MoS2 NCs under Ar ambience can improve the crystallinity and phase formation, but, at the expense of grain growth. The number of ESR signals decreased due to the decrease in the surface area of MoS2 NCs as a result of Ar annealing (4 h, 300 °C). Now, the modification of ESR spectra upon post Ar annealing will be considered. Because of Ar annealing, very distinct paramagnetic centers are found. Interestingly, the rich ESR spectrum observed from MoS2 NCs disappeared. Instead, as presented in Fig. 5, a broad signal (g-value = 2.0895; peak-to-peak line width = 821 G) and a narrow signal (g-value = 1.9289; peak-to-peak line width = 69 G) are noticed. Upon closer inspection, there are few more weak unresolved narrow signals overriding the broader signal were also detected. This implies that the paramagnetic defect sites observed from pristine MoS2 NCs still exist, however, with much reduced defect density.
ESR spectra collected on Ar-annealed (4 h, 300 °C) MoS2 nanocrystals measured at 7 K.

Now, the possible origin of these paramagnetic defect centers involved in the observed ESR spectra will be discussed. The signals in the low field region (<3000 G) are very weak in intensity, also not well resolved compared to the rest of the spectra. Hence, that part of the spectra is excluded from the present discussion. Therefore, the efforts will be focused in analyzing the ESR signals numbered from 1 to 7 in the spectra. Although Mo6+ is detected in XPS spectra, it is diamagnetic; not expectedReference Khulbe, Mann and Ternan49 to give ESR signal, and hence this possibility can be ruled out. Even it is paramagnetic and abundant as can be seen from XPS, Mo4+ would give a quite broad signal due to large zero field splitting. This possibility can also be ruled out as all the signals that are observed have relatively narrower line widths ranging from 40 to 95 G. Mo3+ is relatively unstable and cannot be captured using X-band ESR. Hence, Mo5+ is the only ion, which is paramagnetic, ESR-detectable, and highly stable. In this work, no attempt was made to derive the absolute spin concentrations of all these paramagnetic defect sites, as it is not straightforward to estimate, particularly, given the strong overlapping of the signals. This might require simulation of entire powder spectra that needs usage of much computational work and modeling,Reference Bensimon, Belougne, Giuntini and Zanchetta33,Reference Deroide, Bensimon, Belougne and Zanchetta34 which is beyond the scope of the present work.
Previous ESR studies reportedReference Bensimon, Belougne, Giuntini and Zanchetta33,Reference Deroide, Bensimon, Belougne and Zanchetta34 on MoS2 compounds will help in identifying the ESR signals observed in the present work. These authors collected ESR spectra when (amorphous/less crystalline) MoS2 was exposed to water, oxygen, and by varying the S to Mo ratio. Part of the spectra observed in the present work resembles to the previous work reported by Zanchetta's group.Reference Bensimon, Belougne, Giuntini and Zanchetta33,Reference Deroide, Bensimon, Belougne and Zanchetta34 Their work identified three classes of paramagnetic spin centers with variable intensity, whose ESR signals are of Lorentzian in character. In addition, the previous ESR studiesReference Khulber, Mann and Ternan31,Reference Bensimon, Belougne, Giuntini and Zanchetta33,Reference Louis and Che35 documented on the bulk MoS2 supported (Al2O3 and SiO2) catalysts will also assist here in correctly interpreting the spectra. From the analysis presented here together with the help of literature reports,Reference Khulber, Mann and Ternan31–Reference Louis and Che35,Reference Sobczynski and Zmierczak50 the signal appeared at g = 2.1144 was assigned to oxygen adsorbed species (as measurements were performed in open air), though it was not observed in most of the previous studies.Reference Khulber, Mann and Ternan31–Reference Louis and Che35 The signal appeared at the g-value of 2.0300 was assigned to sulfur chains in MoS2 NCs. This is consistent with the previous observations reportedReference Bensimon, Belougne, Giuntini and Zanchetta33 on irradiated amorphous sulfur, where the electron hole is localized on the sulfur atom. It can be noted this signal is much narrower than that (120–150 G) of the similar sulfur-related signals reported in the literature.Reference Silbernagel, Pecoraro and Chianelli32–Reference Louis and Che35 Perhaps, this might be due to the strong exchange narrowing effect. The ESR signals appeared at g = 1.9863, g = 1.9417 could come from Mo5+ (4d 1 configuration) paramagnetic centers surrounded by sulfur-rich environment (MoS3). The ESR observations appeared at g = 1.8984, 1.8541, and 1.8146 could be ascribed to Mo5+ paramagnetic centers surrounded by oxygen-rich environment (MoO3).
Now, ESR spectra of Ar-annealed MoS2 NCs will be analyzed. The ESR signals are shown in Fig. 5. To trace the origin of the broad signal, the work doneReference Arcon, Zorko, Cevc, Mrzel, Remškar, Dominko, Gaberšček and Mihailovic30 by Arcon and co-authors will help us. The authors conducted X-band ESR study on Li-doped MoS2 nanotubes. They observed two quite different components. A broad (800–2600 G) signal associated with the g-value of 2.15–2.52 and a narrow (∼4 G) signal appeared at the g-value of 2.0029 were detected. The g-value of the broad signal is farther from the free electron g-value (2.0023) which suggests the effect of strong spin–orbit coupling from Mo. The authors attributed the broad signal to (d-band in Mo) conduction electrons coupled to defects through exchange interaction. As the g-value and line width of the broad signal observed in the present work are in close agreement with their observations, the broad signal observed in the present work could be assigned to the conduction electron spins. It is natural to expect a similar situation that might have occurred in the current MoS2 NCs during the Ar annealing process. This results in significant surface reorganization toward bulk-like structure, and, hence, MoS2 becomes more conducting at the expense of reduction in defect density. On the other hand, the narrower and much weaker signal could be assigned to oxo-Mo5+ centers, which might be present in the form of small spin clusters. It is evident that this particular oxo-Mo5+ site still survived even after the Ar annealing treatment. This finding implies that the observed spin centers are of surface-related, and probably they are located on the edges of the layers. The spectra remain unaffected even at further higher measurement temperatures (25 and 40 K).
Some of the paramagnetic centers such as sulfur vacancies and Mo-related defects are known to be catalytically active. One can harness them to improve the materials’ catalytic performance. As discussed previously, the XRD pattern did not show any evidence of MoS3/MoO3 residual phases. However, from the current experimental findings derived from ESR spectroscopy, it is believed that MoS2 NCs do contain unavoidable MoS3 and MoO3 fractions. This observation is consistent with the XPS data as well, where the presence of MoS3 and MoO3 fractions was evident. These defects can be exploited for their magnetic and catalytic properties. In fact, the initial magnetic measurements performed on MoS2 NCs have revealed the presence of ferromagnetism at room temperature. Future work will look into the simulation of the observed X-band ESR spectra and perform very high frequency ESR measurements MoS2 NCs to gain further insights.
IV. CONCLUSIONS
The paramagnetic spin sites occurred in the hydrothermally grown 2H–MoS2 nanocrystals were studied. The crystallinity, morphology, phase formation, and valence state were investigated using XRD, TEM, Raman spectroscopy, and XPS, respectively. X-band (∼9.43 GHz) ESR spectroscopy was used to identify the paramagnetic point defects in the as-prepared and Ar-annealed MoS2 nanocrystals, as a function of measurement temperature (7–40 K). From MoS2 nanocrystals, at least seven ESR signals associated with g 1 = 2.1144, g 2 = 2.0300, g 3 = 1.9863, g 4 = 1.9417, g 5 = 1.8984, g 6 = 1.8541, and g 7 = 1.8146 were observed. The corresponding peak-to-peak line widths are 91, 57, 15, 63, 48, 62, and 48 G, respectively. These centers were assigned to adsorbed oxygen species (g = 2.1144), sulfur vacancies (g = 2.0300), thio- (g = 1.9863, 1.9417), and oxo-Mo5+ (g 6 = 1.8541, and g 7 = 1.8146) related defects. This work demonstrates the importance of employing ESR spectroscopy in elucidating the paramagnetic (defect) spin states that might have direct correlation in improving the catalytic performance and induce magnetism in advanced semiconducting materials and devices.
Supplementary Material
To view supplementary material for this article, please visit https://doi.org/10.1557/jmr.2018.149.
ACKNOWLEDGMENTS
L.M.M and S.R.S acknowledge support from a UTEP start-up grant. L.M.M acknowledges the Wiemer Family for awarding Student Endowment for Excellence. S.R.S acknowledges the NSF-PREM program (DMR-1205302). The authors sincerely thank Prof. Russell Chianelli for shared synthesis facilities and for useful discussion. KMR acknowledges the NSF-MRI grant DMR-0722699. C.K. acknowledges the Boise State Center for Materials Characterization (BSCMC) and NSF MRI Grant DMR-0521315. The authors thank S.R.J. Hennadige and E. Castro for their help in performing ESR and Raman spectroscopy measurements, respectively.