
I. INTRODUCTION
During the past decades, because of the low cost, easy operation, and real time detecting superiorities, semiconductor-based chemical gas sensors are attracting more and more attention in various fields like chemical process control, environmental pollutants monitoring, medical diagnosis, and so on.Reference Wang, Wang, Zhang, Gao, Yang and Wang1–Reference Kaneti, Zhang, Liu, Yu, Yuan, Aldous and Jiang3 As the fine sensing material candidates, traditional semiconductor metal oxides (SMOs)Reference Li, Wei, Wang, Kuai and Geng4–Reference Wang, Li, Feng, Sun and Lu10 have exhibited obvious superiorities such as good compatibility, fast response and recovery speeds, favorable stability, etc. However, some of their traditional preparations are very expensive and complex,Reference Hwang, Choi, Woo, Kim, Jung, Tae-Yeon Seong, Kim and Lee11–Reference Chen, Archer and Lou13 even most of them work at high temperatures thus cause serious power consumption.Reference Wang, Zhao, Lian, Yu, Luan, Wang and Cui14 Since each individual SMO-based sensing material must be used under certain conditions, how to fabricate high performance sensors to meet practical usages becomes very necessary.
ZnO (E g = 3.37 eV, 300 K) is one of the particularly attractive sensor candidates due to the favorable chemical stability and hypotoxicity. Recently, many efforts have been made to improve the sensing performances of traditional ZnO-based sensors, including morphology control, heterostructure construction, and noble element doping.Reference Wang, Zhang, Yang, Gao, Zhang, Wang and Zhu15 Among various morphologies, 1D ZnO nanomaterialsReference Wang, Kang, Liu, Zhang, Huang and Wang16–Reference Han, Fan, Xu, Lin, Wei, Duan and Wang18 possess enhanced gas-sensing properties due to the high length to width ratios, fast electron transport capability, and effective gas diffusion through the surface.Reference Comini, Faglia, Sberveglieri, Pan and Wang19,Reference Wang, Wang, Xu, Hu, Zhang, Wang and Huang20 Besides, 1D ZnO-based nanoheterojunctions combining ZnO and other guest materials can form a more extended depletion layer at their interface;Reference Wang, Wang, Lei, Xie, Wu, Gou, Han, Shi and Fang21 therefore, the gas sensing efficiency will be enhanced.Reference Zhang, Liu, Wang, Yang, Guo, Wu, Wang and Zhang22 Though many classical SMO/ZnO heterostructures have been reported to exhibit improved sensing performances,Reference Shi, Xu, Hark, Liu, Wang, Peng, Wong and Li23–Reference Deng, Zhang, Guo, Chen and Ma27 exploring novel guest materials is still of practical significance.
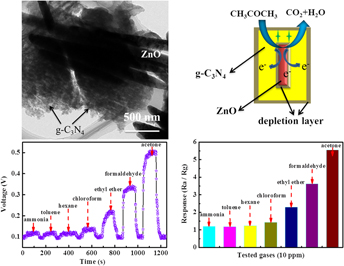
What’s particularly amazing is that polymeric graphitic C3N4 (g-C3N4, E g = 2.7 eV) is regarded as the most stable allotrope for carbon nitride at room temperature, which possesses the relatively high thermal and chemical stabilities, two dimensional layered conjugation structure, and large specific surface area.Reference Wang, Maeda, Chen, Takanabe, Domen, Hou, Fu and Antonietti28,Reference Pan, Zheng, Guo, Niu and Wang29 And most importantly, g-C3N4 is compatible with other SMOs easily as good substrate, thus Wang et al. made great contributions to investigate various g-C3N4-based composites with water splitting performances systematically,Reference Wang, Maeda, Thomas, Takanabe, Xin, Carlsson, Domen and Antonietti30,Reference Zheng, Lin, Ye, Guo and Wang31 while Zhu et al. fabricated ZnO/g-C3N4 hybrids which exhibited enhanced photodegradation abilities of organic pollutants,Reference Wang, Shi, Lin and Zhu32 and so on. Hence, the ZnO/g-C3N4 nanocomposite is expected as an efficient gas-sensing system. But as far as we know, the research studies on employing ZnO/g-C3N4 heterostructures for sensor application are still rare.Reference Zhang, Zhang, Guo and Chen33
In this paper, we adopted the methods of morphology adjustment and junction construction,Reference Wang, Li, Wang, Yu, Wang, Zhang and Wei34 and developed a simple two-step solution reaction to obtain ZnO/g-C3N4 nanoheterostructures, which presented 1D ZnO nanorods wrapped by 2D lamellar g-C3N4 nanostructures (g-C3N4 content of ∼25 wt%). The resulting composites were used to detect several toxic VOCs, which revealed the good selectivity and reproducibility to acetone at the optimal operating temperature (OT) of only 260 °C, especially higher response and faster response–recovery speeds than the pristine ZnO-based sensor. Finally, the mechanisms had also been illustrated to help explain these enhanced sensing performances.
II. EXPERIMENTAL
A. Chemicals
Chemicals such as Zn(NO3)2·6H2O, C12H25SO4Na (SDS), NaOH, ethylene glycol, and anhydrous ethanol were of analytical grade and purchased from Tianjin Guangfu Fine Chemical Research Institute (Tianjin, China). Cyanamide (99% purity) was purchased from Sigma-Aldrich (Milwaukee, Wisconsin). Deionized water was used throughout the experiments.
B. Synthesis of ZnO/g-C3N4 nanoheterostructures
The preparation process includes three stages. First, the synthesis process of bundle-like ZnO NRs was described in the section of “Synthesis of bundle-like ZnO NRs” in the Supplementary Material. Second, the thermal polycondensation of organic monomers was used to synthesize various nanostructured g-C3N4 materials.Reference Wang, Maeda, Thomas, Takanabe, Xin, Carlsson, Domen and Antonietti30 In our work, cyanamide (10 g) was placed in a silica crucible with a lid, which was then calcined at 550 °C (10 °C/min) in a muffle furnace for 4 h. Afterward, the crucible was cooled down to ambient temperature, then the obtained yellow product was ground into powder and stored for further use.
At the last stage, ZnO/g-C3N4 nanoheterostructures were fabricated by adding 0.092 g of g-C3N4 into 100 mL of ethylene glycol under stirring and ultrasonic bath (1200 W) for 3 h. Then, the yellow turbid liquid was centrifuged (1000 r/min, 8 min) to retain 1/3 of the supernatant. Afterward, 0.022 g of the ZnO NR powder was added into 15 mL of the above upper-layer fluid and stirred in a fume hood for 12 h, which was then transferred to a 50 mL of Teflon-lined stainless steel autoclave and solvothermally treated at 80 °C for 16 h. After the autoclave was cooled to room temperature, the light-yellow precipitate was centrifuged, washed with absolute alcohol three times, and dried at 60 °C. Finally, the resultant sample was calcined at 250 °C for 1 h to provide enough thermal energy to achieve a tight chemical binding between ZnO and g-C3N4 semiconductor powders.
C. Characterization
The phase, morphology, and composition of the final products were characterized by means of powder XRD analysis (Rigaku Ultima IV, Rigaku Corporation, Tokyo, Japan; Cu Kα radiation, λ = 1.5418 Å), FESEM (Hitachi SU5000, Hitachi Corp., Tokyo, Japan) with EDS (Quantax, Bruker), TEM and HRTEM (Tecnai G2 20, FEI, Hillsboro, Oregon), XPS (Kratos Axis Ultra DLD spectrometer, Shimadzu, Tokyo, Japan; Al Kα X-ray monochromator), and Thermogravimetric analysis (TGA) (Setaram Labsys Evo, France).
D. Sensor fabrication and gas-sensing test
The detailed sensor fabrication and gas-sensing test processes have been described in our previous reports,Reference Wang, Wang, Xu, Hu, Zhang, Wang and Huang20,Reference Wang, Li, Wang, Yu, Wang, Zhang and Wei34,Reference Wang, Li, Wang, Yu, Tang, Zhang, Wang and Wei35 which were shown in the section of “Sensor fabrication and gas-sensing test” in the Supplementary Material. The response (also called sensitivity) for the reducing gas is defined as R a/R g, where R a is the sensor resistance in air and R g is the sensor resistance in a target gas.Reference Wang, Li, Wang, Yu, Wang, Zhang and Wei34,Reference Wang, Li, Wang, Yu, Tang, Zhang, Wang and Wei35 The response time is defined as the time interval during which resistance attain a fixed percentage (90%) of final value when sensor is exposed to certain gas concentration; the recovery time is defined as the time interval during which sensor resistance reduces to 10% of the saturation value when the sensor is exposed to certain gas concentration and then is exposed to clean air.Reference Wang, Li, Wang, Yu, Wang, Zhang and Wei34
III. RESULTS AND DISCUSSION
A. Characterization
First, the crystal phases of the products were confirmed by powder XRD. Figures 1(a)–1(c) display the XRD patterns of the pure ZnO NR bundles, the ZnO/g-C3N4 nanoheterostructures, and the as-prepared g-C3N4 support, respectively. In Fig. 1(a), all the diffraction peaks can be ascribed to the hexagonal wurtzite ZnO phase (JCPDS No. 36-1451),Reference Jo, Lee and Selvam36 indicating that pure ZnO product was generated from aqueous solution containing Zn(NO3)2 and NaOH via a simple hydrothermal treatment and without annealing. Two pronounced peaks at 2θ of 27.54° and 13.1° in Fig. 1(c) belong to the (002) and (100) lattice planes of the graphite-like C3N4, which is in accordance with the typical interplanar staking peaks of aromatic systems (d = 0.326 nm) and the interlayer structural packing (d = 0.681 nm),Reference Wang, Maeda, Thomas, Takanabe, Xin, Carlsson, Domen and Antonietti30 respectively. However, as shown in Fig. 1(b), except for the diffraction peaks originated from the Si substrate (a small amount of the compositive sample was dropped onto the Si substrate before test), the remaining diffraction peaks are very similar to the previous pattern in Fig. 1(a), which can be identified as the ZnO phase. Besides, there is a faint and wide peak at 2θ of 27.54° corresponding to the (002) plane of g-C3N4 phase, revealing the simultaneous existence of ZnO and g-C3N4 in the as-obtained heterostructure product, which was further approved later by the coming results.
XRD patterns of (a) the pure ZnO NR bundles, (b) the ZnO/g-C3N4 nanocomposites, and (c) the pure g-C3N4.

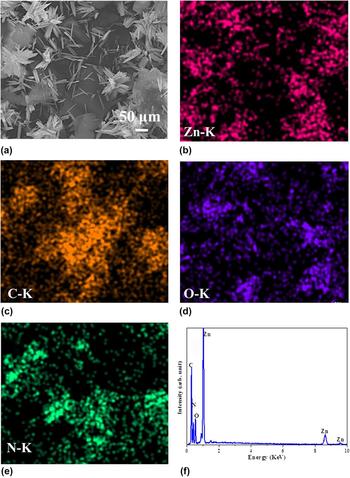
The morphology and shape of the as-synthesized products were confirmed by SEM (Fig. S1, Supplementary Material). Figure S1(a) presents an overall SEM image of pure ZnO product, indicating its overall rod-like structure stacked in bundles. Such nanorod structures (diameters of 100–130 nm, lengths of 1.5–3 μm) possess a higher ratio of length to width, thus providing more active sites for the adsorption of gas molecules, then the gas-sensing properties can be improved. For the ZnO/g-C3N4 nanoheterostructures in Figs. S1(b)–S1(d), it can be observed that the rod-like structures of ZnO are well maintained, which are wrapped by lamellar g-C3N4 NSs (marked in yellow) to form a heterojunction after calcination at 250 °C for 1 h. Besides, the chemical compositions of ZnO/g-C3N4 nanoheterostructures were confirmed by SEM phase mapping (SEM/EDS). Figure 2(a) exhibits a low-magnified SEM image of ZnO/g-C3N4 nanoheterostructure, while Figs. 2(b)–2(e) present the elemental mapping images of Zn Kα1 (red), C Kα1 (yellow), O Kα1 (purple), and N Kα1 (green), respectively, whose existences are further tested by the EDS spectrum in Fig. 2(f), proving the coexistence of ZnO and g-C3N4 phases.
(a) A low magnified SEM image of the ZnO/g-C3N4 nanocomposite, and the corresponding (b) Zn Kα 1 map, (c) C Kα 1 map, (d) O Kα 1 map, (e) N Kα 1 map, and (f) EDS spectrum.

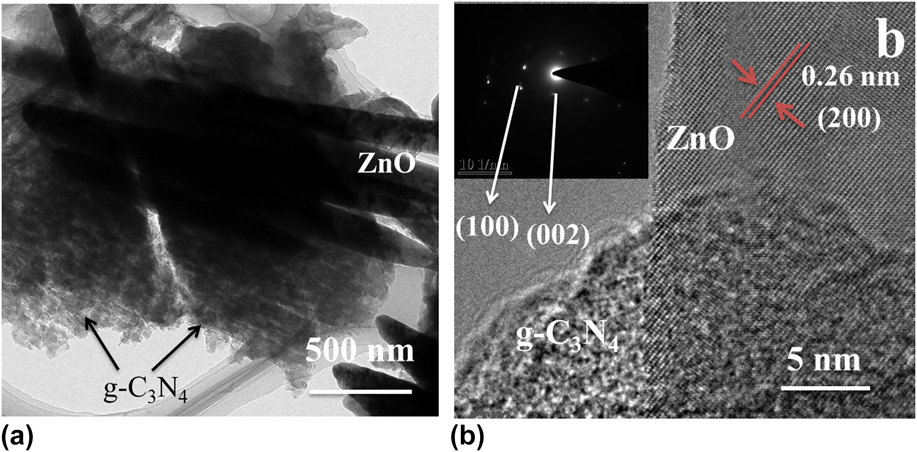
TEM and HRTEM characterizations were performed on the ZnO/g-C3N4 heterostructure to further explore how the ZnO NRs coupled with g-C3N4. As shown in Fig. 3(a), the lamellar g-C3N4 NSs wrap the ZnO sample that maintains the initial rod-like features after solvothermal reaction and then calcination. The HRTEM image in Fig. 3(b) displays a clearly enlarged cross-section of the ZnO/g-C3N4 heterostructure, revealing that the ZnO NRs were successfully combined with sheet-like g-C3N4 support. Besides, the crystal lattices of ZnO NR can be seen clearly with the lattice spacing of 0.26 nm corresponding to the (200) plane of hexagonal wurtzite ZnO.Reference Wang, Li, Wang, Yu, Tang, Zhang, Wang and Wei35 While the lattice fringes of g-C3N4 support are dim due to its polycrystal property. Besides, the selected area electron diffraction (SAED) patterns of the heterostructure are shown in the left part of Fig. 3(b), which involves two kinds of diffraction patterns. The diffraction rings can be ascribed to the two-dimensional g-C3N4 sheets, and the straight lines constituted by orderly and bright diffraction spots can be indexed as the rod-like ZnO nanomaterials. The excellent interfacial contact between ZnO and g-C3N4 phases will impel the formation of the heterostructure, thus favoring the transfer of electrons from g-C3N4 to ZnO and leading to the high gas-sensing performances.Reference Zhang, Zhang, Guo and Chen33
TEM (a) and HRTEM (b) images of the ZnO/g-C3N4 heterostructural nanocomposites, left part of (b) SAED pattern, showing both the diffraction rings of g-C3N4 and diffraction spots of ZnO.

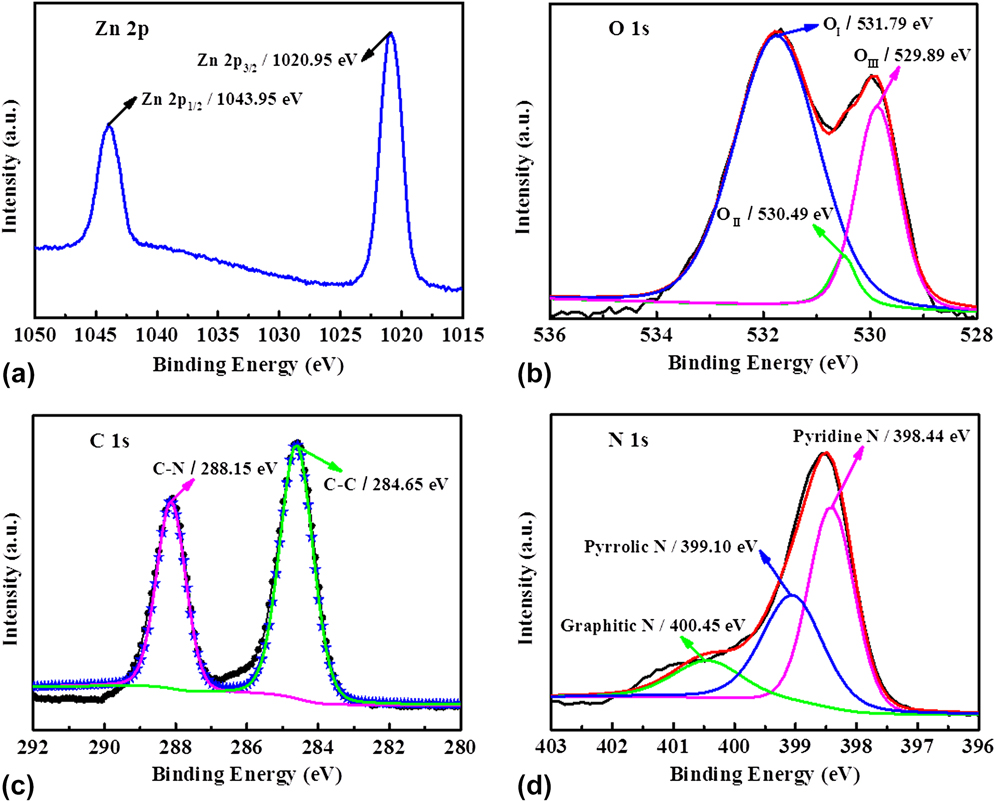
The surface compositions and the corresponding chemical states in the binary nanocomposite were measured in detail by XPS in Fig. 4. The Zn 2p spectrum [Fig. 4(a)] exhibits two peaks at 1020.95 and 1043.95 eV, which can be indexed to Zn 2p 3/2 and Zn 2p 1/2 of the Zn2+ species.Reference Wang, Li, Wang, Yu, Tang, Zhang, Wang and Wei35 Meanwhile, Fig. 4(b) exhibits an asymmetric broad curve of O 1s spectrum made up of three peaks which are centered at 531.79 (OI), 530.49 (OII), and 529.89 eV (OIII), respectively, which represents two kinds of oxygen species (Oδ−). The peak of OI illustrates the existence of surface adsorbed Oδ− (O2−, O−, etc.), which are the main active particles to react with the target gas molecules thus improving the sensing properties. While the other two peaks of OII and OIII are typically indexed to surface lattice oxygen (O2−).Reference Jo, Lee and Selvam36 The C 1s spectrum [Fig. 4(c)] exhibits two peaks at 284.65 and 288.15 eV that can be indexed to C=C and C=N bonds of g-C3N4, respectively.Reference Yu, Shang, Bian, Shi, Waterhouse, Zhao, Zhou, Wu, Tung and Zhang37 The deconvoluted N 1s [Fig. 4(d)] spectrum is divided into three peaks centered at 398.44, 399.10, and 400.45 eV, which can be indexed to the pyridine N, pyrrolic N, and graphitic N of g-C3N4, respectively.Reference Jo, Lee and Selvam36,Reference Yu, Shang, Bian, Shi, Waterhouse, Zhao, Zhou, Wu, Tung and Zhang37 The presence of Zn, O, C, and N peaks in the XPS spectra can also confirm the formation of the heterostructure.
XPS spectra for: (a) Zn 2p peak, (b) O 1s peak, (c) C 1s peak, and (d) N 1s peak of the as-synthesized ZnO/g-C3N4 heterojunction.

TGA of the as-prepared ZnO/g-C3N4 heterostructure was performed and shown in Fig. S2 (Supplementary Material). As can be seen, due to the loss of surface moisture and small amount of organic matter, the weight loss ratio before 530 °C is only 2.44%, which proves the high purity of our sample. Besides, the notable descending that started at 530 °C and completed at 720 °C can be attributed to the thermal decomposition of g-C3N4. And the actual amount of g-C3N4 in the heterostructure is corresponding to the weight loss ratio as about 23.71%, which is nearly consistent to the theoretical composition of g-C3N4 (25 wt%).
In conclusion, by combining the above analyses, we can conclude again that the rod-like ZnO nanostructures were successfully wrapped by the lamellar g-C3N4 NSs as the heterostructures. Based on such results, a feasible preparation process of the ZnO/g-C3N4 heterostructure is drawn in Fig. 5 that can be divided into three stages. Stage one shows the synthesis of highly dispersed g-C3N4 support. First, the polycondensation product of bulk g-C3N4 was ultrasonically exfoliated in ethylene glycol. Then, the yellow turbid liquid was centrifuged to retain the supernatant for further use. In stage two, the bundle-like ZnO NRs prepared in advance was put into the above upper-layer liquid under stirring, which was then transferred to the Teflon-lined autoclave followed by solvothermal treatment. And in the last stage, the light-yellow precipitate was centrifuged, washed, dried, and finally calcined at 250 °C to achieve a tight chemical binding at the interface of ZnO/g-C3N4 heterostructural products.
Schematic illustrations for the preparation process of the ZnO/g-C3N4 heterostructural nanocomposites.

B. Sensing performance of the ZnO/g-C3N4 nanoheterostructure
In view of the important application of the ZnO/g-C3N4 heterostructure as gas sensors, we investigated the gas-sensing property of the as-obtained samples. It is well known that the response of gas sensors based on SMO is highly affected by the OT. Therefore, first, due to its volatility and nontoxicity, ethanol vapor was applied as a typical molecular probe to detect the optimal OT at different OTs, a vital factor for gas-sensing performances.
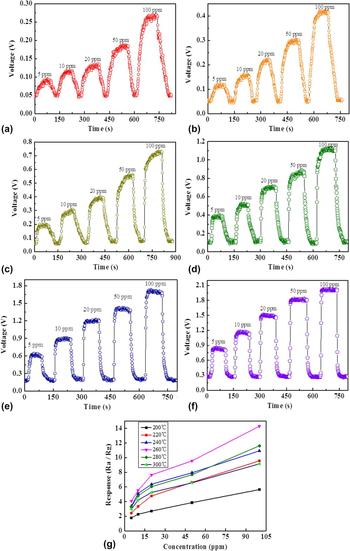
Figures 6(a)–6(f) display the dynamic response–recovery curves of the ZnO/g-C3N4 heterostructure sensor versus different ethanol concentrations (5, 10, 20, 50, and 100 ppm) at varying OTs: (a) 200, (b) 220, (c) 240, (d) 260, (e) 280, and (f) 300 °C, where the output voltage (Vout) increases when injecting the reductive ethanol vapor, and then recovers back to the starting value after the vapor is released during all six OTs, indicating the n-type semiconductor features of the ZnO/g-C3N4 sensor. The response/recovery speeds of the compositive sensor become quicker and quicker with the increase of OTs, and all the response/recovery times are within 65 s/50 s before 260 °C, then within 18 s/38 s above 260 °C. Moreover, the responses versus ethanol concentration/OT have been compared in Fig. 6(g). When the OTs are lower than 260 °C, all the responses gradually increase with increasing the OT, then reach the maximal values at 260 °C, e.g., the response gets the maximum of 14.29 toward 100 ppm of ethanol. However, the responses decrease after continually increasing the OT above 260 °C. Such a phenomenon can be explained by the speed balance between the gas adsorption/reaction and gas desorption on the surface of our sensor materials. A balance will be achieved between the above two processes at a certain temperature when the response of the sensor reaches the maximum. Consequently, 260 °C has been detected as the optimal OT for the ZnO/g-C3N4-based sensor to perform the next gas-sensing tests.
Dynamic response–recovery curves of the ZnO/g-C3N4 heterojunction sensor versus different ethanol concentrations at varying OTs: (a) 200 °C, (b) 220 °C, (c) 240 °C, (d) 260 °C, (e) 280 °C, (f) 300 °C, and (g) the corresponding responses.

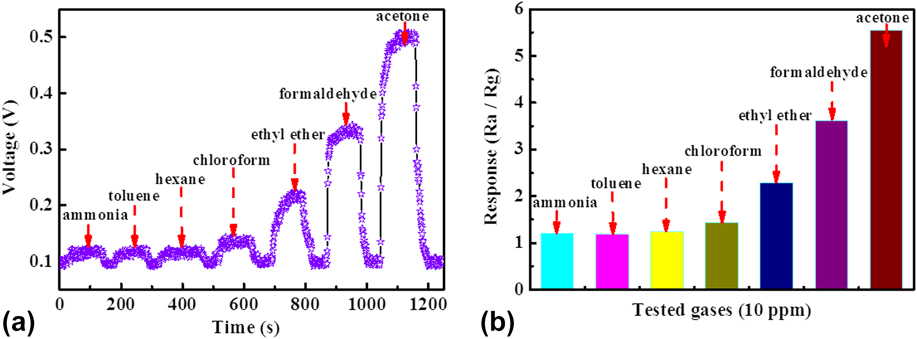
For a wider usage in detecting other toxic gases, gas sensing measurement of the ZnO/g-C3N4-based sensor was carried out toward seven typical organic polluting gases, such as ammonia, toluene, hexane, chloroform, ethyl ether, formaldehyde, and acetone. Figure 7(a) shows the dynamic change curves of the ZnO/g-C3N4 heterostructure sensor to 10 ppm of the above gases at 260 °C, and one can see the compositive sensor displays obviously highest response trend and quite fast response–recovery speed to acetone, then followed by formaldehyde and ethyl ether. However, the dynamic response amplitudes are similar but lower to the remaining gases. Besides, the corresponding responses have been compared in Fig. 7(b), which are 5.55, 3.62, 2.29, 1.43, 1.24, 1.18, and 1.2, respectively. This means that the ZnO/g-C3N4 heterostructure-based sensor should have a potential application in detecting acetone and formaldehyde. Meanwhile, good selectivity is another important aspect for assessing a sensor to detect a specific target gas in the multicomponent gas environment. So the above results indicate its good selectivity of acetone, which can be used in the detection of acetone emission in plants, quality control of drugs, diagnosis of diabetes mellitus, etc.Reference Musa-Veloso, Likhodii and Cunnane38
(a) Dynamic response–recovery curves and (b) the corresponding responses of the ZnO/g-C3N4 heterostructure-based sensor to 10 ppm of various toxic gases at 260 °C.

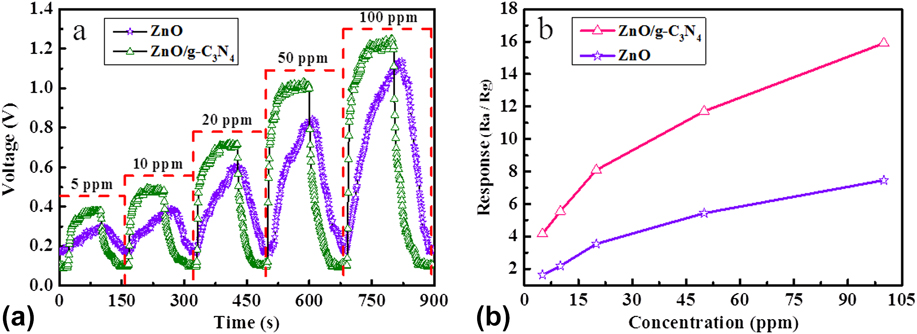
The sensing performances of the pure ZnO and ZnO/g-C3N4-based sensors were compared to prove the function of heterostructure. Figures 8(a) and 8(b) present the dynamic response–recovery curves of both sensors and the corresponding responses to acetone in the concentration sequence of 5, 10, 20, 50, and 100 ppm at 260 °C. In Fig. 8(a), compared with the pure ZnO sensor, the ZnO/g-C3N4 sensor exhibits significantly enhanced response amplitudes and faster response–recovery speeds toward all acetone concentrations. While in Fig. 8(b), the responses of the pure ZnO and ZnO/g-C3N4-based sensors are calculated as 1.63, 2.18, 3.54, 5.43, 7.46 and 4.16, 5.55, 8.09, 11.71, 15.9, respectively, which indicates that the gas sensing performances are dramatically improved after ZnO NRs were combined with lamellar g-C3N4 support.
(a) Dynamic response–recovery curves of both sensors and (b) the corresponding responses to acetone in the concentration sequence of 5, 10, 20, 50, and 100 ppm at 260 °C.

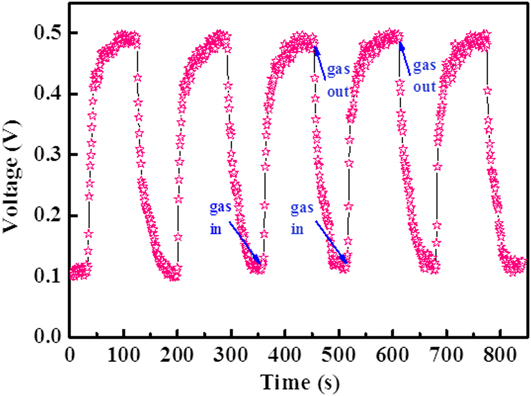
Then again, reproducibility, also called long term stability, is another important criterion to estimate the quality of a gas sensor. To examine the reproducibility of our ZnO/g-C3N4-based sensor, five successive response–recovery cycles were performed to 10 ppm acetone at 260 °C after two months, just as Fig. 9 has presented. As can be observed clearly, the gas in/response or out/recovery curves are nearly the same for the five cycles with slight changes in response values and response–recovery times, proving its good reproducibility characteristic and promising application in the acetone sensing-device industry.
Reproducibility of ZnO/g-C3N4 heterostructure-based sensor on successive 10 ppm of acetone (5 cycles) at 260 °C.

C. Sensing mechanism
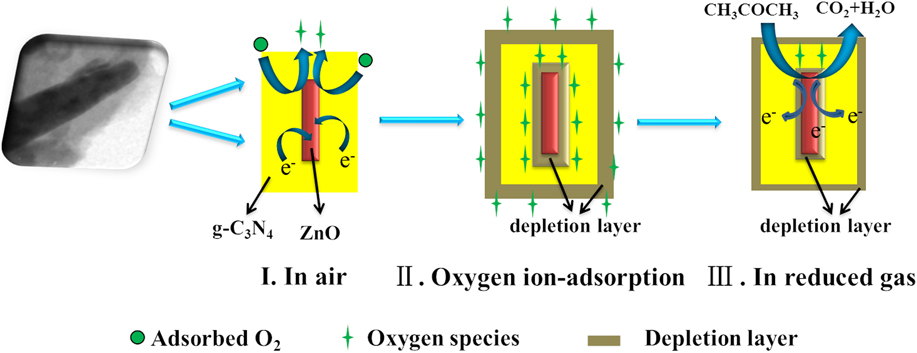
First of all, the electron depletion-layer theory can help explain the sensing mechanism of pure n-type SMOs.Reference Wang, Wang, Xu, Hu, Zhang, Wang and Huang20,Reference Wang, Li, Wang, Yu, Wang, Zhang and Wei34,Reference Williams39 As can be seen in Fig. 10, under a certain OT, when the fabricated ZnO NR is in air, the surface chemisorbed O2 molecules will capture electrons from the conduction band (CB) of ZnO to form negative oxygen ions Oδ− (O2−, O−, and O2−)Reference Wang, Li, Wang, Yu, Wang, Zhang and Wei34,Reference Wang, Li, Wang, Yu, Tang, Zhang, Wang and Wei35 (Step I). As the electrical conductivity of N-type SMO relies on electrons, the concentration of free charge carriers will be reduced, and the conductivity of ZnO decreases along with the depletion region widening (Step II). When the sensor is in the reducing gas, like acetone, the reducing gas will react with these adsorbed Oδ− species, then the captured electrons will be returned back to the CB of ZnO, thus narrowing the depletion layer and increasing the conductivity of 1D ZnO (Step III). As a result, the sensor response will be improved by enhancing the conductance changes.
The gas sensing mechanisms of the ZnO/g-C3N4 heterostructure sensor.

However, the deeper sensing mechanism of ZnO/g-C3N4 heterostructures becomes rather complex to discuss. The enhanced performance in the acetone response may be related with the following factors. The first one is concerned with the morphology and size of our as-synthesized material. On the one hand, the 1D ZnO NRs (diameter of 100–130 nm, length of 1.5–3 μm) possess a higher ratio of length-to-width and unique electron transport properties, which can supply more active sites for the adsorption/reaction/diffusion of gas molecules on the materials, thus improving the sensing performances. On the other hand, as an excellent semiconductor, g-C3N4 support possesses large lamellar NS structure and good permeability, and the high nitrogen content of g-C3N4 can also provide more active reaction sites to adsorb acetone molecules, so the effective gas transmission taken on the inner and outer regions of such efficient gas-sensing system can be easily accomplished.Reference Fu, Zhu, Zhang, Li and Chen40 So higher response values as well as shorter response times have been achieved.
Second, the construction of the heterostructure between ZnO and g-C3N4 is the principal reason of the enhanced response. As can be seen from the HRTEM image [Fig. 3(b)], a clear interface between the phases of ZnO and g-C3N4 can be seen. Because of the different work functions (Φ) for g-C3N4 (4.3 eV) and ZnO (5.2 eV),Reference Liang, Zheng, Chen, Liu, Jurcakova, Jaroniec and Qiao41 electrons will flow unidirectionally from g-C3N4 to ZnO until the Fermi levels balance (Step I of Fig. 10), and the potential barrier becomes higher. Then an additional depletion layer will be generated in the vicinity region of the heterostructure interfaces, which may cause an increase in the separating efficiency of interfacial hole–electron pairs between these two phases.Reference Wang, Li, Wang, Yu, Wang, Zhang and Wei34 Afterward, as the former “surface reaction” describes,Reference Wang, Li, Wang, Yu, Tang, Zhang, Wang and Wei35 the density of free electrons in such a region will increase and then the dissociation of molecular O2 becomes easily by capturing these free electrons. Consequently, a higher resistance state in air is formed in ZnO/g-C3N4 heterostructures, as shown in Step II of Fig. 10. In this case, the conductivity of the sensing material is very low, or the heterojunction barrier is very high. However, just as Step III in Fig. 10 has presented, when the ZnO/g-C3N4 heterostructure sensor is exposed to the reducing acetone vapor, more and more target molecules will accumulate to the interface region then react with more adsorbed Oδ−, which facilitates more free electrons to transfer efficiently from gas molecules to the surface of the heterostructure,Reference Fu, Zhu, Zhang, Li and Chen40 thus significantly reducing the potential barrier height and the thickness of the electron depletion layer on the interfacial regions of ZnO and g-C3N4, leading to a greater variation of conductivity. As a result, the improved sensing performances of the ZnO/g-C3N4 heterostructures can be observed.
IV. CONCLUSIONS
In summary, we have fabricated the binary structures of ZnO/g-C3N4 nanoheterostructure successfully through the effective hydrothermal/solvothermal treatment followed by annealing. The characterization results proved that 1D ZnO NRs were wrapped by exfoliated 2D lamellar g-C3N4 nanostructures with a g-C3N4 content of ∼25 wt%. The obtained nanocomposite was used for the detection of some toxic VOCs, and displayed good selectivity/reproducibility to acetone at the optimal OT of only 260 °C, especially higher response values and faster response/recovery speeds than the pure ZnO-based sensor, indicating its promising application as the high-performance acetone sensor. The factors like the unique 1D nanorod-like ZnO structure and the 2D sheet-like g-C3N4 support as well as the dramatic changes of the heterojunction barrier at the interface may contribute to the enhanced performances. The as-prepared ZnO/g-C3N4 heterostructures may also play important parts in such aspects like lithium-ion batteries, photocatalysis, optical devices, and so on.
Supplementary Material
To view supplementary material for this article, please visit https://doi.org/10.1557/jmr.2018.37.
ACKNOWLEDGMENTS
The work was supported by the National Natural Science Foundation of China (Nos. 91428203, 41473118, and 51762005), the BaGui Scholars Program Foundation (2014BGXZGX03), and the Natural Science Foundation of Guangxi Province, China (Nos. 2016GXNSFBA380232 and 2017GXNSFAA198254).