Nomenclature
- ADIS
-
anti/de-icing systems
- NREL
-
national renewable energy laboratory
- HAWT
-
horizontal axis wind turbine
- LSS
-
low-speed shaft
- HSS
-
high-speed shaft
- rpm
-
revolution per minute
- MS
-
Mustafa Sahin
- NACA
-
National Advisory Committee for Aeronautics
- DU
-
Delft University
- CFD
-
computational fluid dynamics
- TSR
-
tip speed ratio
- PI
-
proportional integral
Symbols
-
 ${O_b}{x_b}{y_b}{z_b}$
-
blade-aligned coordinate system
-
${O_{ae}}{x_{ae}}{y_{ae}}{z_{ae}}$
-
aerodynamic-aligned coordinate system
-
${O_z}{x_z}{y_z}{z_z}$
-
azimuth-aligned coordinate system
-
${O_y}{x_y}{y_y}{z_y}$
-
yaw-aligned coordinate system
-
${O_w}{x_w}{y_w}{z_w}$
-
wind-aligned coordinate system
-
${O_h}{x_h}{y_h}{z_h}$
-
hub-aligned coordinate system
-
${J_t}$
-
turbine total inertia
-
$\Omega $
-
rotor speed
-
${\tau _{aero}}$
-
aerodynamic torque
-
${\tau _{gen}}$
-
generator torque
-
${J_r}$
-
rotor inertia
-
${N_{gear}}$
-
gearbox ratio
-
${J_{gen}}$
-
generator inertia
-
$\beta $
-
blade pitch angle
-
$\alpha $
-
angle-of-attack
-
${\beta _T}$
-
twist angle
-
${\beta _p}$
-
summation of twist and blade pitch angles
-
$\varphi $
-
inflow angle
-
$a$
-
axial induction factor
-
$a'$
-
tangential induction factor
-
$i$
-
blade number
-
$j$
-
blade section
-
${V_{{b_x}}}$
-
wind velocity component along the x-axis of blade-aligned coordinate system
-
${V_{{b_y}}}$
-
wind velocity component along the y-axis of blade-aligned coordinate system
-
$U$
-
freestream wind velocity
-
${V_{eff}}$
-
effective wind speed seen by each blade section
-
$d{F_{{L_{a{e_x}}}}}$
-
sectional aerodynamic lift force in the x-axis of aerodynamic-aligned coordinate system
-
$d{F_{{D_{a{e_y}}}}}$
-
sectional aerodynamic drag force in the y-axis of aerodynamic-aligned coordinate system
-
$\rho $
-
air density
-
$Cl$
-
lift coefficient
-
$Cd$
-
drag coefficient
-
$c$
-
chord length
-
$dr$
-
sectional radius
-
$d{F_{{F_{{b_x}}}}}$
-
sectional flapwise force in the x-axis of blade-aligned coordinate system
-
$d{F_{{E_{{b_y}}}}}$
-
sectional edgewise force in the y-axis of blade-aligned coordinate system
-
${B_{n}}$
-
total blade number
-
$S$
-
number of blade sections
-
$r$
-
local radius
-
$\phi $
-
pre-cone angle
-
$T$
-
turbine thrust force
-
$P$
-
turbine power
-
${C_p}$
-
power coefficient
-
${P_{wind}}$
-
power available in wind
-
$\theta $
-
nacelle tilt angle
-
$\varPsi $
-
turbine yaw angle
-
$R$
-
rotor radius
-
$\lambda $
-
tip speed ratio
-
${U^{\rm{*}}}$
-
hub height wind speed
-
${\tau _c}$
-
torque controller output
-
${K_c}$
-
torque controller gain
-
${C_{pmax}}$
-
maximum power coefficient
-
${\lambda _{\rm{*}}}$
-
optimum tip speed ratio
-
${\beta _{\rm{*}}}$
-
optimum blade pitch angle
-
${K_p}$
-
proportional gain of the blade pitch controller
-
${K_i}$
-
integral gain of the blade pitch controller
-
${w_n}$
-
natural frequency
-
$\xi $
-
damping ratio
-
$A$
-
system gain
-
$B$
-
input gain
-
${U_e}$
-
equilibrium wind speed
-
${\varOmega _e}$
-
equilibrium rotor speed
-
${\beta _e}$
-
equilibrium blade pitch angle
-
$GK$
-
gain correction factor
-
${\beta _K}$
-
estimated blade pitch angle in region 3
-
$K_p^{GS}$
-
gain scheduled proportional gain of the blade pitch controller
-
$K_i^{GS}$
-
gain scheduled integral gain of the blade pitch controller
-
$\varDelta \varOmega $
-
rotor speed error
-
${\varOmega _{ref}}$
-
rotor speed reference
-
${\beta _{ref}}$
-
blade pitch controller output
-
$C{l_c}$
-
lift coefficient of clean aerofoil
-
$C{d_c}$
-
drag coefficient of clean aerofoil
-
$C{l_i}$
-
lift coefficient of iced aerofoil
-
$C{d_i}$
-
drag coefficient of iced aerofoil
-
${B_d}$
-
disturbance input gain


1.0 Introduction
Ice accumulation on turbine blades changes the blade geometry, increases the blade mass and significantly disturbs the aerodynamics as well as the dynamics of turbines, i.e. altering the turbine characteristics. Altered turbine characteristics lead to a decrease in turbine aerodynamic performance, decreasing power output and increasing the loads on various turbine structures such as blades, towers, etc. Even a slight ice accumulation on blades may lead to observing these adverse consequences on turbines since it generates enough surface roughness on turbine blades, which drastically affects turbine aerodynamic efficiency [Reference Hochart, Fortin, Perron and Ilinca1]. In addition, ice accumulation causes electrical and mechanical part failures, turbine fatigue, controller inaccuracies, incorrect sensing and safety concerns such as ice shedding, etc. To reduce these risks, turbines are often shut down in icing conditions across wind farms [Reference Hochart, Fortin, Perron and Ilinca1–Reference Ibrahim, Pope and Muzychka4]. Because of severe icing, the downtime of turbines may take relatively long periods, days or even weeks, resulting in reduced financial income of the wind farm operators [Reference Gao, Tao, Liu, Hu and States5, Reference Li, Chi, Li, Xu, Guo and Feng6]. For instance, in Refs [Reference Gao, Tao, Liu, Hu and States5, Reference Wallenius and Lehtomäki7], it is noted that due to severe ice accumulation, turbine power losses have exceeded 20% of the annual energy production at many wind farms.
Thus, for cold region installations, turbine manufacturers exceptionally equip their standard turbines with special anti/de-icing systems (ADIS), which utilise active or passive methods.
Passive methods, for instance, involve painting turbine blades in black and utilising stick-resistant surfaces or specialised materials for coating. Conversely, active methods employ an electrical ice protection system that circulates hot air within turbine blades, a widely adopted strategy in the wind power sector. Additionally, a thermal system is employed to apply heat directly to the blades, effectively preventing ice accumulation [Reference Baring-Gould, Tallhaug, Ronsten, Horbaty, Cattin and Laakso9]. As seen in Fig. 1, to get rid of this serious atmospheric problem, helicopters may even be employed to prevent icing on turbines by spraying anti-icing agents [Reference Barbara8]. In Refs [Reference Sahin and Yavrucuk10, Reference Sahin and Yavrucuk11], the author of this paper, as the corresponding author, proposes an adaptive control method as a solution to reduce excessive thrust force stemming from ice accumulation on turbine rotor blades.
Ice accumulation removal by a helicopter, Caribou Wind Farm, Canada, Photo: Barbara Rook [Reference Barbara8].

As relevant to wind turbine icing, there are experimental and computational studies in the literature. Experimental inquiries into turbine icing often utilise methods such as icing wind tunnels [Reference Han, Palacios and Schmitz12–Reference Hudecz, Koss and Hansen14] or placement of turbine aerofoils with artificial ice shapes inside conventional wind tunnels [Reference Brandrud and Krøgenes2, Reference Seifert and Richert15–Reference Barber, Wang, Jafari, Chokani and Abhari17]. Also, field observation is another experimental method used to investigate ice accretion on turbines/blades and its impacts on turbine power output [Reference Gao, Tao, Liu, Hu and States5, Reference Shu, Li, Hu, Jiang, Qiu and McClure28]. In computational research, computer programmes or newly developed tools are employed to predict ice accretion on turbine blades/aerofoils and its resulting impacts on aerofoils/turbines. LEWICE and FENSAP-ICE are some of the frequently used tools to estimate blade ice formation, while the FLUENT programme is widely utilised to estimate the performance of iced blades/turbines [Reference Hasanzadeh, Laurendeau and Paraschivoiu18–Reference Villalpando, Reggio and Ilinca20]. Thus, ice accretion physics, ice accumulation modeling and icing effects on turbines/blades are interesting subjects and growing fields [Reference Yirtici and Tuncer21, Reference Jin and Virk22].
To illustrate from the literature, Seifert and Richert [Reference Seifert and Richert15], Jasinski et al. [Reference Jasinski, Noe, Selig and Bragg16], Brandrud and Krøgenes [Reference Brandrud and Krøgenes2] and Manshadi and Esfeh [Reference Manshadi and Esfeh75] performed aerodynamic experiments on different aerofoils with artificially created ice shapes, based on blade ice deposits or predictions through computer software such as LEWICE, FENSAP-ICE. Using icing wind tunnels, Hochart et al. [Reference Hochart, Fortin, Perron and Ilinca1], Hudecz et al. [Reference Hudecz, Koss and Hansen14] and Jin and Virk [Reference Jin and Virk23] conducted similar aerodynamic studies on different aerofoils. Hudecz et al. [Reference Hudecz, Koss and Hansen14] also incorporated computational fluid dynamics (CFD) simulations to explore the effects of icing on flow and aerofoil aerodynamics, while Jin and Virk [Reference Jin and Virk23] employed ANSYS, FENSAP-ICE and FLUENT programmes to examine ice accretion on different aerofoils. Likewise, Villalpando et al. [Reference Villalpando, Reggio and Ilinca20] used FLUENT to investigate icing impacts on aerofoil aerodynamics. Further studies by Homola et al. [Reference Homola, Virk, Nicklasson and Sundsbø24], Lamraoui et al. [Reference Lamraoui, Fortin, Benoit, Perron and Masson25], Etemaddar et al. [Reference Etemaddar, Hansen and Moan19] and Yirtici et al. [Reference Yirtici, Sevine, Ozgen and Tuncer26] explored ice accumulation and its consequences on turbine power output. Etemaddar et al. [Reference Etemaddar, Hansen and Moan19] additionally investigated icing impacts on different turbine parameters such as power, thrust force using the HAWC2 simulation model. Shu et al. [Reference Shu, Liang, Hu, Jiang, Ren and Qiu3] and Yirtici et al. [Reference Yirtici, Ozgen and Tuncer27] proposed models/methodologies regarding ice accretion on turbine blades/aerofoils. Field investigations by Shu et al. [Reference Shu, Li, Hu, Jiang, Qiu and McClure28] and Gao et al. [Reference Gao, Tao, Liu, Hu and States5] examined real-world ice accretion on different wind turbines and its consequences on various turbine parameters. To reduce the negative impacts of turbine/blade icing, recent studies have concentrated on aerofoil optimisation [Reference Yirtici and Tuncer21, Reference Yoon and Yee29, Reference Kollar and Mishra30], ice detection methods [Reference Guo and Infield31–Reference Cheng, Shi, Liu, Liu and Huang34] and anti/de-icing technologies [Reference Li, Chi, Li, Xu, Guo and Feng6, Reference Mayer, Ilinca, Fortin and Perron35–Reference Shu, Qiu, Hu, Jiang, McClure and Liu40].
Icing is mainly seen at the turbine blades’ leading edges. It builds up progressively from the root to the tip of the blades, occurring less accumulation with a small thickness at the blade root, and more accumulation with a large thickness at the tip. It increases the blade mass and varies the aerodynamic performance of turbine blades by lowering the lift coefficients and augmenting the drag coefficients of all blades’ sections [Reference Hochart, Fortin, Perron and Ilinca1, Reference Shu, Liang, Hu, Jiang, Ren and Qiu3, Reference Hu, Zhu, Chen, Shen and Du13, Reference Hudecz, Koss and Hansen14, Reference Homola, Virk, Nicklasson and Sundsbø41]. The previous studies examined the impacts of icing on turbine power output, torque, thrust force, annual energy production, aerodynamic performance/efficiency, blade aerofoil optimisation against ice accretion, icing detection anti and de-icing systems, etc. Different from the literature, taking into account the experimental findings in Ref. [Reference Brandrud and Krøgenes2] for an iced turbine blade aerofoil, this study implements ice accumulation to the blades of a turbine to find out how icing influences the performance of its baseline controllers, namely the generator torque and collective blade pitch controllers. This study is primarily conducted to examine the impacts of ice accumulation on the transient and steady-state performance of these important turbine controllers through simulations. The NREL 5-MW reference turbine [Reference Jonkman, Butterfield, Musial and Scott42] is utilised, and its baseline controllers are simulated with the MS (Mustafa Sahin) Bladed Model. A very slight ice is assumed to have accumulated and solidified on the 5-MW turbine blades, remaining static over time with no ice shedding [Reference Sahin and Yavrucuk11, Reference Sahin and Yavrucuk43, Reference Sahin44]. Ice accumulation modeling is realised based on icing characteristics and its consequences on blade mass and aerodynamics. The transient and steady-state performance of the controllers is comparatively investigated for clean and iced blade cases under 1 m/s step rising wind speeds in Regions 2 and 3, where the turbine generates partial and rated power, respectively. Detailed definitions of these turbine operating regions are provided in the subsequent sections. The torque controller performance is tested under a step rising wind speed of 8 to 9 m/s in Region 2, while the blade pitch controller performance is tested under step rising wind speeds of 12 to 13 m/s, 16 to 17 m/s and 20 to 21 m/s in Region 3. During all the simulations, the turbine yaw angle is restricted to zero yaw angle, and the rotor speed response is taken into account for the performance evaluation of both controllers. Simulation results show that, against such slight ice accumulation on turbine blades, the transient and steady-state performance of the generator torque controller reduces in Region 2. The rotor speed reaches the steady-state with around 2 s longer time, and a steady-state error of 1.86% occurs in the rotor speed response. In Region 3, the transient performance of the blade pitch controller decreases at low wind speeds, particularly near the rated wind speed, causing a longer decay time of up to 5.2 s. Beyond the wind speed of 16 m/s, it starts to recover and becomes almost the same for both cases at 21 m/s, but the controller steady-state performance does not change throughout the region.
Assuming the same ice accumulation scenario on the same NREL turbine, the author, as the corresponding author, has recently investigated atmospheric icing impacts in Ref. [Reference Sahin and Farsadi45] on the static and dynamic turbine performance and behaviour under uniform and turbulent winds. This current paper, however, focuses on a different subject and further investigates blade icing impacts, this time, on the performance of baseline turbine controllers, considering their transient and steady-state performance aspects. It has the following significance and innovations. For the first time in the literature, it investigates the transient and steady-state baseline turbine controllers’ performance against ice accumulation on rotor blades. To the author’s knowledge, the effect of blade ice accumulation on baseline turbine controllers, i.e. their effectiveness against blade ice accumulation, has not been studied in the literature. This study is particularly important because blade ice accumulation impacts on turbine controllers are a source of great uncertainty/gap in the literature for turbine designers, control engineers and operators. This study considers that the turbine rotor blades are completely subjected to slight icing along the blades’ leading edges, ignoring their circular root connection sections. Ice accumulation modeling is carried out considering the published experimental findings in Ref. [Reference Brandrud and Krøgenes2]. Furthermore, the turbine
 ${C_p}$
surface contours with clean and iced blades are also generated and compared with each other. The variations in
 ${C_p}$
surface parameters are indicated. The effects of blade ice accumulation on turbine rotor characteristics are examined by estimating the variations in turbine system, control input and disturbance input gains at different operating points with clean and iced blades. The changes in rotor aerodynamic torque-blade pitch angle curves are generated at different wind speeds for clean and iced blade cases. Simulation results are provided for different parameters covering turbine controllers’ parameters/gain(s), blade pitch angle, rotor and generator speeds, thrust, power, power coefficient, etc. Turbine parameters are analysed in terms of reductions or increases in percent against the clean blades.
Following the introduction above, Section 2 outlines the methodology. It briefly introduces the MS Bladed Model, explains its validation and defines the NREL 5-MW turbine, turbine operating regions, control purposes and baseline controllers. The section also verifies the dynamic responses of the baseline controllers acquired by the MS Bladed Model on the 5-MW turbine against those obtained using the NREL OpenFAST Model. Additionally, it discusses ice accumulation modeling and its effects on the efficiency of the 5-MW turbine. Section 3 presents the results and discussions. It investigates the effectiveness of turbine controllers against ice accumulation, i.e. the effects of ice accumulation on the performance of the generator torque and collective blade pitch controller for clean and iced blade cases. To indicate the accuracy of the obtained results, the steady-state results of numerous turbine parameters encompassing rotor speed, blade pitch angle, rotor power, thrust force, etc., are compared with the formerly published findings. Finally, Section 4 presents the conclusions by summarising the current research, findings and gives suggestions to future researchers.
2.0 Methodology
Here, a brief overview of the utilised MS Bladed Model, its underlying theory and validation are provided. The key features of the employed NREL 5-MW wind turbine and its blades are introduced. Turbine operating regions and control objectives are explained. The baseline turbine controllers’ algorithms are defined, and their dynamic responses are presented and validated against formerly published findings in the literature. The method used for ice accumulation modeling on the NREL 5-MW turbine is explained and icing impacts on turbine efficiency are indicated.
One mass model with a non-flexible shaft system and blades (adapted from Ref. [Reference Sahin, Yavrucuk, Diez and Icaza77]).

2.1 MS bladed model and NREL 5-MW wind turbine
The MS (Mustafa Sahin) Bladed Model, developed by the author, is a recently well-known equation-based simulation tool in the literature [Reference Sahin and Yavrucuk11, Reference Sahin and Yavrucuk43–Reference Sahin and Farsadi45, Reference Sahin, Yavrucuk, Diez and Icaza77]. It is created using MATLAB and Simulink programmes [46] and used for Horizontal Axis Wind Turbine (HAWT) simulations. The mainstay of the model is the Blade Element Momentum theory [Reference Hansen47, Reference Manwell, McGowan and Rogers48]. The model disregards the aerodynamic interactions between blade sections, treating each section’s aerodynamics independently. Additionally, it incorporates key aerodynamic corrections: turbulent wake state [Reference Hansen47, Reference Branlard49, Reference Wanderley and Levi76] skewed wake rotation [Reference Pitt and Peters50–Reference Moriarty and Hansen52], as well as hub and tip losses [Reference Moriarty and Hansen52]. Moreover, it has special coordinate systems [Reference Sahin44, Reference Ning53] for simulations of turbines with different structural angles such as rotor tilt angle, pre-cone angle. Some of these coordinate systems such as blade-aligned (
 ${O_b}{x_b}{y_b}{z_b}$
), aerodynamic-aligned (
 ${O_{ae}}{x_{ae}}{y_{ae}}{z_{ae}}$
), azimuth-aligned (
 ${O_z}{x_z}{y_z}{z_z}$
), yaw-aligned (
 ${O_y}{x_y}{y_y}{z_y}$
), wind-aligned (
 ${O_w}{x_w}{y_w}{z_w}$
) and hub-aligned (
 ${O_h}{x_h}{y_h}{z_h}$
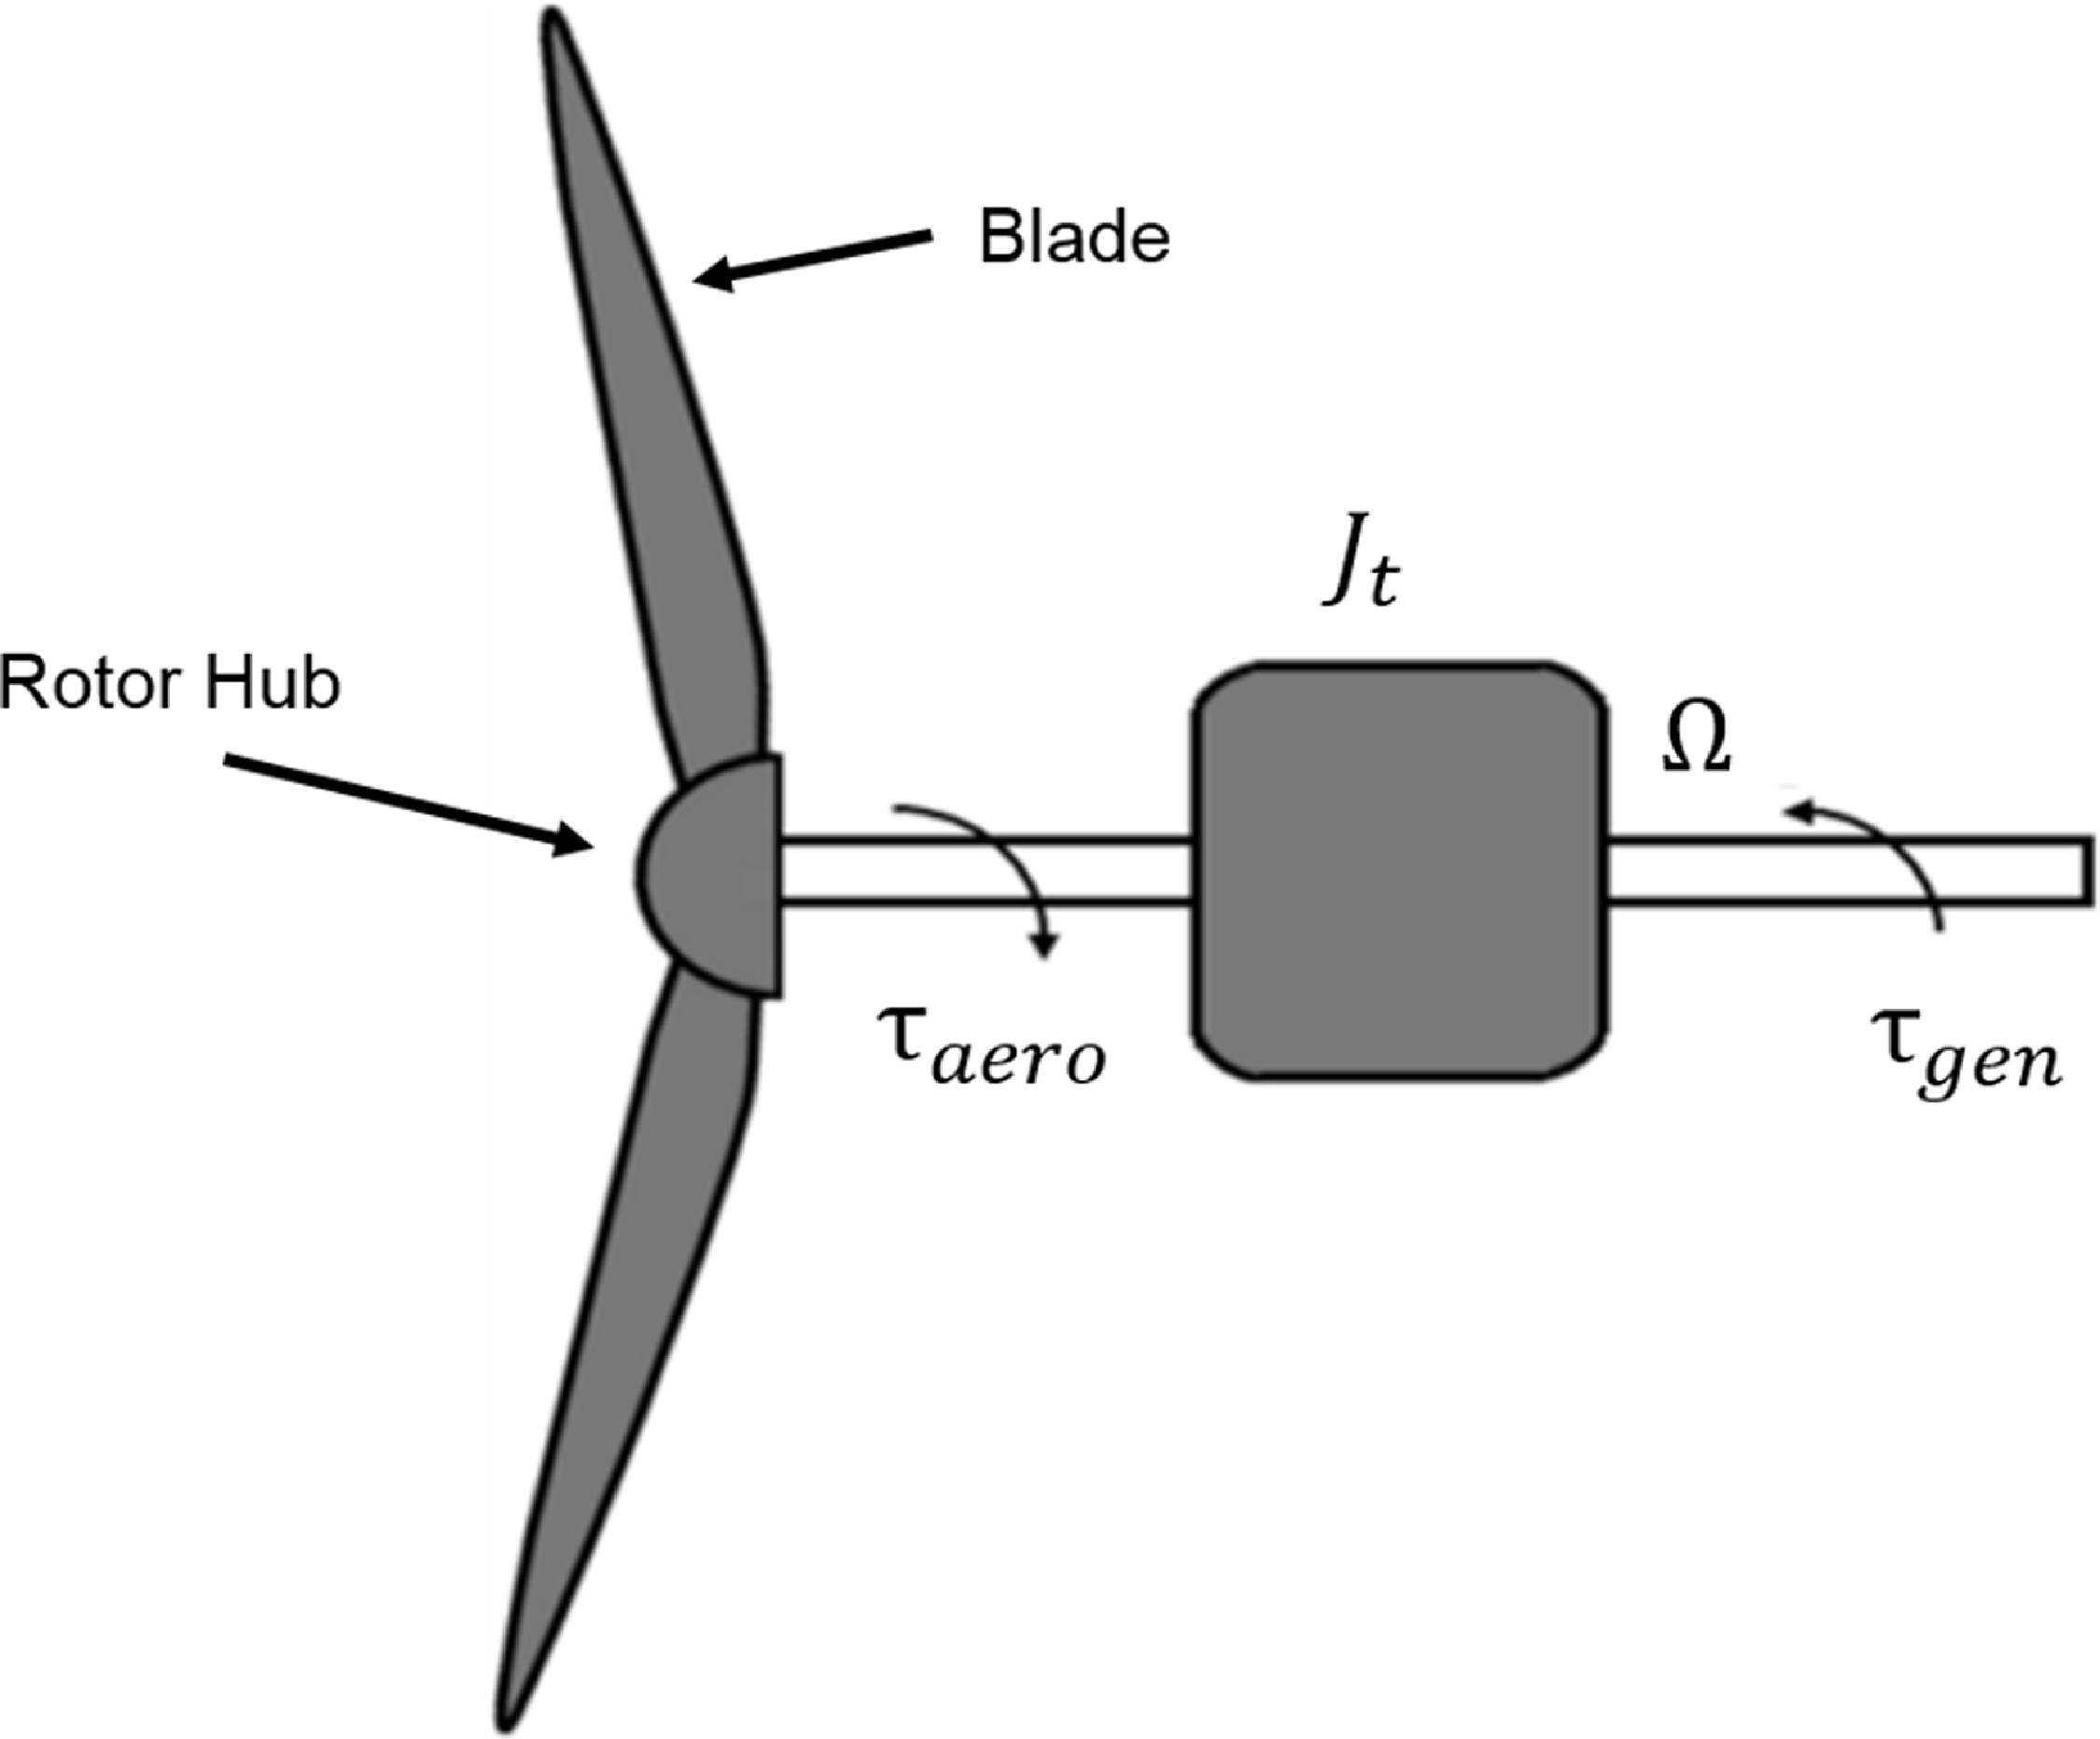
) coordinate systems are seen in Figs 3 and 4. The MS Bladed Model assumes that turbines comprise one single mass (Fig. 2) with non-flexible structures including shaft(s) and blades, featuring a drivetrain encompassing a rotor, a gearbox, a variable torque generator, along with a frictionless drivetrain system comprising a LSS (low-speed shaft) and a HSS (high-speed shaft). Therefore, the model represents a turbine as follows:
 \begin{align} {J_t}\dot \Omega = {\tau _{aero}} - {\tau _{gen}}, \end{align}
 \begin{align} {J_t} = {J_r} + N_{gear}^2{J_{gen}}, \end{align}
where
 ${J_t}$
represents the total turbine inertia,
 $\Omega $
denotes the rotor speed,
 $\dot \Omega $
is the derivative of the rotor speed.
 ${\tau _{aero}}$
corresponds to the rotor aerodynamic torque, while
 ${J_r}$
stands for the rotor inertia and
 ${J_{gen}}$
for the generator inertia.
 ${N_{gear}}$
denotes the gearbox ratio,
 ${\tau _{gen}}$
means the generator torque in the rotor (LSS) shaft.
Aerodynamic forces, angles and induced velocities on a blade section expressed in aerodynamic-aligned and blade-aligned coordinate systems (adapted from Refs [Reference Ning53, Reference Sahin, Yavrucuk, Diez and Icaza77]).

Some coordinate systems and angles used in the MS Bladed Model: (a) blade-aligned, azimuth-aligned, yaw-aligned and wind-aligned coordinate systems with yaw and pre-cone angles and (b) hub-aligned and yaw-aligned coordinate systems with nacelle tilt angle (adapted from Refs [Reference Ning53, Reference Sahin, Yavrucuk, Diez and Icaza77]).

In the model, the blade pitch angle,
 $\beta $
, is calculated using Equation (3), whereas the angle-of-attack,
 $\alpha $
, of a blade section is estimated by Equation (4):
 \begin{align} \beta = {\beta _{{p_{i,j}}}} - {\beta _{{T_{i,j}}}}, \end{align}
 \begin{align} {\alpha _{i,j}} = {\varphi _{i,j}} - {\beta _{{p_{i,j}}}}, \end{align}
where
 ${\beta _T}$
represents the twist angle,
 ${\beta _p}\;$
is the summation of this angle,
 $\;{\beta _T}$
, and the blade pitch angle,
 $\;\beta $
, whereas
 $\varphi $
denotes the inflow angle,
 $i$
stands for the blade number: blade 1, blade 2, etc. and
 $j$
indicates the blade sections: 5th section, 6th section, etc. Figure 3 shows these angles on a blade aerofoil section with some velocities and forces in some coordinate systems: aerodynamic-aligned and blade-aligned coordinate systems.
In the MS Bladed Model, basically the axial,
 $a$
, and tangential,
 $a'$
,
 $\;$
induction factors (Fig. 3) are estimated through an iteration process at every blade section. Depending on the turbine operations, whether the turbine rotor operates with a turbulent wake state or a skewed wake rotation, the axial induction factor is corrected for each blade section. The effect of hub loss and tip loss is also included into the calculation of induction factors [Reference Hansen47, Reference Branlard49, Reference Pitt and Peters50–Reference Moriarty and Hansen52, Reference Wanderley and Levi76, Reference Sahin, Yavrucuk, Diez and Icaza77]. Using the estimated induction factors, the axially,
 ${V_{{b_{{x_{i,j}}}}}}\left( {1 - {\rm{\;}}{a_{i,j}}{\rm{\;}}} \right)$
and tangentially,
 ${V_{{b_{{y_{i,j}}}}}}\left( {1 + {\rm{\;}}a_{i,j}^{'}} \right)$
, induced velocities are calculated at each blade section, considering the transformed velocity components,
 ${V_{{b_{{x_{i,j}}}}}}$
, and,
 ${V_{{b_{{y_{i,j}}}}}}$
, of the freestream wind velocity,
 $U$
(Fig. 4(a)). From these induced velocities, the effective wind speed,
 ${V_{eff}}$
, (Fig. 3) experienced by each blade section of all blades is calculated as
 \begin{align} {V_{ef{f_{i,j}}}} = \sqrt {{{\left( {{V_{{b_{{x_{i,j}}}}}}\left( {1 - {\rm{\;}}{a_{i,j}}{\rm{\;}}} \right)} \right)}^2} + {{\left( {{V_{{b_{{y_{i,j}}}}}}\left( {1 + a_{i,j}^{'}} \right)} \right)}^2}} . \end{align}
Later, using the effective wind speed, the sectional aerodynamic lift,
 $d{F_{{L_{a{e_x}}}}}$
, and drag,
 $d{F_{{D_{a{e_y}}}}}$
, forces are obtained by:
 \begin{align} d{F_{{L_{a{e_{{x_{i,j}}}}}}}} = \frac{1}{2}\rho {C_{{l_{i,j}}}}V_{ef{f_{i,j}}}^2{c_{i,j}}d{r_{i,j}}, \end{align}
 \begin{align} d{F_{{D_{a{e_{{y_{i,j}}}}}}}} = \frac{1}{2}\rho {C_{{d_{i,j}}}}V_{ef{f_{i,j}}}^2{c_{i,j}}d{r_{i,j}}, \end{align}
where
 $\rho $
is the air density,
 $Cl$
and
 $Cd$
are the aerodynamic lift and drag coefficients, whereas
 $c$
is the sectional chord length,
 $dr$
corresponds to the sectional radius. From the aerodynamic lift and drag forces, flapwise,
 $d{F_{{F_{{b_{{x_{i,j}}}}}}}}$
and edgewise,
 $d{F_{{E_{{b_{{y_{i,j}}}}}}}}$
forces in the blade-aligned coordinate system (Fig. 3) are obtained, respectively, as follows:
 \begin{align} d{F_{{F_{{b_{{x_{i,j}}}}}}}} = \left( {d{F_{{L_{a{e_{{x_{i,j}}}}}}}}cos{\varphi _{i,j}} + d{F_{{D_{a{e_{{x_{i,j}}}}}}}}sin{\varphi _{i,j}}} \right), \end{align}
 \begin{align} d{F_{{E_{{b_{{y_{i,j}}}}}}}} = d{F_{{L_{a{e_{{x_{i,j}}}}}}}}sin{\varphi _{i,j}} - d{F_{{D_{a{e_{{x_{i,j}}}}}}}}cos{\varphi _{i,j}}. \end{align}
All these edgewise and flapwise forces (Fig. 3) are later transformed to the hub-aligned coordinate system (Fig. 4) and then summed to calculate the turbine aerodynamics torque,
 ${\tau _{aero}}$
, and thrust force,
 $T$
, using
 \begin{align} {\tau _{aero}} = \mathop \sum \limits_i^{{B_n}} \mathop \sum \limits_j^S d{F_{{E_{{b_{{y_{i,j}}}}}}}}{r_{i,j}}cos{\phi _{i,j}}, \end{align}
 \begin{align} T = \mathop \sum \limits_i^{{B_n}} \mathop \sum \limits_j^S d{F_{{F_{{b_{{x_{i,j}}}}}}}}cos{\phi _{i,j}}, \end{align}
where
 ${B_n}$
represent the total blade number,
 $S$
is the total blade section numbers,
 $r$
denotes the local radius, and
 $\phi $
is the pre-cone angle [Reference Sahin and Yavrucuk11, Reference Sahin and Yavrucuk43, Reference Sahin44, Reference Sahin and Farsadi54]. Taking into account the rotor speed,
 $\Omega \;$
information, turbine power,
 $\;P$
is calculated as
 \begin{align} P = \Omega {\tau _{aero}}. \end{align}
Also, turbine power coefficient,
 $\;{C_p}$
, power available in wind,
 ${P_{wind}}$
, and turbine tip speed ratio (TSR),
 $\;\lambda $
, are obtained by
 \begin{align} {C_p} = \frac{P}{{{P_{wind}}}}, \end{align}
 \begin{align} {P_{wind}} = \frac{1}{2}\rho {(Ucos\theta cos\varPsi )^3}\pi {\left( {Rcos\varPhi } \right)^2}, \end{align}
 \begin{align} \lambda = \frac{{\varOmega R\cos \phi }}{{{U^*}cos\theta }}, \end{align}
respectively, where
 $\;$
U means the freestream/relative wind speed, while
 $\;\theta \;$
and
 $\varPsi $
are respectively the turbine nacelle tilt angle and yaw angle,
 $\;R$
symbolises the rotor radius [Reference Sahin44],
 ${U^*}$
is the hub-height wind speed.
Figure 4 shows some of the coordinate systems and angles used in the MS Bladed Model. Figure 4(a) illustrates the blade-aligned, azimuth-aligned, yaw-aligned, and wind-aligned coordinate systems, along with the pre-cone angle,
 $\varPhi $
, and yaw angle,
 $\varPsi $
, from a top view. Figure 4(b) shows the hub-aligned and yaw-aligned coordinate systems, along with the tilt angle,
 $\theta $
, from a side view.
For validation purposes, Fig. 5 shows the measured power output results of the NREL Phase II experimental turbine [Reference Schepers, Brand and Bruining72], the MS Bladed Model power output results and the numerical results of Ceyhan [Reference Ceyhan73]. It is clearly seen that the MS Bladed Model predicts turbine power output very close to the experimental test results. The difference between the prediction of the MS Bladed Model and that of Ceyhan at high wind speeds is caused using slightly different experimental aerofoil data [Reference Sahin44]. Note that detailed information on the MS Bladed Model, including its underlying theory and validation studies, can be found in Ref. [Reference Sahin, Yavrucuk, Diez and Icaza77].
Power prediction of the MS Bladed Model for the NREL Phase II experimental turbine [Reference Sahin and Yavrucuk11, Reference Sahin and Farsadi45, Reference Sahin, Yavrucuk, Diez and Icaza77].

In the final configuration, the NREL 5-MW reference turbine specifications are incorporated into the MS Bladed Model, and baseline controllers are designed accordingly. This turbine is a commonly cited reference turbine in the literature. With its three blades, it serves as a representation of the standard turbines deployed in contemporary wind farms. Figure 6 shows the NREL 5 MW blade geometry and aerofoils along with their chord and twist distributions throughout the blade span. The blade aerofoils used towards the blade tip are DU4017, DU35A17, DU30A17, DU25A17, DU21A17 and NACA64A17, respectively. As with other turbines, the blade root sections are circular in shape. Operating with variable-speed in Region 2 and variable pitch-to-feather strategy in Region 3, the NREL 5 MW turbine has a rated rotor speed of 12.1 rpm and has cut-in, rated, and cut-out wind speeds of 3 m/s, 11.4 m/s, and 25 m/s, respectively [Reference Jonkman, Butterfield, Musial and Scott42]. It includes a rotor with a radius of 63 meters and an inertia of 38,759,228 kg-m2 and a variable torque generator with an inertia of 534.116 kg-m2. Between these two components, a gearbox with a 97:1 ratio is used to run the turbine generator. Further details regarding this turbine can be found in Ref. [Reference Jonkman, Butterfield, Musial and Scott42].
NREL 5 MW turbine blade and its properties: (a) turbine blade and aerofoils (adapted from Ref. [Reference Joustra, Flipsen and Balkenende74]), (b) chord distribution [Reference Jonkman, Butterfield, Musial and Scott42] and (c) twist distribution [Reference Jonkman, Butterfield, Musial and Scott42].

Wind turbine operating regions.

2.2 Turbine operating regions and baseline controllers
In this subsection, the operating regions and control purposes of turbines are first discussed. Subsequently, the design of baseline generator torque and collective pitch controllers is presented for the NREL 5 MW turbine [Reference Jonkman, Butterfield, Musial and Scott42]. Variable speed variable pitch turbines, such as the NREL 5 MW turbine, have three major operating regions: Regions 1, 2 and 3, as shown in Fig. 7. Region 1, given in orange, corresponds to wind speeds below the cut-in wind speed,
 ${U_{cut - in}}$
, where the turbine does not generate any electricity due to very low wind speeds. Between the cut-in and cut-out,
 ${U_{cut - out}}$
wind speeds lie Regions 2 and 3, which are shown in yellow and green, respectively. Region 2 spans from the cut-in to the rated wind speed,
 ${U_{rated}}$
and focuses on maximising energy capture since wind speeds in this region are not sufficient to achieve rated power. Region 3 extends from the rated to cut-out wind speed and involves limiting the turbine’s output to its rated power to avoid excessive mechanical and electrical loads. In Region 2, the maximum possible power, i.e. partial power, is obtained from the turbine through the generator torque controller, while in Region 3, the rated power is acquired from the turbine by the collective blade pitch controller. These two controllers are the baseline or standard turbine controllers on turbines. Regions 2 and 3 are also known as the below-rated and above-rated regions, respectively. Based on the controller design, transitional regions may exist between Regions 1 and 2, and between Regions 2 and 3, referred to as Region 1.5 and Region 2.5, respectively. There is also an optional turbine operating region called Region 4, indicated in red in Fig. 7. This region includes wind speeds above the cut-out wind speed. Although turbines are typically shut down in this region due to severe loading conditions, modern utility-scale turbines can remain operational beyond the cut-out wind speed by using control techniques, such as ramp or stepwise shaping algorithms [Reference Oudah, Mohd and Hameed55–Reference Fischer and Shan61].
In this study, the baseline generator torque controller and collective blade pitch controllers utilise the rotor speed measurement for feedback, instead of the generator speed. In below-rated region, a typical generator torque controller is employed for maximising turbine power capture, while in above-rated region, a collective blade pitch controller is employed to satisfy the rated power. The torque controller changes the turbine rotor/generator speed by altering the generator control torque, i.e. electromagnetic torque, to ensure that the turbine works at its optimum TSR,
 ${\lambda _*}$
, and consequently at its maximum power coefficient,
 ${C_{pmax}}$
. This enables the turbine rotor to harness the utmost kinetic energy or the maximum achievable power from the available wind. Here, the following standard generator torque controller algorithm is used in Region 2 to compute the required generator control torque,
 ${\tau _c}$
, as the controller output [Reference Sahin and Yavrucuk11, Reference Sahin and Farsadi45, Reference Stol and Fingersh56–Reference Merabet, Thongam and Gu58]
 \begin{align} {\tau _c} = {K_c}{\Omega ^2}, \end{align}
where
 ${K_c}$
represents the torque controller gain, and
 $\Omega $
is the controller input and is the turbine rotor speed measurement in units of rad/s, as adopted in the MS Bladed Model. The controller gain,
 ${K_c}$
, is calculated as:
 \begin{align} {K_c} = \frac{1}{2}\rho \pi {\left( {R\;\textit{cos}\;\varPhi } \right)^5}\frac{{{C_{pmax}}\left( {{\lambda _*},{\beta _*}} \right)}}{{\lambda _*^3}}, \end{align}
where
 $\rho $
is the air density,
 $R$
stands for the rotor radius,
 $\varPhi $
means the rotor pre-cone angle and
 ${\beta _*}{\rm{\;}}$
denotes the turbine optimum blade pitch angle. Determining the optimum values for TSR and blade pitch angles, as well as the turbine
 ${C_{pmax}}$
involves generating the turbine
 ${C_p}$
surface. This surface is generated with the turbine model by rotating the turbine rotor at distinct rotor speeds and blade pitch angles at a constant wind speed. Here, following Ref. [Reference Jonkman, Butterfield, Musial and Scott42], the 5-MW turbine
 ${C_p}$
surface is obtained against 8 m/s wind speed. By investigating this surface, the 5-MW turbine optimal TSR is estimated to be 7.5, the optimum blade pitch angle is determined to be −0.875 degrees, and the
 ${C_{pmax}}$
is identified to be 0.4996. Figure 8 shows the
 ${C_p}$
surface contours obtained for the 5-MW turbine along with the turbine
 ${C_{pmax}}$
which corresponds to the turbine optimum TSR and blade pitch angle. Considering Refs [Reference Jonkman, Butterfield, Musial and Scott42, Reference Wright and Fingersh62], Region 1.5 and Region 2.5 torque controllers are also integrated into the torque control system. Here, the actuator dynamics are ignored, a 15000 Nm/s torque limiter is applied and the controller torque output is limited to 47,402.91 Nm. [Reference Sahin and Yavrucuk11, Reference Sahin44, Reference Sahin and Farsadi45]. Importantly, it should be highlighted that the torque controller output,
 ${\tau _c}$
in Equation (16) corresponds to the generator torque in the LSS shaft. Dividing this torque by the gearbox ratio,
 ${\rm{\;}}{N_{gear}}$
yields the generator torque in the HSS shaft.
 ${\rm{\;}}{C_p}$
surface contours of the NREL 5-MW turbine.

In Region 3, utilising the pitch-to-feather strategy, a proportional-integral (PI) collective blade pitch controller with a gain-scheduling property is designed to collectively control blade pitch angles and regulate the rotor speed to its rated speed. Proportional gain,
 ${K_p}$
, and integral gain,
 ${K_i}$
, of the blade pitch controller are calculated as follows:
 \begin{align} {K_p} = \frac{{ - 2{w_n}\xi - A}}{B}, \end{align}
 \begin{align} {K_i} = \frac{{ - w_n^2}}{B}, \end{align}
where
 ${w_n}$
denotes the desired natural frequency,
 $\;\xi $
stands for the desired damping ratio, while A represents the turbine system gain, and B signifies the control input gain [Reference Sahin and Yavrucuk11, Reference Sahin44, Reference Sahin and Farsadi45, Reference Sahin and Yavrucuk63, Reference Sahin, Yavrucuk, Diez and Icaza64]. Here,
 ${w_n}\;{\rm{and}}\;\xi $
are selected as 0.6 and 0.8, respectively, whereas A and B are calculated by:
 \begin{align} A = \frac{1}{{{J_t}}}\frac{{\partial {\tau _{aero}}}}{{\partial \varOmega }},\\ \notag \end{align}
 \begin{align} B = \frac{1}{{{J_t}}}\frac{{\partial {\tau _{aero}}}}{{\partial \beta }}, \end{align}
where
 $\frac{{\partial {\tau _{aero}}}}{{\partial \varOmega }}$
and
 $\frac{{\partial {\tau _{aero}}}}{{\partial \beta }}$
represent the variations in turbine rotor aerodynamic torque in relation to changes in rotor speed and blade pitch angles, respectively, while
 ${J_t}$
, as defined previously, is the total turbine inertia. The turbine system gain, A, and the control input gain, B, are obtained as −0.0554 and −0.2658, respectively [Reference Sahin44], through model linearisation at an equilibrium operating point of (
 ${U_e},{\varOmega _e}$
,
 ${\beta _e}$
) = (11.5 m/s, 12.1 rpm, 2.2792o), near the entrance of Region 2 to Region 3 [Reference Wright and Fingersh62].
Figure 9 illustrates the NREL 5 MW turbine rotor aerodynamic torque-blade pitch angle curves at distinct wind speeds; the red dashed curve indicates the rated torque. The crossing points of the red dashed line and the torque curves are the equilibrium operating points of the 5-MW turbine in Region 3. At these crossing points, the slopes of rotor aerodynamic torque increase as the wind speed or blade pitch angle increases. For this reason, the control input gain, B, considerably changes with varying pitch angles in Region 3, which reduces the performance of the pitch controller designed at an equilibrium point when operated throughout Region 3.
NREL 5-MW turbine rotor aerodynamic torque-blade pitch angle curves at distinct wind speeds.

Therefore, to obtain better performance from the pitch controller throughout Region 3, i.e. from rated to cut-out wind speed, the following gain correction factor,
 $GK(\beta)$
[Reference Jonkman, Butterfield, Musial and Scott42, Reference Wright and Fingersh62], is employed to schedule the proportional gain,
 ${K_p}$
, and integral gain,
 ${K_i}$
, of the blade pitch controller:
 \begin{align} GK(\beta) = \frac{1}{{\left( {1 + \frac{\beta }{{{\beta _K}}}} \right)}}, \end{align}
where
 $\beta $
is the required turbine blade pitch angle for achieving the rated torque at any wind speed within Region 3, while the turbine is working at its rated rotor speed. Conversely,
 ${\beta _K}$
is another blade pitch angle at another operating point in Region 3, where the turbine control input gain,
 $\;B$
obtained at an operating point near the entrance of Region 2 into Region 3 has increased in its value by two times [Reference Wright and Fingersh62]. The NREL 5-MW turbine is estimated to have a
 ${\beta _K}$
value of 5.9676 degrees utilising the MS Bladed Model [Reference Sahin44, Reference Sahin, Yavrucuk, Diez and Icaza64]. Accordingly, the blade pitch control algorithm is expressed by Equation (23)
 \begin{align} \beta \left( t \right) = K_p^{GS}\varDelta \varOmega \left( t \right) + K_i^{GS}\smallint \varDelta \varOmega \left( t \right)dt, \end{align}
where
 $K_p^{GS}$
and
 $K_i^{GS}$
are the gain-scheduled proportional, and integral gains are calculated by multiplying
 $\;{K_p}$
and
 ${K_i}$
respectively by
 $GK(\beta)$
. Here,
 $\varDelta \varOmega $
represents the rotor speed difference, i.e. rotor speed error between the reference value,
 ${\varOmega _{ref}}$
and its actual measurement,
 $\;\Omega $
, while
 $\beta $
is the pitch controller output.
Considering Refs [Reference Jonkman, Butterfield, Musial and Scott42, Reference Wright65], a first-order model is used to include the pitch actuator dynamics within the blade pitch control system, with a time constant of 0.2 s. The pitch controller output then turns out to be,
 ${\beta _{ref}}$
, whereas
 $\beta $
turns out to be the pitch actuator output or the blade pitch input for the turbine/simulation model. Generator torque output does not change in the above-rated region and is equal to its rated value. Furthermore, a rate limiter of 8 deg/s is used at the pitch controller output. The pitch angles are also saturated to limits of −0.875, and +90 degrees [Reference Sahin and Yavrucuk11, Reference Sahin44, Reference Sahin and Farsadi45, Reference Sahin, Yavrucuk, Diez and Icaza64]. The block diagram of these controllers (Equations (16) and (23)) are connected to the MS Bladed Model, which employs the NREL 5-MW turbine, is depicted in Fig. 10. Notably, the rotor speed measurement, Ω is fed back to the controllers, relying on this information, the controllers are dynamically switched between each other from Region 2 to Region 3 and vice versa.
Block diagram of the baseline turbine controllers integrated with the MS Bladed Model.

2.3 Simulation and verification of baseline controllers
In this subsection, the baseline turbine controllers are simulated and tested using the MS Bladed Model against 1 m/s step rising wind speeds of 8 to 9 m/s at the below-rated region, and 12 to 13 m/s at the above-rated region. To indicate that the controllers work satisfactorily, the obtained responses are also evaluated and verified with the formerly published responses generated using the NREL OpenFAST Model for the same NREL 5-MW turbine in Ref. [Reference Abbas, Wright and Pao66]. For comparison purposes, generator speed responses are acquired in units of rpm (revolutions per minute) instead of rad/s, which is adopted in the MS Bladed Model.
The simulation results of the generator torque and blade pitch controllers are shown on the left and right in Fig. 11, respectively. Simulations are generated for 55 s. Step rising wind speeds of 1 m/s are provided for the 5-MW turbine at 30 s of the simulations during operations at steady-state. Considering the torque control, the obtained transient and steady-state responses for the generator torque and speed obtained through the MS Bladed Model are similar to those obtained by the NREL OpenFAST Model. Furthermore, the aim to operate the turbine at its optimum TSR value is successfully achieved (Fig. 11(d)) at steady-state, and the turbine works at its maximum
 ${C_p}$
value (Fig. 11(e)). Note that in the previous subsection, the optimum values for the turbine TSR and blade pitch angle are obtained as 7.5 and 0.4996, respectively, just like the values in simulations at steady-state (Fig. 11(d) and (e)). Investigating the pitch controller simulations reveals that the steady-state values for the blade pitch angle and generator speed nearly resemble the responses of the FAST and OpenFAST models, respectively, attained by Jonkman et al. [Reference Jonkman, Butterfield, Musial and Scott42] and Abbas et al. [Reference Abbas, Wright and Pao66]. Some differences observed in transient responses may be caused by whether the rotor or generator speed is used as feedback to the pitch controller. Most importantly, in this study, the design purpose for the blade pitch controller is to obtain a slight overshoot and a rapid decay time in the rotor/generator speed response [Reference Wright and Fingersh62]. Adjusting the controller gains allows the generation of comparable responses to the OpenFAST model responses. As depicted in Fig. 11(h), reducing the proportional gain generates a very comparable rotor speed response to that of the OpenFAST model [Reference Sahin and Yavrucuk11]. Furthermore, as obtained in Ref. [Reference Abbas, Wright and Pao66], different rotor/generator speed responses can be obtained (Fig. 11(h)) for the same turbine. The simulations in Fig. 11 indicate that the baseline controller works successfully as targeted. This is because, at steady-state, the turbine operates at its optimum TSR and thereby at its
 ${C_{pmax}}$
in Region 2 through the torque control. The generator speed is regulated to its rated speed (Fig. 11(h)) in Region 3 by the blade pitch controller, which adjusts the pitch angles (Fig. 11(g)) collectively. Turbine efficiency is reduced (Fig. 11(j)) in Region 3 to obtain rated power (Fig. 11(i)).
Performance comparison of generator torque controller (left) and blade pitch controller (right): (a) wind speed input [Reference Sahin and Yavrucuk11, Reference Sahin and Farsadi45]; (b) HSS torques [Reference Sahin and Yavrucuk11, Reference Sahin and Farsadi45]; (c) generator speed [Reference Sahin and Yavrucuk11, Reference Sahin and Farsadi45]; (d) turbine TSR [Reference Sahin and Yavrucuk11]; (e) turbine
 $\boldsymbol{C}_{\boldsymbol{p}}$
[Reference Sahin and Yavrucuk11]; (f) wind speed input [Reference Sahin and Yavrucuk11, Reference Sahin and Farsadi45]; (g) blade pitch angle [Reference Sahin and Yavrucuk11, Reference Sahin and Farsadi45]; (h) generator speed [Reference Sahin and Yavrucuk11, Reference Sahin and Farsadi45]; (i) rotor power; and (j) turbine
 $\boldsymbol{C}_{\boldsymbol{p}}$
[Reference Sahin and Yavrucuk11].

According to the simulations, the generator torque controller operation might be defined as follows: first of all, the blade pitch angle is saturated to the optimum value at the below-rated region. Thus, during turbine operation at an equilibrium operating point in Region 2 if a step rising wind speed (Fig. 11(a)) is applied to the 5-MW turbine, the turbine rotor aerodynamic torque (Fig. 11(b)) increases, and the rotor/generator speed (Fig. 11(c)) starts increasing. Based on the rotor/generator speed, the controller increases the generator control torque, i.e. the generator electromagnetic torque (Fig. 11(b)). The increase in generator torque continues up until a new steady-state operation at another equilibrium operating point, where the aerodynamic torque becomes equal to the generator torque (Fig. 11(b)) and the rotor/generator speed reaches its steady-state (Fig. 11(c)).
When the rotor/generator speed reaches steady-state, rotor/generator acceleration becomes zero (Fig. 11(c)) and the turbine works at its optimum TSR (Fig. 11(d)), thereby achieving its maximum
 ${C_p}$
(Fig. 11(e)). At the maximum
 ${C_p}$
, the turbine rotor extracts the highest possible power from the available wind [Reference Sahin and Yavrucuk11, Reference Sahin44, Reference Sahin and Farsadi45, Reference Sahin, Yavrucuk, Diez and Icaza64]. In Region 2, the opposite scenario is also valid when a step decreasing wind speed is given to the turbine. Theoretical insights on how the torque controller works can be found in Refs [Reference Johnson, Pao, Balas and Fingersh57, Reference Pao and Johnson67].
The blade pitch controller operation, on the other hand, may also be defined as follows. During a steady-state turbine operation at an operating point in Region 3, when a step rising wind input is given to the turbine (Fig. 11(f)), the rotor aerodynamic torque increases, as the generator torque is equal to rated torque in this region, there occurs an imbalance between the two counter-acting torques, (Fig. 2), i.e. rotor aerodynamic and generator torques. Then, the turbine rotor/generator speed starts accelerating (Fig. 11(h)). Consequently, the rotor/generator speed measurement starts deviating from the rated rotor speed reference, which is the fixed input for the pitch controller (Fig. 10). This results in a rotor speed error, based on which the pitch controller adjusts proportional and integral gains considering the gain correction factor and collectively increases the pitch angles of all turbine blades (Fig. 11(g)). This action modifies the turbine rotor aerodynamic torque to adjust the rotor speed to its rated reference speed of 12.1 rpm, which corresponds to a generator speed of 1173.7 rpm (Fig. 11(h)). Note that the turbine
 ${C_p}$
is lower than its
 ${C_{pmax}}$
value (Fig. 11(j)) since the goal in Region 3 is to adjust turbine power output to the rated power (Fig. 11(i)) through reducing turbine efficiency or power capture, unlike the purpose in Region 2.
2.4 Ice accumulation modeling on 5-MW turbine blades and its effects on turbine efficiency
In the previous sections, baseline turbine controllers are defined and their simulations are realised for validation. In this section, ice accumulation modeling for the NREL 5-MW turbine blades and blade ice accumulation effects on turbine efficiency are discussed. Ice accumulation on turbine structures is commonly seen in winter months and at high altitudes in cold regions. Turbine blade surfaces are susceptible to ice formation, which occurs instantly or after a delay when super-cooled water droplets strike the turbine blades [Reference Jin and Virk23, Reference Pouryoussefi, Mirzaei, Nazemi, Fouladi and Doostmahmoudi68]. Ice accumulates on turbine blade surfaces, predominantly at their leading edges [Reference Hu, Zhu, Chen, Shen and Du13, Reference Jin and Virk23, Reference Lamraoui, Fortin, Benoit, Perron and Masson25], and manifests in glaze, rime, or mixed ice types [Reference Han, Palacios and Schmitz12, Reference Hu, Zhu, Chen, Shen and Du13, Reference Yirtici, Sevine, Ozgen and Tuncer26]. Using experimental as well as computational methods, in Ref. [Reference Brandrud and Krøgenes2], a comprehensive study was conducted on the NREL S826 turbine blade aerofoil to investigate these ice formations. Different ice shapes are generated by the LEWICE code and are produced artificially. Wind tunnel experiments were conducted with the S826 aerofoil with the artificial ice geometries fixed to its leading edge. Test results indicated that aerofoil aerodynamics is varied across all types of ice: there is a decline in lift and a rise in drag, as declared before.
For instance, Fig. 12 depicts ice accumulation predictions on the S826 blade aerofoil under the condition of glaze ice as well as its corresponding impacts on the experimental lift, Cl and drag, Cd coefficients. As seen in Fig. 12(a) and (b), ice primarily accumulates on the S826 aerofoil leading edge, leading to a reduction in the aerofoil’s lift coefficient and a rise in the drag coefficient. Therefore, a reduction is seen in the lift curve slope in the linear part, while a simple upward shift occurs in the drag curve due to ice accumulation in Fig. 12(b), in which
 $C{l_c}$
and
 $C{d_c}$
represent the aerofoil data for the clean blades,
 $C{l_i}$
and
 $C{d_i}$
stand for the data for the iced blades. To obtain such an ice accumulation on the S826 aerofoil, the requirements are available in Refs [Reference Brandrud and Krøgenes2, Reference Sahin and Farsadi45, Reference Sahin and Farsadi54].
Ice accumulation on the NREL S826 aerofoil and impacts on its aerodynamics, (a) glaze icing and (b) experimental Cl and Cd data with clean and iced blades [Reference Brandrud and Krøgenes2, Reference Sahin and Yavrucuk10, Reference Sahin and Farsadi45, Reference Sahin and Farsadi54].

Here, the NREL 5-MW turbine blades’ leading edges, i.e. all blade sections, are presumed to be exposed to such an ice accumulation, i.e. glaze icing in Fig. 12, which linearly increases toward the blade tip [Reference Shu, Liang, Hu, Jiang, Ren and Qiu3], and remains stationary, and is firmly adhered to the blades’ surfaces. Ice accumulation is modeled considering icing characteristics and its consequences on blade mass and aerodynamics. Namely, ice does not evenly accumulate along the blades and increases towards the blade tips [Reference Shu, Liang, Hu, Jiang, Ren and Qiu3, Reference Hu, Zhu, Chen, Shen and Du13, Reference Homola, Virk, Nicklasson and Sundsbø41, Reference Alsabagh69]. It causes increasing alterations in blade aerodynamic performance, manifesting as reduced lift coefficient and increased drag coefficient for blade aerofoils along with augmented blade mass, i.e. the rotor inertia. To integrate these variations in rotor blades, the authentic aerodynamic data of each turbine blade aerofoil are modified by reducing the lift coefficient and increasing the drag coefficient, with more pronounced variations closer to the blade tips, accompanied by an increase in rotor inertia due to accumulated ice mass on the blades. Note that in Fig. 13, the authentic data (
 $C{l_c}$
,
 $C{d_c}$
) for the turbine aerofoils consist of corrected experimental data for rotational stall delay and extrapolated aerodynamic data [Reference Jonkman, Butterfield, Musial and Scott42]. For icing modeling (
 $C{l_i}$
,
 $C{d_i}$
), the authentic data at each section are modified based on their radial distances from the blade root. The farther an aerofoil is from the root, the greater the modifications applied to its authentic data [Reference Sahin and Farsadi45, Reference Sahin and Farsadi54].
Blade ice accumulation on the NREL 5-MW turbine (Left) and its impacts on blade/aerofoil aerodynamic coefficients (Right) (a) DU40A17@4th section [Reference Sahin and Yavrucuk11, Reference Sahin and Farsadi45, Reference Sahin and Farsadi54], (b) DU21A17@10th section and (c) NACA64A17@16th section [Reference Sahin and Farsadi45, Reference Sahin and Farsadi54].

The consequences are slighter and greater adjustments respectively in authentic aerodynamic data of aerofoils positioned nearer the blade root and tip (Fig. 13(a), (b), and (c)) and a slight increase in rotor inertia. A very slight accumulation of ice is assumed on the blades, ignoring their circular root connection sections. Consequently, the adjusted aerodynamic data are ensured to maintain a relatively close resemblance to the authentic data, encompassing those pertaining to the final blade tip section. Accounting for a linear ice accumulation [Reference Shu, Liang, Hu, Jiang, Ren and Qiu3] increasing from the root toward the tip of the blade, adjustments to Cl data show a decrease ranging from 1.76 to 9.27%, while Cd data exhibit an increase ranging from 7.84 to 48% at a 12-degree angle-of-attack [Reference Sahin and Farsadi45, Reference Sahin and Farsadi54]. Consequently, except for the circular root sections, all the 5-MW turbine aerofoils’ aerodynamic data [Reference Jonkman, Butterfield, Musial and Scott42] are modified and incorporated into the MS Bladed Model. The rotor inertia is augmented by 3% to investigate the performance effectiveness of the baseline controllers on the iced-bladed NREL 5-MW turbine. For instance, Ref. [Reference Sahin and Farsadi45], another study performed by the author of this paper as the corresponding author uses the same ice accumulation scenario to thoughtfully investigate icing impacts on the performance and behaviour of the NREL 5-MW turbine under uniform and turbulent wind speeds. Thus, the same ice accumulation condition is also adopted here to assess how baseline turbine controllers perform in response to blade ice accumulation.
Figure 13 shows the NREL 5-MW turbine with ice-accumulated blades (left), adapted from Ref. [Reference Liu, Xiao and Incecik70] alongside the aerodynamic data of some example aerofoils (right) with clean (authentic,
 $C{l_c},C{d_c}$
) and iced (modified,
 $\;C{l_i},C{d_i})$
conditions. The example aerofoils are DU40A17, DU21A17 and NACA64A17 and are radially positioned as 11.75, 36.35 and 58.9 meters on the blades at the 4, 10 and 16th blade sections, respectively [Reference Jonkman, Butterfield, Musial and Scott42]. These sections are denoted by a, b and c letters in Fig. 13, respectively. Notably, due to the considered slight ice accumulation increasing toward the blade tip, the DU40A17 aerofoil located near the root shows negligible changes in aerodynamic Cl and Cd data, whereas NACA64A17 aerofoil, located close to the blade tip, exhibits more substantial variations in its aerodynamic data. Across all aerofoils of the turbine, lift coefficient is decreased, drag coefficient is augmented until an angle-of-attack of typically 50 degrees, where lift and drag curves intersect as in the authentic data. Note that icing changes the shape of aerofoils and different aerofoils have different aerodynamic data mainly between −25 and 90-degrees angle-of-attacks. Thus, for each aerofoil, the changes in their data are made in this interval [Reference Sahin and Farsadi45, Reference Sahin and Farsadi54].
In Subsection 2.2, the NREL 5-MW turbine optimum blade pitch angle, optimum TSR and maximum
 ${C_p}$
values are obtained as −0.875o, 7.5, and 0.4996, respectively, and are used for the generator torque controller design [Reference Sahin and Yavrucuk11, Reference Sahin44, Reference Sahin and Farsadi45, Reference Sahin, Yavrucuk, Diez and Icaza64]. Namely, the maximum
 ${C_p}$
and optimum TSR are used to calculate the torque controller gain,
 ${K_c}$
in Equation (17). The optimum blade pitch angle, on the other hand, is used as a lower saturation limit for the blade pitch controller output. Due to the considered slight blade ice accumulation (Fig. 13), the turbine
 ${C_p}$
surface is expected to be varied since the shape of the blades and their aerodynamics have changed. Thus, the NREL 5-MW turbine is re-operated with iced blades at different pitch angles and various rotor speeds at the same uniform wind speed of 8 m/s, and the turbine
 ${C_p}$
surface is re-obtained.
Figure 14 depicts the
 ${C_p}$
surface contours of the turbine with the considered iced blades. As seen in Fig. 14, even a slight accumulation of ice on the blades causes a dramatic change in the NREL 5-MW turbine
 ${C_p}$
surface. When the
 ${C_p}$
surface contours with iced blades are investigated, it is seen that the efficiency/aerodynamic performance of the NREL 5 turbine rotor reduces at high TSR values and is lost beyond the TSR value of approximately 13. The reduction in turbine efficiency or
 ${C_p}$
gets larger at higher TSR values than at lower TSR values. More importantly, the optimum TSR, optimum blade pitch angle, including the turbine
 ${C_{pmax}}$
, have changed. All these findings can be obtained by comparing the 5 MW turbine
 ${C_p}$
surfaces in Figs 8 and 14 for clean and iced blades. Due to slight blade ice accumulation, turbine optimum TSR value drops to 7.375, the optimum blade pitch angle increases to −0.3750, while the
 ${C_{pmax}}$
reduces to 0.4333, which corresponds to a decrease of 13.72% in turbine efficiency compared to the
 ${C_{pmax}}$
of 0.4996 for the clean blades. Table 1 shows the variations in these variables.
 ${C_p}$
surface contours of the NREL 5-MW turbine with ice accumulated blades.

Optimum operating points for the NREL 5-MW turbine

3.0 Results and discussions
This section investigates the transient and steady-state performance of baseline controllers through simulations under step rising wind speeds of 8 to 9, 12 to 13, 16 to 17 and 20 to 21 m/s. Similar to the simulations in Fig. 11, simulations are generated for 55 s, and 1 m/s step-rising wind speeds are applied at 30 s of the simulations. For the performance assessment of controllers, the rotor speed response is taken into account. Other parameters such as turbine controllers’ parameters/gains, blade pitch angle, rotor power, thrust force, torques in LSS and HSS shafts, etc., are also presented to demonstrate the variations in these parameters against step rising wind speeds with clean and iced blade cases. Both LSS and HSS torques, as well as rotor (LSS) and generator (HSS) speeds are particularly given separately in simulations because future researchers might desire to see one of these results for validation or comparison purposes. Furthermore, to indicate the accuracy of the current study, for clean and iced blade conditions, the steady-state simulation results of some turbine parameters at wind speeds of 9, 13, 17 and 21 m/s are also compared with recently published results in the literature.
3.1. Generator torque controller performance against rotor blade ice accumulation
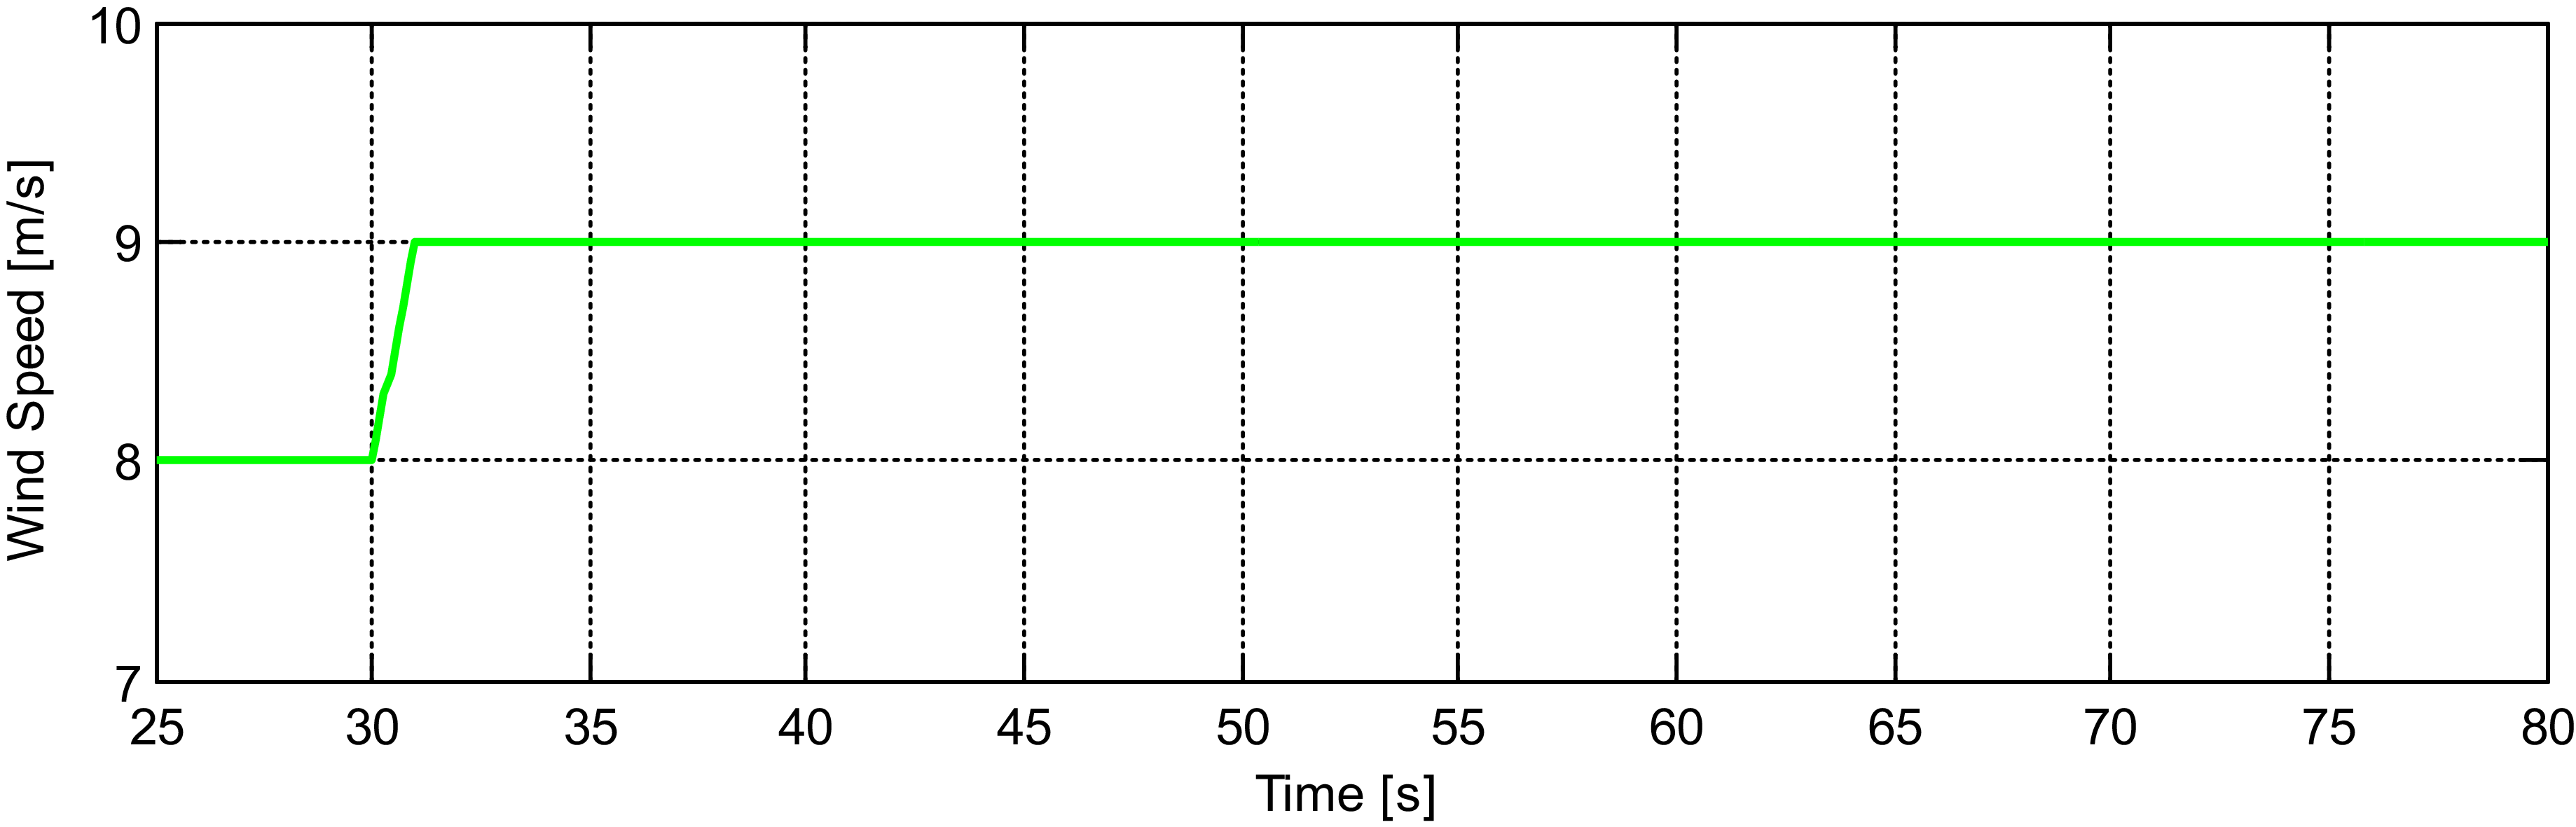
In this subsection, the performance effectiveness of the generator torque controller is examined through simulation against the considered slight ice accumulation on rotor blades. The step rising wind speed (Fig. 15), which increases from 8 to 9 m/s at 30 s of the simulation, is applied to the turbine with clean and iced blade cases. To observe the effects of blade ice accumulations on the torque controller, the simulation results are obtained for both cases and are given in Fig. 16. Under such an applied step rising wind speed (Fig. 15), it is seen that even slight ice accumulation on turbine blades (Fig. 13) changes both the transient as well as the steady-state performance of the torque controller. This can be understood from the rotor speed or generator speed response (Fig. 16(d) or (f)). There occurs a slight variation in rotor speed transient response, and a noticeable difference at steady-state (Fig. 16(d)) due to the considered blade ice accumulation. To estimate the variation in transient performance and the steady-state error, the rotor speed response for the iced blade is just shifted up for ease of comparison with that of the response belonging to the clean blades. This shifted response corresponds to the dashed rotor speed response in Fig. 16(d). Therefore, it is found that for the iced blades, the rotor speed response reaches the steady-state in a slightly longer time, around 2 s and a 1.86% steady-state error occurs between the rotor speed responses for cases with clean and iced (shifted) blades. It is significant to note that the steady-state error in rotor speed response is calculated with respect to the shifted rotor speed curve, i.e. the dashed steady-state line. The new steady-state equilibrium point after the applied step rising wind corresponds to (
 ${U_e},{\varOmega _e},{\beta _e},$
) = (9 m/s, 10.23 rpm, −0.875o) for clean blades and (
 ${U_e},{\varOmega _e},{\beta _e},$
) = (9 m/s, 9.744 rpm, −0.875o) for iced blades. The rotor speeds of 10.23 rpm and 9.744 rpm correspond to the generator speeds of 992.31 rpm and 945.168 rpm, respectively (Fig. 16(d) and (f)).
Step rising wind speed of 8 to 9 m/s.

Performance of generator torque controller under 1 m/s step rising wind speed of 8 to 9 m/s: (a) controller gain, (b) blade pitch angle, (c) LSS torques, (d) rotor speed, (e) HSS torques, (f) generator speed, (g) turbine TSR, (h) turbine
 ${{\rm{C}}_{\rm{p}}}$
, (i) rotor power and (j) thrust force.

The slight variation in rotor speed transient response mainly occurs from a 3% increase in rotor inertia owing to the increase in blade mass caused by ice accumulation. The steady-state performance of the torque controller reduces because the rotor aerodynamic performance or efficiency reduces with blade ice accumulation, changing the turbine
 ${C_p}$
surface (Figs 8 and 14). However, the torque controller uses the same controller gain,
 $\;{K_c}$
even for the iced blades (Fig. 16(a)), which is calculated using the optimum TSR and
 ${C_{pmax}}$
for the clean-bladed turbine. Under such a blade icing condition, the blade pitch angle is still saturated to its optimum/fine pitch angle value of −0.875 (Fig. 16(b)) for both cases, i.e. clean and iced blades. Due to the considered slight ice accumulation, the available torque controller with a fixed gain of
 ${K_c}$
is adversely affected, and thereby both the transient and steady-state performance of the torque controller is reduced. As there occurs a deviation or steady-state error in the rotor speed response, the turbine operates at a lower rotor speed, 9.744 rpm instead of 10.23 rpm at steady-state. Thus, the variation in rotor aerodynamics and inertia affects the turbine controller behaviour, particularly at steady-state operation. Because of variations in controller performance and turbine aerodynamics, all other variables of the turbine, such as the turbine rotor power, pitch angle, thrust force, turbine
 ${C_p}$
, etc. are also affected, consequently.
As defined previously, when the wind speed increases by a step input (Fig. 15), it directly increases the aerodynamic torque of the turbine rotor (Fig. 16(c)), then the turbine rotor speed starts increasing (Fig. 16(d)). When the rotor speed increases, the generator torque quantity is increased (Fig. 16(c) and (e)) by the torque controller according to the increasing rotor speed/generator speed.
Because blade ice accumulation increases the rotor mass and decreases the rotor aerodynamic efficiency, against the same step rising wind input (Fig. 15), the turbine rotor rotates at a slower speed both in transient and steady-state operations. Since the turbine rotor operates at lower speeds, the torque controller produces a lower amount of generator torque output which is compensated by a lower amount of aerodynamic torque, unlike the case with clean blades (Fig. 16(c) and (e)). The controller produces a lower amount of generator torque because the controller gain,
 ${K_c}$
(Equation (17)) is fixed and designed for clean blades. Because the rotor runs at lower speed values in time, the turbine TSR is also decreased with iced blades (Fig. 16(g)) under the same step rising wind input. The turbine
 ${C_p}$
reduces with blade ice accumulation as well (Fig. 16(h)). All these variations also result in reduced power output (Fig. 16(i)) and thrust force (Fig. 16(j)) in Region 2. Note also that the generator speed response (Fig. 16(f)) has the same trend as the rotor speed response (Fig. 16(d)) and is simply 97 times greater than the rotor speed response since they are connected through a gearbox with a gear ratio of 97:1. As declared above, the reduction in rotor speed response, i.e. the steady-state error is 1.86%. Also, at steady-state, a reduction of 9.28% occurs in aerodynamic rotor torque, 7.6% in thrust force, 4.76% in TSR, 13.6% in
 ${C_p}$
and 13.6% in power output. The changes in all these parameters are given in Fig. 16.
3.2 Blade pitch controller performance against rotor blade ice accumulation
In this subsection, the performance effectiveness of the gain scheduled PI-based collective blade pitch controller is examined through simulations against the considered slight blade ice accumulation. Like in the generator torque controller simulations, simulation results for the blade pitch controller are generated for clean and iced blade cases. The controller effectiveness is investigated against step rising wind speeds in terms of transient and steady-state performance. Similarly, the rotor speed response is taken into account for the controller performance evaluation. The variations in other parameters such as turbine controllers’ parameters/gains, blade pitch angle, rotor and generator speeds, torques in LSS and HSS shafts, rotor power, thrust force, etc., are also presented. It is experienced that due to such slight blade ice accumulation, the blade pitch controller’s transient performance alters depending on the wind speed, but the steady-state performance is still maintained with iced blades at all wind speeds in Region 3. The pitch controller’s transient performance is observed to decrease at low wind speeds, particularly near the rated wind speed. Nevertheless, the controller’s transient performance recovers above a wind speed in Region 3, and the controller continues to perform satisfactorily up to the 25 m/s cut-out wind speed. This implies that the pitch controller begins to behave almost as desired above a certain wind speed. The value of this wind speed is expected to depend on the amount of ice accumulated on the blades. Thus, the more ice accumulates on the blades, the higher this wind speed becomes.
In current simulations, against the considered blade ice accumulation, the blade pitch controller is seen to start performing well above the wind speed of 16 m/s. Note that this threshold wind speed is determined based on whether an overshoot is available or not in the rotor speed response against that of the clean blades. Above this wind value, no overshoot, even a slight one, is observed in rotor speed response with iced blades. Thus, in this paper, three different simulations are presented as examples to evaluate/show the blade pitch controller’s effectiveness at the above rated region. Simulations are conducted under three different step rising wind speeds of 12 to 13 m/s, near the rated wind speed, 16 m/s to 17 m/s, and 20 to 21 m/s at high wind speeds. For clarity purposes, only the simulation results for the step rising wind from 12 to 13 m/s are presented in this sub-section. The other two simulation results are presented in the Appendices section. Here, the pitch controller transient performance is evaluated in terms of decay time and maximum overshoot value of rotor speed response. It is explored that a larger decay time and maximum overshoot occur in rotor speed transient responses at low wind speeds in Region 3, particularly near the rated wind speed, yet a closer decay time with no overshoot in rotor speed responses above 16 m/s wind speed. At high wind speeds, under the step rising wind speed of 20 to 21 m/s, it is observed that the 5-MW turbine with clean and iced blades produces quite similar rotor speed responses.
When investigated thoughtfully, it is explored that the turbine rotor characteristics are varied because of ice accumulation on rotor blades, and, consequently, the controller behaves differently with and without iced blades. This means that along with the change in
 ${C_p}$
surface (Fig. 14), ice accumulation has changed the turbine system gain, A (Equation (20)), and the control input gain, B (Equation (21)), at different operating points. For instance, Fig. 17 may give an idea of how the control input gain, B, varied due to the considered blade ice accumulation. In Fig. 17, the rotor aerodynamic torque-blade pitch angle curves are obtained for the 5-MW turbine with the MS Bladed Model for clean and iced blade cases at various wind speeds. Due to blade ice accumulation, the rotor aerodynamic torque-blade pitch angle curves are just shifted down. As seen in Fig. 17, the reduction in rotor aerodynamic torque increases with the blade pitch angle reduction and the increase in wind speed. When we check the torque slopes, i.e.
 $\frac{{\partial {\tau _{aero}}}}{{\partial \beta }}$
at different equilibrium operating points, i.e. the crossing points of rated torque (red dashed line) with torque curves, it can be seen that blade ice accumulation causes reductions in the torque slopes at these operating points. These reductions in torque slopes get larger when the blade pitch angle decreases.
NREL 5-MW turbine rotor aerodynamic torque-blade pitch angle curves at distinct wind speeds with clean (black) and iced (cyan) blades.

The changes in rotor aerodynamic torque slopes and the increase in rotor inertia vary the control input gain, B. Similarly, the system gain, A, also changes because of blade ice accumulation. Note also that at equilibrium or steady-state operations in Fig. 17, to operate the turbine at the rated torque, under the same wind inputs, the iced-bladed 5-MW turbine must be operated with lower blade pitch settings than the clean-bladed 5-MW turbine. For this reason, in the simulations with iced blades presented in the following sections, the pitch controller sets the blade pitch angles to lower pitch values.
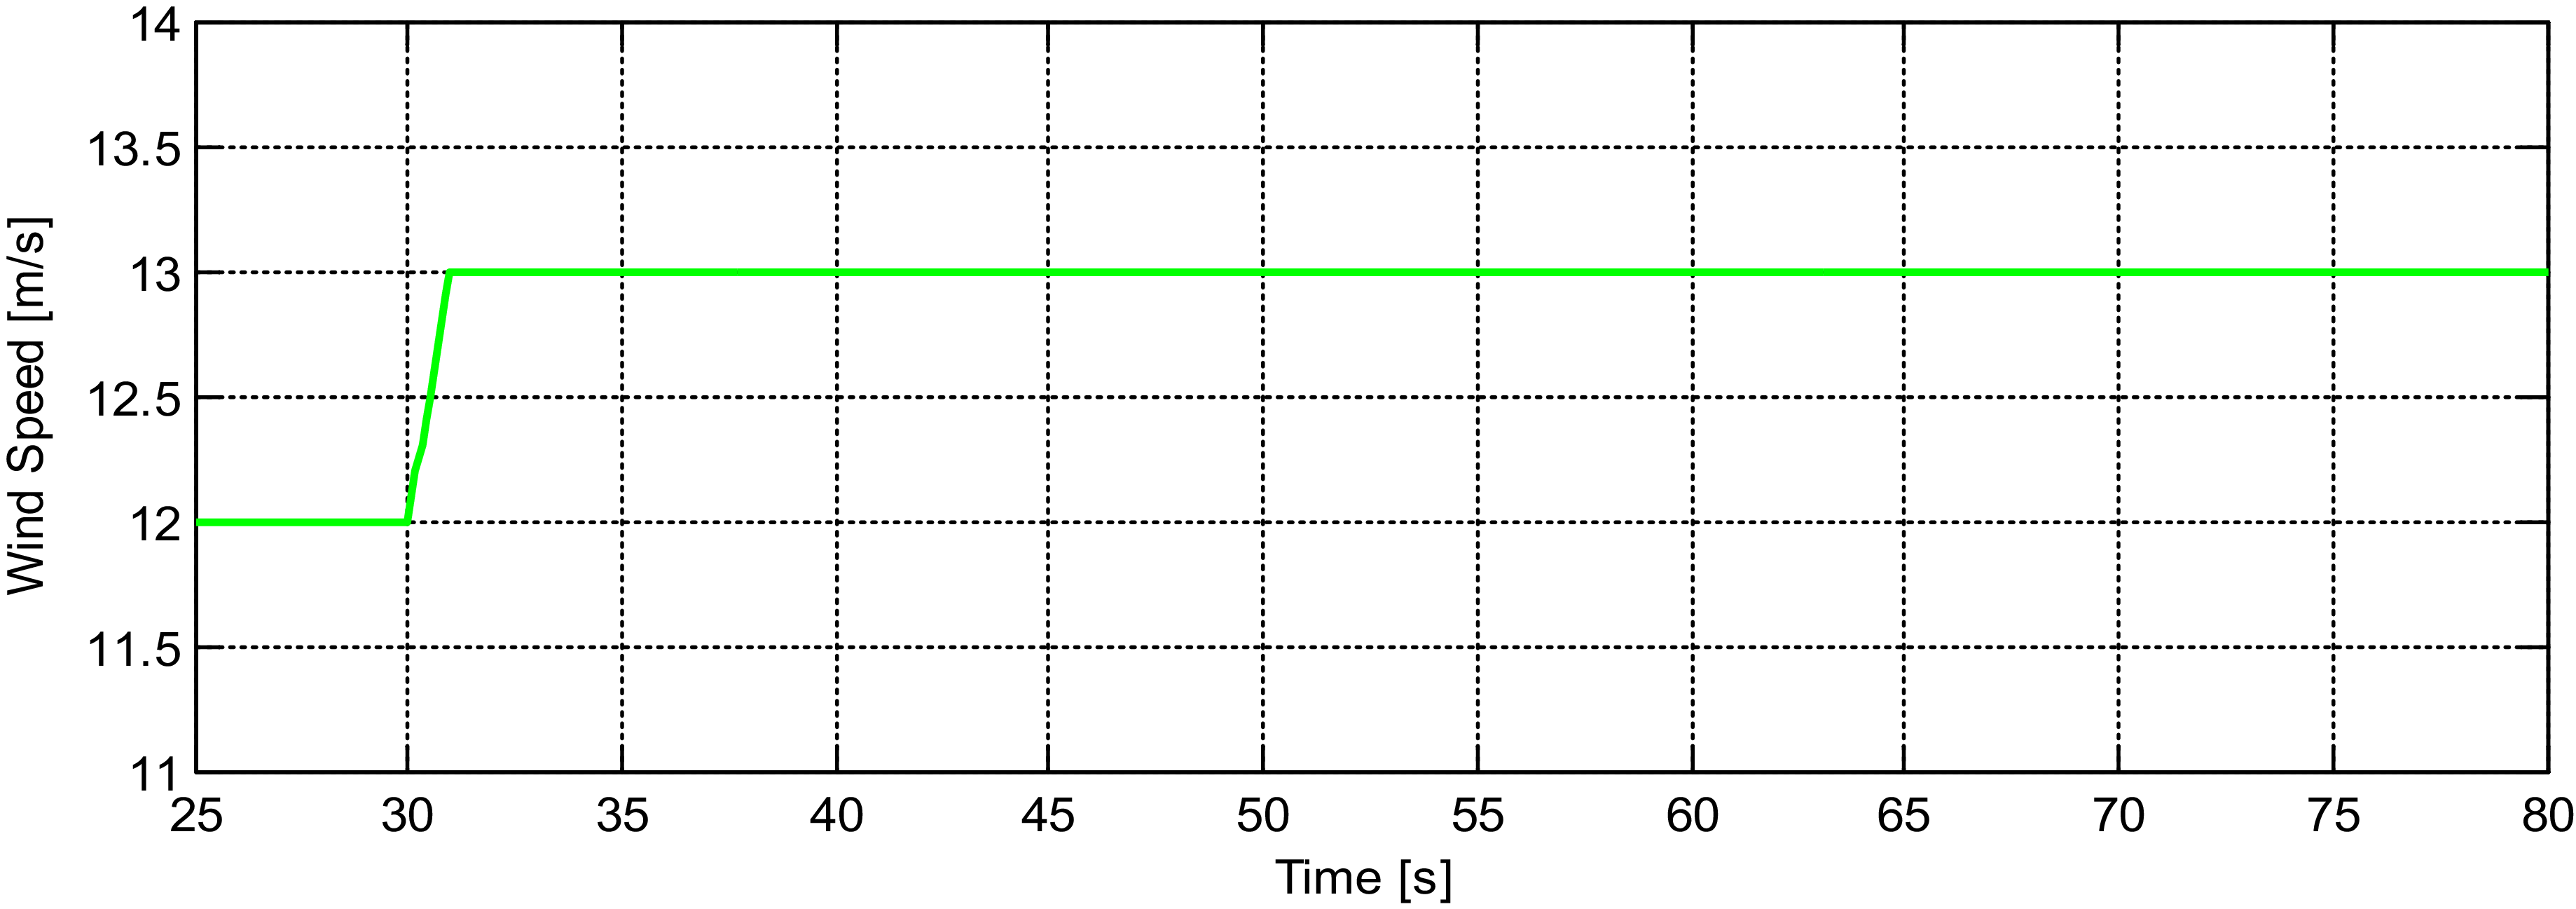
Next, the performance effectiveness of the collective blade pitch controller is explored under step rising wind speed of 12 to 13 m/s (Fig. 18), namely, near the rated wind speed within Region 3.
Step rising wind speed of 12 to 13 m/s.

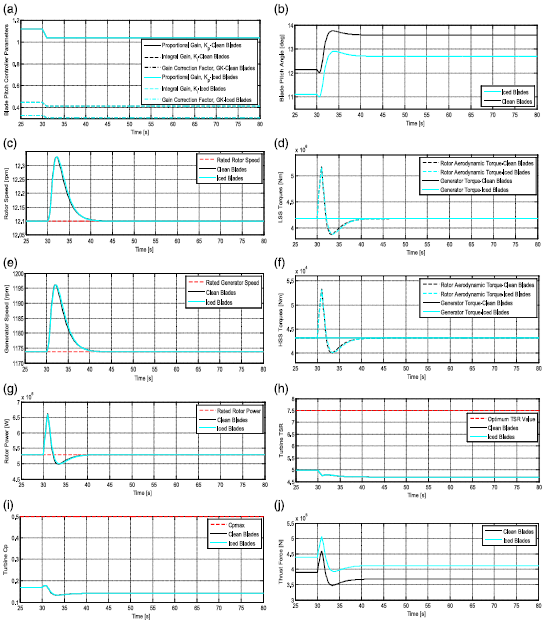
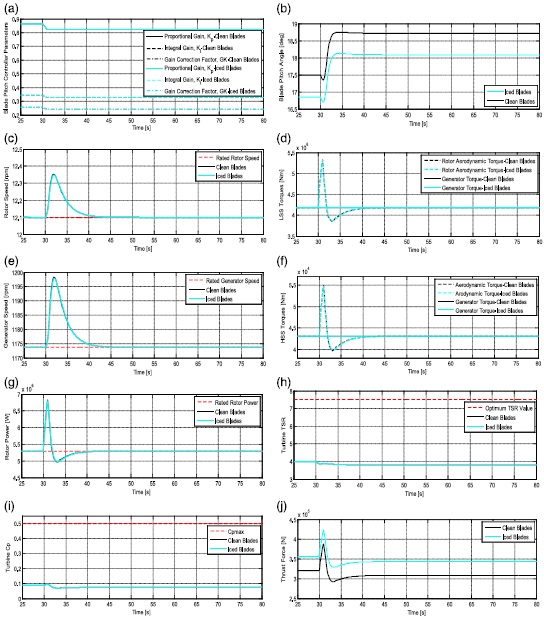
Performance of the blade pitch controller under 1 m/s step rising wind speed of 12 to 13 m/s, (a) controller parameters, (b) blade pitch angle, (c) rotor speed, (d) LSS torques, (e) generator speed, (f) HSS torques, (g) rotor power, (h) turbine TSR, (i) turbine
 ${{\rm{C}}_{\rm{p}}}$
and (j) thrust force.

Against such an increasing wind speed (Fig. 18) and the slight ice accumulation on blades (Fig. 13), it is seen that the pitch controller transient performance deteriorates while the steady-state performance of the pitch controller is still maintained. All simulations are depicted in Fig. 19. As explained before, when the step rising wind speed (Fig. 18) is applied to the controlled turbine during a steady-state operation, the balance between the rotor aerodynamic and generator torques is lost (Fig. 19(d) or (f)). This is because the rotor aerodynamic torque starts increasing, and consequently, the rotor/generator speed starts increasing (Fig. 19(c) and (e)) as the generator output torque is fixed to its rated torque in Region 3. As the increasing rotor speed raises the rotor speed error (Fig. 10), the blade pitch controller adjusts its proportional and integral gains based on this error, considering the gain correction factor (Fig. 19(a)). This, in turn, collectively adjusts the turbine blade pitch angles to a new pitch setting (Fig. 19(b)) to generate the rated torque at a steady-state (Fig. 19(d) or (f)). Note that against the step rising wind speed of 12 to 13 m/s, the clean and iced-bladed turbines have different transient rotor speed responses (Fig. 19(c)). With the iced blades, the rotor speed reaches the steady-state value, i.e. 12.1 rpm, 5.2 s later than the case with clean blades. It also overshoots the steady-state value at 38.8 s of the simulation. In both cases, the rotor speed response eventually reaches the same steady-state value. This means that there is no steady-state error in the rotor speed response for clean and iced blade cases. The difference in transient rotor speed responses and accumulated ice on the blades has also affected all the transient responses of other turbine variables such as rotor aerodynamic torque (Fig. 19(d) or (f)), rotor power (Fig. 19(g)), turbine TSR (Fig. 19(h)) and
 ${C_p}$
(Fig. 19(i)). However, at steady-state, these turbine parameters reach the same values for both cases except the blade pitch angle and thrust force, which exhibit the main differences. Despite slight changes in transient response, these two parameters reach different steady-state values with clean and iced blades. The blade pitch angles are reduced (Fig. 19(b)) by 23.06%, while the thrust force is increased (Fig. 19(j)) by 13.6% at the steady-state. All these differences mainly occur due to the changes in blade aerodynamics, mass and thereby the variations in turbine rotor characteristics such as the system gain, A, (Equation (20)) and control input gain, B (Equation (21)). One other important parameter, not mentioned previously and not used for controller design, but important is the disturbance input gain,
 ${B_d}$
. It is the variation in turbine rotor aerodynamic torque in relation to changes in wind speed input,
 $\partial {\tau _{aero}}/\partial U$
over the total turbine inertia,
 ${J_t}$
. Thus, the impacts of blade ice accumulation on turbine rotor characteristics are examined at steady-state operation. The turbine system, control input, and disturbance input gains of the 5-MW turbine are obtained through model linearisation for clean and iced blade conditions. Table 2 shows the variations in these turbine gains because of blade ice accumulation when the turbine operates at the operating points of (
 ${U_e},{\varOmega _e},{\beta _e},$
) = (13 m/s, 12.1 rpm, 6.7206o) with clean blades, and (
 ${U_e},{\varOmega _e},{\beta _e},$
) = (13 m/s, 12.1 rpm, 5.1637o) with iced blades, and produces the same rated torques.
Variations in the NREL 5-MW turbine parameters at 13 m/s wind speed

Because of blade ice accumulation, the turbine system gain, A, is increased by 2.89% in magnitude. The control input gain, B, on the other hand, is decreased by 14.68% in magnitude. The disturbance input gain,
 ${B_d}$
is slightly reduced by 2.19%. Since the controller gains,
 ${K_i}$
and
 ${K_p}$
, (Fig. 19(a)) as well as the desired natural frequency,
 ${w_n}$
, and the damping ratio,
 $\;\xi $
, are the same for clean and iced blades, the rotor speed response differs in both cases. This is because the turbine characteristics such as turbine system gain and control input gain have varied due to blade ice accumulation.
The simulation results for the step rising wind speeds of 16 to 17 and 20 to 21 m/s are respectively given in Figs A1 and A2 in the Appendices section. When these results are investigated, it is observed that under the wind speed of 16 to 17 m/s, the blade pitch controller starts performing almost as desired against the considered blade ice accumulation. This can be easily understood from the rotor speed response, particularly the transient response. The rotor speed response with iced blades gets very close to that of the response with clean blades. In both cases, even though there is a very slight difference in transient responses, no overshoots occur, and the same steady-state value is obtained at almost the same time instance, i.e. at 43.8 s of the simulation. Other turbine parameters such as aerodynamic torque, rotor power, turbine TSR and
 ${C_p}$
also include slight differences in their transient response, but not at steady-state. Similar to the above simulation, large differences occur in blade pitch angle and thrust force responses. At the steady-state, the blade pitch angle decreases by 6.48%, whereas the thrust force increases by 11.868%. Table 3 shows the variations in system and control input gains of the 5MW turbine at (
 ${U_e},{\varOmega _e},{\beta _e},$
) = (17 m/s, 12.1 rpm, 13.57o) with clean blades, and at (
 ${U_e},{\varOmega _e},{\beta _e},$
) = (17 m/s, 12.1 rpm, 12.69o) with iced blades. The system gain, A, and control input gain, B, are reduced by 6.68% and 12.69%, respectively. The disturbance input gain,
 ${B_d}$
, is also reduced by 4.96%.
Variations in the NREL 5-MW turbine parameters at 17 m/s wind speed

Under the step rising wind speed of 20 to 21 m/s, the blade pitch controller shows almost the same performance with clean and iced blades. The turbine rotor speed transient and steady-state responses are almost the same in both cases, reaching the steady-state at 47.4 s of the simulation with no overshoot. The transient and steady-state responses of other parameters such as LSS and HSS torques, rotor power, TSR, etc., are also similar in both cases, except for the blade pitch angles and thrust force as in previous simulations. Blade pitch angles and thrust forces reach different values at steady-state. The pitch angle reduces by 3.365%, whereas the thrust force increases by 11.41% at steady-state. The variations in the turbine system and control input gains at (
 ${U_e},{\varOmega _e},{\beta _e},$
) = (21 m/s, 12.1 rpm, 18,713o) with clean blades, and at (
 ${U_e},{\varOmega _e},{\beta _e},$
) = (21 m/s, 12.1 rpm, 18.09o) with iced blades are presented in Table 4. The turbine system gain, A, and control input gain, B, are reduced by 6.17% and 11.21%, respectively. The disturbance input gain,
 $\;{B_d}$
, is decreased by 4.95%.
Variations in the NREL 5-MW turbine parameters at 21 m/s wind speed

In all these simulations, the blade pitch controller gains decrease as wind speed increases, but are the same for clean and iced blades since they are designed for the clean blades. It was also observed that due to blade ice accumulation, the transient performance of the pitch controller was reduced at low wind speeds, and the controller steady-state performance stayed the same. It was realised that considering the transient response, the controller performance gets better when the wind speed increases in the above-rated region. Under the step rising wind speed of 20 to 21 m/s, the blade pitch controller performance is similar to each other in clean and iced blade cases even though the iced turbine works with a different blade pitch angle and produces a different thrust force. Thus, it can be said that at very high wind speeds, the blade pitch controller might demonstrate very similar transient and steady-state performance with clean and iced rotor blades against such a slight blade ice accumulation.
3.3 Comparison of the simulation results with the published results
In Section 2.3, the baseline controller responses are first verified with the published results of the OpenFAST Model. Therefore, to indicate the correctness of the present study, the steady-state simulation results of some turbine parameters with clean and iced blades at 9, 13, 17 and 21 m/s wind speeds are also compared with the recently published results by Sahin and Farsadi in the literature [Reference Sahin and Farsadi45]. These parameters are the turbine rotor speed, blade pitch, rotor power output, thrust, generator speed, and turbine
 ${C_p}$
.
It is important to note that the previously published results by Sahin and Farsadi in Fig. 20 are obtained for the same slight blade icing/ice accumulation scenario on the same NREL turbine, and are already validated with the field data, program and model outputs in Ref. [Reference Sahin and Farsadi45], thereby not needing any further validations. As seen in Fig. 20, the operating points at wind speeds of 9, 13, 17 and 21 m/s are indicated by diamond and star symbols. These are the operating points that the clean and iced-bladed NREL 5-MW turbine operates at steady-states following the applied step rising wind speeds outlined in Subsections 3.1 and 3.2. Here, the operating points with clean blades are represented by the diamond symbol, while the operating points with iced blades are shown by the star symbol. As seen in Fig. 20, the steady-state values for numerous turbine parameters covering rotor speed, blade pitch angle, rotor power, thrust force, etc., are all located on the previously published and validated controlled turbine curves at the aforementioned wind speeds/operating points, which further indicates the correctness of the present study.
Comparison of some steady-state simulation results with the published results at wind speeds of 9 m/s, 13 m/s, 17 m/s, and 21 m/s in the literature: (a) rotor speed, (b) blade pitch angle, (c) rotor power, (d) thrust force, (e) generator speed and (f) turbine
 ${C_p}$
.

4.0 Conclusions
This research study investigates the efficacy of the baseline turbine generator torque controller and the collective blade pitch controller against slight ice accumulation on rotor blades. Unlike existing literature, considering the same icing scenario in Ref. [Reference Sahin and Farsadi45], this current paper further investigates blade ice accumulation and focuses on a different subject, i.e. the impacts of blade ice accumulation on baseline turbine controllers. It comparatively and thoughtfully investigates the effects of blade ice accumulation on the transient and steady-state performance of the baseline turbine controllers for the first time in the literature using the NREL 5-MW turbine with clean and iced blades. The controllers’ performance is evaluated based on rotor speed response in Regions 2 and 3, respectively. Variations in other parameters such as turbine controllers’ parameters/gain(s), blade pitch angle, generator speed, rotor power, thrust, LSS and HSS torques, TSR, etc., are also examined. This study draws inspiration from the experimental results outlined in Ref. [Reference Brandrud and Krøgenes2] for an iced turbine aerofoil. Considering the findings for the glaze ice, it implements ice accumulation to all the aerofoils of the NREL 5-MW turbine blades to examine its influence on baseline turbine controllers. Ice accumulation is modeled considering icing characteristics and its consequences on blade mass and aerodynamics. All the turbine blade sections, especially their leading edges, are considered to be completely susceptible to icing, excluding the blade root sections, which are utilised for rotor hub connection only. Thus, all the 5-MW turbine blade aerofoils’ aerodynamic data are adjusted according to their distances to the blade root since ice accumulates increasingly toward the blade tip. A slight, linear increase in ice accumulation toward the blade tip is presumed. Also, the turbine rotor inertia is augmented by 3% owing to slight ice accumulation on blades. Simulations are performed with the MS Bladed Model for the baseline controllers on the 5 MW turbine. Region 2 simulations are generated under 1 m/s step rising wind speed of 8 to 9 m/s, while Region 3 simulations are conducted under three different step rising wind speeds of 12 to 13 m/s, near the rated wind speed, 16 to 17 m/s, and 20 to 21 m/s at high wind speeds.
Simulation results indicate that even a slight ice accumulation on blades affects baseline turbine controllers’ performance. In Region 2, it decreases the transient and steady-state performance of the generator torque controller. Due to slight blade ice accumulation, under the step rising wind speed of 8 to 9 m/s, the rotor speed response reaches the steady-state condition, 2 s later with a reduced rotor speed, and a steady-state error of 1.86%. It is also seen that all other turbine parameters, such as aerodynamic rotor torque, power output, thrust force, etc., are all affected. In Region 3, the transient performance of the blade pitch controller reduces, particularly near the rated wind speed, but the steady-state performance remains the same. Despite the presence of blade ice accumulation, the blade pitch controller continues to effectively regulate the rotor speed with iced blades. The rated power is ultimately achieved in Region 3. With iced blades, the controller sets the turbine blade pitch angles to lower settings for power regulation, which, in return, leads the turbine to generate large thrust forces in Region 3 due to varied blade shapes and reduced pitch angles. It is seen that the transient response of the controller gets better above a certain wind speed. In this study, it is observed that, with the considered blade ice accumulation, rotor speed response reaches a decay time up to 5.2 s and overshoots the steady-state value at 38.8 s of the simulation near the rated wind speed when compared to clean blades. Also, pitch controller performance is seen to perform well beyond the wind speed of 16 m/s, obtaining very similar rotor speed responses in both cases, particularly in terms of decay time. At wind speed of 21 m/s, the pitch controller performance is almost the same with and without iced blades. There occurs no steady-state error in the rotor speed response throughout Region 3. Most turbine parameters like turbine rotor speed, aerodynamic torque, rotor torque, etc., reach the same values at steady-state for both cases, except the blade pitch angle and thrust force. When investigated thoughtfully, blade ice accumulation is found to have changed the NREL 5MW turbine characteristics and efficiency: the turbine system gain, control input gain, disturbance input gain, and the turbine
 ${C_p}$
surface. In Ref. [Reference Sahin and Farsadi45], it is also estimated that the same slight icing/blade ice accumulation scenario raises the 5-MW turbine cut-in and the rated wind speeds. Thus, it is clearly understood that blade ice accumulation influences the baseline turbine controllers’ performance and their activation wind speeds, i.e. turbine cut-in and the rated wind speeds. The performance of both controllers varies since they are designed for clean blades, and the turbine characteristics such as turbine Cp surface, rotor inertia, system gain, control input gain, etc., are changed due to blade ice accumulation. Ice accumulation also causes reductions in turbine operating wind speed range/region since the cut-out wind speed is fixed at usually around 25 m/s.
In future studies, control researchers may examine the results of this study and seek to improve control algorithms that work efficiently against blade ice accumulation to improve the turbine performance and reduce turbine structural loads. They might utilise the adaptive algorithm in Refs [Reference Sahin and Yavrucuk11, Reference Sahin and Yavrucuk71] to enhance the turbine aerodynamic performance at the below-rated region and operate it safely within the desired loading limit(s) in standard turbine operational regions. Also, studying the controller performance under increasing ice accumulation over time and observing turbine performance and operation through simulations might be interesting for researchers. A specific software framework that could predict ice formation and corresponding changes in blade aerofoils’ aerodynamic data in time might be used with a turbine simulation model. This may allow observing the variations in turbine controllers’ performance under evolving ice accumulation condition. Lastly, an ADIS system that effectively detects and melts blade icing when activated might also be another curiosity. Therefore, researchers may focus more on enhancing the wind turbine anti/de-icing systems that can effectively detect and melt blade icing.
Acknowledgements
No specific grants from public, commercial or non-profit sectors were allocated to fund this research.
Appendices
The simulation results of the blade pitch controller for the step rising wind speeds of 16 to 17 and 20 to 21 m/s, respectively given in Figs A1 and A2 for with and without (clean) iced blade cases.
Performance of the blade pitch controller under 1 m/s step rising wind speed of 16 to 17 m/s: (a) controller parameters, (b) blade pitch angle, (c) rotor speed, (d) LSS torques, (e) generator speed, (f) HSS torques, (g) rotor power, (h) turbine TSR, (i) turbine
 ${C_p}$
and (j) thrust force.

Performance of the blade pitch controller under 1 m/s step rising wind speed of 20 to 21 m/s: (a) controller parameters, (b) blade pitch angle, (c) rotor speed, (d) LSS torques, (e) generator speed, (f) HSS torques, (g) rotor power, (h) turbine TSR, (i) turbine
 ${C_p}$
and (j) thrust force.