INTRODUCTION
In winter wheat (Triticum aestivum L.), protein is a major component of grain yield, accounting for 0·08–0·2 of mature wheat grain weight. Wheat proteins mainly consist of gluten storage proteins, water-soluble albumins and salt-soluble globulins (Pence et al. Reference Pence, Weinstein and Mecham1954; Shewry et al. Reference Shewry, Tatham, Halford, Barker, Hannappel, Gallois, Thomas and Kreis1994; Singh & Skerritt Reference Singh and Skerritt2001). The gluten protein, which consists of monomeric gliadins and polymeric glutenins reported to contribute to the strengthening properties of wheat flour dough, is essential for functionality of wheat flour (MacRitchie Reference MacRitchie1980; Shewry et al. Reference Shewry, Tatham, Barro, Barcelo and Lazzeri1995a, Reference Shewry, Napier and Tathamb; Johansson et al. Reference Johansson, Prieto-Linde, Svensson and Jönsson2003). The glutenin fraction consists of high molecular weight glutenin subunits (HMW-GS) and low molecular weight glutenin subunits (LMW-GS). Various studies have confirmed that both the quantity and composition of HMW-GS correlates with dough properties and bread-making quality (Payne et al. Reference Payne, Nightingale, Krattiger and Holt1987; Lafiandra et al. Reference Lafiandra, Ovidio, Porcedu, Margiotta and Colaprico1993; Popineau et al. Reference Popineau, Cornec, Lefebvre and Marchylo1994; Johansson & Svensson Reference Johansson and Svensson1999). An important fraction of glutenins can be isolated from flour as a sodium dodecyl sulfate (SDS) insoluble gel-layer, termed the glutenin macropolymer (GMP) (Graveland et al. Reference Graveland, Bosveld, Lichtendonk, Moonen and Scheepstra1982). The quantity and rigidity of the GMP, as an indicator of wheat flour quality and dough properties, correlate with bread-making quality (Pritchard Reference Pritchard1993; Weegels et al. Reference Weegels, van de Pijpekamp, Graveland, Hamer and Schofield1996; Sapirstein & Suchy Reference Sapirstein and Suchy1999). The GMP consists of spherical granules, varying in size. This variation of granules closely correlates with key technological quality parameters of wheat flour (Don et al. Reference Don, Lichtendonk, Plijter and Hamer2003a, Reference Don, Lichtendonk, Plijter and Hamerb).
Environment is an important factor that affects grain development and protein accumulation. Numerous studies have revealed that HMW-GS in wheat grains are determined and influenced developmentally by planting environment (Triboi et al. Reference Triboi, Abad, Michelena, Lloveras, Ollier and Daniel2000). A small increase in HMW-GS amount was reported under conditions of sulphur deficiency (Wrigley et al. Reference Wrigley, Ducros, Fullington and Kasarda1984), while N application was reported to increase HMW-GS content (Wieser & Seilmeier Reference Wieser and Seilmeier1998; Luo et al. Reference Luo, Branlard, Griffin and McNeil2000). Furthermore, Yue et al. (Reference Yue, Jiang, Dai, Qin, Jing and Cao2007) found that HMW-GS content is more sensitive in response to N in the low grain protein cultivar. With increased developmental temperature, accumulation of HMW-GS increased (Dupont et al. Reference Dupont, Hurkman, Vensel, Chan, Lopez, Tanaka and Altenbach2006). Many studies have reported that environmental conditions had a significant influence on starch granules (Dai et al. Reference Dai, Yin and Wang2009; Li et al. Reference Li, Yan, Yin and Wang2010b; Liu et al. Reference Liu, Guo, Jiang, Pu, Feng, Zhu, Peng, Kuang and Little2011; Ni et al. Reference Ni, Wang, Yin, Li, Yan and Cai2012); however, none except Don et al. (Reference Don, Lookhart, Naeem, MacRitchie and Hamer2005) showed that heat stress could make GMP granules become larger, and little information was available on influence of environment on GMP granules. Low light intensity, as one of the most important environmental factors, has become the major challenge to crop production in many areas of the world (Willeya & Holliday Reference Willeya and Holliday1971; Savin & Slafer Reference Savin and Slafer1991; Mu et al. Reference Mu, Jiang, Wollenweber, Dai, Jing and Cao2010). Numerous studies have shown that low light intensity has strong impacts on morphology, grain yield and starch quality (Wang et al. Reference Wang, Yin, He, Zhang, Lu, Li and Shi2003; Li et al. Reference Li, Jiang, Wollenweber, Dai, Jing and Cao2010a, Reference Li, Yan, Yin and Wangb). However, there is limited information available regarding its influence on grain protein accumulation, especially on HMW-GS and distribution of GMP granules. The present study was conducted to investigate the effect of low light intensity after anthesis on changes in HMW-GS during grain filling and distribution of GMP granules at maturity in wheat grain. The information obtained will help to provide a theoretical basis for obtaining higher grain yield and superior grain quality in wheat.
MATERIALS AND METHODS
Experimental design
The field experiments were carried out at the Tai'an Experimental Station (36°09′N, 117°09′E) of Shandong Agricultural University in two growing seasons from October 2009 to June 2010 and from October 2010 to June 2011. Two strong-gluten winter wheat (Triticum aestivum L.) cultivars, Jinan17 and Tainong18, were used. The soil was a sandy loam and maize (Zea mays L.) was the previous crop. Fertilizer, at the rate of 120 kg N/ha, 75 kg P2O5/ha and 120 kg K2O/ha, was applied as basal fertilizer before planting, with another 120 kg N/ha applied by topdressing at the elongation stage of wheat in the spring. The experiments were arranged in a completely randomized design with three replications for each cultivar. The plot size was 3 × 3 m with 10 rows (0·25 m between rows). Seeds were sown at a density of 180 plants/m2 on 10 October 2009 and 15 October 2010. Other cultural practices used in the present study followed the precise high-yielding cultivation system of Yu (Reference Yu1990). Black shading nets with 0·6 light transmission were placed over the plants in the early (1–10 days after anthesis (DAA)), middle (11–20 DAA) and late (21–30 DAA) grain-filling stages (treatments S1, S2 and S3, respectively). Uniform ears flowering on the same day were tagged for sampling. The tagged ears were sampled from 7 DAA, at 7-day intervals. Sampled grains were immediately detached manually and oven-dried at 60 °C for 48 h, and then ground into flour for measurement.
GMP content
GMP content was measured by the method of Weegels et al. (Reference Weegels, van de Pijpekamp, Graveland, Hamer and Schofield1996); 0·05 g petroleum ether defatted flour was dispersed into 1 ml of 15 mg/g SDS solution and then centrifuged at 15 500 g for 30 min at 20 °C using an Allegra X-64R centrifuge (Beckman, San Francisco, CA, USA). The supernatant was decanted and the sediment collected as GMP. The N content of the sediment as the GMP content was measured with the biuret reagent (Gornall et al. Reference Gornall, Bardawill and David1949).
GMP particles size analysis
The particles size characteristics of GMP were determined using a Coulter Laser LS13320 (Beckman Coulter Instruments, San Francisco, CA, USA). 1·4 g defatted flour was dispersed into 0·05 mol SDS/l (pasteurized, 28 ml) and then centrifuged at 80 000 g for 30 min at 20 °C using an ultracentrifuge Beckman L460 (Beckman, San Francisco, CA, USA) as described by Graveland et al. (Reference Graveland, Bosveld, Lichtendonk, Moonen and Scheepstra1982). GMP-gel was isolated from the top of the precipitate and then 1 g GMP-gel was dispersed into 5 ml of 0·05 mol SDS/l in 10 ml (Eppendorf) tubes. The tubes were kept at 4 °C for 3 h, during which time the tubes were vortexed every 15 min. Then 1 ml of the suspension was transferred into the dispersion tank of a laser diffraction particle size analyser containing double-distilled water for size measurements. The assessments of equivalent volume, equivalent surface area and number proportions of GMP granules were made automatically by the laser diffraction particle size analyser and the projected area represented the same volume, surface area and number proportions as the real GMP granules.
Quantification of HMW-GS
HMW-GS was separated by SDS polyacrylamide gel electrophoresis (SDS-PAGE), according to Khan et al. (Reference Khan, Frohberg, Olson and Huckle1989). The method of Yue et al. (Reference Yue, Jiang, Dai, Qin, Jing and Cao2007) was used for HMW-GS quantification. In general, a 20 mg grain sample was defatted with isopropanol and was incubated at 60 °C for 30 min with continuous shaking, followed by centrifugation at 10 000 g for 10 min. The sedimentation was reserved and then defatted with isopropanol, repeating the above procedure three times, and then the sedimentation mixed with 1 ml of extraction buffer containing 62·5 mmol Tris-HCl/l (pH 6·8), 100 mg glycerol/g, 20 mg SDS/g and 50 mg β-mercaptoethanol/g. The mixture was then incubated at 60 °C for 1 h with continuous shaking, followed by centrifugation at 10 000 g for 10 min. The supernatant was used for SDS-PAGE. The dimensions of the SDS-PAGE gel were 170 × 170 mm and 1 mm thick. The acrylamide concentration in the resolving gel was 100 and 40 mg/g in the stacking gel. Glutenin extract (15 μl) was loaded in each lane. After electrophoresis, the gel was stained with 0·5 mg Coomassie Brilliant Blue R250/g for 24 h, and then destained in distilled water for 48 h. Thereafter, each band was cut separately from the gel, placed in an Eppendorf tube and depending on the intensity of each band, 500–1000 μl of 500 ml isopropyl alcohol/l containing 30 mg SDS/g was added to the tube, which was incubated at 37 °C for 24 h until the gel cleared. The extraction was then monitored at 595 nm with a UV-2401 Shimadzu spectrophotometer (Shimadzu, Kyoto, Japan). During the preliminary electrophoresis, the wheat cultivars Chinese Spring, Marquis, Shannong15 and Yannong19 were used as standards to identify HMW-GS types in the selected cultivars.
Statistical analyses
Analysis of variance (ANOVA) procedures for randomized complete designs were used to test for differences in GMP content, GMP granules distribution, HMW-GS between shading treatment and control, and calculated their standard errors of differences (s.e.d.). All determinations were replicated three times, and data were analysed with SPSS.
RESULTS
GMP content
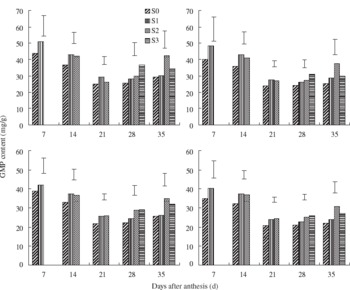
The dynamic changes of GMP content during grain filling are given in Fig. 1. The changes of GMP content during the grain filling showed the ‘V’ model with the lowest content at 21 DAA for the two cultivars. This may be caused by the lower protein accumulation rate than the starch accumulation rate that had dilution effect on the GMP content. Comparing the two cultivars in the two seasons, the GMP content in Jinan17 was higher than that in Tainong18 in different treatments during the grain filling, especially at maturity. Shading at different grain-filling stages increased the GMP content during the grain filling: the GMP content under shading at the early grain-filling stage was higher than shading at middle grain-filling stages before and at 21 DAA and then was lower than shading at middle and late grain-filling stages.
GMP content in grains of winter wheat cultivars Jinan17 (left) and Tainong18 (right) under shading at different grain-filling stages in growing seasons 2009/10 (top) and 2010/11 (bottom) (S0, control; S1, shading from 1 to 10 days after anthesis; S2, shading from 11 to 20 days after anthesis; S3, shading from 21 to 30 days after anthesis). Vertical bars indicate 1 s.e.d.

GMP granules volume distribution
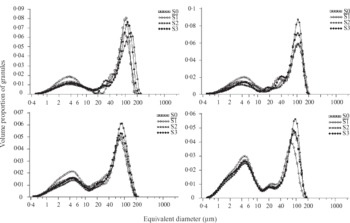
The volume distribution of GMP granules is shown in Fig. 2. It responded significantly to shading at different grain-filling stages. Compared with the no shading treatment, shading at the early grain-filling stage increased the proportions by volume of granules <10 and <100 μm particle diameter (p.d.), and decreased the volume proportions of 10–100 and >100 μm p.d., while shading at the middle and late grain-filling stages showed the opposite trends, which was helpful to increase volume proportions of 10–100 and >100 μm p.d. and reduced volume proportions of <10 and <100 μm p.d. The two cultivars showed the same trend.
Effect of shading at different grain-filling stages on the proportion by volume of GMP granules in winter wheat cultivars Jinan17 (left) and Tainong18 (right) in growing seasons 2009/10 (top) and 2010/11 (bottom) (S0, control; S1, shading from 1 to 10 days after anthesis; S2, shading from 11 to 20 days after anthesis; S3, shading from 21 to 30 days after anthesis).

Distribution of GMP granules by numbers present
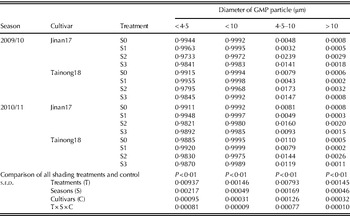
The distribution of GMP granules by numbers present is shown in Table 1; 0·99 of the GMP comprised granules of <10 μm p.d., while the proportion of GMP granules >10 μm p.d. was only 0·0002–0·0032, which indicated that most of the GMP granules in the wheat grains of Jinan17 and Tainong18 were of small diameter. The two cultivars responded similarly to shading at different grain-filling stages. Under shading at the middle and late grain-filling stage, the proportion (by numbers present) of GMP granules 4·5–10 μm and >10 μm p.d. increased significantly, by 15–398 and 83–245% in Jinan17, 8–119 and 29–400% in Tainong18, respectively, while the proportion of GMP granules <4·5 μm p.d. was reduced significantly, by 1–2 and 0·2–1·2% in Jinan17 and Tainong18, respectively. In contrast, the proportion of GMP granules 4·5–10 μm and >10 μm p.d. under shading at the early gain filling stages was significantly reduced (by 33–40 and 37–60% in Jinan17, 28–46 and 65–69% in Tainong18, respectively), with an increase in the proportion of GMP granules <4·5 μm p.d. (by 0·2–0·4 in Jinan17 and 0·35–0·40% and Tainong18). The integrated changes of the proportion of GMP granules <4·5 μm p.d. and 4·5–10 μm p.d. induced by shading led to an increase in the proportion of GMP granules <10 μm under shading at early grain-filling stages, and a decrease under shading at middle and late grain-filling stages. The results indicated that shading at the middle and late grain-filling stages increased the proportion of large GMP granules present, while shading at early grain-filling stages increased that of small GMP granules.
Effect of shading at different grain-filling stages on mean number distribution of glutenin macropolymer (GMP) in two winter wheat cultivars in two seasons (d.f. = 47)

S0, control; S1, shading from 1 to 10 days after anthesis; S2, shading from 11 to 20 days after anthesis; S3, shading from 21 to 30 days after anthesis.
GMP granules surface area distribution
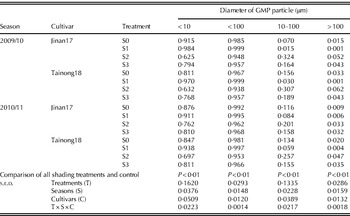
The surface area distribution of GMP granules is given in Table 2. The surface area proportion of GMP granules 10–100 μm p.d. and >100 μm p.d. increased by 36–363 and 182–279% in Jinan17, respectively, and by 16–97 and 29–141% in Tainong18, respectively, under shading at middle and late grain-filling stages, while the surface area proportion of GMP granules <10 μm p.d. decreased by 8–32 and 4–22% in Jinan17 and Tainong18, respectively. The compositive changes in the proportion of GMP granules <10 and 10–100 μm p.d. were responsible for the decreased proportion of GMP granules <100 μm p.d. under shading at middle and late grain-filling stages. Under shading at early grain-filling stages, the variations of the surface area proportion of GMP granules showed the opposite trend, with increasing proportion of GMP granules <10 and <100 μm p.d., and decreasing the proportion of GMP granules 10–100 and >100 μm p.d. The results showed that shading at middle and late grain-filling stages was helpful in increasing the surface area proportion of larger GMP granules.
Effect of shading at different grain-filling stages on mean surface area distribution of glutenin macropolymer (GMP) in two winter wheat cultivars in two seasons (d.f. = 47)

S0, control; S1, shading from 1 to 10 days after anthesis; S2, shading from 11 to 20 days after anthesis; S3, shading from 21 to 30 days after anthesis.
HMW-GS content and accumulation amount
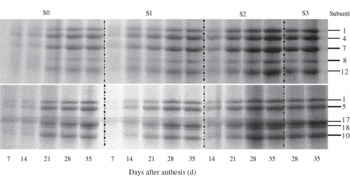
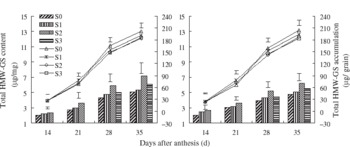
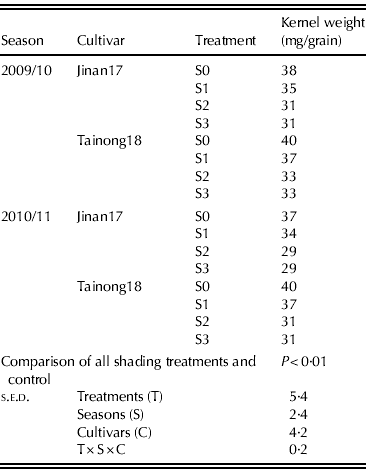
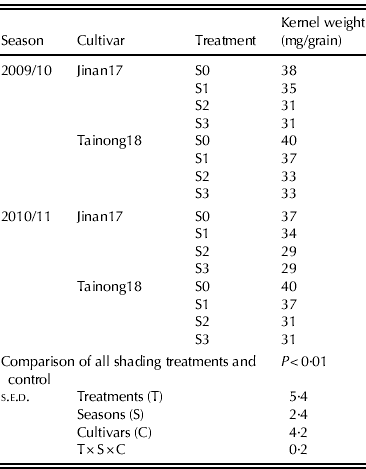
HMW-GS accumulation in grain started at about 14 DAA for cultivars Jinan17 and Tainong18 under all shading treatments (Fig. 3). No difference in the initial accumulation time of HMW-GS was found between the treatments for the two cultivars. The pattern of HMW-GS content and HMW-GS accumulation amount per grain showed the same increasing trend during the grain filling. However, they responded differently to shading during the grain-filling stages; shading at different grain-filling stages increased the HMW-GS content throughout the grain-filling stage, while the HMW-GS accumulation amount per grain increased before 21 DAA and then decreased by shading compared with the control (Fig. 4). The variation between them was due to the adverse effect of shading on the grain kernel weight (Table 3).
SDS-PAGE images of HMW-GS accumulation dynamics in grains of winter wheat cultivars Jinan17 (top) and Tainong18 (bottom) under shading at different grain-filling stages in 2009/10 (S0, control; S1, shading from 1 to 10 days after anthesis; S2, shading from 11 to 20 days after anthesis; S3, shading from 21 to 30 days after anthesis).

Changes in content and accumulation amount of total HMW-GS in grains of winter wheat cultivars Jinan17 (left) and Tainong18 (right) under shading at different grain-filling stages in 2009/10 (S0, control; S1, shading from 1 to 10 days after anthesis; S2, shading from 11 to 20 days after anthesis; S3, shading from 21 to 30 days after anthesis; Column, total HMW-GS content; Line, total HMW-GS accumulation). Vertical bars indicate 1 s.e.d.

Effect of shading at different grain-filling stages on the kernel weight of two winter wheat cultivars in the two seasons (d.f. = 47)
S0, control; S1, shading from 1 to 10 days after anthesis; S2, shading from 11 to 20 days after anthesis; S3, shading from 21 to 30 days after anthesis.
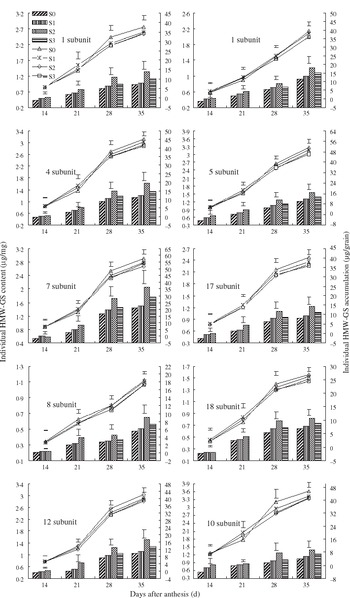
In general, the accumulation rate and amount of subunits 4, 7 and 12 were higher than that of subunits 1 and 8 in Jinan17 and that of subunits 5, 17 and 10 were higher than subunits 1 and 18 in Tainong18 during the grain filling (Fig. 5). However, each individual subunit responded similarly to shading: the content of each was increased by shading at different grain-filling stages, especially at middle grain-filling stage. However, the amount per grain of each individual subunit was decreased by shading, which was due to a decrease in grain weight by 10–19 and 9–19% at maturity in Jinan17 and Tainong18, respectively (Table 3).
Changes in content and accumulation amount of individual subunits of 1, 4 (5), 7 (17), 8 (18) and 12 (10) in grains of winter wheat cultivars Jinan17 (left) and Tainong18 (right) under shading at different grain-filling stages in 2009/10 (S0, control; S1, shading from 1 to 10 days after anthesis; S2, shading from 11 to 20 days after anthesis; S3, shading from 21 to 30 days after anthesis; Column, individual HMW-GS content; Line, individual HMW-GS accumulation). Vertical bars indicate 1 s.e.d.

Relationships between volume distribution of GMP granules and the total HMW-GS content
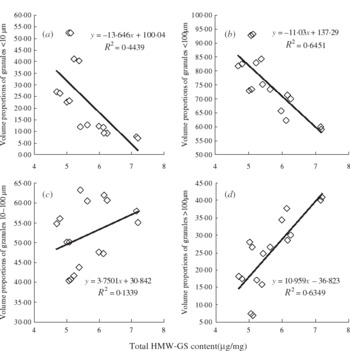
The proportion of granules by volume of GMP granules <10 and <100 μm were negatively correlated with the total HMW-GS content (r = − 0·67, P = 0·005; r = − 0·80, P<0·001, respectively; Fig. 6a, b). A positive correlation (r = 0·80, P<0·001; Fig. 6d) was found between the volume proportions of GMP granules >100 μm and the total HMW-GS content. The proportion by volume of GMP granules 10–100 μm was not significantly correlated with the total HMW-GS content (r = 0·37, P = 0·163; Fig. 6(c).
Relationship between total HMW-GS content and distribution by volume of GMP granules: (a) <10 μm, (b) <100 μm, (c) 10–100 μm and (d) >100 μm.

DISCUSSION
The quantity and properties of GMP are among the most important factors affecting the bread-making quality of wheat flour (Gupta et al. Reference Gupta, Batey and MacRitchie1992; Weegels et al. Reference Weegels, Hamer and Schofield1997; Don et al. Reference Don, Lichtendonk, Plijter and Hamer2003a). These characteristics are determined genetically by the wheat cultivar as well as environmental factors. GMP consists of HMW-GS linked with LMW-GS through disulfide bonds. Therefore, HMW-GS may play an important role in determining the formation and amount of GMP in wheat grain. In previous studies, cultivars containing HMW-GS 5 + 10 have been reported to correlate with larger glutenin polymers (unextractable polymeric proteins,%UPP) as compared with cultivars containing HMW-GS 2 + 12 (Gupta & MacRitchie Reference Gupta and MacRitchie1994; Johansson et al. Reference Johansson, Oscarson, Heneen and Lundborg1994). However, the total amount of HMW-GS is reported to play a more important role than HMW-GS composition in determining flour quality (Halford et al. Reference Halford, Field, Blair, Urwin, Moore, Robert, Thompson, Flavell, Tatham and Shewry1992; Sliwinski et al. Reference Sliwinski, Kolster, Prins and Van Vliet2004; Yue et al. Reference Yue, Jiang, Dai, Qin, Jing and Cao2007). In the present study, the cultivar Jinan17 (with higher total HMW-GS content) has a higher GMP content than cultivar Tainong18 (with lower total HMW-GS content), though the cultivar Tainong18 contains HMW-GS 5 + 10 compared with HMW-GS 4 + 12 in cultivar Jinan17. The present results indicated that the total HMW-GS content played a more important role in determining GMP content than the HMW-GS composition.
In the present study, shading after anthesis had significant influence on GMP content, which was increased significantly by shading at different grain-filling stages, especially by shading at middle and late grain-filling stages. The GMP granules, as an important indicator of the GMP properties, correlate with flour quality (Don et al. Reference Don, Lichtendonk, Plijter and Hamer2003a), originating from the protein bodies observed in developing wheat endosperm (Don et al. Reference Don, Lichtendonk, Plijter and Hamer2003a; van Herpen et al. Reference van Herpen, Cordewener, Klok, Freeman, America, Bosch, Smulders, Gilissen, Shewry and Hamer2008). The polymerization process of granules was easily affected by environmental conditions. Don et al. (Reference Don, Lookhart, Naeem, MacRitchie and Hamer2005) reported that heat stress after anthesis could accelerate the hyper-aggregation progress and make granules become larger. The weather, fertilizer rate and timing, and temperature were reported to correlate with the amount and size distribution of polymeric protein in wheat (Johansson et al. Reference Johansson, Kuktaite, Andersson and Prieto-Linde2005, Reference Johansson, Prieto-Linde and Gissen2008); however, Malik et al. (Reference Malik, Prieto-Linde, Kuktaite, Andersson and Johansson2011) found that the length of grain maturation time determined by cultivar and environmental conditions governs gluten strength and grain protein concentration. In the present study, the proportion (by volume, number and surface area) of larger granules in GMP was decreased by shading at early grain-filling stage and increased by shading at middle and late grain-filling stages. The period from anthesis to maturity affected by shading at different grain-filling stages may account for this. Shading at early grain-filling stages postponed the maturation period by 2–3 days from anthesis to maturity, while the period from anthesis to maturity was shortened by 1–2 days under shading at middle and late grain-filling stages (data not shown). It has been reported that a short grain-maturation period accelerated polymerization and resulted in high amounts of polymeric proteins, while a long grain-maturation period hindered the formation of polymeric proteins (Malik et al. Reference Malik, Prieto-Linde, Kuktaite, Andersson and Johansson2011). In general, the present result suggested that the formation of larger GMP particles was more sensitive to shading at the early grain-filling stage and short-term dim light at the middle and late grain-filling stages were helpful to accelerate the hyper-aggregation process and promote the formation of larger GMP granules.
The accumulation and polymerization of grain storage proteins are events predetermined in wheat, independently of environmental conditions (Johansson et al. Reference Johansson, Prieto-Linde and Gissen2008). Yue et al. (Reference Yue, Jiang, Dai, Qin, Jing and Cao2007) found that the initial formation of HMW-GS was determined genetically and that N fertilizer rates had no effect on it. In the present study, HMW-GS accumulation in grain started at about 14 DAA in Jinan17 and Tainong18, and the initial formation time of individual subunits was not influenced by shading at different grain-filling stages, which is in line with previous studies (Yue et al. Reference Yue, Jiang, Dai, Qin, Jing and Cao2007). However, the environmental conditions have significant influence on the formation of HMW-GS. The patterns of different subunits reacting to the heat stress were the same and no different levels of expression of specific HMW-GS were found (DuPont & Altenbach Reference Dupont and Altenbach2003; Don et al. Reference Don, Lookhart, Naeem, MacRitchie and Hamer2005). The present results showed that each individual subunit responded similarly to shading; the content of each was increased by shading at different grain-filling stages, especially at the middle grain-filling stage, though the amount per grain of each individual subunit was decreased by shading, which was due to the decreased grain weight at maturity. The present results indicated that shading during grain filling had no effect on the origination formation time of HMW-GS, but increased the HMW-GS content and decreased the HMW-GS amount per grain in wheat grain at maturity.
Previous studies have reported that HMW-GS and GMP have a positive relationship; the large numbers of HMW-GS and special HMW-GS subunits, such as 5 + 10, can produce larger amounts of GMP (Don et al. Reference Don, Lookhart, Naeem, MacRitchie and Hamer2005; Yue et al. Reference Yue, Jiang, Dai, Qin, Jing and Cao2007) and the function of GMP, mainly through affecting the GMP granules, has been reported in a previous study (Don et al. Reference Don, Mann, Bekes and Hamer2006). In the present study, the HMW-GS content was negatively correlated with the proportion by volume of granules sized <10 and <100 μm, and positively correlated with the proportions by volume of GMP granules >100 μm, while the total HMW-GS content was not significantly correlated with the proportion by volume of GMP granules 10–100 μm, which indicated that the correlation between larger GMP granules and HMW-GS content may account for a positive relationship between GMP and HMW-GS. The present result showed that an increase in the total HMW-GS content enhanced the volume proportion of larger GMP granules induced by shading.
In summary, using the two strong winter wheat cultivars in the present study, GMP granule distribution in wheat grain was found to depend greatly on HMW-GS content. Shading after anthesis showed a significant regulatory effect on HMW-GS accumulation and distribution of GMP granules. Shading at different grain-filling stages all increased the content of each individual and total HMW-GS during the grain filling; however, shading at the middle and late grain-filling stages were helpful in making GMP granules larger, while shading at early grain-filling stages showed the opposite effect. This may be caused by the different maturation period induced by different shading treatments.
The research was supported by the National Natural Science Foundation of China (30871477), the National Basic Research Program of China (973 Program 2009CB118602) and the Public Service Sector (Agriculture) Research Program of China (200803037).