


Does the initiative process influence the extent to which states innovate by adopting new policies? The initiative process has been theorized to act as a “gun behind the door,” pushing legislatures to adopt policies closer to median citizen preferences (Gerber Reference Gerber1996; Matsusaka Reference Matsusaka2004), thereby encouraging the legislature to be more responsive to public opinion. Historically, scholars have evaluated the effect of the initiative within a single policy by determining whether policy outcomes in initiative states appear to hew closer to public opinion. This single policy approach has led to disparate camps of findings with some arguing that the initiative has an effect on state policies (Matsusaka Reference Matsusaka2018b) and others arguing it has no effect (Lax and Phillips Reference Lax and Phillips2012). This paper seeks to fill that gap by systematically reviewing the theoretical predictions for the influence of the initiative process on policy change and evaluating them in the context of state policy adoption within a sample of hundreds of policies. This broad approach allows us to focus on the heterogeneous nature of the predicted relationship: for some policies, the initiative will increase the chance of adoption and for others it will decrease it.
Theoretical arguments and recent work underscore that the initiative process can be a driver of both policy change and policy stasis. That is, it can lead to policy change either directly via the ballot or indirectly through legislative moderation or it can slow policy change by providing a brake on legislative attempts to change policy in a way that gets ahead of public opinion. Yet few studies attempt to assess or catalog these differing influences. In fact, we know of no study that systematically analyzes the full range of effects of the initiative on policy change, although Matsusaka (Reference Matsusaka2018a) comes the closest by reviewing the findings of multiple studies.
To cover this range of possible effects, and in contrast to previous studies that often used one policy, and at most a few dozen, we use the new State Policy Innovation and Diffusion (SPID) database (Boehmke et al. Reference Boehmke, Brockway, Desmarais, Harden, LaCombe, Linder and Wallach2018) that incorporates hundreds of policies. Evaluating the effect of the initiative with so many policies offers three primary advantages. First, we avoid the idiosyncrasies inherent in single-policy studies. Second, using so many policies greatly increases our power to detect a possibly small but consistent average effect that might exist but be difficult to pin down with only one policy. Third, analyzing data from hundreds of policies with pooled event history analysis (PEHA) allows us to capture the theoretically expected heterogeneous effect of the initiative across policies either by employing random coefficients or by subsample analysis for clusters of policies.
We find consistent evidence of an average effect on the order of a one percentage point increase in the probability of adopting a new policy. This effect decreases from a little over 1.5 percentage points for states with modest signature requirements to nearly zero for those with very large signature requirements or a distribution requirement. Moreover, we find heterogeneity in the direction of the effect across groups of policies based on a general measure of citizen preferences. On a policy-by-policy basis, we find that for the majority of policies states with the initiative process are neither more nor less likely to adopt the policy. Yet when we group the policies by their ideological direction—that is, does ideology matter and if so in what direction—we find that the initiative consistently increases the chance of adoption for ideologically neutral policies. For more ideologically oriented policies, we find symmetric effects based on the direction of influence: the initiative increases the chance of adoption when the baseline chance of adoption is low but decreases the chance of adoption at the other extreme.
Theories of the Initiative Process and Policy Outcomes
The initiative process has been shown to have a wide variety of effects on state politics and policy and has been the source of considerable research outlining theories as to how and why the initiative alters state politics (Matsusaka Reference Matsusaka2018a). Such theories typically rely on game-theoretic models of the state policy-making process. These models build on Romer and Rosenthal’s (Reference Romer and Rosenthal1979) setter model by allowing initiative proponents, typically organized interest groups, to select any policy to challenge the status quo via election. Gerber (Reference Gerber1996) sets forth such a model with a one-dimensional policy space and three actors: the median Legislator, the initiative Proponent, and the median Voter. In states without the initiative process, the legislature chooses policy; in initiative states that policy can be challenged by an initiative subject to a cost. Subsequent models consider variations on the basic assumptions by adding uncertainty over voter preference (Matsusaka Reference Matsusaka2001) or by accounting for pivotal actors in government (Boehmke, Osborn, and Schilling Reference Boehmke, Osborn and Schilling2015).
These models generally conclude that the presence of the initiative process produces policy outcomes no further from the median voter’s ideal point than expected without the initiative and sometimes closer.Footnote 1 Whether it does so depends on the location of players’ ideal points, the cost of proposing an initiative, and the availability of an individual or group to support those efforts. Collecting signatures and campaigning for an initiative is costly, so initiatives should only be proposed under the right conditions. If there is not a threat of an initiative being proposed, then the initiative process is unlikely to have an effect on the status quo. Typically the threat increases as policies deviate further from voters’ preferences and as the cost of proposing an initiative decreases.
Models of the initiative identify legislative policy moderation as the primary mechanism for policy influence. Known as the indirect effect of the initiative process, legislative moderation occurs when the legislature passes a policy closer to voters than it otherwise would to avoid triggering an initiative proposal. In contrast, the direct effect occurs when the legislature does not completely deter a ballot measure that ultimately passes.Footnote 2 Through either mechanism, however, the moderating effect of the initiative produces greater congruence between policy outcomes and the median voter’s preference. Importantly, the prediction of enhanced congruence does not mean that policy in initiative states will move in any particular direction. Moderation could mean moving policy leftwards or rightwards toward voters depending on the relative location of actors’ ideal points in the policy space.
These predictions persist in models that focus on a binary policy space. This special case has received attention since tests of the effect of the initiative process often occur with binary policy data, for example, does a state adopt a lottery or not? since many policies are difficult to place precisely in a continuous space. Boehmke (Reference Boehmke2005) focuses on the question of policy adoption when the legislature prefers the status quo of not adopting and finds that the chance of policy adoption increases with the probability that voters prefer the change and decreases with the cost of proposing an initiative. Leemann and Wasserfallen (Reference Leemann and Wasserfallen2016) expand on this by exploring the case in which the legislature prefers adoption as well as when it does not. They confirm the findings from the continuous policy models that the presence of the initiative increases policy congruence and that this tendency increases as initiatives become less costly.
Table 1 presents a summary of the four relevant scenarios in the binary policy context.Footnote 3 Consistent with Leemann and Wasserfallen (Reference Leemann and Wasserfallen2016), when voter and legislative preferences coincide the ability to propose initiatives will not affect policy outcomes. But, when they differ, the initiative will matter. When voters want to adopt and the legislature does not, the initiative provides a motivation for the legislature to move policy, or a means for voters to do so when it does not. When the legislature wants to adopt the policy, but voters do not the former could move policy with no hesitation in noninitiative states, but in initiative states the legislature knows that its decision could be subsequently reversed by voters. In a world of costless legislating this might not concern it, but if producing legislation is costly—whether on its own terms or in the opportunity cost of not revising other policies—then this threat of reversal may deter the legislature from acting. These predictions can be interpreted probabilistically since in both of the previously described models the location of voters is not known with certainty. Thus, as the probability that voters prefer a move from zero to one increases the presence of the initiative process makes such a move more likely. In contrast, as the probability that voters prefer a policy change decreases the initiative will lead to a small chance of policy adoption.
Summary of predictions across combinations of voter and legislature preferences

In sum then, despite a consistent effect on congruence the initiative process can have multiple effects on adoption depending on the configuration of preferences and the costs of proposal. In some cases, it can promote adoption, in other cases, it can slow or halt adoption, and in yet other cases, it will have no effect. We emphasize adoption because empirical tests often rely on binary policy adoption data and many of these have merely tested whether the initiative increases the chance of adoption (e.g., Boehmke Reference Boehmke2005; Gerber Reference Gerber1996; Schildkraut Reference Schildkraut2001). While this may be appropriate for a given policy and preference configuration, it does not capture the full range of the possible effects of the initiative process on state policy adoption. We seek to address that by modeling the adoption of over 500 policies in order to evaluate the full range of initiative effects and the relative frequency of each. But, first, we review the literature conducting empirical evaluations of the influence of the initiative process on policy outcomes.
Policy Specific Findings
The effects of the initiative have been tested in a variety of contexts and many studies have found that the initiative influences state policy outcomes. Researchers have found that states with the initiative process are more likely to have restrictive abortion laws (Arcenaux Reference Arcenaux2002; Burden Reference Burden2005; Gerber Reference Gerber1996, Reference Gerber1999), ban same-sex marriage (Haider-Markel, Querze, and Lindman Reference Haider-Markel, Querze and Lindman2007; Hume Reference Hume2011; Lewis Reference Lewis2011; Lupia et al. Reference Lupia, Krupnikov, Levine, Piston and Hagen-Jamar2010), and allow the death penalty (Boehmke Reference Boehmke2005; Gerber Reference Gerber1999). The initiative makes states much more likely to adopt term limits in both the legislature (Bowler and Donovan Reference Bowler and Donovan2004; Bowler, Donovan, and Tolbert Reference Bowler, Donovan and Tolbert1998) and the executive branch (Matsusaka Reference Matsusaka2008). Initiative states tend to be more reliant on fees rather than taxes for spending (Matsusaka Reference Matsusaka1995, Reference Matsusaka2004), which may be related to initiative states being more permissive of lotteries (Jensen Reference Jensen2003) and tribal gaming (Boehmke Reference Boehmke2005). In his comprehensive survey of research on direct democracy, Matsusaka (Reference Matsusaka2018a) argues that the literature over the past few decades has found that initiative states tend to have lower spending and taxation levels, more conservative social policies, and are more likely to have policies congruent with public preferences. These effects are not constant: in earlier eras, the initiative process increased spending levels in the states (Matsusaka Reference Matsusaka2004).
At the same time, a second group of studies finds the initiative has no effect on policy outcomes. Early research on fiscal policy finds that states with the initiative process do not differ in state spending and taxation levels compared to noninitiative states (Camobreco Reference Camobreco1998; Lascher, Hagen, and Rochlin Reference Lascher, Hagen and Rochlin1996). More recently, scholars have evaluated the initiative’s influence on policy liberalism to move beyond policy specific findings and evaluate whether the initiative changes state policies in the aggregate. Using this approach, Monogan, Gray, and Lowery (Reference Monogan, Gray and Lowery2009) find no evidence that the initiative moves policy liberalism closer to public preferences. Caughey and Warshaw (Reference Caughey and Warshaw2017) use a similar approach and find that the initiative does not alter responsiveness when measured from an aggregate, policy-liberalism perspective. A null relationship is also found at the municipal level (Tausanovitch and Warshaw Reference Tausanovitch and Warshaw2014). Others have critiqued this approach because measures of the public and policy are not typically on the same scale, so researchers cannot know the relative location of actors and identify the initiative’s conditional effect (Matsusaka Reference Matsusaka2001, Reference Matsusaka2018a). Scholars can identify differences in policy outcomes between initiative and not states using continuous measures, but will not be able to identify the extent to which policy is moving closer (or farther) to public preferences without policy and opinion being on the same scale. Additionally, if the initiative makes policies more liberal in some states, but more conservative in others, scholars may misidentify the initiative as having no effect on policy, when in fact it has counterbalancing effects.
Others have tried to address some of the concerns examining responsiveness in general by developing measures of pubic opinion on specific policies to evaluate whether policies are congruent with opinion. Rather than using a continuous measure of the relative location of actors, scholars measure whether policy is aligned with the majority public opinion. Lax and Phillips (Reference Lax and Phillips2009) first focus on gay rights and then expand to multiple policy areas (Lax and Phillips Reference Lax and Phillips2012) and find no relationship between the initiative process and policy congruence. Matsusaka (Reference Matsusaka2010), on the other hand, finds higher rates of policy congruence in initiative states on 10 policy issues. Matsusaka (Reference Matsusaka2018a) examines the divergent findings through a replication of Lax and Phillips’s (Reference Lax and Phillips2012) results and finds that initiative states have higher levels of congruence on some issue areas, but not others.
Since the theoretical literature on direct democracy indicates that its effects depend on the institutional and political environment, these differences in findings may simply reflect this expected heterogeneity. The diffusion of recreational marijuana began with high-profile ballot initiatives in Colorado and Washington. In contrast, Vermont is currently the only noninitiative state to adopt recreational marijuana as of 2019 (NCSL 2019). This examples illustrates how the initiative process can push states to adopt a new policy when public opinion favors it, but the legislature remains cautious. In contrast, initiatives and popular referendum can also be used to block policy change, as activists have successfully demonstrated in recent years for labor policies. In 2011, voters supported a popular veto referendum on SB 5 in Ohio in 2011 and then again in 2018 with Prop A in Missouri.Footnote 4 In both cases, voters collected signatures to override the state government and prevent new policies reforming collective bargaining and right to work legislation, respectively. These successful measures sent strong signals to elites that they were out of step with voters on labor laws. On both medical recreational marijuana and labor laws, the elites were out of step with public opinion. For the case of marijuana legislation, the initiative made states more likely to adopt a policy, whereas in the case of labor laws, the initiative prevented elites from moving the status quo. While these examples highlight the potential for the initiative to have heterogeneous effects, evaluating the effect of the initiative process requires calculating its effects across a wide range of policies. Yet, despite the rich tradition of research in direct democracy, to our knowledge, no study has tested the effect of ballot initiatives on a large number of policies. Only a few studies (Lax and Phillips Reference Lax and Phillips2012; Matsusaka Reference Matsusaka2010) use more than a handful of policies to test the policy effects of direct democracy. A systematic study of hundreds of policies can allow us to identify the average effect of ballot initiatives on policy innovation, and the measure the heterogeneous effect of the initiative process in a single, unified sample.
Policy Database and Pooled Event History Analysis
To identify the heterogeneous effect of the initiative process across a large sample of policies, we draw on the SPID database (Boehmke et al. Reference Boehmke, Brockway, Desmarais, Harden, LaCombe, Linder and Wallach2018). SPID records state policy adoptions over the last 200 years for over 700 policies and has broad and fairly representative coverage of policy topic areas including criminal justice, health, education, commerce, and civil rights (Boehmke et al. Reference Boehmke, Brockway, Desmarais, Harden, LaCombe, Linder and Wallach2019). It incorporates policies that have widely diffused to all 50 states as well as policies that have only diffused to a few states. SPID therefore provides a systematic set of policies with which to evaluate the relationship between the initiative process and policy adoption. Given limitations arising from our control variables, we restrict our analysis to observations between 1972 and 2014, resulting in 546 policies and 12,164 policy adoptions across the 50 US states.Footnote 5 To our knowledge, this is roughly 10 times larger than the current largest multiple-policy analysis of the initiative’s effect (Lax and Phillips Reference Lax and Phillips2012).
The literature on policy adoption and diffusion has employed Event History Analysis (EHA) for nearly three decades since Berry and Berry (Reference Berry and Berry1990) applied it to study the adoption of state lotteries. It is appropriate for examining the binary decision of whether to adopt or not to adopt a policy (Box-Steffensmeier and Jones Reference Box-Steffensmeier and Jones2004). Failing to incorporate the timing of policy change into models evaluating the effect of the initiative process (or any other factors) risks drawing faulty conclusions. For example, if initiative states adopt a given policy more quickly than other states, cross-sectional analyses done early on will find a large effect, whereas those done later will find a smaller effect, if any, as more noninitiative states adopt. Further, failing to account for how the initiative and other covariates change over time can lead to misattribution of effects. The literature on the effect of the initiative has often employed such cross-sectional approaches (e.g., Gerber Reference Gerber1999; Lascher, Hagen, and Rochlin Reference Lascher, Hagen and Rochlin1996), but some studies have utilized EHA (Boehmke Reference Boehmke2005; Schildkraut Reference Schildkraut2001).
EHA was designed to study the timing of adoption of a single event, but our analysis of the SPID data includes hundreds of policies. In order to account for differences in the determinants of adoption across these polices, especially for the initiative process, we turn to a recent variant of EHA, PEHA. PEHA joins multiple policies into one model to leverage the common features of adoption across policies while also providing opportunities to capture heterogeneity across policies (Kreitzer and Boehmke Reference Kreitzer and Boehmke2016). Casting PEHA as a multilevel model offers a variety of ways to account for heterogeneity across policies or states. Of most interest here, differences across policies can be permitted by random or fixed effects, random coefficients, or with explicit interactions (Kreitzer and Boehmke Reference Kreitzer and Boehmke2016). In contrast to standard EHA models, the unit of analysis is state-policy-year, so the dependent variable is the probability a state adopts a particular policy in a given year (adoption is a binary indicator). Similar to standard EHA, a policy does not enter the dataset until the first state adoption of that policy. Once this occurs, all nonadopting states enter the risk set and with the adoption variable coded zero until the year they adopt the policy. After adoption, all future state-policy-year observations are dropped as the state is no longer at risk of adopting the policy.
Our analysis of the data proceeds in three steps corresponding to increasingly heterogeneous PEHA specifications. Our first models assume a consistent, homogeneous effect of the initiative process across policies. This allows us to recover an estimate of the average effect across policies: does the initiative generally tend to increase, decrease, or not influence the rate of policy adoption? This effect is of interest since it captures the overall net effect of the initiative process. Since theoretical accounts suggest a heterogeneous effect, we then allow the effect of the initiative to vary randomly across policies via a random coefficient. With this specification, we can identify the average effect of the initiative across hundreds of policies as well as the variation of this effect across policies. These quantities allow us to explicitly test for heterogeneity and then examine the estimated distribution to determine its range across policies. Finally, we allow the effect of the initiative process to vary with voter ideology. We do so both with separate EHA models and via a PEHA model that allows for three distinct effects of the initiative-ideology interaction: one for policies favored by conservative states, one for those favored by liberal states, and one for policies with no apparent ideological appeal. We do this to determine whether the initiative merely changes the average baseline chance of adoption or whether it enhances the effect of public opinion. A single interaction across all policies would tend to average out such differences if they depend on the ideological appeal of a given policy.
Our primary variable for testing these effects is a binary indicator that distinguishes between initiative and noninitiative states,Footnote 6 but we include additional variables to account for differences in the initiative process across states. To test the modifying effects of the costs of qualifying and passing a measure, we include the signature requirement for qualification and an indicator for geographic distribution requirements, both taken from the Book of the States. The signature requirements variable is an average of the constitutional and statutory initiative signature requirements, if states permit both. The lower the signature requirements, the easier it is for proponents to place an initiative on the ballot, making the threat of initiatives stronger and more credible. We expect the effect of signatures and distribution requirements to work in the opposite direction of the binary initiative indicator: a positive indicator should match with a negative effect of these cost variables that reduces the former toward zero. We include these institutional features themselves rather than a measure of the number of ballot items since we want to test both the direct and indirect effects of the initiative on policy. Since the indirect effect operates without producing ballot measures, we would not capture it by counting ballot items.Footnote 7
We also include a series of controls common in the policy adoption literature. These fall into two categories: internal and external determinants. Internal determinants typically seek to capture the presence of resources that allow states to explore and adopt new policies (Berry and Berry Reference Berry and Berry1990) as well as policy-specific measures of policy demand or need. Given our wide range of policies, we focus on variables related to resources and need such as total population, state income per capita, unified party control, and both dimensions of legislative professionalism from Bowen and Greene (Bowen and Greene Reference Bowen and Greene2014). The first dimension of legislative professionalism is similar to Squire’s (Reference Squire2007) index of legislative professionalism and high levels are associated with high salaries. The second dimension captures differences among professionalized legislatures with high values indicating an emphasis on legislator resources (such as staff) and low values indicating professionalized states with relatively long legislative sessions. We also include measures of change in population and change in income to capture that quickly growing state may be more innovative to adapt to changing economic and social conditions. We also include a measure of change in party control of a state as an incoming party may try to implement a new policy agenda to reflect their partisan preferences. To capture public ideology, we use Caughey and Warshaw’s (Reference Caughey and Warshaw2018) measure of citizen social policy liberalism.Footnote 8 The measure of public liberalism was generated from over 1.5 million survey responses on hundreds of topic areas to create dynamic state-year estimates for the entire time period. Since we expect ideology to have differing effects across policies (even when not incorporated into the effect of the initiative process) we follow Kreitzer and Boehmke (Reference Kreitzer and Boehmke2016) by including a random coefficient for ideology. Lastly, we include a measure for unified control of state governments to account for the potential advantage of single-party control for moving the policy status quo (Klarner Reference Klarner2013).
Studies of policy diffusion have long acknowledged that states look to each other when determining what legislation to pass (Walker Reference Walker1969). While not the focus of this study, we want to control for such forces in explaining adoption in order to estimate the effect of the initiative process. Policy diffusion scholars have identified geographic contiguity as a strong proxy for the social learning and economic competition forces that underlie diffusion (Berry and Berry Reference Berry and Berry1990; Mooney Reference Mooney2001; Walker Reference Walker1969). Since initiative states exhibit positive spatial clustering, we want to rule out diffusion via contiguity as a cause of changes in adoption timing in initiative states. However, recent research finds that contiguity is an insufficient measure for representing all ties between states and identifies a broader latent diffusion network that reflects state political and demographic similarity more so than contiguity (Desmarais, Harden, and Boehmke Reference Desmarais, Harden and Boehmke2015). As with contiguity, we measure the influence of these persistent diffusion ties with a count of adoptions by connected states. Following Boehmke et al. (Reference Boehmke, Rury, Desmarais and Harden2017), we apply the decay parameter implied by the latent network estimates such that recent adoptions by a state’s sources matter more than preceding adoptions.
In addition to these substantive and theoretically-motivated variables, we include additional controls for time and policy differences. We account for time trends in two ways: an overall time effect via year fixed effects and duration dependence with a cubic polynomial of the duration for which a state has been at risk of adopting a policy. We initially model policy differences through random effects before moving to fixed effect specifications, which make it easier to model and interpret heterogeneity in the effect of the interaction between the initiative and ideology across policies. In contrast to the fixed effects specifications, random effects are assumed to be independent from the included covariates and the policy-state-year errors, but we note that using fixed effects for these initial models did not meaningfully change the results.Footnote 9
Pooled Event History Analysis of Initiative’s Effect
Average Effect of the Initiative
Table 2 reports the results from our first series of PEHA models. All include random coefficients by policy for citizen ideology to account for the different effect of ideology across policies. The first two models capture the average effect of the initiative across policy areas while the second two models account for heterogeneity in this effect through a random coefficient for the initiative process indicator. The first model tests our first two hypotheses with controls for the initiative process and the signature requirement. The second model adds in the presence of a distribution requirement. Both show positive and significant effects for the presence of the initiative process, and negative and significant coefficients for the cost of proposal variables (we use
 $ \alpha =0.01 $
as our significance level for all tables). We run these models separately to highlight the effect of the distribution requirement, which has been shown to greatly affect initiative use but has rarely, if ever, been included in studies of the effect of the initiative process on policy outcomes. We find a large and negative effect that reduces much of the influence of the initiative. Further, adding this variable increases the coefficient for the initiative process since it now captures its influence among states without distribution requirements. We interpret these results substantively in a moment, but first note that the control variables largely perform as expected, with internal variables measuring change in population and a new party taking control increasing the probability of adoption and those for external forces indicating positive and significant state-to-state diffusion.Footnote
10
Pooled event history analysis (PEHA) of the effect of the initiative process on policy adoption

Note: PEHA includes 594 policies with policies as the group level and fixed effects for year.
* p < 0.01.
Fully interpreting the influence of the initiative process requires accounting for the multiple variables that measure its effect. To that end, Figure 1 plots the combined effect of the initiative process across the range of signature requirements and for a hypothetical state with and without a distribution requirement. The plot on the left shows the effect on the latent variable scale and its 95% confidence interval for nondistribution requirement states. This effect stays positive over all values of the signature requirement variable and the confidence interval excludes zero up to a requirement of about 14%. As the bar plot of the joint distribution of signature and distribution requirements shows, nearly all of the state-year observations for these states fall below 14%. The plot on the right conveys very different results. In states with distribution requirements, the effect of the initiative process as a whole is positive until signatures reach 8% but its 95% confidence interval only excludes zero when signatures are either below one or above 13%.
Marginal effect of the initiative process by signature and distribution requirements.
Note: Plot depicts the marginal effect of the initiative process on the latent scale of the probability of adoption:
 $ {\hat{\beta}}_I+{\hat{\beta}}_{\mathrm{Sigs}}\times \mathrm{Sigs}+{\hat{\beta}}_{\mathrm{Dist}}\times \mathrm{Dist} $
. Shaded area represents a 95% confidence interval. Bar plot depicts the joint distribution of signatures and distribution requirement.
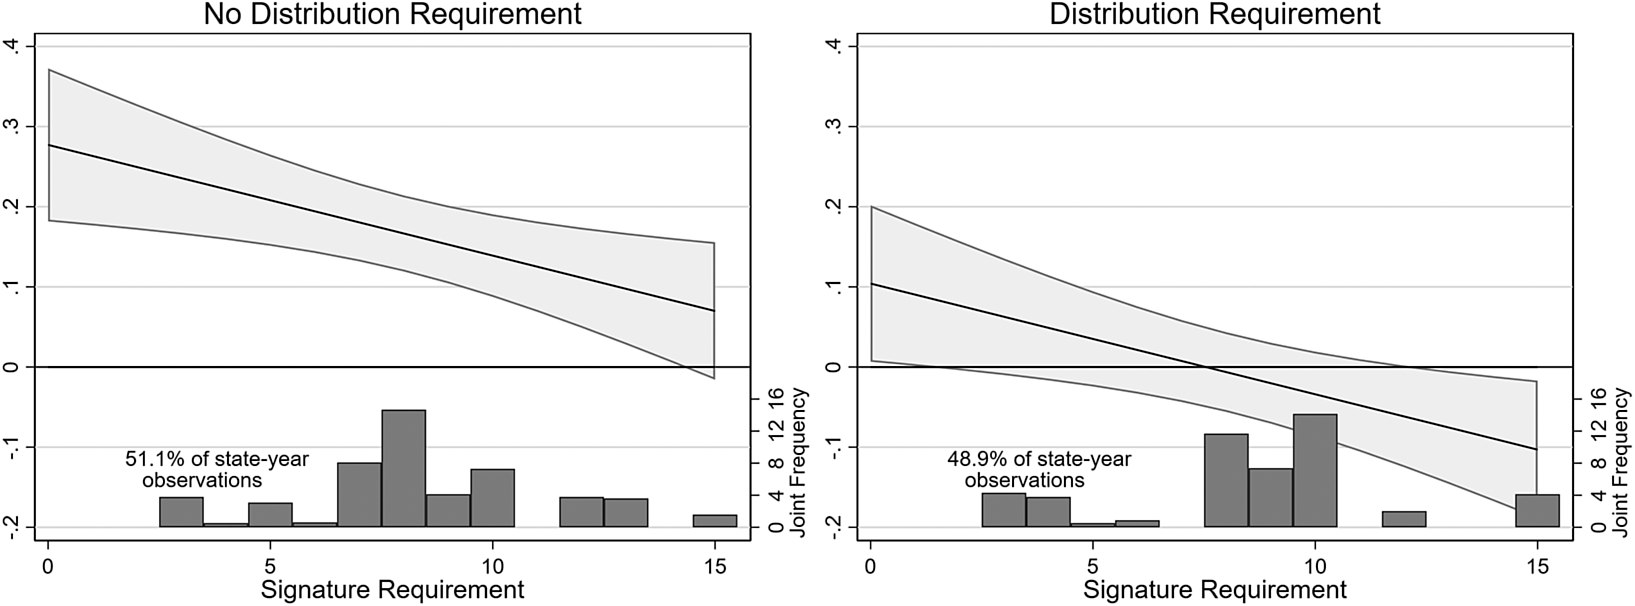
While these results provide evidence that the initiative has a statistically significant average effect across policies, we also want to evaluate the substantive effect of the initiative process. To do so, we ran a series of predicted value and first difference calculations based on the second model.Footnote 11 These calculations put the probability of adoption without the initiative process at 5.6% and the probability of adoption with a 5% signature requirement and no distribution requirement at 6.7%; that drops to 6.3% when we set signatures to 10%. Adding a distribution requirement leads to corresponding probabilities of 5.8% and 5.4%, respectively. The latter results confirm Figure 1’s indication of a reduction in the probability of adoption for the one in 10 initiative states with a distribution requirement and high signature requirements. For the other 90% the first difference corresponds to a fairly sizable 10%–20% increase relative the baseline in states without a distribution requirement. Additionally, this represents a single-year effect that will accumulate over successive years—as well as across states via diffusion effects—so a modest gap in the first year grows to become even more substantively important over multiple years measured by the cumulative probability of adoption.
The next two models allow for heterogeneity in the estimated effect of the initiative process across policies by estimating a random coefficient by policy for the initiative indicator variable. This provides an estimate of the mean of the coefficient, but also provides an estimate of how much this effect varies across policy areas; together, these two parameters describe the distribution of the initiative’s effects across policies. As before, the random coefficients are assumed to be independent from the included covariates and errors; in a subsequent analysis we models these differences with fixed effects. In the first specification we omit the signature and distribution requirement variables to simplify interpretation of the random coefficient. In this and the next model that includes them, the initiative continues to exhibit a positive coefficient. The magnitude shrinks in the first model—this is as expected since the indicator has to capture the average effect rather than the effect with a signature requirement of zero and no distribution requirement. The variance component for the model with signature and distribution requirements reveals a substantively and statistically significant variation in the estimated coefficient across policies with a large effect relative to the fixed coefficient. A 95% confidence interval for the distribution of the initiative coefficient across policies ranges from −0.14 to 0.71 in the fourth model.
With considerable evidence that effect of the initiative differs from zero and varies across policies, we want to take a moment to address the possible endogeneity of the initiative process itself. Prior studies have, after all, examined the adoption of the initiative process (Smith and Fridkin Reference Smith and Fridkin2008) just as we study the adoption of other polices. If innovative states adopt the initiative process as they do other policies, then perhaps it is not the initiative process itself that affects policy adoption in our models, but some other, unmeasured factor(s). The literature has not found an easy way to address this problem given little variation in the presence of the initiative process within states, but we identify some strategies relevant to our application. First, the vast majority of initiative states added the process in the first quarter of the 20th century whereas the data from our analysis comes 50–100 years later. We therefore suspect that states have changed substantially over that time period and that innovativeness in the early 1900s is unrelated to innovativeness half a century later. The data support this intuition: the correlation in the SPID data between dynamic policy innovativeness and its 50-year lag is −0.02. Second, if we account for innovativeness from the early 1900s in our PEHA models it does not predict adoption nor does it change our findings about the effect of the initiative process.Footnote 12 Third, we also ran models that excluded combinations of the five initiative states that adopted after 1924. Except for some results for the signatures variable, these models produced similar results to those reported here.Footnote 13
Initiative Heterogeneity Based on Ideology
Our next approach seeks to unpack the heterogeneity we observe in the effect of the initiative across polices by focusing on how the initiative can moderate the effect of ideology on policy adoption. As discussed earlier, the initiative has the potential to increase ideological congruence between the public and state policy. While we do not have measures of ideal points for all relevant actors, we can evaluate the effect of ideology on the probability of adoption, and how the initiative may moderate that effect. If a state’s policies are too conservative for the public, then the initiative should strengthen the effect of public liberalism on the probability of adoption as it pushes the state to become more in line with the public. Depending on the configuration of preferences, the initiative has the potential to strengthen or weaken the effect of ideology on policy adoption.
This conditional effect of the initiative is traditionally evaluated in the literature with an interaction between the initiative process indicator and an included measure of public preferences. When the initiative indicator differs from zero, this provides evidence that initiative states adopt a policy at a greater or lower rate than noninitiative states. When the coefficient on the interaction differs from zero, this provides evidence that the presence of the initiative process alters policy responsiveness. Since our analysis includes hundreds of policies, applying this approach would almost surely not work: if the initiative leads to a greater adoption rate for liberal states for some policies and for conservative states for other policies then the average effect may be zero. We therefore need to adapt this approach for the PEHA context.
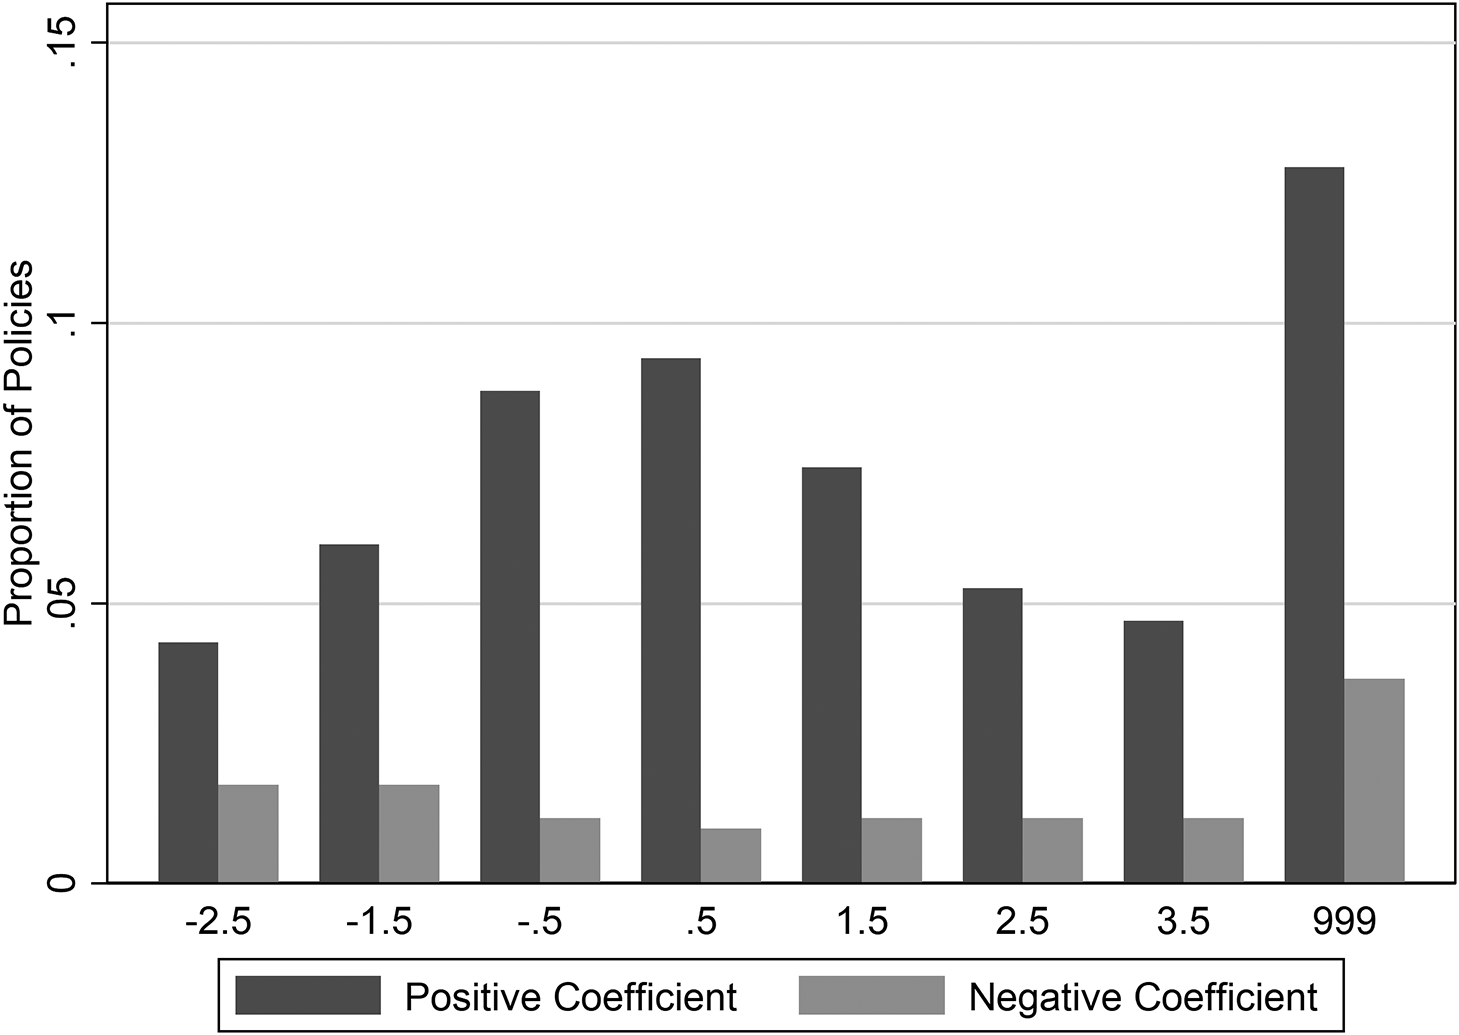
We do so in two ways. First, we mimic the results of separate EHA models by estimating different coefficients for each policy for the initiative, ideology, and the interaction of two. We do so by interacting these variables with a set of policy fixed effects while including the same controls in Table 2. This allows us to evaluate the policy-specific effects of the initiative, as well as the initiative’s potential moderating effect on citizen ideology while still estimating a pooled model to understand the initiative’s overall effect. Rather than reporting these results in detail, we summarize them by focusing on the significance of the initiative process, which depends on both the initiative process indicator and its interaction with ideology.Footnote 14 We estimate the marginal effect of the initiative at values of public social liberalism ranging from −2.5 (very conservative) to 3.5 (very liberal). This covers the range of values in our sample. We then report for each value of ideology the proportion of policies for which the marginal effect produces a positive or negative and significant estimate, with the latter determined by its 95% confidence interval.
Figure 2 reports these proportions. The greater height of the dark gray bars indicates that the effect tends to be significant and positive more often than negative across the entire ideological spectrum, roughly three times as often. This comports with the positive average effect found earlier. The figure also reveals that the direction of the initiative’s influence varies considerably between liberal, moderate, and conservative states: conservative states have more balanced positive and negative shifts while moderate and liberal states exhibit a more consistently positive effect. Put differently, this means that the initiative process tends to increase the probability of adoption for any value of ideology but that when it does deter policy change it does so disproportionately among conservative states. The final bar reports the proportion of policies that produce a significant effect for at least one of the six values of ideology. A positive effect occurs in nearly 13% of policies and a negative effect occurs in nearly 4%, indicating that the initiative influences the adoption of almost one in five policies.
Proportion of policies with significant estimated effects of the initiative by social policy liberalism and sign of the effect.
Note: Results indicate the proportion of policies for which the 95% confidence interval of the linear combination of the initiative process and its interaction with citizen ideology excludes zero. Positive coefficients indicate that the chance of adoption increases with citizen ideology; negative coefficients indicate it decreases with citizen ideology.
Our second approach seeks a middle ground between the policy-by-policy interactions above and the standard ideology-initiative interaction used in single-policy EHA studies. As we discussed earlier, including a single interaction in our PEHA model would likely obscure evidence of a conditional effect given the underlying heterogeneity across policies. But we can use the results from our policy-by-policy interactions to identify different categories of effects and then pool within them but not across them. We then evaluate whether the initiative conditions the relationship between ideology and policy within these categories. This allows us to continue to leverage our large sample of policies to more precisely estimate these heterogeneous effects while still capturing fundamental differences in the effect across groups of policies.
The literature suggests that the initiative enhances responsiveness. We therefore group policies based on the directional effect of ideology. To determine the direction of this effect, we use our previous set of models, which produce distinct coefficients for the influence of ideology on adoption for each policy. We group policies by the sign and magnitude of the coefficient for noninitiative states since it excludes the additional effect of the initiative process that we want to examine. Our groupings capture whether the coefficient indicates that more liberal states prefer the policy (
 $ \hat{\beta}\ge 0.25 $
), whether conservative states prefer the policy (
 $ \hat{\beta}\le -0.25 $
) or whether the state ideology has little or nor effect on adoption (
 $ -0.25<\hat{\beta}<0.25 $
).Footnote
15 We then estimate a PEHA model that estimates differences in the baseline probability of adoption and separate effects of ideology within these three groupings. We similarly include separate effects of the initiative process and its interaction with ideology for all three groupings. This allows us to capture the underlying ideological appeal of a policy and to determine whether the initiative process has distinct effects based on that appeal.
Table 3 reports this results, but they are best interpreted graphically given the many interactions. Figure 3 therefore shows the predicted probabilities and 95% confidence intervals of policy adoption for initiative and noninitiative states across all three policy categories: conservatism increases the baseline probability of adoption in the left panel while liberalism increases it in the right panel; citizen ideology has no effect in the middle panel. Below these probabilities, we also plot the density of ideology within the subset of observations contained by each grouping. We shade these densities by whether the 95% confidence interval of the effect of the initiative given ideology excludes zero.Footnote 16
Pooled event history analysis (PEHA) of the effect of the initiative process by the ideological direction of policies.

Note: Pooled event history analysis includes 438 policies with policies as the group level and fixed effects for year.
* p < 0.01.
Effect of the initiative process on the probability of adoption by the ideological effect of policies.
Note: Results show the probability of adoption for a hypothetical initiative state and its counterfactual probability of adoption without the initiative process. Predicted probabilities and confidence intervals calculated using the margins command in Stata, which sets the random effects to zero. Other variables set to their median values. Regions for which the marginal effect of the initiative process achieves significance at the 0.05 level or better correspond to the black shaded regions of the kernel density plot. Kernel density plots represent the distribution of ideology within the estimation sample for the subset of policies coded into each of the three ideological effect categories. Percentages indicate the percentage of observations within each region; percentages may not add to 100% due to rounding.
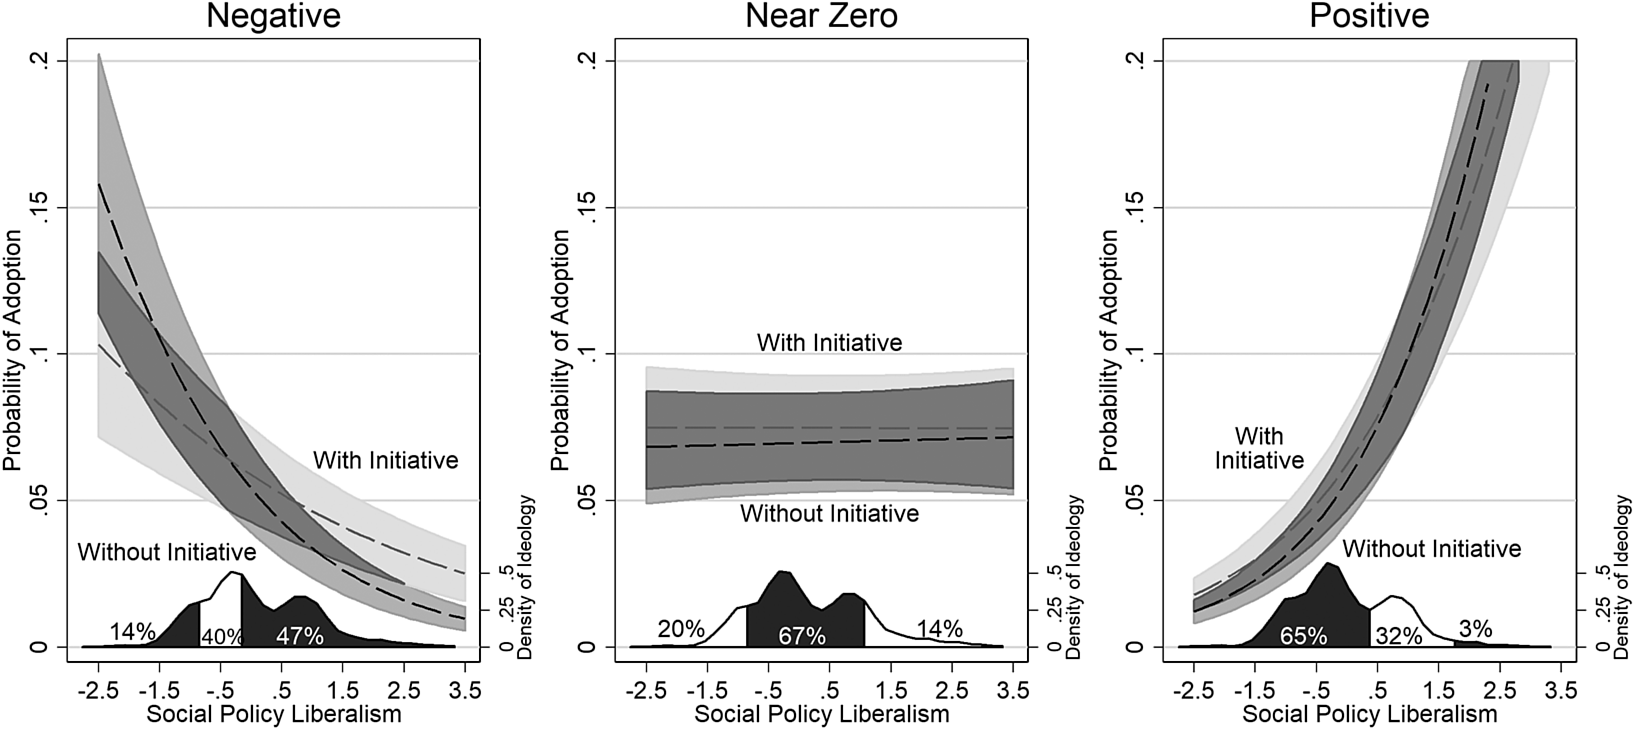
The graphs produce two primary findings. First and foremost, the initiative significantly increases the chance of policy adoption in 61% of the cases in our data. In contrast, it significantly decreases the chance of adoption in just under 5% of the cases. This ratio matches what we found in our previous figure, but by pooling, we achieve a more precise estimate. It also shows that the effect of the initiative works in the opposite direction for negative and positive policies among conservative and liberal states, supporting our supposition that we might uncover no effect if we estimated a single interaction among all the policies. This pattern of positive and negative effects points to the second interesting finding: among ideological policies the initiative tends to increase the chance of adoption when that chance is low or moderate and decreases it only when it is relatively large. One might suspect that functional form produces this feature, but additional analyses that allowed for nonlinear relationships recovered the same pattern. Among nonideological policies the effect remains positive for all values of ideology. We return to this finding in our discussion.
Discussion and Conclusion
Our findings support theoretical arguments that the initiative process ought to have a complex effect on policy adoption. It may increase, decrease, or have no effect on the probability of adoption. The precise effect varies with the configuration of voter and legislative preferences and with features of the initiative qualification process itself. Because previous studies typically rely on a single policy or a small, coherent group of policies they have produced divergent findings. We have attempted to bring this range of effects into a unified picture by modeling the initiative’s effect across hundreds of policies. This allows us to capture the average effect and to let it vary systematically across policies. Our analysis produces a few important findings.
First, we find evidence of a positive average effect over the last 40 years. This represents an important starting point since the possible range of predicted consequences includes both positive and negative effects and empirical evidence for even a single policy can produce different directions in different eras (Matsusaka Reference Matsusaka2004). Thus, over a long time period, the initiative process appears to have increased state policy innovativeness. And since policies tend to diffuse across states the presence of the initiative process in one state will increase the chance of adoption in connected states and will radiate further through those states’ connections. Yet high hurdles for ballot qualification reduce and even eliminate this positive effect: our results show that states with a distribution requirement or those without one that have a very large signature requirement experience no net increase in the rate of policy adoption relative to noninitiative states. Interest in such higher hurdles has grown in recent years. While signature requirements see only small changes in our data (the national mean changes by less than half of a percent), states have recently started increasing requirements to make it more difficult to qualify initiatives. Just last year, the Maine legislature narrowly failed to pass a constitutional amendment that would have created a new statewide distribution requirement.Footnote 17 In 2018, a bill was introduced in Oklahoma to require that the statewide signature thresholds—currently 8% for statutory and 15% for constitutional measures—be met in every county.Footnote 18 In contrast to these legislative efforts, studies of the effect of the initiative process on policy, citizen participation, or public opinion have tended to focus more on the signature effect alone. Our results indicate both matter and distribution requirements perhaps more so.
Second, we find evidence of extensive heterogeneity across policies underlying this positive average effect. We do so initially by estimating a multi-level model with a random coefficient for the presence of the initiative process and find that the standard deviation of this coefficient nearly matches its magnitude. Thus, the effect varies from slightly negative to almost twice as large as the overall average across policies. Again, this underscores the prediction that the consequences of the initiative process will vary across policies and states based on their configuration of political preferences and fits with the empirical evidence’s wide range of findings. These findings help explain the conflicting findings on the role of the initiative and policy adoption and highlight the need for a systematic test of the initiative across a large sample of policies and over time.Footnote 19
Lastly, we find that the heterogeneity in the effect of the initiative process arises in part through the conditioning of its effect via public preferences. Policy adoptions reflect the general ideological proclivity of citizens in a state but the degree of reflection will change in states with the initiative process since it makes it harder for policymakers to maintain divergent policies. By varying the effect of preferences by policy and by the presence of the initiative process we find that about 14% of policies show an increased chance of adoption in initiative states while 4% show a decreased chance. The increase tends to happen more with liberal preferences while the decrease occurs more often for conservative preferences.
We attempt to better understand this pattern by partitioning policies into liberal, nonpartisan, and conservative groupings based on the ideology of states most likely to adopt them. This analysis reconfirms the generally positive effect of the initiative, but reveals an intriguing pattern. For ideological policies the initiative process tends to reduce the influence of ideology on adoption: states that are less likely to adopt become more likely with the initiative whereas states that are more likely to adopt become less so. For nonpartisan policies the effect is already flat; adding the initiative produces a consistent increase in the probability of adoption for all values of ideology.
We find these results intriguing for two reasons. First, in the absence of ideological effects the initiative appears to increase policy innovativeness. When public opinion provides neither a push nor a check on a new policy, the initiative process makes it more likely that a state will experiment and try the new policy. In some sense one can think of this as a “pure” test of the effect of the initiative since it abstracts from its theorized role of bringing policy into line with opinion (Gerber Reference Gerber1996; Leemann and Wasserfallen Reference Leemann and Wasserfallen2016) thereby isolating its procedural function as one more way to change policy. Second, on ideological policies the initiative has generally been thought of as a way to more quickly translate favorable preferences into policy change. Yet our results show that the initiative tends to produce greater uniformity in policy adoptions across states than this would suggest by reducing the chance of adoption for ideologically favorable states and increasing it for ideologically unfavorable states. Our data do not tell us whether the difference constitutes an improvement or a deterioration in representation but the result warrants further exploration, both for its theoretical import and for its substantive policy implications for how the initiative changes state policies.
Data Availability Statement
Replication materials are available on UNC Dataverse at https://doi.org/10.15139/S3/2JN1IR.
Acknowledgments
The authors would like to thank Daniel Lewis for valuable feedback at the 2018 Midwest Political Science Association Conference.
Funding Statement
Funding for this research provided by NSF grants #1558509 and #1637095.
Conflict of Interest
The authors declared no potential conflicts of interest with respect to the research, authorship, and/or publication of this article.
Author Biographies
Scott J. LaCombe is an assistant professor of Government and Statistical and Data Sciences at Smith College. His research focuses on institutional design, policy responsiveness, and policy diffusion in the American states.
Frederick J. Boehmke is Professor of Political Science at the University of Iowa and Director of the Iowa Social Science Research Center. His research focuses on the effect of direct democracy on interest groups and the diffusion of policies across the American states.



