Introduction
Fertility transition and socioeconomic development are concomitant across and within countries. Fertility reduction is mainly driven by four factors: the pace of social and economic development, the pace of change in economic aspiration and expectation, the pace of provision of birth control services and the pace of reduction of the moral and social cost of birth control (Casterline, Reference Casterline2001). Globally, more than half of countries have reached the replacement level of fertility and have made significant improvement in key domains of human development. Global TFR declined from 3.3 in 1990 to 2.4 in 2018 (World Bank, 2020). Life expectancy at birth increased from 65.4 years in 1990 to 72.6 years by 2018 and the Gross National Income per capita (constant 2017 PPP $) increased from US$9833 in 1990 to US$16,550 by 2017 during the same period (World Bank, 2020). The average years of schooling for those aged 15 years and above increased from 6.14 to 8.4 years (Barro & Lee, Reference Barro and Lee2013; World Bank, 2020). The global composite index of human development (Human Development Index, HDI) moved from 0.598 in 1990 to 0.731 by 2018 (UNDP, 2019).
The relationship between fertility and development has been a long-standing issue among demographers, economists, sociologists and other social scientists. A large body of literature has examined the association between fertility and socioeconomic development at varying geographical and individual units. The general pattern of the association between socioeconomic development and fertility is negative (Shin, Reference Shin1977; Bongaarts & Watkins, Reference Bongaarts and Watkins1996; Poston, Reference Poston2000; Potter et al., Reference Potter, Schmertmann and Cavenaghi2002; Bryant, Reference Bryant2007; Brinker & Amonker, Reference Brinker and Amonker2013; Ryabov, Reference Ryabov2015). A number of studies have also found weak associations between socioeconomic development and fertility across varying geographical settings (Coale & Watkins, Reference Coale and Watkins1986; Cleland & Wilson, Reference Cleland and Wilson1987). While development continues to promote fertility reduction at low and medium levels of HDI, at advanced levels the relationship between fertility and development is weak (Wilson & Airey, Reference Wilson and Airey1999; Myrskylä et al., Reference Myrskylä, Kohler and Billari2009; Fox et al., Reference Fox, Klüsener and Myrskylä2019). A convex relationship between Gross Domestic Product (GDP) per capita and fertility has been observed among Organization for Economic and Co-operation and Development (OECD) countries (Luci-Greulich & Thévenon, Reference Luci-Greulich and Thévenon2014). Recent evidence also suggests a positive association between fertility and development at high levels of development (Myrskylä et al., Reference Myrskylä, Kohler and Billari2009; Furuoka, Reference Furuoka2009; Myrskylä et al., Reference Myrskylä, Kohler and Billari2011; Esping-Andersen & Billari, Reference Esping-Andersen and Billari2015; Goldscheider et al., Reference Goldscheider, Bernhardt and Lappegård2015).
The fertility–development relationship appears to be bi-directional, context-specific, multi-phased and often inconsistent over time (Boudon, Reference Boudon1983; Bulatao and Lee, Reference Bulatao, Lee, Bulata and Lee1983; Galloway et al., Reference Galloway, Hammel and Lee1994; Hirschman, Reference Hirschman1994; Bongaarts & Watkins, Reference Bongaarts and Watkins1996; Mason, Reference Mason1997; Drèze & Murthi, Reference Dreze and Murthi2001; Potter et al., Reference Potter, Schmertmann and Cavenaghi2002; Bryant, Reference Bryant2007; Harttgen & Vollmer, Reference Harttgen and Vollmer2014; Ryabov, Reference Ryabov2015; Fox et al., Reference Fox, Klüsener and Myrskylä2019). Low fertility is conducive to the process of development. A certain level of socioeconomic development is necessary for the onset of fertility transition and a sustained decline in fertility over time (Pathak & Murthy, Reference Pathak and Murthy1984; United Nations, 1995; Bongaarts & Watkins, Reference Bongaarts and Watkins1996; Bryant, Reference Bryant2007). Socioeconomic change modifies the incentives to have children, stimulates new ideas about childbearing and allows woman to achieve better access to contraceptive methods. On the other hand, high fertility leads to lower per capita income, lower savings and investment, low educational attainment and slow economic growth in many developing countries. While many countries in sub-Saharan Africa have had a high level of fertility that has inhibited their level of socioeconomic development, many countries in Europe, America, Australia, New Zealand and parts of Asia are facing an increase in old-age dependency, with increased health care spending and pension costs, which adversely affect their economic growth. A few studies have also suggested that the development scores among countries commencing fertility transition have fallen over time (Bongaarts, Reference Bongaarts2002). The timing of the onset of fertility decline and the pace of fertility transition varies across and within countries, and some may have witnessed the weakening of the association between fertility and development over time (Bongaarts & Watkins, Reference Bongaarts and Watkins1996).
In India, fertility transition began in the 1970s and fertility approached replacement level by 2016. The TFR in India declined from 5.2 in 1971 to 3.2 in 2000 and to 2.3 by 2016 (ORGI, 2016). In 2016, 18 out of the 29 states of India had reached the replacement level of fertility (ORGI, 2016). The HDI of India moved from 0.428 in 2001 to 0.728 in 2018 (UNDP, 2019). Of all the states and union territories, thirteen now have a high level of human development (UNDP, 2019). Since the launch of the National Health Mission in 2005, India has recorded faster improvement in socioeconomic development and a rapid decline in fertility level. There has been a substantial improvement in the overall health of the population: an increase in life expectancy, reduction in maternal and under-five mortality and improvement in maternal health care. The institutional delivery rate increased from 39% in 2005 to 79% in 2016. The infant mortality rate declined from 134 per 1000 live births in 1971 to 37 in 2016. Educational progress has also been noteworthy, with the mean years of schooling increasing from 1.9 years in 2005–06 to 4.4 years in 2016 (IIPS & ICF, 2017). The country achieved over 6% growth in GDP and reduced the poverty level by half in the last decade (from 37.2% in 2004–05 to 21.9% by 2011–12) (Planning Commission of India, 2014). However, these national estimates mask enormous disparities at the sub-national level.
Fertility transition and socioeconomic development in India exhibit varying patterns across states. The developed states of India, such as Kerala and Tamil Nadu, and the union territories of Delhi, Pondicherry and Chandigarh, attained the below-replacement level of fertility over a decade ago, and some of the less-developed states, such as Odisha and Andhra Pradesh, also approached below-replacement level fertility. States such as Uttar Pradesh and Bihar continue to have low socioeconomic development and high fertility, and account for around a quarter of India’s total population. Though regular estimates of fertility and development indicators for the states of India are available, there is limited information for the districts of India.
Indian districts are at varying stages of fertility transition and provide an ideal setting to study the fertility and development relationship due to their size, diversity and disparity in the socioeconomic development. These are the ultimate administrative units of decentralized planning. Districts serve as the bridge between state and household, are culturally homogeneous and still show considerable variations in their demographic features. With growing availability of viable and reliable data based on socioeconomic development at the district level, the number of district-level analyses has been growing. Prior studies have largely been confined to examining geographical variations in fertility levels (Bhat, Reference Bhat and Srinivasan1996; ORGI, 1997; Das & Mohanty, Reference Das and Mohanty2012; Kumar & Sathyanarayana, Reference Kumar and Sathyanarayana2012; Guilmoto, Reference Guilmoto, Guilmoto and Vaguet2000, Reference Guilmoto, Guilmoto and Rajan2005, Reference Guilmoto, Guilmoto and Jones2016; Guilmoto & Rajan, Reference Guilmoto and Rajan2002, Reference Guilmoto and Rajan2013). A few studies assessed the association of fertility and socioeconomic development and with other proximate determinants at the district level (Malhotra et al., Reference Malhotra, Vanneman and Kishor1995; Murthi et al., Reference Murthi, Guio and Dreze1995; Drèze & Murthi, Reference Dreze and Murthi2001; Bhattacharya, Reference Bhattacharya2006; Mohanty et al., Reference Mohanty, Fink, Chauhan and Canning2016a; Singh et al., Reference Singh, Kumar, Pathak, Chauhan and Banerjee2017). The majority of these used limited variables and are now at least two decades old. Many examined the fertility–development association at a time when fertility levels were quite high across districts and socioeconomic development was low. To the authors’ knowledge, there have been only limited studies focusing on the temporal patterns of socioeconomic development and fertility relationship among Indian districts. This study therefore aimed to provide a comprehensive assessment of fertility and development association across Indian districts, with a specific focus on the association between fertility change and socioeconomic development.
Methods
Data
A district-level data file was prepared by estimating and compiling various indicators from different sources at two points in time: 2001 and 2016. The main data sources were: 1) the 2001 and 2011 Censuses of India (Census of India, 2001, 2011); 2) the District Level Household and Facility Survey (DLHS)-2, 2002–04; and 3) the National Family Health Survey (NFHS)-4, 2015–16. In addition, data from other published sources were used (Planning Commission, Government of Uttar Pradesh, 2008; Mohanty & Rajbhar, Reference Mohanty and Rajbhar2014; YASHADA, 2014; Mohanty et al., Reference Mohanty, Govil, Chauhan, Kim and Subramanian2016b; Bora & Saikia, Reference Bora and Saikia2018; Chatterjee & Mishra, Reference Chatterjee, Mishra, Mohanty, Mishra and Chauhan2019). A detailed description of the data sources used in analysis is presented in Table 1. The unit of analysis was ‘district’. The 2001 Census of India reported 593 districts, and the 2011 Census of India 640 districts. The NFHS-4 was also conducted using the Census of India 2011 frame and covered all 640 districts. In this study, analysis was done for all 640 districts for which Census of India 2011 and NFHS-4 information was available. To make the number of districts uniform at 640 for 2001 and 2016, the estimates of parent districts were used from which new districts were carved out between 2001 and 2016.
Variables, data sources and descriptive statistics of variables used in the analyses for 640 districts of India, 2001–2016

DDI is a summary measure of average achievement in the key dimensions of human development: health, social and economic. The upper limit of percentage of children underweight was fixed at 80%. Five districts with more than 80% underweight children in 2001 were truncated at 80. The under-five mortality rate for Thrissur district of Kerala was replaced with 7 (state-level value) as it was estimated as 0 for 2016. The MPCE was available for 623 districts. DDI for districts with missing data on MPCE or/and underweight (DLHS-2) children was computed using all other variables.
Outcome variable
The outcome variable was Total Fertility Rate (TFR). The TFR for 2016 was obtained using the direct method from the total number of births in the last 5 years preceding NFHS-4 (Schoumaker, Reference Schoumaker2013). The TFR for 2016 at the state level was validated using the 2016 Sample Registration System (SRS). The state-level correlation coefficient between the estimated TFR from NFHS-4 and that from the 2016 SRS was 0.923. The estimates of TFR for 2001 and 2011 for districts were taken from an earlier publication (Mohanty & Rajbhar, Reference Mohanty and Rajbhar2014).
Independent variables
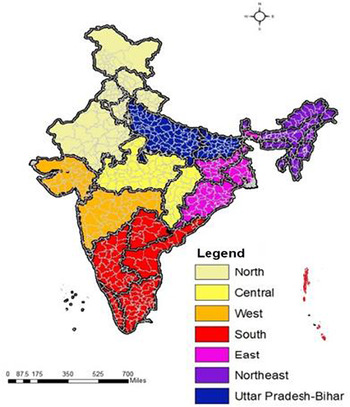
A composite index was created based on a set of independent variables in three dimensions of health, social and economic. These included under-five mortality, percentage of under-5 children underweight, school life expectancy, mean years of schooling, percentage of urban population, female work force participation, monthly per capita expenditure and percentage of agricultural labourers. The composite index was conceptualized analogous to the Human Development Index (HDI), which is a widely used summary measure of socioeconomic development. The proportion of scheduled caste and scheduled tribe populations and proportion of Muslim population in each district were also used in the regression models as controlling variables. A regional dummy was created based on the geographical regional locations of the states: Uttar Pradesh-Bihar, North, Central, West, South, East and North-East (Figure 1).
Regions of India, 2001–2016.

The definitions of the indicators included in the analysis were as follows. The TFR is the number of children who would be born to a hypothetical woman if she were to bear children according to a current schedule of age-specific fertility rate and survive until the end of childbearing age. The ‘under-five mortality rate’ is the probability that a newborn baby will die before reaching age 5, if subject to current age-specific mortality rates; the ‘prevalence of underweight children under 5 years’ has been defined as the percentage of children whose weights are less than two standard deviations below the median weight for age in the international reference population. ‘School life expectancy’ is the number of years of schooling that a child is expected to receive, assuming that the probability of his/her being enrolled in school at any particular future age is equal to the current enrolment ratio at that age. ‘Mean years of schooling’ is the average number of completed years of education that a person aged 25 years and above had received. The ‘Wealth Index’ is a composite measure of a household’s living standard calculated based on the household’s ownership of selected assets. ‘Monthly per capita expenditure’ is the per capita spending on various food and non-food items that a household incurs in a month.
Analysis
A composite index of socioeconomic development, henceforth referred to as the District Development Index (DDI), was computed based on the set of nine variables (listed in Table 1). Each of the dimensions was normalized to a unitary range between 0 and 1 using the maximum and minimum limits on each metric, also called ‘goalposts’. Where variables positively affected socioeconomic development, they were normalized using the formula:
 $$\left( {{X_i}-{X_{{\rm{min}}}}} \right)/\left( {{X_{{\rm{max}}}}-{X_{{\rm{min}}}}} \right)$$
If variables negatively affected development (e.g. underweight children, under-five mortality and share of agricultural labourers) they were normalized using the formula:
 $$\left( {{X_{{\rm{max}}}}-{X_i}} \right)/\left( {{X_{{\rm{max}}}}-{X_{{\rm{min}}}}} \right)$$
where X i is the i th value, X max is the maximum value and X min is the minimum value of each variable. The maximum and minimum values are the highest and lowest values observed among the 640 districts over the period 2001 to 2016. Following normalization, equal weights to the dimensions and equal weights to the variables within the dimensions were assigned similar to the Alkire and Foster (AF) method, which is used to estimate multidimensional poverty (Alkire & Foster, Reference Alkire and Foster2011). In general, assigning equal weights to dimensions is preferred when the chosen dimensions are of relatively equal importance. Atkinson et al. (Reference Atkinson, Cantillon, Marlier and Nolan2002) put forward that equal weighting has an intuitive appeal as ‘the interpretation of the set of indicators is greatly eased where the individual components have degrees of importance that, while not necessarily exact equal, are not grossly different’. The DDI ranges between 0 and 1. A value close to 0 implies a low level of development, whereas a value approaching 1 implies a higher level of development.
Ordinary Least Squares (OLS) regression
The cross-sectional analysis is appropriate for the initial assessment of the degree to which the relationship between fertility and development holds and how it shifts over time. In equation (4), the term DDI2 was used to capture the non-linear association between fertility and development. Two sets of regression were estimated using OLS. The models are as follows:
 $${\rm{TF}}{{\rm{R}}_{\rm{i}}} = {\rm\alpha} + {{\rm{\beta }}_1}*{\rm{DD}}{{\rm I} _i} + {\rm\beta _3}*{M_i} + {\rm\beta _4}*{S_i} + {\Sigma _{J - 1}}{Y_j}{R_{iJ}} + {\varepsilon _i} \ldots $$
 $${\rm{TF}}{{\rm{R}}_{\rm{i}}} = {\rm\alpha} + {{\rm{\beta }}_1}*{\rm{DD}}{ {\rm I} _i} + {\rm\beta _2}*{\rm{DD}}{{\rm{I}}^2}_i + {\rm\beta _3}*{M_i} + {\rm\beta _4}*{S_i} + {\Sigma _{J - 1}}{Y_j}{R_{iJ}} + {\varepsilon _i} \ldots $$
where TFRi is the total fertility rate in district i, DDI i is the district development index for district i and R i,j is a set of dummy (0,1) variables, J–1 for each district i, where R i,j takes the value 1 if district is in region j and 0 otherwise, M i is the proportion of Muslims in district i, S i is the proportion of scheduled tribes and castes in district i, α, β 1–β 4 and the Y j (j=1,… J–1) are parameters to be estimated. ϵ i is a random normally distributed error term.
Two Stage Least Squares regression
The OLS regression may not provide unbiased estimates due to endogeneity between fertility and development. In such cases, Two Stage Least Squares (2SLS) is preferred (Kennedy, Reference Kennedy2003; Greene, Reference Greene2012). The percentage of households with a toilet facility was used as an instrumental variable. This is strongly associated with developmental variables (e.g. under-five mortality) but not with fertility. Having access to drinking water or having a toilet facility at home are commonly used as instruments (Drèze & Murthi, Reference Dreze and Murthi2001). Wu-Hausman tests were performed to check for endogeneity. The 2SLS equation was:
 $${\rm{TF}}{{\rm{R}}_{\rm{i}}} = \alpha + {\beta _1}*\widehat{{\rm{DD}}}{{\rm{I}}_i} + {\beta _3}*{M_i} + {\beta _4}*{S_i} + {\Sigma _{J - 1}}{Y_j}{R_{iJ}} + {v_i} \ldots $$
 $${\widehat{\rm{DD}}{ {\rm I} _i}} = \mu + {\delta _1}*{H_i} \ldots $$
where M i is the proportion of Muslims in district i, S i is the proportion of scheduled tribes and castes in district i, H i is the proportion of households having a toilet facility, and α, μ, β 1–β 4, δ 1 and Y j (j=1,… J–1) are parameters to be estimated. ϵ i and ν i are random normally distributed error terms.
Panel regression
District-level estimates for the years 2001 and 2016 were used in the analyses. Considering the districts as subjects with varying observations over time, the data can be considered to be a panel where individual-specific heterogeneity can be taken care of. Panel data are well suited to studying the dynamics of changes or transition. By combining data in two dimensions, panel data provide more data variation, less collinearity and more degrees of freedom. Following the Hausman test, a random-effects model was used for panel data regression. Here, the district-specific effects were modelled as an additional, time-invariant error term for each district, which was estimated by the Generalized Least Squares (GLS) method. Unlike a fixed-effects model, it does not preclude the inclusion of time-invariant variables such as regions. Random-effects models further assume that the district-specific random error is uncorrelated with the other independent variables.
Let there be districts i=1,…,N nested within regions j=1,…,J and time periods t=1, 2; TFRi,t be the total fertility rate in district i in time period t; DDI i,t be the development index for district i in time period t; R i,j be a set of dummy (0,1) variables, J–1 for each district i, where R i,j takes the value 1 if the district is in region j and 0 otherwise; and T i be a dummy variable equal to 0 if the year is 2001 and equal to 1 if the year is 2016. Here, ν i is an error term which is specific to each district but constant over the two time periods (the ‘average’ error for each district); ϵ it is the difference between the actual TFR in a district in time period t and the predicted value adjusted for the average error; and ϵ it measures the amount of change over time in the TFR in each district. Then:
 $${\rm{TF}}{{\rm{R}}_{i,t}} = \alpha + {\beta _1}\,{\rm{DD}}{{\rm{I}}_{i,t}} + {\beta _2}*{M_{i,t}} + {\beta _3}*{S_{i,t}} + {\Sigma _{J - 1}}{\rm\gamma _j}{R_{i,j}} + {\beta _4}\,{T_i} + {v_i} + {\varepsilon _{it}}$$
where M i,t is the proportion of Muslims in district i at time t, S i,t is the proportion of scheduled tribes and castes in district i at time t, and α, β 1 … β 4 and the γ j (j=1, … J–1) are the parameters to be estimated.
Results
Table 1 presents the data sources, goalpost and weights used to compute the DDI. Table 2 presents the descriptive statistics of TFR and DDI for the different regions of India in 2001 and 2016.
Descriptive statistics for TFR and DDI and their correlation coefficients among regions of India, 2001–2016

DDI is a summary measure of average achievement in key dimensions of human development: health, social and economic. Figures in parentheses indicate standard deviation of estimates.
***p<0.01; **p<0.05; *p<0.1.
Validity and reliability of TFR and DDI
In 2016, the correlation coefficient of the estimated TFR from NFHS-4 and that of SRS for the major states of India was 0.923. Of the states and union territories, the estimated TFR was lowest in Goa in 2001 and 2011 (1.8 in 2001 and 1.5 in 2011) and in Sikkim in 2016 (1.1). Of the major states, Bihar consistently had the highest TFR over time (4.9 in 2001, 4.1 in 2011 and 3.6 in 2016).
As an external validation, the DDI was validated with the HDI for two different states of India, Uttar Pradesh and Maharashtra. The states were chosen as illustrative of high- and low-developed states. The HDI values were available in external sources (Planning Commission, Government of Uttar Pradesh, 2008; YASHADA, 2014). Uttar Pradesh is a less-developed state with the highest number of districts (71) and Maharashtra is a developed state with 35 districts. The correlation coefficient between the DDI for 2001 and the HDI for 2005 for Uttar Pradesh was 0.810; and that between the DDI for 2016 and the HDI for 2011 for Maharashtra was 0.902. The alpha reliability value for DDI and HDI was 0.898 in 2001 and 0.858 in 2016, suggesting that DDI captured the state of human development reasonably well. Districts with low DDI also had low HDI, while districts with high DDI were the districts with high HDI in each of the states. Gautam Buddha Nagar in Uttar Pradesh ranked highest in both DDI and HDI, followed by the districts of Lucknow and Kanpur Nagar. Conversely, Shrawasti in Uttar Pradesh ranked lowest in both DDI and HDI. The district of Mumbai had the highest DDI and HDI followed by Pune and Thane in Maharashtra. Nandurbar in Maharashtra had the lowest rank in both the HDI and DDI.
Fertility transition in districts of India, 2001–2016
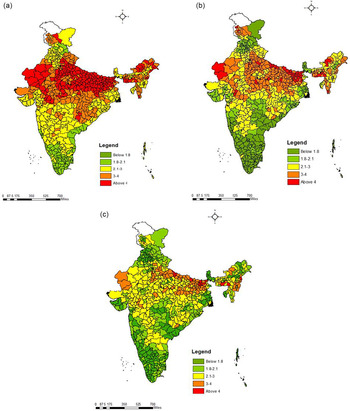
Figure 2 presents the estimated TFR in the districts of India for the years 2001, 2011 and 2016. The TFR of all India declined from 3.2 in 2001 to 2.3 in 2016. In 2001, the highest TFR was noted in the district of Kishanganj (5.4), followed by Araria (5.4) and Katihar (5.3) (all in Bihar) and lowest in Kolkata (1.5) in West Bengal, followed by Erode (1.7) in Tamil Nadu in 2001. By 2016, Mewat district (5.8) in Haryana had the highest TFR, followed by Jaintia Hills (4.7) in Meghalaya and Shrawasti (4.6) in Uttar Pradesh. The lowest TFR in 2016 was observed in the southern district of Sikkim (1.0), followed by West (1.1) and North (1.2) districts in Sikkim.
Total Fertility Rate in districts of India for a) 2001, b) 2011 and c) 2016.

In 2001, 70 of the 640 districts (11%) had below-replacement level fertility, compared with 203 (32%) in 2011 and 297 (46%) in 2016. By 2016, about 23% of the districts had TFR below 1.8 of which 7% had very low fertility (TFR<1.5) and 15% had high fertility (TFR>3.0). The share of districts with a TFR of 4+ declined from 29% in 2001 to 2% in 2016.
India’s fertility trend is the outcome of distinct regional fertility trajectories. States such as Kerala, Tamil Nadu and Andhra Pradesh in the south, and West Bengal and Sikkim in the east, maintained below-replacement level fertility after 2001. Furthermore, low-fertility states comprised the northern states of Himachal Pradesh and Punjab; the eastern states of West Bengal and Odisha; and the vast majority of the southern states and union territories, including Kerala, Tamil Nadu, Karnataka, Andhra Pradesh and Pondicherry. High fertility (TFR >3.0) was largely limited to areas of Rajasthan, Uttar Pradesh, Bihar, Jharkhand, Madhya Pradesh and the north-eastern states in the study period.
As the fertility transition progressed, a decline in the dispersion of TFR was observed. The standard deviation of TFR was 0.953 in 2001 and 0.680 in 2016 (Table 2). The distribution of TFR was negatively skewed over time. The transition of TFR from high variance to a declining variance suggests that the fertility transition is underway in India. However, the patterns vary widely by state. In the case of Uttar Pradesh, the standard deviation of TFR increased from 0.382 in 2001 to 0.412 in 2011 and to 0.528 in 2016. Similar patterns were also observed in the high-fertility state of Bihar, where the standard deviation of TFR increased from 0.308 to 0.384 between 2001 and 2011, and further to 0.477 by 2016. This suggests that the districts of Uttar Pradesh and Bihar are at an early stage of fertility transition. In one of the low-fertility states of India, West Bengal, the standard deviation of TFR had declined consistently – from 0.595 in 2001 to 0.390 by 2016. In Kerala, the standard deviation of TFR declined from 0.246 in 2001 to 0.164 by 2016. This indicates that the fertility levels in the districts of West Bengal and Kerala are converging.
Patterns of socioeconomic development in districts of India, 2001–2016
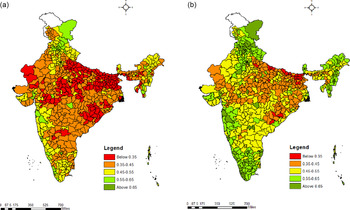
Figure 3 presents the estimated DDI for 2001 and 2016 across Indian districts. At the national level, the DDI increased from 0.399 in 2001 to 0.512 in 2016. In 2001, Kishanganj (0.159) in Bihar experienced the lowest DDI, followed by Sheohar (0.162) and Araria (0.174) (all in Bihar). These districts also had high fertility levels in all the time periods. On the other hand, the DDI was highest in New Delhi (0.710), followed by East Delhi (0.696) and South West Delhi (0.683). In 2016, the DDI was lowest in Sitamarhi (0.292), Sheohar (0.293) and Katihar (0.293) – all districts of Bihar. The district of Chennai (0.830) in Tamil Nadu was found to have the highest DDI in 2016, followed by Chandigarh (0.809) and New Delhi (0.806). The spatial distribution of DDI in 2001 indicated that the low DDI (below 0.35) mostly centred around the northern, central and eastern states encompassing parts of Rajasthan, Uttar Pradesh, Madhya Pradesh, Bihar, Jharkhand, Odisha and West Bengal. The DDI was high (above 0.65) in parts of Delhi, Pondicherry, Chandigarh, Telangana, Tamil Nadu and Maharashtra. In 2016, low DDI (below 0.35) was mostly found in the states of Rajasthan, Uttar Pradesh, Bihar, Jharkhand and Odisha. The DDI was above 0.65 in Tamil Nadu, Pondicherry, Karnataka and Kerala in the south, Delhi, Chandigarh, Himachal Pradesh and Punjab in the north, Goa and Maharashtra in the west and parts of the north-east.
District Development Index (DDI) in India for a) 2001, b) 2016.

In 2001, 173 of the 640 (27.0%) districts of India had a DDI below 0.35, and this declined to 23 (3.6%) districts in 2016. Two-fifth of districts had DDI values between 0.35 and 0.45 in 2001. By 2016, 33% had DDI value between 0.45 and 0.55. The DDI curve shifted rightwards over time. At the aggregate level, the standard deviation of DDI increased from 0.096 in 2001 to 0.107 in 2016. However, the changes in variance in DDI across most of the regions were not considerable. The increase in DDI was observed to be highest in districts with DDI values between 0.3 and 0.5 in 2001. The change in standard deviation of DDI over time was highest in the southern region (0.076 in 2001 and 0.093 in 2016) followed by the north-eastern region (0.077 in 2001 and 0.084 in 2016). Thus, socioeconomic development has not been uniform across the districts of each region and is diverging.
Association between fertility and development in districts of India, 2001–2016
Table 3 presents the share of districts by levels of DDI and TFR in 2001 and 2016. The share of the districts with a DDI below 0.45 and TFR above 3.0 almost halved – from 70% in 2001 to 39% in 2016. In 2001, of the districts with a DDI in the range 0.45–0.55, 32 (20%) had below-replacement fertility. By 2016 the corresponding number had risen to 95 (46%). Of the districts with a DDI below 0.45, only 4% had below-replacement fertility in 2001, while 10% did in 2016. In 2001, about one-third of the districts with a DDI between 0.45 and 0.55 had a TFR of above 3.0. By 2016, this had declined to 6%. The number of districts with a DDI of more than 0.55 and below-replacement fertility increased from 20 (35%) in 2001 to 182 (79%) by 2016. Although 16% of the districts with high DDI had high fertility in 2001 (DDI of more than 0.55 and TFR of more than 3.0), this reduced to 4% in 2016.
Share of districts by levels of DDI and TFR in India, 2001–2016

DDI is a summary measure of average achievement in key dimensions of human development: health, social and economic. Figures in parentheses indicate the number of districts. Percentages are the row percentages.
The correlation coefficient between TFR and DDI in the districts of India was –0.658 in 2001 and –0.640 in 2016 (Table 2). The correlation coefficients between TFR and DDI across the different regions revealed that their association, though remaining significant in both periods, had weakened in the north, central and western regions. The correlation coefficient between TFR and DDI was high in districts with DDI values less than 0.45 over time. It increased from –0.186 to –0.302 in districts with DDI values between 0.45 and 0.55, and remained lower in districts with DDI values above 0.55 compared with the rest. The correlation coefficient between TFR and DDI was highest in the districts of UP-Bihar featuring high TFR and moderately low DDI. The correlation coefficient between TFR and DDI was moderate (between –0.4 and –0.6) in the central, western, southern and eastern regions (Table 2).
Figure 4 presents the estimated TFR at varying levels of DDI among the districts of India during 2001–2016. With a DDI below 0.35, the mean TFR declined from 4.2 in 2001 to 3.9 in 2016. Similarly, with a DDI above 0.65, the TFR declined from 2.2 in 2001 to 1.8 in 2016. The majority of the districts that exhibited an increase of 20–40% in DDI showed a reduction in TFR of 20–40%.
Mean TFR at varying levels of DDI in districts of India, 2001 and 2016.

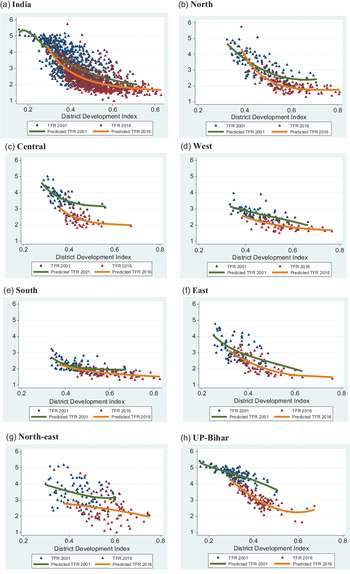
Figure 5 presents the association of TFR and DDI in the districts of India in 2001 and 2016. The scatterplot showed a convex shape of TFR–DDI curve, implying that the rate of decline in fertility with increase in development slowed as development progressed. However, the negative and non-linear association between TFR and DDI remained over time. The curve shifted downwards and towards the right, suggesting an increase in the overall level of DDI and reduction in TFR. For any given level of DDI, fertility was lower in 2016 than in 2001. However, the rate of fertility decline over time was more prominent in districts with DDI values lying between 0.3 and 0.6. As DDI reached the threshold level (0.35 or more), 10% of districts in 2001, and almost half of all districts in 2016, approached below-replacement fertility. In addition, many districts still had TFRs close to, or even above 3.0 at DDI values above 0.6 over time.
Scatterplot of TFR and DDI in districts for all India and its regions, 2001–2016.

The association between DDI and TFR among districts and across regions showed varying patterns. The general pattern held true across regions but the magnitude varied. The convex association between TFR and DDI was more prominent in the north, central and eastern regions. Furthermore, the effect of the rate of fertility reduction for any given level of DDI was greatest in UP-Bihar and the central region. The patterns of the TFR curves for most of the districts in these regions revealed that fertility declined, although the improvement in DDI over time was rather slow. However, very few of these districts had below-replacement level fertility, with DDI lying between 0.4 and 0.6. The non-linear convex association between fertility and development was also observed in districts in the north and eastern regions. These regions included low- and high-fertility states. In the north, the districts of Himachal Pradesh, Punjab, Jammu and Kashmir and other union territories had low TFRs and high DDI scores. On the other hand, the majority of the districts of Rajasthan and Haryana had persistently lower levels of DDI and high fertility. A small number of the districts belonging to West Bengal and Odisha in the east had low fertility rates and low DDI scores. Additionally, the curve was flatter in the south and western regions, which continued to have low fertility levels in 2001 and better DDI scores. Also, the curve was flatter in districts in the north-east experiencing lesser fertility reduction over time. There were some residual districts for which the TFR remained well above replacement level, even with DDI values of 0.6 or more, but these were concentrated in certain areas of India, notably the north-east.
The highest TFR decline (more than 2 units or more than 20%) between 2001 and 2016 occurred in twelve of the 640 districts, with DDI values ranging between 0.3 and 0.6 (Figure 6): Banswara in Rajasthan; Tirap, Upper Siang, Changlang, East Siang, Lower Subansiri in Arunachal Pradesh, West and South Garo Hills in Meghalaya; and Mahrajganj, Lalitpur, Ambedkar Nagar and Azamgarh in Uttar Pradesh. The decline in TFR by 2.0 units during 2001 and 2016 was mostly observed across districts showing a wide range of DDI values, ranging between 0.2 and 0.6. The decline was less pronounced for districts with DDIs lower than 0.2 or above 0.6 in 2001. Concurrently, 25 districts with varying TFR levels in 2016 belonging to the states of Himachal Pradesh, Nagaland, Manipur and Tamil Nadu showed an increase in TFR during 2001–2016. The DDI values of these districts broadly ranged between 0.4 and 0.6 in 2001.
Scatterplot of reduction in TFR between 2001 and 2016, and DDI, 2001 in districts of India.

Multivariate results
Table 4 presents the results of cross-sectional and panel regressions with TFR as the dependent variable. Columns (1) and (3) present the cross-sectional results using OLS for 2001 and 2016, respectively. Owing to the bi-directional association between fertility and socioeconomic development, the coefficients estimated by OLS could be biased. Hence, the percentage of households having a toilet facility was used as an instrumental variable, as the share of households having a toilet facility is associated with DDI but not with TFR. The Yu-Hausman statistics for 2001 and 2016 suggested that DDI indeed introduced endogeneity in the analysis.
Cross-sectional and panel results of Ordinary Least Squares (OLS) and Two Stage Least Squares Regression (2SLS-RE) analyses with TFR as dependent variable

DDI is a summary measure of average achievement in key dimensions of human development: health, social and economic.
***p<0.01; **p<0.05; *p<0.1.
The 2SLS coefficients are presented in Columns (2) and (4) for the individual cross-sections. The explanatory variables accounted for about three-quarters of the variation in fertility across districts in 2001, and a little less in 2016. The DDI coefficient was negative and significant for both 2001 and 2016. The coefficients of the share of Muslim and SC/ST populations were positively significant for both time points. The smaller coefficient of DDI in these columns suggested a decline in association between TFR and DDI from 2001 to 2016.
The OLS and 2SLS results based on panel data accounting for district-specific effects are presented in Columns (5) and (6). Both models broadly corroborated the cross-sectional findings. The coefficients of Generalized Least Squares with the random effect (GLS-RE) model using 2SLS in Column (6) controlling for endogeneity suggested that an increase of 0.1 in the DDI corresponded to a decline of 0.41 in the TFR across the districts of India (Column (6)). Like the cross-sections, the shares of Muslim and SC/ST were positive and significantly associated with TFR. Time had a negative impact on fertility. For the panel model, the value of rho, i.e. the intra-class correlation coefficient, implied that 31.5% of the variation was due to differences across the panels.
The individual cross-sectional and panel data, assuming a quadratic association between TFR and DDI, are presented in the Columns (7–9) of Table 4. The R 2 statistics for 2001 and 2016 in Columns (7) and (8) were 0.769 and 0.654, respectively. Broadly, the coefficient of DDI was negative and that of DDI2 was positive, which confirmed a convex association between development and fertility. In fact, the significant coefficients indicated that the negative correlation between DDI and fertility was positive at a certain level of development, with a clear minimum point in the pattern between the two variables. In the panel setting, the coefficients of DDI and DDI2 in Column (9) were both significant and larger compared with the cross-sections. The coefficients of cross-sectional and panel OLS revealed that the controlling variables, i.e. Muslim population and SC/ST population, were statistically significant and positively associated with TFR. Time was found to be strongly associated with TFR decline, as shown in Column (9). The intra-class correlation coefficient suggested that 33.3% of the variation in fertility was due to differences across the panels. Furthermore, the Chow tests for panel models (3), (4) and (9) were statistically significant changes, suggesting that the relationship between the fertility and socioeconomic development had indeed attenuated (data not shown). In summary, region exerted a strong influence on fertility, even after controlling for other factors. Compared with the high-fertility states of Uttar Pradesh and Bihar, fertility was distinctly lower in all other regions of India.
Discussion
Fertility transition in India is of global significance, not merely because of its large population size but also due to its regional diversity and variations in levels of socioeconomic development and fertility levels. The overall advancement in socioeconomic development in the last two decades has been closely associated with the ongoing fertility transition in India. Studies exploring the association between development and fertility in Indian districts have been limited, largely due to the dearth of reliable data at the district level. The present study aimed at understanding the association between development and fertility patterns in the districts of India over a period of 15 years. Although the selection of indicators was impeded by the availability of data at the district level, the chosen indicators captured the key aspects of human development – health, social factors and wealth dimensions.
The first key finding of the study was that fertility levels had a converging pattern across Indian districts over the period 2001 to 2016. By 2016, almost one in five districts was a low-fertility district (TFR below 1.8) and about half had reached below-replacement level fertility. Most of the high-fertility districts of India belonged to the states of Rajasthan, Uttar Pradesh, Bihar and parts of the north-east. Second, most districts had recorded an overall improvement in the level of socioeconomic development, but their patterns of development remained similar over time. The low-development districts were mainly concentrated in the states of Rajasthan, Uttar Pradesh, Bihar, Jharkhand and Odisha, with little change in their development over time. The highest increase in DDI was observed among the districts with DDI values ranging between 0.3 and 0.5 in 2001. Third, the association between socioeconomic development and TFR was negative and convex over time. The association between development and fertility had shifted downwards at any given level of DDI in almost all districts, but by varying degrees. However, the association between fertility and development was most prominent for districts with DDI values less than 0.45. This pattern of association is in line with several previous studies (Potter et al., Reference Potter, Schmertmann and Cavenaghi2002; Bryant, Reference Bryant2007; Ryabov et al., Reference Ryabov2015; Fox et al., Reference Fox, Klüsener and Myrskylä2019). Many districts that have not yet shown substantial fertility decline have experienced a relatively lower thrust in socioeconomic development. By and large, districts with DDI levels between 0.3 and 0.6 in 2001 experienced more than 20% fertility decline over time. Such reductions were less evident in districts with low or very high DDIs in 2001. At DDI levels beyond 0.35, districts experienced below-replacement level fertility. Fourth, the regional patterns of fertility and development associations are worth mentioning. While the negative convex association was prominent in the northern, central and eastern regions, the curves were flatter in the western, southern and north-eastern regions. For any given level of DDI, fertility was lower in 2016 than in 2001, and this effect was greatest in Uttar Pradesh, Bihar and the central region, which experienced a slower fertility decline along with a sluggish improvement in socioeconomic development. At the same time there were some residual districts, concentrated mostly in the north-east, for which fertility levels lay well above the below-replacement level of fertility and where DDI values were 0.6 or more. In certain districts of India, the association between fertility and development seemed to have enervated. Fifth, the multivariate results showed that the macro-level relationship between fertility and development was negative, significant and robust. However, the association diminished over time. In addition, time was a key determinant of fertility decline. Nonetheless, it can be argued that the association had not weakened as such. Instead, development had ground to a halt, following which fertility decline also slowed down.
Thus, with increasing levels of socioeconomic development and the slowing down of the pace of improvement of socioeconomic development, the association between fertility and development seems to wither. A plausible explanation for the downward shift in fertility is the diffusion of new ideas favouring birth control and preference for small family size globally (Bongaarts & Watkins, Reference Bongaarts and Watkins1996; Bryant, Reference Bryant2007). There has been an increase in the number of Indian districts with better developmental conditions and low fertility. However, there still remain several districts with low socioeconomic development and moderately high fertility levels. However, the emergence of increasing numbers of districts with reduced fertility levels and low levels of socioeconomic development draws much attention. This suggests that factors other than the components of DDI are causing fertility to fall. Furthermore, it suggests that poverty in these districts is not a barrier to fertility, but that it is people’s choice to adapt to the small family norms with limited resources. One socioeconomic theory that could explain the fertility reductions in such districts is that restricted fertility acts as a way of enhancing children’s chances of social mobility by increasing investment in their health and education (Polybius, 1997; Chu, Reference Chu1998), as well as the diffusion of new ideas about childbearing. Earlier studies pointed towards the existence of a moving threshold for the onset of fertility decline. As time passes, countries begin their fertility declines with progressively lower scores of development owing to a type of cultural contagion (Bongaarts & Watkins, Reference Bongaarts and Watkins1996; Bongaarts, Reference Bongaarts2002). Furthermore, fertility might be more responsive to socioeconomic change in the middle stages of the transition than in the primary stages, when diffusion processes play a larger part (Bongaarts, Reference Bongaarts2002). Thus, the diffusion of newer ideas of small family norms and uptake of contraception deserve a prominent place alongside socioeconomic causes when trying to explain differentials in contemporary fertility transitions among Indian districts. However, Bryant (Reference Bryant2007) showed that fertility declines in countries with low development scores can also be accommodated by socioeconomic theories. He argued that socioeconomic theories predict only a moderately strong relationship between fertility and development indicators and demonstrated that their association is stronger and more stable than anticipated.
Based on the study findings, some policy implications can be put forward. Apart from greater investment in the health and educational sectors in India, a multi-layered strategy could be adopted whereby districts are prioritized by their levels of socioeconomic development and fertility. First of all, districts with high fertility and low socioeconomic development should be given the topmost precedence. For such districts, as well as for districts with moderate fertility levels and socioeconomic development, other than developmental planning and proper execution, expanding investment in educational attainment, child survival and child health, labour-force generation and provision of contraceptive use could be productive. For districts with low fertility and better developmental conditions, the fast-growing aged population should be prioritized by enhancing social security measures and investing more in adult health, especially for the elderly. For a handful of districts with high fertility levels and high socioeconomic development, programmes should be directed at the promotion of contraceptive uptake and increasing age at marriage indirectly through the promotion of educational attainment and job creation. It has to be kept in mind that high fertility could be a personal choice. There should be multi-prong strategies to enhance educational attainment among the population and to improve overall child and adult health in districts with low socioeconomic development and fast reducing fertility levels.
The study has a few limitations. A limited number of outcome variables were considered due to data constraints. Second, the estimates for newly created districts were assumed to be the same as those of the parent districts from which they had been segregated. Finally, the dearth of suitable instruments restricted the analyses to ignore the quadratic nature of DDI–TFR.
Acknowledgments
The authors thank the editor and reviewers for their very detailed and insightful suggestions on earlier versions of the paper. The data used in this paper are available online at the public domains https://dhsprogram.com/what-we-do/survey/survey-display-355.cfm, http://www.censusindia.gov.in/ and http://rchiips.org/PRCH-2.html.
Funding
This research received no specific grant from any funding agency, commercial entity or not-for-profit organization.
Conflicts of Interest
The authors declare that there have no competing interests.
Ethical Approval
The authors assert that all procedures contributing to this work comply with the ethical standards of the relevant national and institutional committees on human experimentation and with the Helsinki Declaration of 1975, as revised in 2008.