1. Introduction
The impact of a drop onto a solid is fundamental in many natural and industrial processes. One important aspect of the deposition is the entrapment of a bubble under the centre of the drop. It can have a detrimental effect on the uniformity in coating processes and affect conduction or conductivity through the interface between a solidified drop and the substrate. This central bubble was first observed in snapshot photographs (Chandra & Avedisian Reference Chandra and Avedisian1991; Thoroddsen & Sakakibara Reference Thoroddsen and Sakakibara1998), but Thoroddsen et al. (Reference Thoroddsen, Etoh, Takehara, Ootsuka and Hatsuki2005) used high-speed video to image the initial entrapment of the air disc and modelled its subsequent contraction into the central bubble. They also identified a dark ring, which often marked the initial diameter of the air disc, proposing that it was due to the trapping of microbubbles.
The rapid contraction of the air disc can also leave a small drop at the centre of the bubble, when the converging capillary waves touch the dry substrate. This drop was imaged through the bottom glass by Thoroddsen et al. (Reference Thoroddsen, Etoh, Takehara, Ootsuka and Hatsuki2005) and later verified by Lee et al. (Reference Lee, Weon, Je and Fezzaa2012) using X-rays.
Driscoll & Nagel (Reference Driscoll and Nagel2011) and Liu, Tan & Xu (Reference Liu, Tan and Xu2013) used interferometry with approximately 7
 ${\rm\mu}$
s time resolution to observe the compression of the air disc for high impact velocities. Subsequently, Li & Thoroddsen (Reference Li and Thoroddsen2015) used interferometry with 200 ns time resolution to capture the entire compression and rebounding of the air disc.
The theoretical treatment of the air-cushioning, started by Smith, Li & Wu (Reference Smith, Li and Wu2003), is based on balancing the viscous lubrication in the thin air layer and the rapid deceleration of the drop inertia. Korobkin, Ellis & Smith (Reference Korobkin, Ellis and Smith2008) added two deformable surfaces and Hicks & Purvis (Reference Hicks and Purvis2010) reformulated the above 2-D theories for the axisymmetric case, to allow quantitative comparison with theory. They predicted the initial radius of the air disc at first contact
 $L_{o}$
, as (Hicks et al.
Reference Hicks, Ermanyuk, Gavrilov and Purvis2012; Hicks & Purvis Reference Hicks and Purvis2013)
 $$\begin{eqnarray}L_{o}=3.8\left(\frac{4{\it\mu}_{g}}{{\it\rho}_{\ell }V}\right)^{1/3}R^{2/3},\end{eqnarray}$$
where
 ${\it\mu}_{g}$
is the gas viscosity,
 ${\it\rho}_{\ell }$
is the liquid density,
 $V$
is the impact velocity of the drop and
 $R$
is the drop radius. This formula is in perfect correspondence with the recent experiments of Li & Thoroddsen (Reference Li and Thoroddsen2015), if one uses the bottom radius of curvature of the drop
 $R_{b}$
for
 $R$
. This is mandated by the significant shape oscillations of the large water drops used in those experiments.
Thoroddsen et al. (Reference Thoroddsen, Etoh, Takehara, Ootsuka and Hatsuki2005) measured the size of the central bubble for high impact velocities, but for low impact velocities, Bouwhuis et al. (Reference Bouwhuis, van der Veen, Tran, Keij, Winkels, Peters, van der Meer, Sun, Snoeijer and Lohse2012) identified a local parameter, where the size of the entrapped bubble is maximum.
Mandre, Mani & Brenner (Reference Mandre, Mani and Brenner2009) investigated the compressibility of the air, which occurs for higher impact velocities. The amount of compression is determined by a compressibility factor
 $$\begin{eqnarray}{\it\epsilon}^{-1}=\frac{(RV^{7}{\it\rho}_{\ell }^{4}/{\it\mu}_{g})^{1/3}}{P_{atm}},\end{eqnarray}$$
where
 $P_{atm}$
is the static atmospheric pressure. If
 ${\it\epsilon}^{-1}\gg 1$
one expects significant compression of the air disc. For adiabatic compression the 2-D theory of Mandre et al. (Reference Mandre, Mani and Brenner2009) predicts that the air-layer thickness at the centreline reduces as
 $H^{\ast }/(R\,St^{2/3})\sim {\it\epsilon}^{1/3}$
, where, following recent nomenclature,
 $St$
is the inverse of the conventional Stokes number, i.e.
 $St={\it\mu}_{g}/({\it\rho}_{\ell }RV)$
. The experiments in Li & Thoroddsen (Reference Li and Thoroddsen2015) showed empirically that
 $H^{\ast }/(R_{b}St^{2/3})=4.2{\it\epsilon}^{0.40}$
. They also showed that the radial motion
 $U$
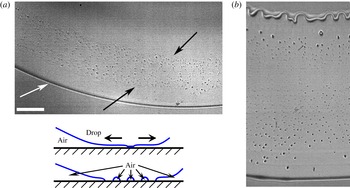
of the kink at the minimum gap (see the sketch in figure 1
a) is in good agreement with the above theory, i.e.
 $U/V\sim St^{-1/3}$
, see also Duchemin & Josserand (Reference Duchemin and Josserand2011).
Mandre et al. (Reference Mandre, Mani and Brenner2009) and subsequent work by Mani, Mandre & Brenner (Reference Mani, Mandre and Brenner2010) and Mandre & Brenner (Reference Mandre and Brenner2012) suggested the intriguing possibility that an impacting drop could skate on a thin layer of air and splash without ever touching the solid surface. However, the entrapment of the central air disc and its subsequent contraction into a bubble (Thoroddsen et al.
Reference Thoroddsen, Etoh, Takehara, Ootsuka and Hatsuki2005), mandate a contact with the solid surface. Even though the skating on a thin layer of air may have little bearing on splashing, it is important for rebounding of the drop for small impact velocities, which is observed even for hydrophilic surfaces (Kolinski, Mahadevan & Rubinstein Reference Kolinski, Mahadevan and Rubinstein2014; de Ruiter et al.
Reference de Ruiter, Lagraauw, van den Ende and Mugele2015). de Ruiter et al. (Reference de Ruiter, Lagraauw, van den Ende and Mugele2015) used smooth glass surfaces to find the maximum impact velocity where rebound without contact can take place, characterized by Weber numbers
 $We={\it\rho}_{\ell }RV^{2}/{\it\sigma}$
below 4, where
 ${\it\sigma}$
is the surface tension. Mandre & Brenner (Reference Mandre and Brenner2012) highlighted the importance of surface roughness, formulating conditions when the minimum air gap will reach nanometric thickness and minuscule asperities could rupture the film.
Herein, we apply ultra-high-speed direct imaging to investigate the nature of the initial contact of the drop liquid with the solid surface. In particular, we identify the mechanism behind the formation of the characteristic ring of microbubbles which conveniently marks the location of the initial contact. Thereby, our imaging reveals a new level of complexity in this fundamental process, which can only be revealed by the fastest imaging ever performed of this process.
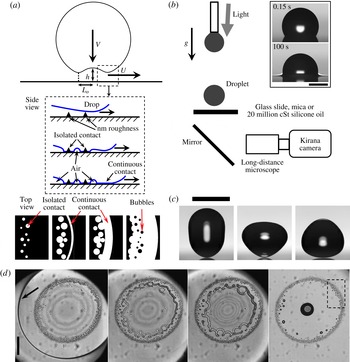
(a) Definition sketch, identifying the air-layer thickness
 $h(r)$
and the radial velocity
 $U$
of the kink at the outer edge of the dimple, including, at the bottom, two schematics of the isolated contacts occurring before the fully wetted region, leading to the entrapment of microbubbles, from the side view and top view. (b) Sketch of the experimental set-up, showing the imaging through the substrate and the arrangement of the laser diodes with respect to the drop and video camera. The inset displays the shape of a small water drop gently deposited on top of a 20 million cSt silicone oil surface, to measure the contact angle, shown 0.15 and 100 s after contact. The scale bar is 500
 ${\rm\mu}$
m. (c) Example shapes of the large water drop at impact. The scale bar is 5 mm. (d) Typical microbubbles marking the initial contact of a water drop impacting onto a dirty (as delivered uncleaned) glass microscope slide. Frames are shown at 2, 7, 12 and 400
 ${\rm\mu}$
s from first contact, for
 $R_{b}=7.3$
mm and
 $V=4.59$
m s
 $^{-1}$
, giving
 $We=755$
,
 $St=5.8\times 10^{-7}$
and
 ${\it\epsilon}^{-1}=22$
. The scale bar is 200
 ${\rm\mu}$
m. The arrow in the first panel identifies the outer contact line. The dotted rectangle in the last panel identifies the approximate location of the viewing area in figure 3(a), for a different impact onto cleaned glass.

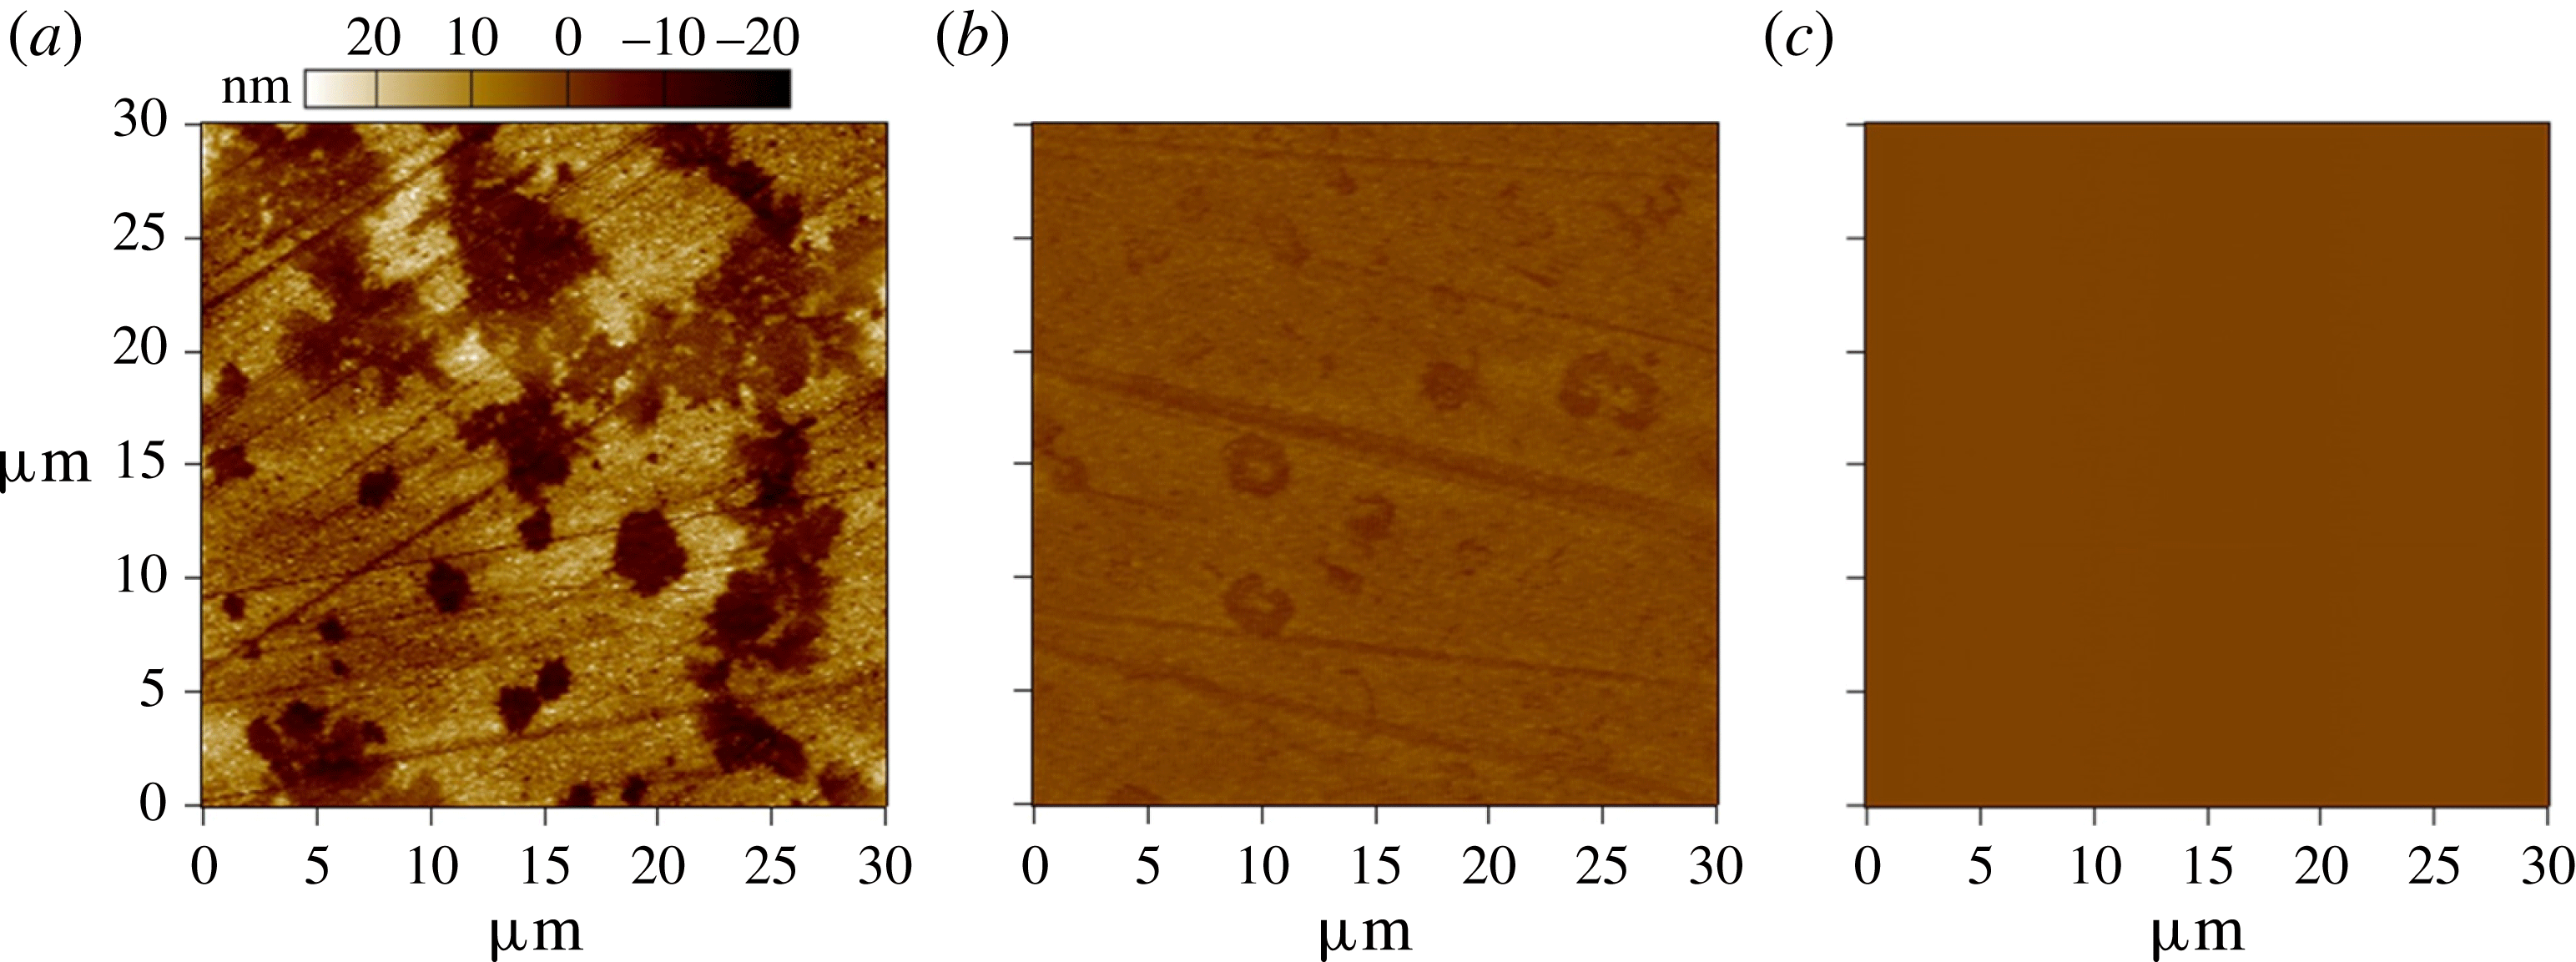
The roughness of the glass and mica surfaces: AFM topographic images of
 $30\times 30~{\rm\mu}\text{m}$
regions of (a) Corning glass, (b) Fisher glass and (c) freshly cleaved mica surface. For the Corning glass, RMS
 $=$
7.3 nm, max. to min.
 $=$
49 nm; for the Fisher glass, RMS
 $=$
1.2 nm, max. to min.
 $=$
10 nm; for the mica, RMS
 ${<}$
0.5 nm. The supplementary material shows scans over larger surface areas (see the supplementary movies available at http://dx.doi.org/10.1017/jfm.2015.643).

2. Experimental set-up
2.1. Optical and imaging set-up
The experimental configuration is sketched in figure 1(b) and is essentially the same as in Li & Thoroddsen (Reference Li and Thoroddsen2015), with imaging through the bottom glass plate. We use transmitted light or reflective interferometry to measure the thickness of the air layer
 $h(r)$
, while allowing imaging of the contact region. The pulsed monochromatic illumination (
 ${\it\lambda}_{light}=640$
nm) is produced by 180 laser diodes (SI-LUX640), one per video frame. This gives a depth resolution of
 ${\it\lambda}_{light}/4=160$
nm between adjacent dark and bright fringes. We use long-distance microscopes, primarily a Leica (Z16 APO), with pixel resolution down to 1.04
 ${\rm\mu}$
m px
 $^{-1}$
. The rapid surface motions during first contact require ultra-high-speed video, acquired with the Kirana-05M from Specialized Imaging in Tring, UK (Crooks et al.
Reference Crooks, Marsh, Turchetta, Taylor, Chan, Lahav and Fenigstein2013), at frame rates up to 5 million f.p.s. The extreme 200 ns time resolution allows us to follow individual fringes between video frames and eliminates some of the ambiguity at lower frame rates, which has required colour interferometry to get absolute layer thicknesses (de Ruiter et al.
Reference de Ruiter, Oh, van den Ende and Mugele2012; van der Veen et al.
Reference van der Veen, Tran, Lohse and Sun2012). Thickness profiles with multiple local minima, as well as rebounding non-contact cases, will still need the two-colour technique to get absolute thicknesses (de Ruiter et al.
Reference de Ruiter, Oh, van den Ende and Mugele2012).
A few experiments were performed with even larger optical magnification by using a 50
 $\times$
Mitutoyo objective, for a pixel resolution of 0.566
 ${\rm\mu}$
m. The resulting images were not as clear due to diffraction as well as the very narrow depth of focus (see figure 5).
The water drops used herein have an equivalent diameter of
 $D\simeq 5.2$
mm, which is significantly larger than the capillary length
 $a=\sqrt{{\it\sigma}/({\rm\Delta}{\it\rho}\,g)}\simeq 2.7$
mm, and therefore show large shape oscillations, which must be determined at impact. This is accomplished with side views using a Phantom V1610 CMOS video camera. Typical drop shapes are shown in figure 1(c). The impact velocities presented herein are between
 $V=1.2$
and
 $4.2$
m s
 $^{-1}$
, corresponding to a range of Weber numbers
 $We={\it\rho}RV^{2}/{\it\sigma}=59{-}755$
.
2.2. Glass and mica substrates
We tested two different microscope-slide glass substrates, supplied by Corning (2947-
 $75\times 50$
) and Fisher Scientific. The glass slides were cleaned in a sequence of ultrasonic baths of acetone, isopropanol and deionized water for 10 min each. Following this treatment, the contact angle of water on the glass was approximately
 $20^{\circ }$
. Figure 1(d) shows an impact onto a dirty glass slide, i.e. one which has not been cleaned, showing much stronger air entrapment than for cleaned glass in what follows.
We also tested thin mica sheets which were attached to a glass slide with epoxy glue. The sheets were cleaved after every few drop impacts, to produce a fresh surface. This was done by depositing a Scotch tape onto the surface and rapidly peeling it off. A clear sign of successful peeling was that the tape would become smooth to the touch and lose its stickiness. Between drop impacts the surface was dried by blowing dry nitrogen, thereby removing any droplets or wet spots. Water fully wets the freshly cleaved mica.
Figure 2 shows atomic force microscope (AFM) measurements of the surface roughnesses of the three different surfaces. The two glass slides have differing roughnesses, with the mica surface perfectly smooth within the measurement accuracy.
2.3. Ultra-viscous liquid substrate
In addition to water drop impacts onto the glass substrates, described above, we also imaged impacts onto an extremely viscous liquid surface, immiscible to the water drop. Here, the idea is to use a liquid to eliminate any surface roughness or asperities. For this purpose we use a silicone oil of 20 million cSt (Clearco Products). The properties are given in table 1. This liquid is so viscous that it takes hours to flatten, under gravity, after it is scooped onto a solid surface. We therefore deposit a fixed weight (2 g) of the material onto a glass plate, which we then heat to 80
 $^{\circ }$
C in an oven to make it spread overnight into a 1 mm thick circular patch. The contact angle of a small water drop gently deposited on the immiscible silicone oil was measured, 150 ms after contact, to be
 $\simeq 118^{\circ }$
, see the inset in figure 1(b). Contact angles are not well defined here as the triple line locally deforms the viscous surface (see Style et al.
Reference Style, Hyland, Boltyanskiy, Wettlaufer and Dufresne2013).
Properties of the fluids used in the experiments. The properties for the silicone oil are taken from the supplier’s data sheets.

3. Results
3.1. Effect of glass roughness versus smooth mica
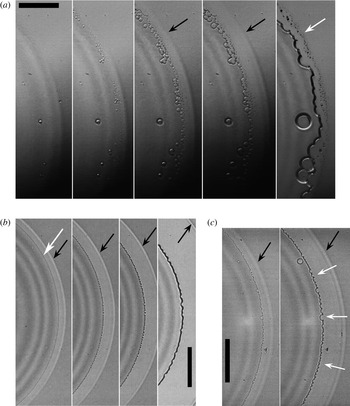
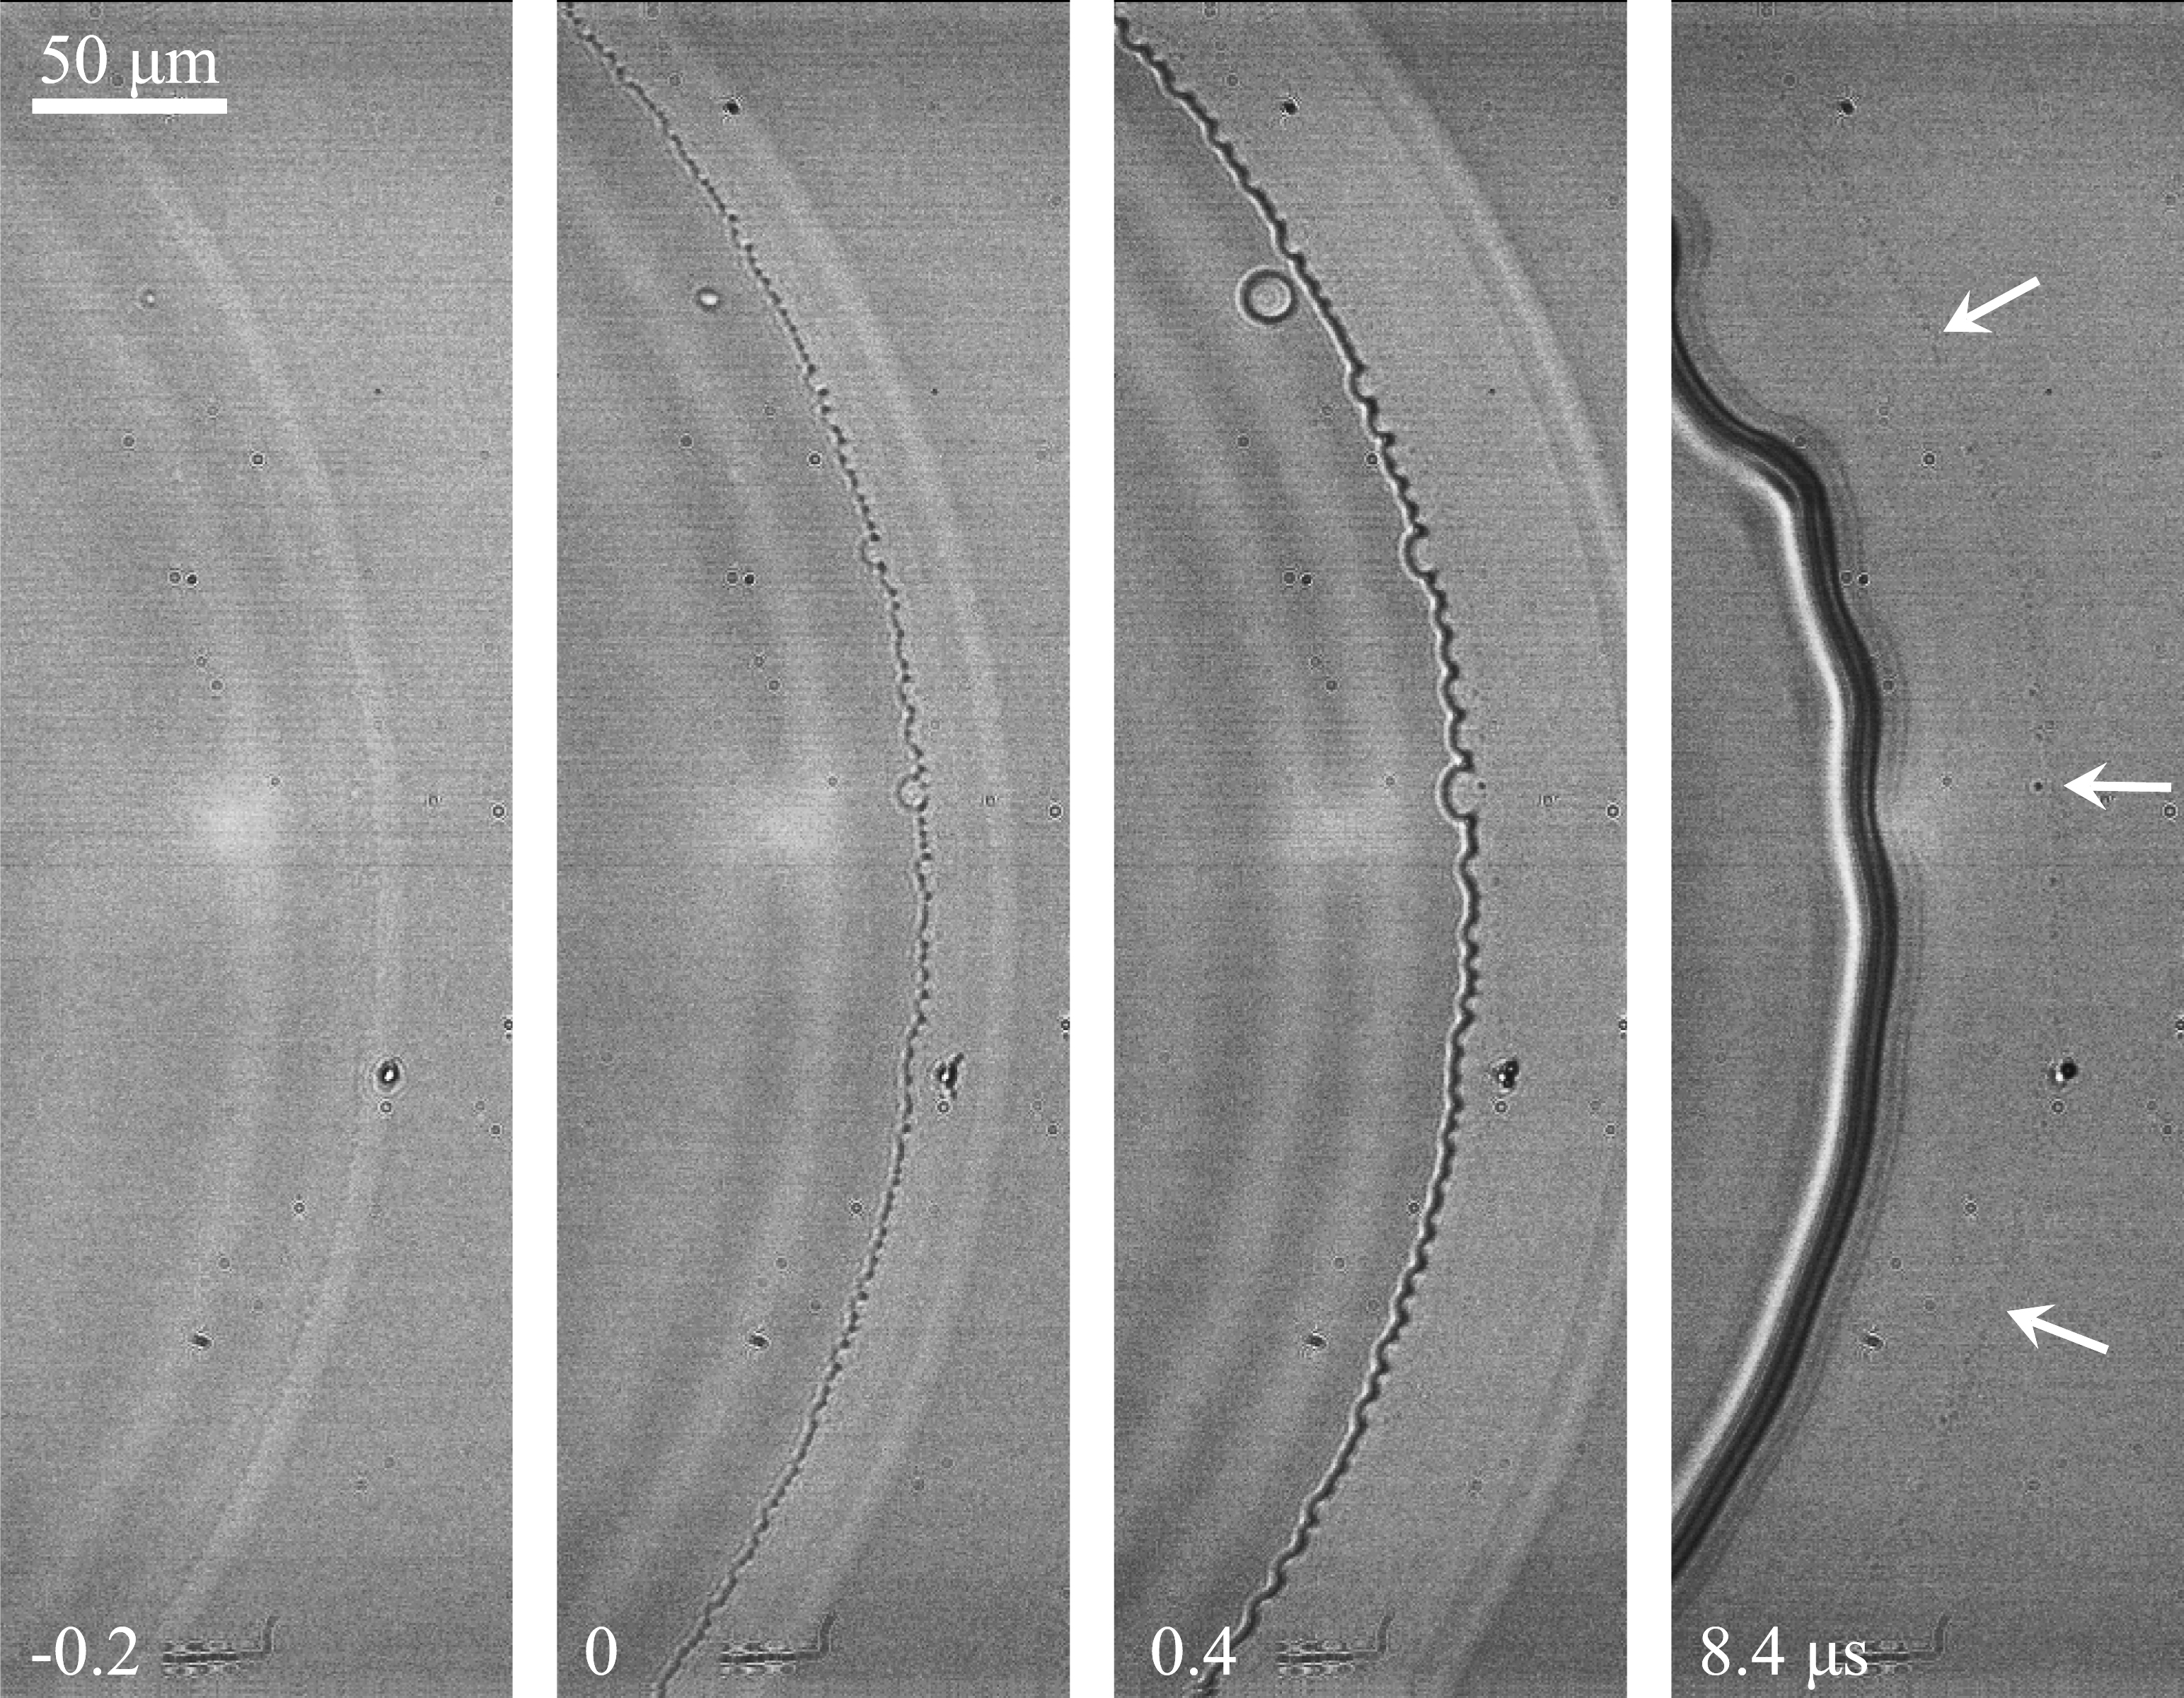
Comparison of the first contact of drops impacting on glass and mica surfaces. (a) Examples of the ring of microbubbles at the outer edge of the central contact on Corning glass, for a water drop with
 $D=5.2$
mm,
 $R_{b}=8.2$
mm and impact velocity
 $V=2.43$
m s
 $^{-1}$
, giving
 $St=9.2\times 10^{-7}$
(
 ${\it\epsilon}^{-1}=5.98$
,
 $We=212$
). Frames are shown at
 $t=-0.2$
, 0, 0.2, 0.4 and 1.8
 ${\rm\mu}$
s around first contact. The white arrow points out the ring of microbubbles left behind. (b) Impact on a molecularly smooth freshly cleaved mica surface, for
 $R_{b}=4.1$
mm and impact velocity
 $V=2.10$
m s
 $^{-1}$
(
 $St=2.1\times 10^{-6}$
,
 ${\it\epsilon}^{-1}=3.37$
,
 $We=158$
), shown at
 $t=0$
, 0.2, 0.4 and 1.6
 ${\rm\mu}$
s from first contact. The white arrow points to the inner contact line. No microbubbles are left behind. (c) Impact on a cleaned Fisher microscope slide, shown at
 $t=0$
and 0.4
 ${\rm\mu}$
s for
 $R_{b}=5.1$
mm,
 $V=2.33$
m s
 $^{-1}$
(
 $St=1.5\times 10^{-6}$
,
 ${\it\epsilon}^{-1}=4.6$
,
 $We=195$
). The scale bars are all 100
 ${\rm\mu}$
m. The white arrows, in the last panel, point out a faint ring of tiny bubbles, which can be better observed in an enhanced supplementary image and movie. The black arrows in all panels indicate the outer edge of the fully wetted contact.

Figure 3(a) shows a close-up view of the outer edge of the air disc, as it makes contact with the rougher glass (Corning). For orientation, see the approximate rectangle in figure 1(d), marked on a different impact. The second panel reveals isolated circular contacts, which occur slightly behind the continuous contact region which forms when the air-film thickness goes below some critical value. This region becomes visible in the third panel, see the sketch in figure 1(a). The localized contacts grow in size and merge, leaving microbubbles between them and the fully wetted outer region, the outer edge of which is marked with black arrows. Immediately following this, a rugged inner contact line forms and starts to contract into the central bubble. The fine dark spots left behind are the microbubbles, with a typical size of 2–5
 ${\rm\mu}$
m. Figure 3(b) contrasts this with the impact onto a molecularly smooth mica sheet. Here, the initial contact appears uniformly around the periphery, with no obvious isolated circular contacts before continuous wetting. The contraction of the thin edge produces fine undulations in the azimuthal direction, but no isolated microbubbles are left behind during the retraction of the inner contact line. A similar influence of roughness is observed for other impact conditions, for impact velocities larger than the skating regime, i.e. for
 $St<6\times 10^{-6}$
or
 $We>70$
. The AFM measurements in figure 2 show that the Fisher glass is much smoother than the Corning glass, as is clearly evident in figure 3(c), where the contact is similar to that with the mica, and less than a handful of clearly identifiable local contacts are observed, leaving only one distinct microbubble. However, a fine ring of tiny microbubbles (white arrows) can be discerned from a careful inspection of the video, shown in the supplementary material, where we include two enhanced frames. In this case, the localized contacts and formation of the fully wetted region must occur within the 200 ns interframe time.
Consistent with this picture, figure 1(d) showed a much larger number of entrapped microbubbles for impact on a rougher uncleaned glass surface.
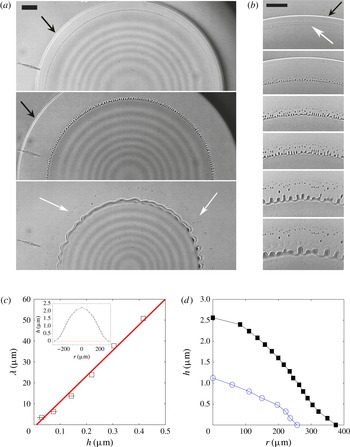
(a) The air disc under a water drop impacting onto a
 $20\times 10^{6}$
cSt silicone oil surface, at velocity
 $V=3.15$
m s
 $^{-1}$
and
 $R_{b}=2.4$
mm. Frames are shown at
 $t=0.4$
, 1.8 and 12.2
 ${\rm\mu}$
s after first contact (
 $St=2.4\times 10^{-6}$
,
 ${\it\epsilon}^{-1}=7.5$
,
 $We=356$
). The white arrows point out entrapped microbubbles. The black arrows in all panels identify the outer contact line. (b) Undulations and pinch-off of microbubbles at the contracting edge of the air disc, shown at
 $t=0$
, 1, 2, 3, 7.5 and 12.5
 ${\rm\mu}$
s. The scale bars are 50
 ${\rm\mu}$
m. The white arrow in the first panel identifies the inner contact line. (c) The azimuthal wavelength of the characteristic undulations at the edge of the contracting triple line versus the initial local thickness of the air film, shown in the inset. (d) Comparison of the air-film thickness profile for identical water drops (
 $V=3.10$
m s
 $^{-1}$
,
 $R_{b}=4.0$
mm,
 $St=1.5\times 10^{-6}$
,
 ${\it\epsilon}^{-1}=8.3$
,
 $We=344$
) impacting onto a Corning glass surface (open circles) and
 $20\times 10^{6}$
cSt silicone oil (filled squares).

3.2. Impact on ultra-viscous liquid substrate
In a further attempt to reduce the surface roughness, we also tried impacts onto an ultra-viscous liquid film. Using a liquid surface one can minimize any asperities, other than possible dust settling on the surface. In figure 4(d) we first compare the thickness profiles
 $h(r)$
of the air layers for impacts of identical water drops onto Corning glass versus the ultra-viscous
 $20\times 10^{6}$
cSt silicone oil. One striking difference between these two substrates is the greatly reduced compression of the gas, in the air disc, for impacts onto the viscous surface. The air disc on the ultra-viscous substrate is twice as thick and 1.5 times larger in diameter. Clearly, the compliance of the ultra-viscous substrate reduces the maximum pressure, and this is a testament to the large compression that occurs (Liu et al.
Reference Liu, Tan and Xu2013; Li & Thoroddsen Reference Li and Thoroddsen2015). This is further demonstrated during the subsequent rapid expansion of the air layer, which is observed for the impact onto the solid Corning glass surface, but is almost eliminated by the viscous substrate. Here, the more compressed air on the glass expands at the centreline by a factor of 2.3 from 1.12 to 2.56
 ${\rm\mu}$
m, while on the silicone oil it expands by only a factor of 1.25 from 2.56 to 3.2
 ${\rm\mu}$
m. Here, the added inertia of the substrate plays no role, like for the case of identical liquids (Bouwhuis et al.
Reference Bouwhuis, Hendrix, van der Meer and Snoeijer2015).
Microbubbles are also left behind for this water-on-silicone-oil configuration. However, they arise not from localized contacts like in figure 3(a), but rather from an azimuthal instability of the rapidly moving triple line, as shown in figure 4(b). The wavelength
 ${\it\lambda}$
of this instability follows the local thickness
 $h(r)$
of the air film (figure 4
c) quite well, with
 ${\it\lambda}\simeq 120\;h(r)$
. Here,
 $h(r)$
is determined from the interference fringes at first contact, as shown in the inset. The wavelength grows by merging of adjacent crests, while their tips shed microbubbles which become progressively larger. Similar bubble shedding is observed for thin air layers in Mesler entrainment, see figure 4 in Thoroddsen et al. (Reference Thoroddsen, Thoraval, Takehara and Etoh2012).
The contraction of the inner edge of the air disc starts at
 $u_{edge}=10.1$
m s
 $^{-1}$
, corresponding to a capillary number based on the water properties of
 $Ca={\it\mu}\;u_{edge}/{\it\sigma}=0.14$
. The edge velocity slows as the edge thickens and the pinch-off of bubbles stops, after 13
 ${\rm\mu}$
s, when
 $u_{edge}\simeq 3.45$
m s
 $^{-1}$
, corresponding to
 $Ca=0.048$
. Regular undulations have here essentially disappeared when the edge has contracted to the radius where the original thickness was
 $h(r)\simeq 0.5~{\rm\mu}$
m.
The nature of this long-wavelength instability is unclear. The very long wavelength, compared with the layer thickness, appears to rule out a capillary Rayleigh instability of a thicker edge. Furthermore,
 ${\it\lambda}$
is orders of magnitude smaller than the radius of the air disc, so we conclude that the azimuthal curvature of the triple line is not important. It should be kept in mind that the presence of the triple line, between the water and the high-viscosity liquid, has a strong effect on its contraction, greatly slowing it down (Li et al.
Reference Li, Al-Otaibi, Vakarelski and Thoroddsen2014).
(a) Example of the rupture of the thin air film, under the gliding edge, for water on
 $20\times 10^{6}$
cSt silicone oil, for low impact velocity
 $U=1.28$
m s
 $^{-1}$
,
 $R_{b}=4.5$
mm (
 $St=3.2\times 10^{-6}$
,
 ${\it\epsilon}^{-1}=1.10$
,
 $We=59$
). The two dark arrows point out the edges of the rupture zone, which is at a significant distance behind the outer moving edge of the gliding marked by a white arrow. The scale bar is 50
 ${\rm\mu}$
m. Below is a sketch of the film rupture mechanism. (b) The band of microbubbles 11
 ${\rm\mu}$
s after the start of ruptures in (a), when the entrapment of microbubbles has stopped and the rupture front has caught up with the outer edge of the thin air layer.

3.3. Low impact velocity, skating and film ruptures
For very low impact velocities, it has been shown that drops can skate on a thin layer of air (Kolinski et al.
Reference Kolinski, Rubinstein, Mandre, Brenner, Weitz and Mahadevan2012) and even rebound without touching the substrate (Kolinski et al.
Reference Kolinski, Mahadevan and Rubinstein2014; de Ruiter et al.
Reference de Ruiter, Lagraauw, van den Ende and Mugele2015). Such skating of the outer edge on a thin layer of air is indeed observed herein for low impact velocities. In the water-on-20-million-cSt configuration, this occurs when
 $St>\sim 5\times 10^{-6}$
, corresponding to
 $We<70$
. It should be kept in mind that this is for much larger
 $We$
than the rebounding regime studied in de Ruiter et al. (Reference de Ruiter, Lagraauw, van den Ende and Mugele2015). In our impact-velocity range, these films rupture and we do not look at rebounding. Figure 5 and a supplementary movie show such a low-impact-velocity case for a water drop on a
 $20\times 10^{6}$
cSt silicone film. This thin gliding air layer then ruptures simultaneously at multiple locations around the periphery, merging into a band of ruptures, as marked by the arrows in figure 5(a). The original location of the ruptures is
 ${\sim}50~{\rm\mu}$
m behind the outer edge of the thin air layer. The edge speed of the growing wet spots is measured at
 $\simeq 15$
m s
 $^{-1}$
, which is faster than the contracting edge in figure 4, which indicates a layer thickness much thinner than 100 nm. Numerous microbubbles are entrapped where these ruptures meet, thereby forming a band of contacts, which widens rapidly in the radial direction. The outer edge of this rupture zone moves faster than the edge of the air layer marking the spreading drop (white arrow in figure 5) and catches up with it after 9
 ${\rm\mu}$
s in this realization. This eliminates the skating of the edge and the accompanying microbubble entrapment, leaving behind a 200
 ${\rm\mu}$
m wide band of bubbles. The total number of visible microbubbles in this entire band around the full periphery is here estimated to be
 ${\sim}12\,800$
, ranging in size from 1 to 5
 ${\rm\mu}$
m. The bubble sizes are smallest near the first rupture, where the air layer should be thinnest (Beilharz et al.
Reference Beilharz, Guyon, Li, Thoraval and Thoroddsen2015), and grow larger towards the edges of the band (figure 5
b). Such bands of bubbles have been observed for impacts of viscous drops in Thoroddsen et al. (Reference Thoroddsen, Etoh, Takehara, Ootsuka and Hatsuki2005), Thoroddsen, Takehara & Etoh (Reference Thoroddsen, Takehara and Etoh2010) and Palacios et al. (Reference Palacios, Hernández, Gómez, Zanzi and López2012).
4. Discussion and conclusions
Herein, we have used ultra-fast video imaging to observe the first contact of an impacting drop with a solid or an extremely viscous substrate. Our results show that
 ${\sim}10$
nm surface roughness promotes localized contacts slightly before full wetting is established, thereby leaving behind the previously observed ring of microbubbles (Thoroddsen et al.
Reference Thoroddsen, Etoh, Takehara, Ootsuka and Hatsuki2005). Impacts onto smoother glass reduce the sizes of these bubbles, and none are visible for impacts onto the molecularly smooth mica substrate, at our optical resolution. However, the first contact on the mica shows fine azimuthal undulations, the origins of which remain a mystery, but we suggest that they are due to contact line dynamics.
Impacts onto the ultra-viscous silicone surface also leave a ring of microbubbles, not due to roughness, but through an azimuthal instability at the triple line, by tip streaming.
The theory of Mandre & Brenner (Reference Mandre and Brenner2012) (their figure 8a) presents the roughness needed to interfere with the lubricating air film for different impact conditions. For our water drop sizes and impact velocities, the very small roughness of the freshly cleaved mica sheets should be insufficient to break the lubricating films in figure 3(b). This implies that some phenomenon that is left out of their skating model is at play. We suggest that the ruptures are due to van der Waals forces, when the air film becomes significantly thinner than 100 nm, which we cannot measure with our optical set-up. The fact that ruptures arise simultaneously along the periphery and at the same radial distance, in figure 5(a), rules out isolated larger asperities as the trigger.
Furthermore, even for molecularly smooth mica surfaces the continuous contact shows that the skating solutions are not realized above a moderate impact velocity.
Acknowledgement
The work reported herein was funded by King Abdullah University of Science and Technology (KAUST). The AFM imaging was performed in the KAUST Microfluidics Thrust Area Labs.
Supplementary movies
Supplementary movies are available at http://dx.doi.org/10.1017/jfm.2015.643.