Introduction
Much of the uncertainty in crop and grassland model predictions of how arable and grassland systems respond to changes in management and environmental drivers can be attributed to differences in the structure of these models. This has created an urgent need for international benchmarking of models, in which uncertainties are estimated by running several models that simulate the same physical and management conditions (ensemble modelling) to generate expanded envelopes of uncertainty in model predictions (Asseng et al., Reference Asseng, Ewert, Rosenzweig, Jones, Hatfield, Ruane, Boote, Thorburn, Rötter, Cammarano, Brisson, Basso, Martre, Aggarwal, Angulo, Bertuzzi, Biernath, Doltra, Gayler, Goldberg, Grant, Heng, Hooker, Hunt, Ingwersen, Izaurralde, Kersebaum, Müller, Naresh Kumar, Nendel, O’Leary, Olesen, Osborne, Palosuo, Priesack, Ripoche, Semenov, Shcherbak, Steduto, Stöckle, Stratonovitch, Streck, Supit, Travasso, Tao, Waha, Wallach, White and Wolf2013). Simulations of C and N fluxes, in particular, are inherently uncertain because they are driven by complex interactions (Sándor et al., Reference Sándor, Barcza, Hidy, Lellei-Kovács, Ma and Bellocchi2016) and complicated by considerable spatial and temporal variability in the measurements. In this context, the Integrative Research Group of the Global Research Alliance (GRA) on Agricultural Greenhouse Gases promotes a coordinated activity across multiple international projects (e.g. C and N Models Inter-comparison and Improvement to assess management options for GHG mitigation in agrosystems worldwide (C-N MIP) and Models4Pastures of the FACCE-JPI, https://www.faccejpi.com) to benchmark and compare simulation models that estimate C–N related outputs (including greenhouse gas emissions) from arable crop and grassland systems (http://globalresearchalliance.org/e/model-intercomparison-on-agricultural-ghg-emissions). This study presents some preliminary results on the uncertainty of outputs from 12 grassland models, whereas exploring differences in model response when increasing data resources are used for model calibration.
Material and methods
Data from five long-term, grazed experimental sites were used, covering a variety of pedo-climatic conditions and agricultural practices worldwide (France, New Zealand, Switzerland, UK and USA). In total, 12 process-based grassland models (Soussana et al., Reference Soussana, Ehrhardt, Snow, Sándor, Bellocchi, Grace and Recous2016), varying in their complexity and underlying assumptions, were compared. During the modelling exercise, modellers were given access to gradually more detailed data to run and evaluate their models, using a multi-stage protocol. To test model simulations against independent experimental data, model evaluation included five ascending calibration levels from uncalibrated (Stage 1) to fully calibrated simulations (Stage 5). The five calibration stages included the use of (i) no data, that is a blind test without model calibration, (ii) historical climate and management data, (iii) biomass production and phenology data, (iv) soil temperature and moisture data, and (v) nitrous oxide emission and soil organic C and N data. To investigate inter-annual uncertainties in grassland offtake (hereafter biomass yield), above-ground net primary production (ANPP) and leaf area index (LAI) simulations, we characterized weather conditions at each site based on the annual values of De Martonne–Gottmann aridity index (Diodato and Ceccarelli, Reference Diodato and Ceccarelli2004), maximum air temperature (T max) and precipitation (Prec). We quantified the relationship between standardized model residuals (differences between simulated and observed data, divided by an estimate of their standard deviations) to evaluate whether errors in one output propagate to other outputs. We also quantified the relationship between standardized residuals and weather drivers.
Results and discussion
Although analysis of results is ongoing, a few illustrative results are given here for two production outputs predicted by the ensemble of models: ANPP and biomass yield.
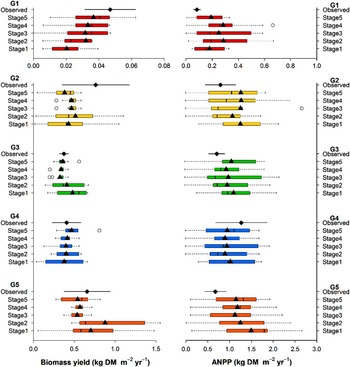
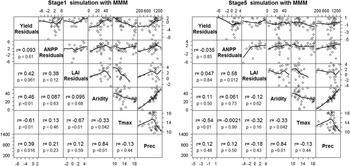
Overall, biomass yield was better simulated than ANPP, in particular at sites G2 to G5 (Figure 1, right). Simulations of biomass yield became more accurate with successive calibration steps (stage 1 through 5) as increasingly detailed data were used (Figure 1, left). A general overestimation of ANPP measurements was observed at all but the G4 site. In general, calibrated models fit better to observations after Stage 2 (Figure 1, left), indicating that simulation uncertainties can be considerably reduced when calibration is based on production and phenology data. This notwithstanding, observed biomass yields showed strong inter-annual variability at most sites with inter-annually changing weather conditions. Figure 2 shows the correlation between the annual standardized residuals of the multi-model medians (MMM) of biomass yield, ANPP and LAI with weather drivers. The correlations of MMM residuals were generally moderate, but higher at Stage 1. For instance, the correlation coefficient (r) of yield residuals was 0.42 with LAI residuals, 0.46 with aridity and 0.39 with precipitation at Stage 1, whilst lower values were observed at Stage 5 (r=0.047, 0.11 and 0.12, respectively). This indicates that model uncertainties tended to decrease with more detailed calibration. In contrast, correlation coefficients of ANPP residuals exhibited a more complex pattern, indicating that the conclusion of a declined uncertainty with increasing calibration details cannot be generalized.
Observed and simulated multi-year average biomass yield (left) and above-ground net primary production (right) for five locations (G1 to G5) using 12 models in five calibration stages. Diamonds show the mean observed yields over different grazing seasons ±1 SD. Triangles show the mean of simulated data for each location and calibration level. Boxes are delimiting the 25th and 75th percentiles with the median inside. Whiskers are 10th and 90th percentiles. Hollow circles indicate outliers.

Pairwise scatterplots with loess smoothers (bold lines) for the standardized residuals of simulated annual yield biomass, above-ground net primary production (ANPP) and leaf area index (LAI) of the multi-model median (MMM) of 12 models, aridity, maximum temperature (annual average) and precipitation (annual sum) across five sites at Stage 1 (left) and Stage 5 (right).

Conclusions
In this study substantial differences in the outputs of 12 grassland models were obtained, indicating uncertainty in simulated grassland processes. Uncertainties for some outputs (e.g. biomass yield) reduced after calibration with detailed production and phenology data. The multi-model approach also allowed for improved performance, as reflected by standardized residuals. Locally calibrated models (stage >2) more reliably assess mitigation options at the studied sites than uncalibrated models.
Acknowledgements
This research was performed within the Global Research Alliance on Agricultural Greenhouse Gases initiative with the support of FACCE-JPI projects CN-MIP and Models4Pastures.