Introduction
Product quality inspection is one of the most important steps in the manufacturing process (Chin and Harlow, Reference Chin and Harlow1982). The tasks of inspection involve detection, measurements, or diagnosis and require a substantial amount of reasoning capability to make the final decision on product quality. Traditionally, inspection tasks are assigned to human experts for manual inspection. Today's competitive market and modern manufacturing system need to shift the manual inspection to an automated level to speed up the production rate while maintaining rigorous production quality. However, the attempts to automate the inspection tasks is progressing in slow pace compare to other fields such medical inspection and diagnosis. Considering this fact, recently many researchers have focused in this area to facilitate an automated inspection procedure by integrating cutting-edge technologies and computation methods (Esmaeilian et al., Reference Esmaeilian, Behdad and Wang2016). Hence, it is necessary to introduce effective and efficient methodologies into manufacturing systems to take advantage of the automation in order to meet the demand of the 21st century.
Composite materials, such as fiber and particle reinforced materials, have been reported to have the potential to revolutionize almost any industry sector ranging from engineering structure, electronics, energy and biomedical to aerospace (Liu, Reference Liu1997; Mangino et al., Reference Mangino, Carruthers and Pitarresi2007; Kim et al., Reference Kim, Sykulski and Lowther2009; Scholz et al., Reference Scholz, Blanchfield, Bloom, Coburn, Elkington, Fuller, Gilbert, Muflahi, Pernice, Rae and Trevarthen2011; Liu et al., Reference Liu, Wu, Zhou and Li2016; Wu et al., Reference Wu, Liu and Zhou2016, Reference Wu, Yuan and Li2017). In composite manufacturing, fillers (e.g., fibers and particles) are reinforced into the base materials to achieve superior properties over the original materials. The spatial homogeneity, length, alignment orientation, and fiber–particle mixing ratio in the underlying material play a decisive role in determining the final properties of the composites (Doshi and Charrier, Reference Doshi and Charrier1989; Yu et al., Reference Yu, Brisson and Ait-Kadi1994). For example, the thermal conductivity of copper filled composites depends on the shape and size, and the volume fraction and spatial arrangement of the filler particles in the polymer matrix (Tekce et al., Reference Tekce, Kumlutas and Tavman2007). The fiber orientation greatly affects the wear behavior of polymer composite materials (Cirino et al., Reference Cirino, Friedrich and Pipes1988). Besides, the composites possess stronger mechanical properties in the direction of fiber alignment (Frangopol and Recek, Reference Frangopol and Recek2003). Therefore, the morphological characteristics of fillers in the base material need to be inspected and controlled to achieve desirable material properties.
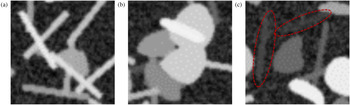
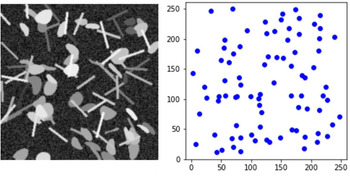
The Scanning Electron Microscopic (SEM) images are commonly used to perform the morphology analysis of product quality (Kovacs et al., Reference Kovacs, Andresen, Pauls, Garcia, Schossig, Schulte and Bauhofer2007; Mortell et al., Reference Mortell, Tanner and McCarthy2014). However, manual inspection of SEM images is often subjective and time-consuming. It is prone to missing relevant pattern/distribution and incorrectly identifying the fibers and particles in SEM images. Besides, it is not able to extract quantitative information of the filler alignment and spatial distribution for quality characterization. Automated visual inspection can overcome these shortcomings by making the procedure free of human involvement and can be utilized to facilitate consistent and cost-effective quality inspection. However, the tasks of automatic identification and segmentation of fibers and particles in SEM images still remain challenging in the automated inspection and computer vision domains. These challenges are due to overlapping or cross-linking effects among fibers and particles, and contrast problems in SEM images, as shown in Figure 1. Moreover, the task of identifying fibers and particles becomes more difficult when a large number of fibers and particles are embedded into the base material.
Illustration of the challenges in fiber and particle identification and segmentation (a) and (b) fibers and particles are overlapped with each other; (c) the presence of fibers and particles in the SEM images is vague due to poor contrast.

The detection and segmentation of rounded and circular particles using traditional image processing and computer vision techniques has been intensely studied, especially in the field of biomedical and material science (Yin et al., Reference Yin, Bise, Chen and Kanade2010; Park et al., Reference Park, Huang, Huitink, Kundu, Mallick, Liang and Ding2012a; Wang, Reference Wang2016; Rahman et al., Reference Rahman, Tseng, Pokojovy, Qian, Totada and Xu2021a). One of the popular methods is edge-based image segmentation, where the boundary of the object is detected using some algorithms, for example, Moore neighborhood (Sharma et al., Reference Sharma, Diwakar and Lal2013), ellipse fitting technique (Rosin, Reference Rosin1993), or watershed techniques (Mangan and Whitaker, Reference Mangan and Whitaker1999). Edge-based segmentation has been applied to segment uniformly distributed particles from the background with reasonable accuracy (Kothari et al., Reference Kothari, Chaudry and Wang2009; Luo et al., Reference Luo, Liu, Huang and Li2017). However, the edge-based approach fails to segment individual objects or cells when they overlap with each other. These methods are only able to segment or detect boundary of disjoint objects. A number of researchers have proposed background subtraction method. This method extracts the background of a processed image and leaves the foreground containing the objects and random noise (Wang and Liao, Reference Wang and Liao2002; Nacereddine et al., Reference Nacereddine, Zelmat, Belaifa and Tridi2005). However, the background subtraction method is very sensitive to noise and overlapping issue. A graph-cut method has also been applied in particle segmentation. The method constructs a graph by treating each image pixel as a node. Each pair of nodes is connected by an edge with similarity between pixel intensities. It finds a normalized minimum cut of the graph, which naturally segments an image (Felzenszwalb and Huttenlocher, Reference Felzenszwalb and Huttenlocher2004). This approach does not separate overlapping objects well, especially when the overlapping objects have similar intensity levels. Hough Transform (HT) is another very popular method to identify a certain class of shapes, such as lines, circles, and ellipses, by a voting procedure (Illingworth and Kittler, Reference Illingworth and Kittler1988). Literature also reports the use of partition-based HT, gradient-based HT, and break-merge method to detect the fibers from SEM images (Rahman et al., Reference Rahman, Wu and Tseng2018, Reference Rahman, Wu and Tseng2021b). This method integrates the partitioning step and gradient information into the HT algorithm to tackle the issue of overlapping fibers. The break-merge method used the density-based clustering (DBSCAN) algorithm to identify the overlapping pixels as the breaking point and later merged together based on proximity and orientation test among the broken fibers. However, the application of these methods is limited to extract short fibers and are not fully automated.
Filler detection and segmentation is similar to the problem of defect detection in X-ray or SEM imaging for industrial applications. In Reference Li, Tso, Guan and Huang2006, Li et al. integrated some traditional image processing methods and wavelet technique to facilitate automatic detection of air holes and foreign objects in X-ray images. A range of feature extraction-based methods have also been proposed in the literature. In Strecker (Reference Strecker1983) and Zheng and Basart (Reference Zheng and Basart1988), each image pixel is classified as defect or not depending on features that are usually computed from a pixels neighborhood.. A number of features are manually identified to classify individual pixels. Common features include statistical descriptors such as mean, standard deviation, skewness, kurtosis, and localized wavelet decomposition. Several Bayesian networks and multivariate image analysis approaches have also been proposed (Jung et al., Reference Jung, Shim, Ko and Nam2008; Sarkar et al., Reference Sarkar, Doan, Ying and Srinivasan2009), but these techniques have largely been superseded by modern deep learning-based computer vision techniques. Object detection is a very popular approach in modern computer vision domain, which deals with fitting a bounding box around a certain class of objects in digital images or videos (Voulodimos et al., Reference Voulodimos, Doulamis, Doulamis and Protopapadakis2018). Similarly, semantic segmentation refers to the process of linking each pixel in images to a class label. The process of semantic segmentation can be considered as image classification at the pixel level. This kind of detection and segmentation can be very useful in applications that are used to count the number of objects and their shapes. The literature is well documented with many state-of-the-art object detection systems based on the regional-based convolution neural network (RCNN; Toth et al., Reference Toth, Koppanyi, Xu and Grejner-Brzezinska2017). The RCNN algorithm places a number of boxes in the image and checks if any of these boxes contain any of the objects. RCNN uses selective search to extract these boxes from an image, which are referred to as potential regions. Selective search identifies the basic features (e.g., scales, colors, textures, intensity, or enclosure) from the images. Based on that, various regions are proposed. Once the proposals are made, RCNN reshapes all the regions to a uniform square size and passes it through a feature extractor. A support vector machine (SVM) classifier is trained to classify the objects and the background. One binary SVM is trained for each class. Later, a linear regression model is used to fit the bounding boxes for each identified object in the image. In most of recent object detection architectures, for example the region-based fully convolution networks (R-FCN), each component of the object detection network is replaced by a deep neural network (Dai et al., Reference Dai, Li, He and Sun2016).
In this paper, we propose a deep learning-based filler detection system to extract the filler morphology (size distribution, orientation distribution, and spatial homogeneity) from SEM images. The filler detection system is developed based on Mask Region-based CNN (Mask R-CNN) architecture (He et al., Reference He, Gkioxari, Dollár and Girshick2017) which is one of the state-of-the-art architectures in computer vision. It can simultaneously solve the object detection and segmentation problems which facilitates the filler morphology analysis. Major applications of Mask R-CNN include identifying common objects in natural images with big sizes and elongated shapes. It is now making its way with various applications in nearly every domain with different modified architectures (Zhao et al., Reference Zhao, Kang, Jung and Sohn2018; Ganesh et al., Reference Ganesh, Volle, Burks and Mehta2019; Uribe et al., Reference Uribe, Belmonte, Moreno, Llorente, López and Álvarez2019; Wessel et al., Reference Wessel, Heinrich, von Berg, Franz and Saalbach2019). The automated visual inspection in composite manufacturing involves objects that are relatively small and morpha. To fit our specific problem, the structure of Mask R-CNN is modified and customized to perform the simultaneous classification, detection, and segmentation of fillers. To train and evaluate the CNN model, sufficient data are often needed. However, it is not realistic or easy to collect a large number of SEM images. To this end, this paper also proposes an artificial SEM image simulation procedure. The procedure is publicly available on GitHub page for open access (Image Synthesis With Annotation, 2019). This procedure can generate SEM images to meet the demand for training data, which is of separate interest to the research community. The proposed deep learning method is trained using the simulated images. The performance and robustness of the trained model are thoroughly investigated using three different simulated test datasets.
The rest of the paper is organized as follows. Section “Methodology” describes in details the methodologies for detection and segmentation of embedded fillers in SEM images, including the SEM simulation procedure, image mask generation, and various components of the deep neural network architecture. In Section “Experimental design and training”, the experimental design, training hyperparameters, and the implementation procedure are discussed in detail. Section “Result and discussion” discusses the accuracy and efficiency of the proposed method for three different cases based on simulated SEM images and real SEM images. Section “Conclusion and discussion” presents the conclusion and discussion.
Methodology
In this section, a fillers detection system is proposed to classify, detect, and segment fibers and particles in SEM images. The detection system is designed based on the Mask R-CNN (He et al., Reference He, Gkioxari, Dollár and Girshick2017). The detection system is composed of four modules, namely, the feature extraction, region proposal network (RPN), region-based detector (RBD), and segmentation network. The details are described in the section “Filler detection system”. Due to the scarcity of available SEM images, we propose an artificial SEM images generation approach as described in the section “SEM image simulation procedure”. Section “Ground truth and annotation file generation” describes the procedure to generate the ground truth and annotation file, which will be used to train the filler detection system.
Filler detection system
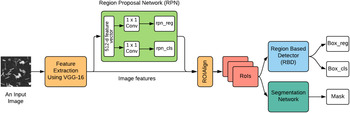
The proposed system simultaneously performs fillers detection, classification, and segmentation, making it useful in automated visual inspection. We designed the filler detection system motivated by the novel architecture Mask R-CNN (He et al., Reference He, Gkioxari, Dollár and Girshick2017). The proposed detection system can be subdivided into four major modules, namely, feature extraction, RPN, RBD, and segmentation network, as shown in Figure 2.
The deep learning architecture for detection, classification, and segmentation of fibers and particles.

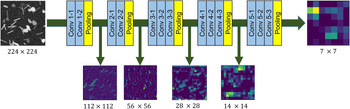
Module 1: This module works as the backbone of the other three modules. It is a feature pyramid network (FPN; Lin et al., Reference Lin, Dollár, Girshick, He, Hariharan and Belongie2017)-based neural network that generates a superficial featured representation of an input image. Many CNN-based object detection systems use the VGG-16 and ResNet-101 architecture to extract features from the raw images (Girshick et al., Reference Girshick, Donahue, Darrell and Malik2014; Ferguson et al., Reference Ferguson, Ronay, Lee and Law2018). The ResNet-101 feature extractor is a very deep convolutional neural network with 101 trainable layers, whereas the VGG-16 architecture only contains 16 trainable layers. Considering the computational complexity, we choose the VGG-16 architecture as the backbone for the feature extraction. Some feature maps from different layers of the feature extraction module are shown in Figure 3. The advantage of this feature extraction module is that it can correlate the most important features with the fibers and particles and discards the redundant features.
Feature extraction from the different layers of VGG-16 network.

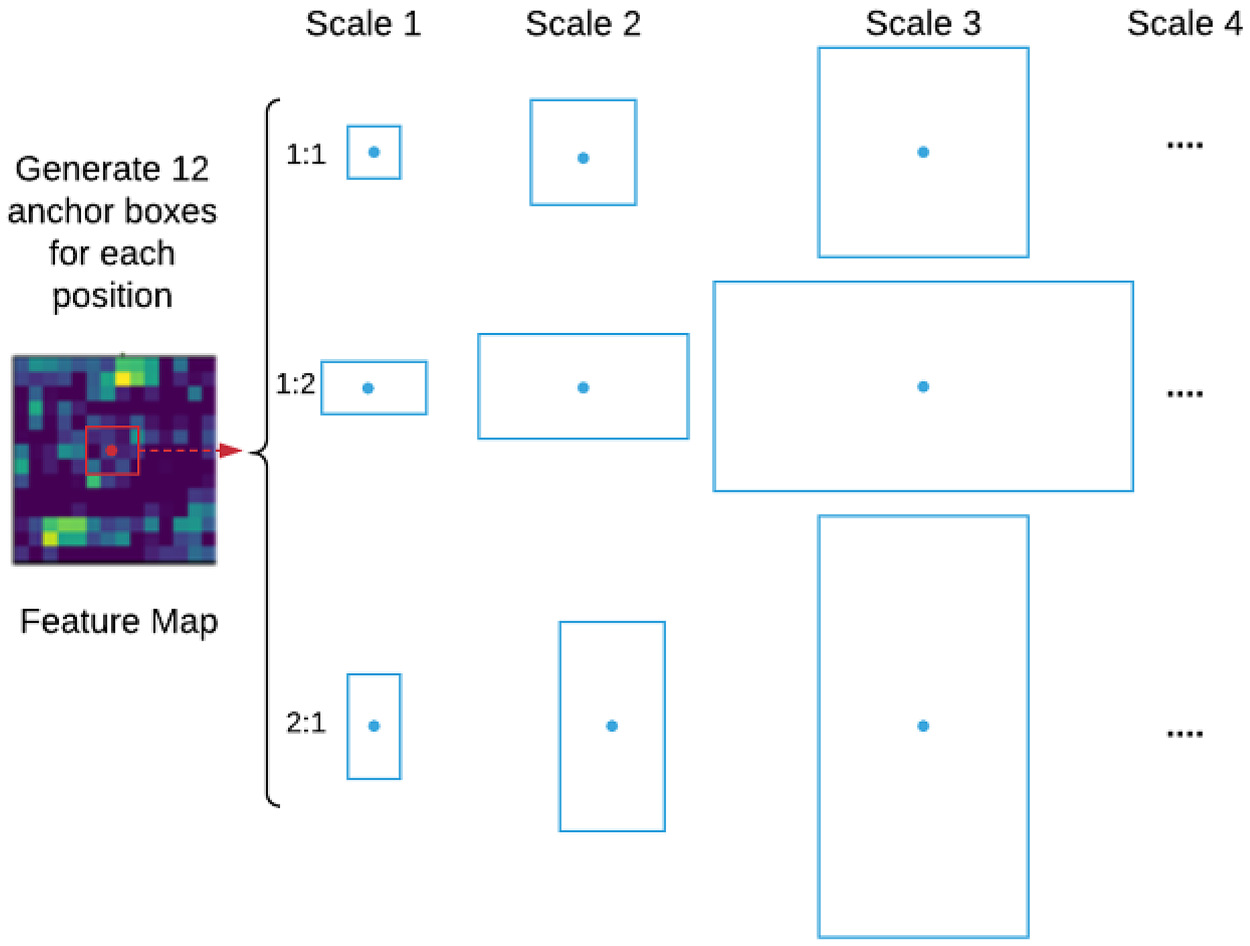
Module 2: In this module, a small neural network called region proposal network (RPN) is employed to scan all feature maps obtained from the previous module. This proposes potential regions which may contain fibers and particles. The output of the RPN is a vector containing the bounding box coordinates and likeliness of objects at the current sliding position, commonly known as RPN regression (rpn reg) and RPN class (rpn cls), respectively. While scanning the feature map, it is necessary to bind features to their raw image location. This is done by using the concept of anchor boxes. Anchors are a set of boxes with predefined locations and scales related to the original image. Depending on object size and shape, the anchor boxes vary in aspect-ratio and scale, so that they can cover all potential objects in the image. In our situation, the size of the fibers and particles varies from small to medium with circular and rectangular shape, respectively. In this paper, anchor boxes with four different scale factors (4, 8, 16, 32) and three aspect-ratios (1:1, 1:2, 2:1) are used, that is, 12 (4 × 3) anchors for each sliding position of the feature map, as shown in Figure 4. Note that, as the fillers are relatively small, a larger scale factor such 64 or aspect-ratios like 3:1 would be redundant in our case and increase the computational cost. The total number of anchors for each image is 12WH, where W and H are the width and height of the feature map, respectively. These anchors are assigned to different labels based on the best match with the ground truth box. The best match is determined using the intersection-over-union (IoU) metric, which is defined as
 $${\rm IoU} = \displaystyle{{{\rm area( bbo}{\rm x}_i\cap {\rm bbo}{\rm x}_{{\rm gt}}) } \over {{\rm area( bbo}{\rm x}_{i\;}\cup {\rm bbo}{\rm x}_{{\rm gt}}) }},$$
where  ${\rm bbo}{\rm x}_i\cap {\rm bbo}{\rm x}_{{\rm gt}}$ denotes the intersection of any specific anchor i and ground truth bounding boxes and
 ${\rm bbo}{\rm x}_i\cup {\rm bbo}{\rm x}_{{\rm gt}}$ denotes their union. Here, the anchors with IoU value higher than 0.7 are considered as the best match bounding box with respect to the ground truth.
Illustration of anchor boxes used for any specific position in the feature map.

For RPN, we utilize a small network by sliding a 3 × 3 window over the feature map to convert the features to a 512-dimensional feature vector followed by a ReLU layer. This feature vector is fed into two siblings 1 × 1 convolution layers, namely, the box-regression (box reg) layer and box-classification (box cls) layer. The box-classification layer estimates the probability of fillers and non-fillers for each anchor box, whereas the box-regression layer predicts the bounding box coordinate for each proposal. The RPN network is trained to minimize the two types of loss, that is, the location-based loss and the classification loss. For each anchor, i, the best matching filler bounding box b is selected using the IoU metric. If such a match is found, anchor i is assumed to have an object (fibers or particles) and is assigned a ground truth class label c* = 1 or 2 (1 for fiber and 2 for particle). Besides, a vector encoding bounding box b is created with respect to anchor i. This vector encoding is denoted as φ(b i;i). If no match is found, it is assumed that anchor i does not contain any fibers or particles and the class label is set to as c* = 0. During the training process of RPN, if the predicted bounding box encoding for anchor i is P box(I;i, θ) and the corresponding ground truth is φ(b i;i), the location-based loss is defined as
 $$L_{\rm bbox}( i, \;I; \;\theta ) = c^\ast {\cdot} \tau ( \varphi ( b_i; \;i) -P_{\rm box}( I; \;i, \;\theta ) ) , $$
where τ( ⋅ ) is the l 1 smooth loss as defined in Girshick (Reference Girshick2015), I is the image, and θ is the model parameter. The vector encoding of box b with respect to anchor i is defined as
 $$\varphi ( b; \;i) = \left[{\displaystyle{{x_c} \over {w_i}}, \;\displaystyle{{y_c} \over {h_i}}, \; \log w , \; \log h} \right]^T,$$
where x c and y c are the center coordinates of the box, w and h are the width and height of the box, respectively. Continuing, w i and h i are the width and height of the anchor i. Again, if the predicted class is P cls(I;i, θ), then the classification loss is defined as
 $$L_{\rm cls}( {i, \;I; \;\theta } ) = \rho ( {c^{\ast} , \;P_{\rm cls}( {I; \;i, \;\theta } ) } ) , $$
where ρ is the cross-entropy loss function and c* is the ground truth class label. The total loss for anchor i is expressed as the weighted sum of the location-based loss and the classification loss
 $$L( I; \;\theta ) = \alpha \cdot L_{\rm bbox}( i, \;I; \;\theta ) + \beta \cdot L_{\rm cls}( i, \;I; \;\theta ), $$
where α and β are weights chosen to balance localization and classification losses (Huang et al., Reference Huang, Rathod, Sun, Zhu, Korattikara, Fathi, Fischer, Wojna, Song, Guadarrama and Murphy2017). To train the fillers detection model, Eq. (5) is then averaged over the set of anchors and minimized with respect to the parameter θ.
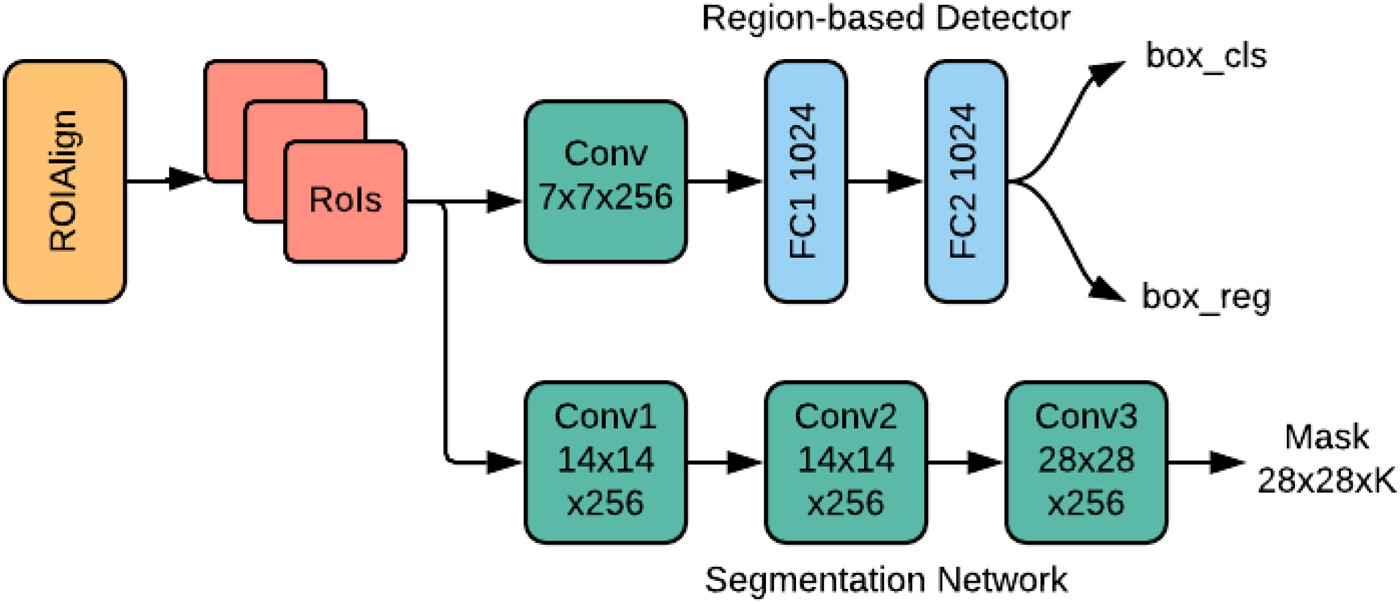
Module 3: This module selects the top n anchor boxes (regions) based on the probability of the box-classification (box cls) obtained from module 2. In this module, the RBD is used to classify the fillers in each region and fine-tune the bounding box coordinates. The reader is referred to Girshick (Reference Girshick2015) for more detailed description on RBD. According to the regressed bounding box (box reg), the output of the VGG-16 feature extractor is cropped and fed into the RBD as its input. Note that the size of the input depends on the size of the bounding box. However, the architecture of RBD requires that all are of a fixed size. This issue has been addressed using the concept of ROIAlign layer (He et al., Reference He, Gkioxari, Dollár and Girshick2017). ROIAlign works by making every target cell have the same size. It applies interpolation to calculate the feature map values precisely within the cell, which produces a significant improvement in the accuracy. The resulting feature vectors are fed into the RBD network. Here, the RBD network contains two convolutional and fully connected (FC1 and FC2) layers as shown in Figure 5. This small network produces two outputs vectors, where the first vector (box cls) contains the probability estimation for each K object classes and the second vector (box reg) refines the position of the bounding box of the K classes. The RBD is trained by minimizing the joint regression and classification loss function, similar to the one used for the RPN.
Region-based detector and segmentation network.

Module 4: This module deals with pixel-wise segmentation of fibers and particles. Fillers are segmented by deploying a CNN network alongside the RBD, as shown in Figure 5. This CNN network is referred to as the instance segmentation network which predict a segmentation mask for each RoI (region of interest). The segmentation network uses a block of features cropped from the output of the feature extractor as its input and generates k binary masks of m × m pixels, one for each of the k classes. Here, a per-pixel sigmoid function is used to train the segmentation network. The loss function L mask is defined as the average of the binary cross-entropy loss. Note that only the binary mask corresponding to the ground truth class K contribute to the L mask, while the other output masks do not contribute to the loss function. Thus, L mask allows the segmentation network to generate masks for every class without competition among the classes. This module is trained by minimizing the joint RBD and mask loss. During testing, a total of k masks are predicted, one for each class. However, the mask corresponding to the predicted class from the RBD branch is used. The m × m floating-number mask output is then resized to the RoI size, which is later binarized using a threshold value of 0.5.
SEM image simulation procedure
The deep learning method requires voluminous data to train the network. Collecting a large amount of data is very time-consuming and difficult, especially in industrial applications. Considering this fact, we propose a simulation approach to generate artificial SEM images for training of the filler detection system. The SEM images used in this paper contain two types of fillers, that is, fibers and particles. The fibers are rectangular-shaped, whereas the particles are mostly circular and amorphous in shape.
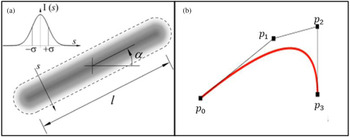
The fibers are artificially generated by specifying their corresponding centroid, width, length, and orientation. Given the image resolution, the centroids are randomly selected within the image. The length (l) of the fibers follows a normal distribution with mean of 40 pixels and standard deviation of 5 pixels. The fiber width remains fixed at 4 pixels. The fiber orientation angles (α) are uniformly distributed between −π/2 and π/2. The intensity of the gray level image at each pixel follows a truncated normal distribution N(μ = 192, σ = 32) within the range of 0 to 255. Following the fiber generation, a 2D Gaussian filter with standard deviation 2 is applied to smooth the fibers. A schematic diagram of fiber generation is shown in Figure 6a. The particles are generated according to the principle of Bezier curve formation. A Bezier curve is a parametric curve used in computer graphics and related fields (Mortenson, Reference Mortenson1999). It is used to smooth any curves while scaling indefinitely. The underline principle of Bezier curve formation utilizes Bernstein polynomials which are defined by a set of control points p 0 through p n where n is called the order of Bezier curve.
(a) Fiber generation and (b) particle generation.

In this paper, we used cubic Bezier curves to generate the particles, which implies that we need four control points p 0, p 1, p 2, and p 3. Here, p 0 and p 3 represent the start and end points, respectively. As the particles are in circular shape, we specify the start point (p 0) and end point (p 3) at the same coordinate to create the closed form. The other two control points p 1 and p 2 control the shape of the particle, as shown in Figure 6b. Each particle is generated by randomly picking the four points under the constraint of a maximum distance among the points. The upper bound of this distance is a parameter to control the size of particles, which is set as 30 in our case.
Artificial SEM images are generated using different combination of fibers and particles. Each simulated image can contain any number of fillers with different mixing ratios. Here, we generate images with 50 fillers with 50%–50% (fibers–particles) mixing ratio. In other words, each simulated image contains 25 fibers and 25 particles. The image resolution is set to 256 × 256 pixels. Apart from these fibers and particles, the rest of the image is considered as background which has the pixel value of 0 (black). But in real SEM images, the background does not appear as black, rather it remains very obscure. To make the simulated image more realistic, a uniform random noise (U[0, 0.4]) is added to the image background. In each image, the positions of fibers and particles are randomly chosen. This makes every image different and more natural.
Ground truth and annotation file generation
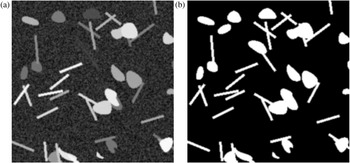
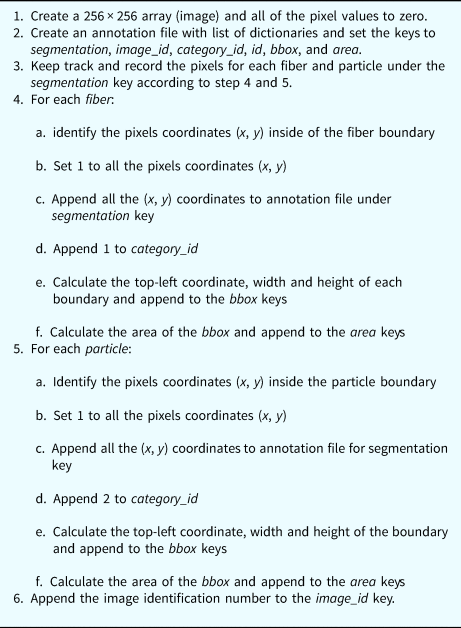
To train a deep learning network, each training dataset should have its corresponding ground truth. Besides the training, ground truth is also used to quantify how good an automated segmentation is with respect to the true segmentation. Ground truths are the true or accurate segmentations that are typically made by one or more human experts from the corresponding field. In this paper, as we are using simulated images, the ground truth can be generated without expert's help. While simulating the images, we generate the ground truth for each image; here we call it as mask. This mask is a binary image with the pixels value of 1 for fillers and 0 otherwise, that is, for the backgrounds. To generate the ground truth, we take a 256 × 256 image and initially set the value of zero (0) to all of pixels. Later, we change the pixel value to 1 if it belongs to fibers or particles, as shown in Figure 7b. Note that we have two categories of fillers – fibers and particles. The pixel value of 1 along cannot tell us whether it is from a fiber or particle. Moreover, the overlapping phenomenon of fibers and particles may add the complexity in the filler differentiation. So, we need to keep track of pixels for accurate filler distinction. This is done by creating an annotation file. The annotation file is a list of dictionaries which contains the keys: segmentation, image_id, category_id, id, bbox, and area. The segmentation key has two attributes: fibers and particles. These two attributes are two separate lists to keep record of pixel coordinate. Once we detect the pixels inside the fibers or particles boundary, we append them to the annotation file under segmentation key and respective category. The other keys in the annotation file help track some additional information related to the image and ground truth. For example, image_id indicates the identification number of the image; category_id is used to track the category of the pixels (1 for fibers and 2 for particles); bbox refers to the bounding box coordinate of the respective category and the area keeps record of the total area of the bounding box. The ground truth and annotation file for each image are generated simultaneously. The procedure is shown in Table 1.
(a) Artificial SEM image and (b) mask (ground truth) of the image.

Ground truth and annotation file generation procedure

Experimental design and training
This section describes the experimental design and implementation of the fillers detection system demonstrated in the previous section. The SEM images are simulated based on the procedure described in the section “SEM image simulation procedure”. While generating the images, we also generate the corresponding ground truth and annotation file for each image, as described in the section “Ground truth and annotation file generation”. These ground truth and annotation files are used to train the model. A total of 4000 images are generated with size of 256 × 256 pixels. Among them, 3200 (80%) images are used for training, 800 (20%) images are used for validation purpose. For testing, we generate three different test datasets, namely, testset-I, testset-II, and testset-III. Each test dataset has 100 images with different number of fillers. Each image of testset-I, testset-II, and testset-III has 20, 50, and 100 fillers, respectively, among which 50% are fibers and 50% are particles. The primary motivation behind generating three different test datasets is to show the robustness of the proposed methodology to detect, classify, and segment fillers from SEM images with different filler densities.
The training phase of a deep learning network requires a large number of images for reliable detection and segmentation results, whereas we only have 4000 images for training the model. Although we can generate any number of images using our proposed image simulation procedure, it is not feasible to get an enormous amount of SEM images in practical applications. Considering this fact, we intentionally generate a limited number of images to train our model. However, we integrate image augmentation technique and transfer leaning to overcome the limitations and improve the accuracy. In image augmentation procedure, each image is rotated  $90^\circ , \;\;180^\circ$, and
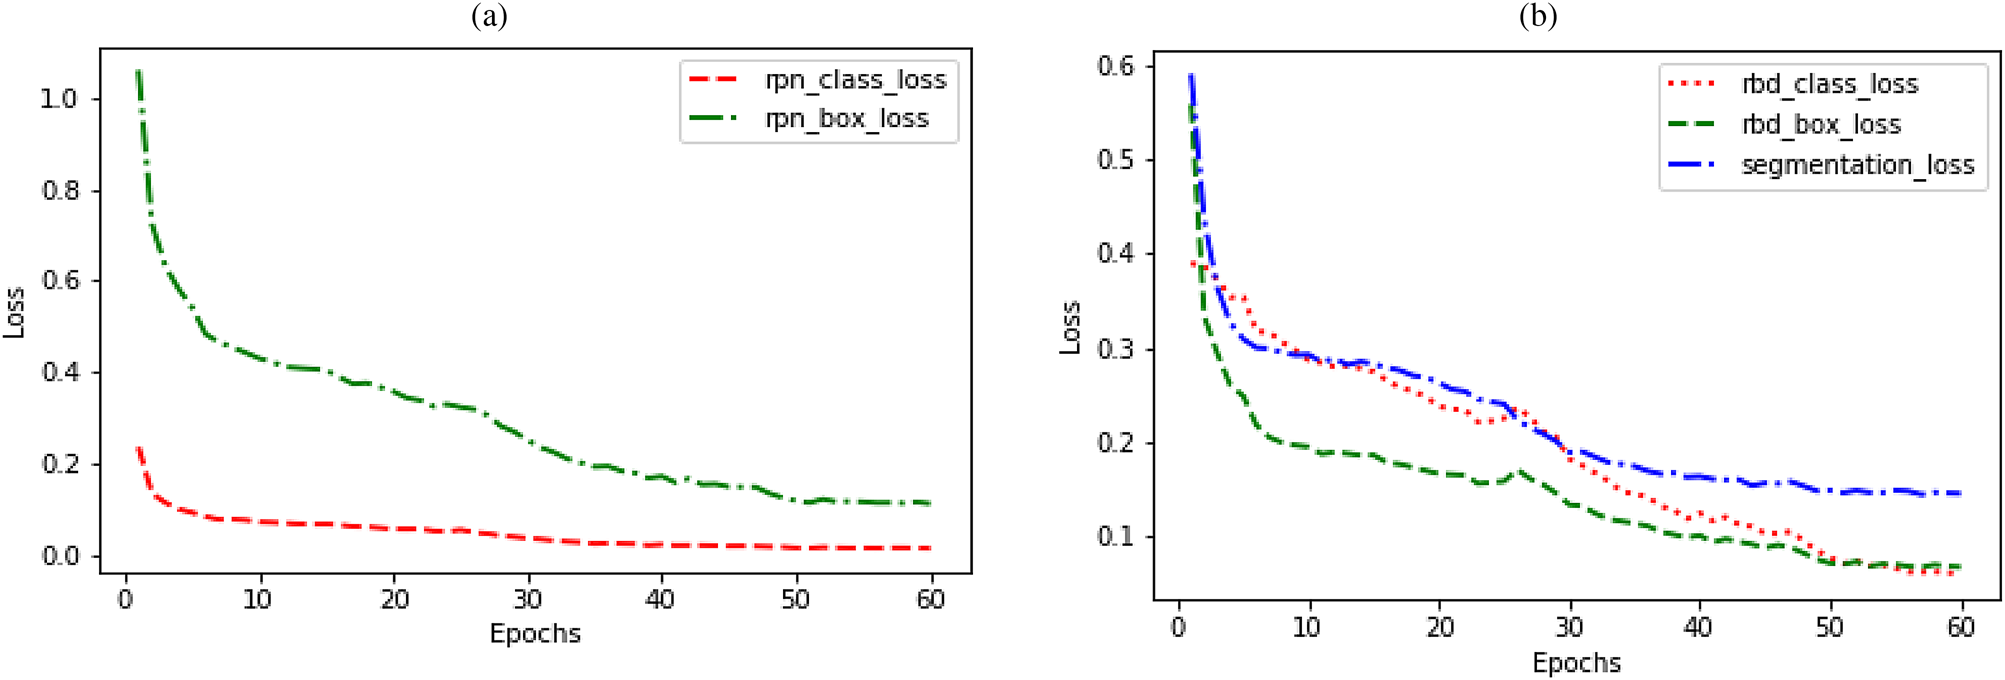
 $270^\circ$ during the training process. This strategy eventually increases the training datasets by a factor of three. Besides, Transfer Learning helps improve the generalization of a setting by utilizing the learned features from another setting. The model is trained by loading the pre-trained weights from the Microsoft COCO dataset (Lin et al., Reference Lin, Maire, Belongie, Hays, Perona, Ramanan, Dollár and Zitnick2014). Nonetheless, our model still needs to be fine-tuned according to our own purpose as the COCO dataset is trained to predict other 80 object classes. Here, our dataset contains only three classes, that is, fibers, particles, and background. So, the region-based detector and the segmentation network are fine-tuned accordingly. Due to the use of integration of transfer learning, we use a two-step training procedure. In the first step, we train only the head layers of the model and keep all parameters fixed for other layers. The model is trained for 30 epochs with the learning rate of 0.001 in this setting. In the second step, we train the end-to-end network for another 30 epochs with the learning rate of 0.0001. The model is trained on a 3.6 GHz Intel(R) Core (TM) i7-7700 CPU, 16GB RAM, and a single NVIDIA GTX 1080 Ti Graphics Processing Unit (GPU). We use the mini-batch of two images per GPU and each image has 100 sampled RoIs. It took 6 h and 40 min to finish the entire training for the simulated SEM images dataset. The model is trained to jointly minimize the regression and classification loss function for both in RPN and RBD network. For segmentation network, a per-pixel sigmoid function is used to define the mask loss based on the average of the binary cross-entropy. The results of the loss functions are shown in Figure 8. At the end of the 60-epoch long training, we achieve 0.0133 and 0.1114 for class loss and boundary box regression loss, respectively, for RPN. For the region-based detector, the class loss and boundary box regression loss are 0.0589 and 0.0663, respectively. A segmentation loss of 0.1445 is achieved for filler segmentation.
Result of the loss function (a) classification and box regression loss for RPN and (b) classification and box regression loss for region-based detector and mask loss for segmentation network.

Results and discussion
The performance of the proposed method is evaluated based on three quantitative evaluation criteria: (1) segmentation analysis, (2) morphology analysis of segmented fillers, and (3) application to real SEM images. The segmentation performance is discussed in the subsection “Segmentation analysis”. In Subsection “Morphology analysis”, we discuss about the extraction of filler morphology. Later, we show the segmentation result for real SEM images in the subsection “Application to real SEM images”.
Segmentation analysis
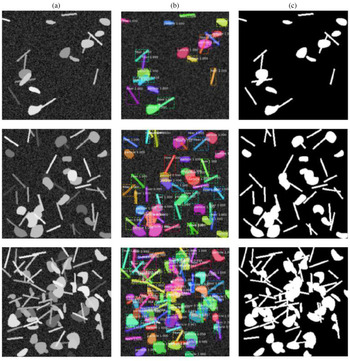
The trained model is tested with the three different sets of SEM dataset as mentioned in the section “Experimental design and training”. The model is trained using the dataset where each image contains 50 fillers (fibers and particles). One should remember that a good trained model should be capable of detecting fillers from a wide range of variation. Real SEM images of composite product may vary significantly in terms of filler-matrix mixing ratio, overlapping, low contrast imaging, obscure fillers with respect to the background, etc. Considering this fact, we infuse these variations into the test dataset for robustness testing. Some representative detection results are shown in Figure 9.
Detection and segmentation of fibers and particles; column (a) simulated SEM images; column (b) detection, classification, and segmentation results; column (c) ground truth of corresponding SEM images in column (a).

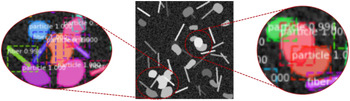
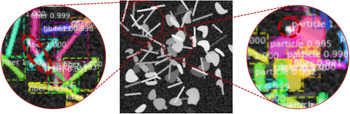
The first row shows the result for a 20-fillers case. The second and third row demonstrate the result for the 50 and 100-filler cases, respectively. Clearly, the filler detection system can accurately detect and segment the fillers from the images, especially for the 20 and 50-filler cases. Notice that, in Figure 10, the fibers and particles are well segmented even though they are overlapped with each other. However, some misdetection and segmentation error are observed for the 100-filler case, as demonstrated in Figure 11. This type of error is not unusual when the number of filler-matrix mixing ratio is high and they severely overlap with each other. Although some misdetection and segmentation error are observed, the filler detection system can still classify most fibers and particles with a very high accuracy. From Figures 9–11, we can see that the detection system can place tight bounding box around each of the fillers along with its classification probability. Obviously, each of the bounding box achieves a very high accuracy (approximately 99% in most of the cases) in classifying the fillers.
Example of filler detection and segmentation for overlapped particles and fibers.

Example of some misdetection and segmentation error.

To evaluate and benchmark the method, two performance metrics were used: mean average precision (mAP) and the miss detection rate (MDR). The mAP is calculated using the intersection over union (IoU) ranges from 0.5 to 0.95 with the step size of 0.05. The IoU metric is used to determine whether a bounding box prediction is to be considered correct. To be consider a correct detection, the area of overlap a o between the predicted bounding box B p and ground truth bounding box B gt must exceed 0.5 according to the formula:
 $$a_{\rm o} = \displaystyle{{{\rm area}( B_{\rm p}\cap B_{{\rm gt}}) } \over {{\rm area}( B_{\rm p}\cup B_{{\rm gt}}) }},$$
where  $B_{\rm p}\cap B_{\rm gt}$ denotes the intersection of the predicted and ground truth bounding boxes and
 $B_{\rm p}\cup B_{{\rm gt}}$ denotes their union. The average precision is reported both for the bounding box prediction (mAP bbox) and segmentation mask prediction (mAP mask) for all of the three test cases (testset-I, testset-II, and testset-II).
MDR is the percentage of fillers that were missed to identify and segment in SEM images. We compute the number of miss-detected fillers for each of the images from three test cases and averaged to calculate the MDR. The MDR is determined based on the miss-detection rate over 50 images. The performance metrics are reported in Table 2.
Performance metrics of filler detection system

The performance of the filler detection system is quantitatively compared with other methods based on the segmentation and MDR metrics. One particular issue is that the available literature provides a thorough investigation of segmentation result for medical images. Recently, deep learning has gained popularity for investigating images from industrial applications. However, most of the available literature used the NDT images, especially X-ray images of casting product. In literature, there is a very limited use of composite manufacturing SEM images in the research domain mentioned in this paper. To make the comparison consistent, we only compare our result with other researchers who used SEM and X-ray images as shown in Table 3.
Comparison of performance of fillers detection and segmentation

a The MDR is averaged for the low and high degree of overlapped (separated by /) cases from the references.
b The highest mAP bbox reported from the references.
c The highest mAP mask reported from the references.
From the comparison table, it is clear that the proposed filler detection system shows a promising performance with respect to the three metrices mentioned above. While the gradient-based HT method has the highest performance for MDR, this method was only designed for fibers, whereas in this paper we used both for fibers and fillers with intensive overlapping phenomena. In terms of average precision, our method performs better than Faster R-CNN, but slightly inferior to that of Ferguson et al. (Reference Ferguson, Ronay, Lee and Law2018). It is worth mentioning that the application domain of Ferguson et al. is different from ours. In this paper, we mainly deal with the overlapping phenomena, while GDXray dataset is related to the casting defects with very limited overlapping issues. The filler detection system proposed in this paper shows almost the same performance when the degree of overlapping is low.
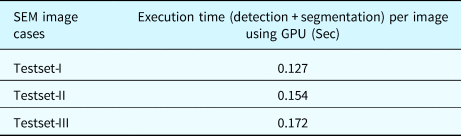
The average computational cost of the detection system is shown in Table 4 for each of three datasets. The execution time includes detection, classification, and segmentation of fibers and particles using GPU. It is observed that the execution time increases with the increase of filler number. For example, the test image with 20 fillers takes 0.127 s, whereas the image with 100 fillers takes 0.172 s on an average.
The averaged execution time per image

Morphology analysis
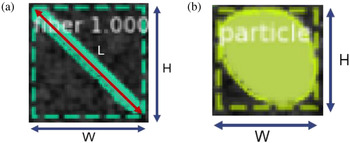
Extraction of filler morphology refers to the accurate determination of filler size, orientation, and spatial distribution. Once the fillers are classified and segmented, we can easily extract the filler morphology for the test cases. The test images consist of two types of fillers – fibers and particles. Therefore, we extract the morphology for both of the fillers separately based on the detected bounding box. Notice that, while segmenting the fillers, the algorithm also generates a tight bounding box around each of the fillers as shown in Figure 12.
Filler segmentation with bounding box (a) fiber and (b) particle.

For composite manufacturing, the size and orientation distribution are two importation determinants for quality control (Cirino et al., Reference Cirino, Friedrich and Pipes1988; Doshi and Charrier, Reference Doshi and Charrier1989; Yu et al., Reference Yu, Brisson and Ait-Kadi1994). According to Figure 12a, we can determine the fiber length (L) and orientation (θ) using Eqs (7) and (8), respectively.
 $$L_{ij} = \sqrt {W_j^2 + H_j^2 } , \quad i = 1, \;2, \;\ldots n\;{\rm and}\; j = 1, \;2, \; \ldots m,$$
 $$\theta _{ij} = \tan ^{{-}1}\left({\displaystyle{{H_j} \over {W_j}}} \right), \quad i = 1, \;2, \; \ldots n\; {\rm and}\; j = 1, \;2, \; \ldots m,$$
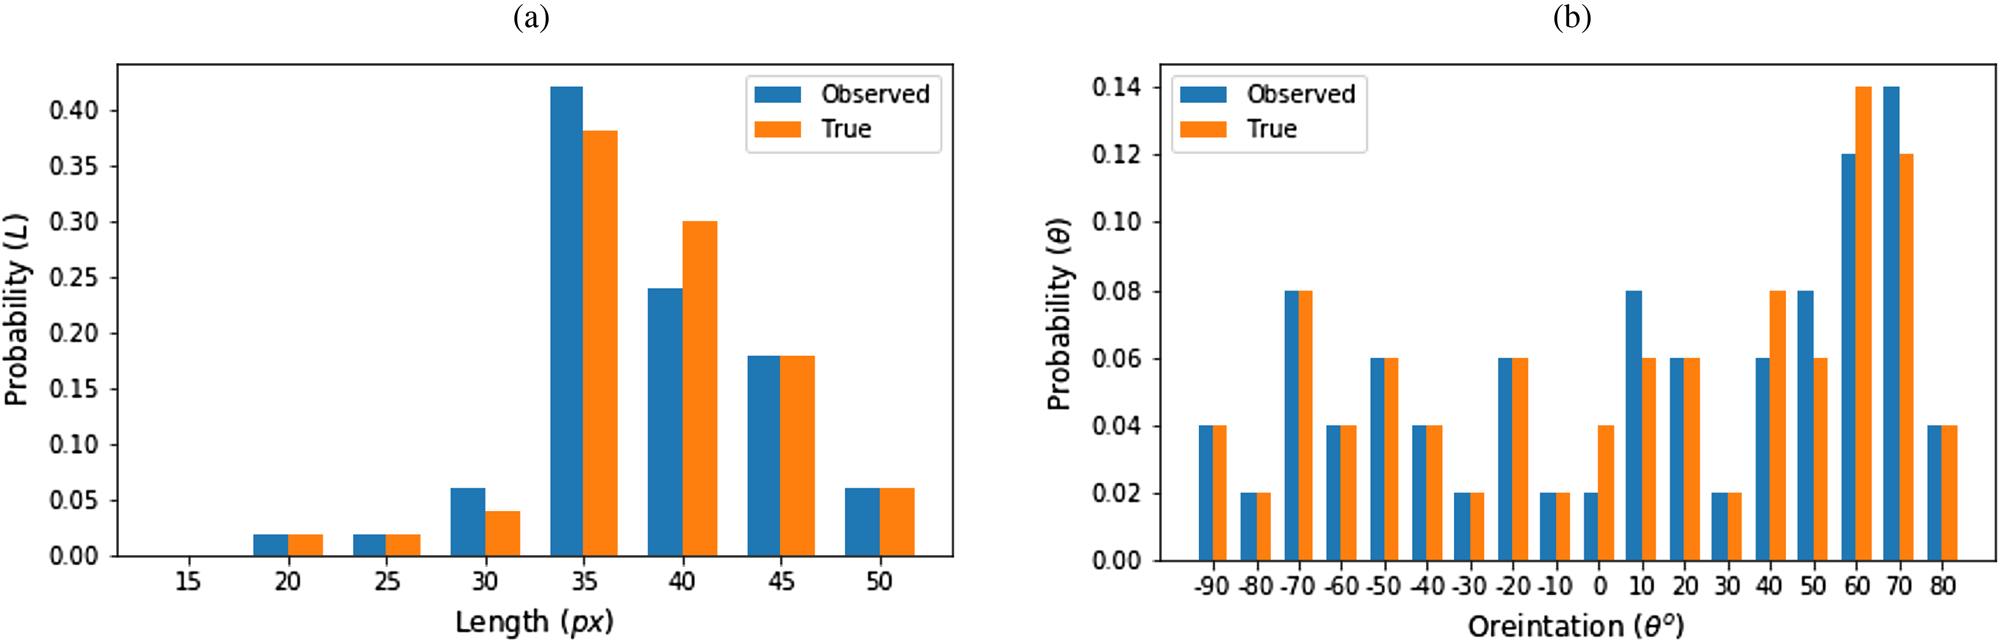
where n is the number of SEM images and m is the number of fibers in any particular image. To determine the length and orientation distribution, we used 50 (n) images for each of the test cases (m = 20, 70, and 100 fillers). We determined the length and orientation for each of the segmented fibers in each of the 50 images. Later, their distribution is observed in comparison to the actual distribution. The distribution is shown in Figure 13.
Fiber morphology (a) length distribution and (b) orientation distribution.

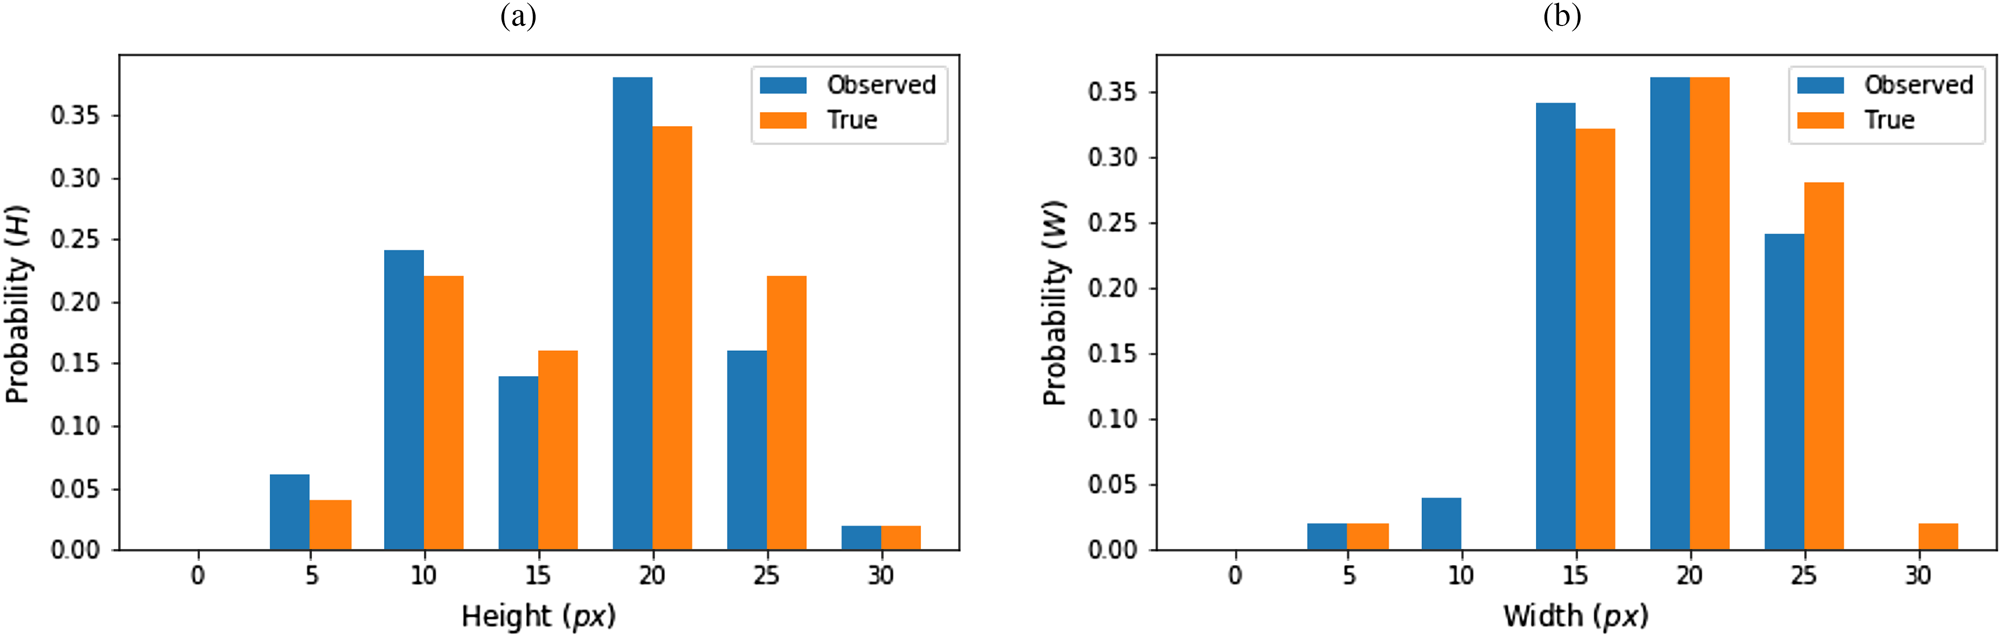
Though length and orientation distribution are the two critical factors for fibers, but for particles it is different. For amorphous or circular particles, the concept of orientation is meaningless. Hence, we only determined the length and width distribution for fibers. The length and width are derived directly from the length and width of the bounding box around the particles (Fig. 12b). The actual and observed size distribution is shown in Figure 14.
Particle morphology (a) height distribution and (b) width distribution.

Spatial homogeneity is another quality determinant for composite manufacturing. Ideally, the fillers should be distributed uniformly in the base materials. Intensive agglomeration of fillers deteriorates the characteristics of composites (Huang et al., Reference Huang, Geng and Peng2015). The spatial homogeneity can be qualitatively analyzed by plotting and observing the position of fillers from a selected reference point. Here, we used the top left corner of SEM image as the reference. We characterize the agglomeration by determining the barycenter of the fillers c = {x c, y c}, where
 $$x_c = \displaystyle{1 \over N}\sum\limits_{i = 1}^N {x_i} , \;\;y_c = \displaystyle{1 \over N}\sum\limits_{i = 1}^N {y_i}, $$
where x i, y i are the coordinates of N pixels making up the fibers or particles. Figure 15 shows the spatial distribution of centroids alongside corresponding image. Looking into this distribution provides the qualitative evaluation on the agglomeration. A large number of centroids positioned in the close proximity refers to the agglomeration of fillers.
Demonstration of spatial homogeneity.

Application to real SEM images
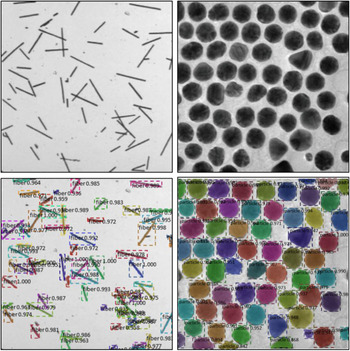
The proposed filler detection system is also applied to real SEM images. Here, we use two real SEM images: one includes examples of short fibers and another one shows particle instances. The images are shown in Figure 16 (first row) and the corresponding detection results are shown in Figure 16 (second row). As the ground truth of the real SEM images are not available, we did not evaluate the detection result quantitatively. However, from the detection result, it is obvious that, the proposed method can classify, detect, and segment the fibers and fillers in real SEM images with superior accuracy. Note that the system can perform its intended tasks for fibers and particles separately, even though we trained the network for both fibers and particles combined. The detection results clearly demonstrate the applicability of the proposed filler detection system for the real-world examples.
Detection and segmentation of fibers and particles. The first row: real SEM images; the second row: detection, classification, and segmentation results of corresponding image in the first row.

Conclusion and discussion
In this paper, we proposed a filler detection system to simultaneously detect, classify, and segment the fibers and particles from SEM images. The Mask R-CNN is used as the backbone of this filler detection architecture. To serve our purpose, the architecture is modified or customized. Through the training, we were able to minimize the classification, detection, and segmentation loss down to 0.0589, 0.0663, and 0.1445, respectively. It is also observed that the model can predict the fillers’ class with approximately 99% accuracy in most of the cases. The potential of this model is very promising in the field of automated visual inspection applications. This promising result has been obtained by leveraging a number of powerful techniques in machine learning, including transfer learning, dataset augmentation, and multi-task learning.
The outcome of this research has threefold benefits. First, this paper shows a procedure to generate artificial SEM images. This provides a way of generating sufficient SEM images for deep learning model training. Second, the output of this model provides good visualization of fiber and particles detection and segmentation results. The outcome of this research provides a way to better understanding of filler morphology in the base material during the post-manufacturing analysis to characterize the composite quality. Finally, this method can be used in many other application domains like defect detection from nondestructive testing, surface defect detection, or fault detection in additive manufacturing applications. The proposed detection system is accurate and fast enough to be applied in real-time manufacturing settings. However, we leave some open issues for future investigation. First of all, future investigations will include testing the model in an industrial scenario and applications in other domains with more advanced CNN architectures to further boost the performance. Second, this paper only focuses on size, orientation, and spatial distribution for morphology analysis using 2D SEM images. In future, this work can be extended for 3D morphology analysis by incorporating “depth” using 3D imaging techniques.
Authors contribution
Md. Fashiar Rahman is the first author of this paper. He worked with all the technical details and wrote the Python code to implement the research idea and algorithm. Mr. Rahman also wrote the manuscript. Dr. Bill Tseng is the primary supervisor of this research. He verified the final result of this research and was the in-charge of the overall direction and planning. Dr. Jianguo Wu is the corresponding author of this paper and co-supervisor of this research. He devised conceptual ideas and helped in evaluating the research outcome. He also helped in reviewing the manuscript. Yuxin Wen worked closely with Mr. Rahman to prepare the manuscript. She also helped in reviewing and proofreading the manuscript. Dr. Yirong Lin is an expert on smart material and manufacturing. He justified the use concept of the morphological application using SEM images in composite manufacturing and helped with other technical support.
Funding
This work was partially supported by the National Science Foundation (ECR-PEER-1935454 and ERC-ASPIRE-1941524). Dr. Tzu-Liang (Bill) Tseng is the recipient of this grant. This research was supported by the National Natural Science Foundation of China under Grant 51875003 and Grant 71932006. Dr. Jianguo Wu is the recipient of this grant.
Conflict of interest
The authors declare that they have no known competing financial interest or personal relationships that could have appeared to influence the work reported in this paper.
Availability of data and material
The authors used their own simulated dataset. The code to generate the dataset is available at the author's GitHub accounts (https://github.com/Fashiar/Image_synthesis_with_annotation).
Code availability
Source code are available upon request.
Ethics approval
Not applicable.
Consent to participate
Not applicable.
Consent for publications
The Author guarantees that the Contribution to the work has not been previously published elsewhere. The authors provide their consent to the publishers to publish/use this manuscript according to their own terms and conditions.
Md Fashiar Rahman is a Research Assistant Professor with the Industrial, Manufacturing and Systems Engineering (IMSE) Department at The University of Texas at El Paso. He received his Ph.D., and M.S. degrees in Computational Science in 2021 and 2018, respectively. He has worked on several projects in the field of image data mining, machine learning, and deep learning for industrial and healthcare applications. His research area covers advanced quality technology, AI application in health care, smart manufacturing, and computational intelligence/data analytics.
Tzu-Liang (Bill) Tseng is the Chair and Professor of the Industrial, Manufacturing and Systems Engineering Department at UTEP. He received his M.S. degree in Industrial Engineering (concentration on manufacturing systems and operation research/decision sciences) from the University of Wisconsin at Madison in 1993 and 1995 respectively and Ph.D. in Industrial Engineering from the University of Iowa in 1999. Dr. Tseng is also a Certified Manufacturing Engineer from the Society of Manufacturing Engineers since 2002. Dr. Tseng is specialized in remote collaborative product design,manufacturing process, data mining, knowledge management, specifically in the area of Internet-Based Decision Support System (IBDSS).
Jianguo Wu received the B.S. degree in Mechanical Engineering from Tsinghua University, Beijing, China in 2009, the M.S. degree in Mechanical Engineering from Purdue University in 2011, and M.S.degree in Statistics in 2014 and Ph.D. degree in Industrial and Systems Engineering in 2015, both from University of Wisconsin-Madison. Currently, he is an Assistant Professor in the Dept. of Industrial Engineering and Management at Peking University, Beijing, China. He was an Assistant Professor at the Dept. of IMSE at UTEP, TX, USA from 2015 to 2017. His research interests are focused on data-driven modeling, monitoring and analysis of advanced manufacturing processes and complex systems for quality control and reliability improvement. He is a recipient of the STARS Award from the University of Texas Systems, and Outstanding Young Scholar Award from China. He is a member of IEEE, INFORMS, IISE, and SME.
Yuxin Wen received a BS degree in medical informatics and engineering from Sichuan University, Chengdu, China, in 2011, an MS degree in biomedical engineering from Zhejiang University, Hangzhou, China, in 2014, and a Ph.D. degree in electrical and computer engineering from the University of Texas at El Paso (UTEP), El Paso, TX, USA, in 2020. She is currently an assistant professor in the Dale E. and Sarah Ann Fowler School of Engineering at Chapman University, Orange, CA, USA. Her research interests are focused on statistical modeling, prognostics, and reliability analysis.
Yirong Lin is currently a Professor in Department of Mechanical Engineering of The University of Texas at El Paso. Dr.Lin's research interests fall in design, fabrication, and characterization of advanced multifunctional material systems for embedded pressure sensing (Department of Energy), structural health monitoring (Department of Energy),wireless temperature sensing (Department of Energy vibration and energy harvesting and storage. His research encompasses micromechanics modeling, materials synthesis, structural characterization and device evaluation. Materials systems including metamateirals, piezoelectric, pyroelectric, graphene, nanocomposites, and carbon fiber composites are currently being investigated.