

When we hear both the words “religion” and “politics” together in the context of Western democracies, we often spontaneously think about the US context rather than the Canadian one. Much research has been done on the many roles religion plays in US politics (Adkins et al., Reference Adkins, Layman, Campbell and Green2013; Beard et al., Reference Beard, Ekelund, Ford, Gaskins and Tollison2013; Layman, Reference Layman2001; Putnam and Campbell, Reference Putnam and Campbell2010; Raymond, Reference Raymond2011; Smidt et al., Reference Smidt, Dulk, Froehle, Penning, Monsma and Koopman2010), from religious groups forming lobbying associations and supporting specific candidates and parties to candidates themselves mobilizing religion as a principal or auxiliary tool in their speeches and campaigns. Whether Americans are aware of it or not, religious belonging, beliefs, and practice also strongly influence their political activities, especially their voting behaviour (Brooks and Manza, Reference Brooks and Manza2004; Layman, Reference Layman2001; Smidt et al., Reference Smidt, Dulk, Froehle, Penning, Monsma and Koopman2010). In Canada, research has shown that religion also plays a significant role in politics, especially in individual vote choice, but surprisingly few studies have been done on the topic considering the importance of the effect. Some pioneering work in the 1950s, 1960s, 1970s and 1980s showed that religious affiliation, most notably the divide between Catholics and Protestants, was among the strongest demographic effects in predicting an average individual's party choice in Canadian federal elections (Anderson, Reference Anderson1966; Irvine, Reference Irvine1974; Irvine and Gold, Reference Irvine and Gold1980; Johnston, Reference Johnston1985; Lijphart, Reference Lijphart1979; Meisel, Reference Meisel1956). Yet even then there was a perception by most in the political field that, in the words of Irvine, the religious effect was a “houseguest who has overstayed his welcome” (Reference Irvine1974: 560). In other words, the effect was seen as a vestige of the past that was bound to disappear due to processes of secularization in advanced democracies, including in Canada. It therefore received relatively little attention.
This being said, some studies since the 1980s have continued to map the effect of religion, especially of denominational belonging, on citizens’ voting behaviour, and show that it is still very present in the Canadian context (Bélanger and Eagles, Reference Bélanger and Eagles2006; Blais, Reference Blais2005; Guth and Fraser, Reference Guth and Fraser2001; Johnston, Reference Johnston, Kanji, Bilodeau and J2012; Kay and Perrella, Reference Kay, Perrella, Kanji, Bilodeau and Scotto2012; Pammett, Reference Pammett1991). Nevertheless, these studies remain heavily influenced by the works of Irvine and Lijphart, in that they still often focus on Catholic-Protestant differences despite the Canadian religious landscape having changed a great deal since the 1960s. More diversified immigration since then has brought with it more religious pluralism, both Christian and non-Christian, to the country. Although Canada is still characterized by a Christian majority (67% of the total population according to the 2011 NHS), the share of non-Christian groups has grown (reaching 9% in 2011), and changes have also occurred among Christians themselves. Levels of regular church practice for example have declined drastically since the 1960s, especially among Catholics and mainline Protestants (those belonging to the United, Anglican, Lutheran and Presbyterian Churches).Footnote 1 There has also been an important decline in mainline Protestants’ share of the population, hitting a low of 14 per cent in 2011. In turn, there has been a steady rise in those with no religious affiliation with 24 per cent of adults in 2011 identifying as religious “nones” (up from 4% in 1971 and 13% in 1991).
The federal party landscape has also mutated since the 1960s, some of these changes directly or indirectly sharing ties with religion. Most notably, this period saw the birth of the Reform party of Canada, with Western Evangelicals forming an important part of this party's electoral base. This Western Evangelical influence continued with Reform's transformation into the Canadian Alliance and then with its merger with the Progressive Conservatives to form the current Conservative Party of Canada (Hutchinson, Reference Hutchinson2009; Malloy, Reference Malloy2011; McDonald, Reference McDonald2011). The Bloc Québécois also appeared on the federal scene in Quebec in the early 1990s, a party which attracts a disproportionately high amount of support from religious “nones” in the province (Johnston, Reference Johnston, Kanji, Bilodeau and J2012; Laniel, Reference Laniel2010).
So what are the implications of all these changes for the religious vote in Canada? How has the effect of religion on voting behaviour evolved since the 1960s? Some observers point to the divide in the religious landscape and in individual social behaviour being now much less between Protestants and Catholics and much more between those who are religious in general and those who are not (Martin, Reference Martin2005; Putnam and Campbell, Reference Putnam and Campbell2010; Roy, Reference Roy2008; Wilkins-Laflamme, Reference Wilkins-Laflamme2014, Reference Wilkins-Laflammeforthcoming). Is this also the case for voting behaviour in Canadian federal elections? Using data from the Canadian Election Studies spanning federal elections from 1965 to 2011, this paper sheds light on these questions by analyzing the shifting strength of the religion effect and its different components on voting behaviour in the country. Specifically, we seek to determine to what extent Catholic-Protestant differences have declined in voting behaviour over the period at study, and the differences between those who are religious and those who are not have sharpened.
Theory
Religious affiliation and vote choice
What researchers often refer to as the religious vote in Canada is in fact comprised of two main aspects. The first is the association between an individual's religious affiliation and which political party she or he votes for in elections. A number of studies in the 1950s, 1960s, 1970s and 1980s showed an important divide in voting behaviour in Canada between Catholics and Protestants (Anderson, Reference Anderson1966; Irvine, Reference Irvine1974; Irvine and Gold, Reference Irvine and Gold1980; Johnston, Reference Johnston1985; Lijphart, Reference Lijphart1979; Meisel, Reference Meisel1956). Most notably, Catholics across the country were much more likely to vote Liberal. In fact, Lijphart (Reference Lijphart1979) indicated that religious affiliation was the strongest demographic predictor for individual voting behaviour, having a greater effect than linguistic group or social class. More recent research shows that this religious affiliation effect persisted into the early 2000s, with Catholics still more likely to vote Liberal, Protestants more likely to vote for either the Progressive Conservatives or the Canadian Alliance and the religiously unaffiliated more likely to vote NDP (Bélanger and Eagles, Reference Bélanger and Eagles2006; Blais, Reference Blais2005; Guth and Fraser, Reference Guth and Fraser2001; Johnston, Reference Johnston, Kanji, Bilodeau and J2012; Kay and Perrella, Reference Kay, Perrella, Kanji, Bilodeau and Scotto2012; Pammett, Reference Pammett1991).
The link between religious belonging and vote choice is often understood as a group identity effect. Historical and geographical ties between specific religious groups and specific political parties are passed on across generations by means of both family political socialization (Irvine, Reference Irvine1974; Irvine and Gold, Reference Irvine and Gold1980) and community reinforcement (Johnston, Reference Johnston1985).Footnote 2 In other words, children are raised in specific religious and political contexts, both in the home and in their surrounding social environment. These identity ties often then persist into adulthood, so that individuals of certain religious groups continue to be more likely to support certain parties which were prominent during their social and political upbringing. If parties and candidates recognize this loyalty, they can in turn play to it and attempt to reinforce their support among these electoral bases. Blais (Reference Blais2005) shows the continued importance of this group identification effect when it comes to religious affiliation, over that of shared policy concerns for example. Bélanger and Eagles (Reference Bélanger and Eagles2006) as well as Pammett (Reference Pammett1991) point not only to the importance of the social environment in which an individual was raised, but also to the context in which individuals find themselves as adults. They found that Catholics continued to be more likely to vote Liberal in the 1980s, 1990s and early 2000s, especially in areas where there are more Catholics, contexts in which their Liberal support is reinforced by others in their surrounding networks.
It is worth mentioning, however, that this association between religious affiliation and vote choice is influential, not deterministic. The propensity for Catholics to vote Liberal, Protestants to vote for more conservative parties and religious “nones” to vote NDP are general trends, not universal rules. Other research has shown that there are potential mitigating factors that can reduce the importance of the effect of religious affiliation on vote choice, including greater media exposure (Mendelsohn and Nadeau, Reference Mendelsohn and Nadeau1997) and voter information (Bittner, Reference Bittner2007).
Level of religiosity and vote choice
A second dimension of the religious vote, not excluding the first, is the effect of level of religiosity on vote choice. Regardless of which specific religion they belong to, citizens who attend religious services more regularly, who pray frequently and who generally assign a greater importance to religion in their lives tend to vote more for right-wing parties in most Western democracies. Conversely, those individuals more removed from religion and religiosity are more likely to support left-wing political parties and candidates (Beard et al., Reference Beard, Ekelund, Ford, Gaskins and Tollison2013; Bruce, Reference Bruce2003; Evans and de Graaf, Reference Evans and de Graaf2013; Layman, Reference Layman2001; Nicolet and Tresch, Reference Nicolet and Tresch2009; O'Neill, Reference O'Neill2001; Raymond, Reference Raymond2011; Van der Brug et al., Reference Van der Brug, Hobolt and de Vreese2009). In Canada for example, religious “nones” are more likely to support the NDP and religiously active Protestants are even more likely to support conservative parties than their non-active counterparts (Guth and Fraser, Reference Guth and Fraser2001).
This association between level of religiosity and vote choice is understood by many researchers as an issue voting effect (Raymond, Reference Raymond2011; Smidt et al., Reference Smidt, Dulk, Froehle, Penning, Monsma and Koopman2010; Van der Brug et al., Reference Van der Brug, Hobolt and de Vreese2009). Individuals who are religious, especially those who practise their religiosity and spirituality within religious groups (Nicolet and Tresch, Reference Nicolet and Tresch2009), often hold more traditional values on issues such as pre-marital sex, homosexuality, abortion, family life and gender roles (Ang and Petrocik, Reference Ang and Petrocik2012; O'Neill, Reference O'Neill2001; Putnam and Campbell, Reference Putnam and Campbell2010; Reimer, Reference Reimer2003; Reimer and Wilkinson, Reference Reimer and Wilkinson2015). Either based on their own initiative, encouragement from their religious group or influence from their peers, these individuals are then more likely to support candidates and parties who are perceived to share their values on these topics.
A growing cleavage between the religious and the secular
These two main dimensions of the religious vote, the effects of religious affiliation and level of religiosity, appear to currently coexist in most Western democracies. Yet how has the dynamic between the two evolved in Canada since the 1960s? The religious landscape in the country has certainly changed over the course of the last five decades. More diversified immigration has brought with it more religious pluralism. Whereas non-Christian groups (Muslims, Buddhists, Jews, Hindus, Sikhs, and so forth) only comprised an estimated 2 per cent of the population in 1961 (Bibby, Reference Bibby2011), in 2011 their share of the overall population had risen to 9 per cent (Statistics Canada, NHS, 2011), being heavily concentrated in urban areas along with non-Western immigration in general. Although not as large as it once was, Canada is still characterized by a Christian majority (67% of the total population according to the 2011 NHS), just over half (58%) of which is now Catholic, 40 per cent Protestant and 3 per cent Christian Orthodox. Yet, even among these Christians change has occurred. Levels of regular church practice have declined sharply since the 1960s, especially among Catholics and mainline Protestants (Bibby, Reference Bibby2011; Eagle, Reference Eagle2011; Meunier and Wilkins-Laflamme, Reference Meunier and Wilkins-Laflamme2011). There has also been an important decline in mainline Protestant affiliation, this religious tradition experiencing a great deal of apostasy and not seeing the same demographic gains from immigration or natural renewal as Catholics or Evangelical Protestants (Bibby, Reference Bibby2011). Mainline Protestants accounted for only 14 per cent of the population in 2011 (Statistics Canada NHS, 2011), compared with 37 per cent in 1971 (1971 Census). In turn, there has been a steady rise of religious “nones,” comprising nearly a quarter of the Canadian population in 2011 (Wilkins-Laflamme, Reference Wilkins-Laflamme2015).
A number of observers point to this last trend, the rise in religious “nones” and in individuals removed from religion more generally, as creating a prominent divide between the secular and the religious in current Western societies (Achterberg et al., Reference Achterberg, Houtman, Aupers, de Koster, Mascini and van der Waal2009; Bibby, Reference Bibby2011; Martin, Reference Martin2005; Putnam and Campbell, Reference Putnam and Campbell2010; Roy, Reference Roy2008; Wilkins-Laflamme, Reference Wilkins-Laflamme2014, Reference Wilkins-Laflammeforthcoming). Religion's roles in other social spheres (such as education, health and politics) have been reduced or completely done away with, social norms surrounding religious belonging and practice have weakened, and religious socialization is absent among many members of younger generations. Consequently, many individuals who are not personally religious no longer feel the need to keep even nominal ties to their family's traditional religious group. They often choose to completely remove themselves, or stay removed, from all forms of religion (Bruce, Reference Bruce2011; Hunsberger and Altemeyer, Reference Hunsberger and Altemeyer2006; Merino, Reference Merino2012; Zuckerman, Reference Zuckerman2012).
By contrast, those who are actively religious (who attend religious services regularly, for example) have become a minority in Western societies, but it is a minority that is beginning to be able to reproduce itself demographically at these now lower levels due to lessening rates of apostasy, above average fertility rates and gains from non-Western immigration (Kaufmann, Reference Kaufmann2010; Reimer, Reference Reimer2010; Wilkins-Laflamme, Reference Wilkins-Laflamme2014). In this context, distinctions in attitudes and behaviour that could once be found between religious traditions and denominations appear now to be blurring, and the gap between those who are religious in general and those who are not is becoming more important. Consequently, the processes of secularization that have been underway in Western democracies and the decline of certain forms of individual religious behaviour that have accompanied them may not always imply a lessening of the effect of religiosity as a predictive variable. In fact, with a growing secular segment of the population standing opposite sizeable religious groups, many of whom are known to be politically active (McDonald, Reference McDonald2011; Smidt et al., Reference Smidt, Dulk, Froehle, Penning, Monsma and Koopman2010), the nature of the religious effect on voting may be shifting rather than weakening between two portions of the population who have very different sets of core beliefs and worldviews.
Ang and Petrocik (Reference Ang and Petrocik2012) show for example that, more recently in Canada, level of religiosity has been a better predictor of moral attitudes than religious affiliation. In the US context, Smidt and colleagues (Reference Smidt, Dulk, Froehle, Penning, Monsma and Koopman2010) show the same trend of increasing importance of level of religiosity over the last several decades for Americans’ voting behaviour in presidential elections: the very religious vote increasingly for Republicans, and the not very religious vote increasingly for Democrats.
We also expect to see this increasing importance of the predictive power of level of religiosity over specific religious affiliation for voting behaviour in the Canadian context.
H1:
The effect strength of religious traditions on vote choice will have declined over the period at study;
H2:
The effect strength of perceived importance of religion in life on vote choice will have increased over the period at study.
Methods
In order to test these hypotheses, we use data from the 1965–2011 Canadian Election Studies (CES). These studies have been run for each federal election in Canada since 1965 (although unofficially in 1972). From 1965 to 1984, the survey was administered with in-home interviews just after each election and then from 1988 onwards took a three-wave format: a series of questions asked by means of telephone interviews during the campaign period (CPS), just after the election (PES) and then through a self-completion mail-back questionnaire (MBS) (Fournier et al., Reference Fournier, Cutler, Soroka and Stolle2015). There was no mail-back component in 2006, and the 2011 CES also contains a series of web-administered questions. The cross-sectional samples for each of the CESs range from 1,449 respondents (1979) to 3,609 respondents (1988), for a total of 33,248 cases in the cumulative dataset.Footnote 3 Most of the results in this article stem from the 1965, 1997 and 2011 elections, but material in the online supplementary files covers all the available elections between 1965 and 2011.
Variables
Restricting the sample to those respondents who voted in the federal election in question, the respondent's party choice was designated as the outcome variable in the analysesFootnote 4 : “Which party did you vote for?” (PES). Among our two main predictors, religious affiliation has been included in the CES since its beginnings in 1965. In 2011, it was asked as “Please tell me what is your religion, if you have one?” (CPS). This question format has only changed slightly since 1965, where religious affiliation was asked as “Would you mind telling of what religion you are?”Footnote 5 By contrast, the measurement of level of religiosity in the CES changed more drastically between 1965 and 2011. From 1965 to 1988, frequency of church attendance was included in the survey. This then changed to a three-category importance of religion in life question in 1988, and then to the importance of God in 1993, before reverting to the importance of religion in life, but now with four possible answers, from 1997 onwards: “In your life, would you say religion is very important, somewhat important, not very important, or not important at all?” (2011 CPS version). Consequently, due to comparability concerns the change in effect strength for level of religiosity is analyzed only for the shorter period of 1997 to 2011 in this study. This importance of religion question was also only asked of respondents who declared having a religion, so for the purposes of this study we must make the assumption that those respondents who declare having no religion also consider religion not to be at all important in their lives.Footnote 6
The models in the analyses also include a series of socio-demographic controls, in order to better isolate the effects of religious affiliation and importance of religion on vote choice. These controls are those that can be found in each wave of the CES since 1965: age, gender, marital status, level of education, employment status, country of birth, household language or mother tongue, province of residence and, for some of the models, rural residence.Footnote 7 Ethnic origin was not included as a control in the models, due to issues of multicollinearity, this variable being too highly correlated with country of birth and language.
Models
Using dichotomous outcome variables in which respondents who voted for each of the major federal parties score a value of 1, a series of binary logit regression models were generated. Single-level regression models were preferred for the analysis, since there were too few election years available to allow for hierarchical models (only 13 to act as group-level cases). Separate models were generated for each major federal party and for each election year, and effect sizes are expressed in marginal effects. Separate models were also generated for Quebec and the rest of Canada (ROC), due to Quebec's distinct political and religious landscapes (Fournier et al., Reference Fournier, Cutler, Soroka, Stolle and Bélanger2013; Gidengil et al., Reference Gidengil, Nevitte, Blais, Everitt and Fournier2012; Johnston, Reference Johnston2015; Meunier and Wilkins-Laflamme, Reference Meunier and Wilkins-Laflamme2011).
Results
Religious affiliation
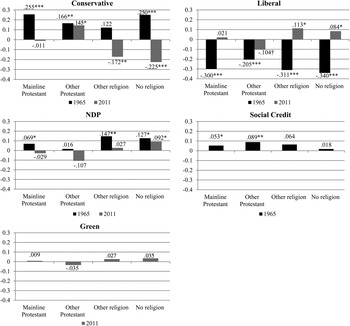
In order to initially grasp exactly how religious affiliation is associated with voting behaviour at the beginning and end of our period at study, a series of logit regression models were generated with a binary outcome variable for voting for each of the major federal parties in both 1965 and 2011. Figures 1 and 2 contain the marginal effects (change in probabilities) of each religious tradition on vote choice for the ROC, controlling for other socio-demographic characteristics. What we can see first of all in Figure 1 is that, in 1965, average respondents of all other religious traditions were significantly less likely than Catholics to vote Liberal: mainline Protestants by an estimated 30 per cent, other Protestants by an estimated 21 per cent, other religions by an estimated 31 per cent and the religious “nones” by an estimated 34 per cent. These significant differences remain even once frequency of church attendance is controlled for (results not shown here).Footnote 8 As mentioned in the theory sections, this is in line with existing research (Anderson, Reference Anderson1966; Bélanger and Eagles, Reference Bélanger and Eagles2006; Blais, Reference Blais2005; Guth and Fraser, Reference Guth and Fraser2001; Irvine, Reference Irvine1974; Irvine and Gold, Reference Irvine and Gold1980; Johnston, Reference Johnston1985; Lijphart, Reference Lijphart1979; Pammett, Reference Pammett1991). In tandem with this effect, most non-Catholic respondents were also significantly more likely to vote Conservative, except for those of religions other than Catholicism or Protestantism. Most were also significantly more likely to vote for the NDP than Catholics, with the exception of (other) non-mainline Protestant groups. Both types of Protestants were also slightly more likely to vote for the Social Credit in the ROC, compared with Catholics.
Marginal Effects on Vote Choice as Compared with Catholics, by Political Party, Rest of Canada (ROC), 1965 & 2011

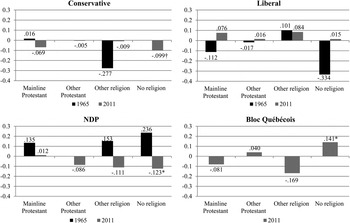
Marginal Effects on Vote Choice as Compared with Catholics, by Political Party, Quebec, 1965 & 2011

However, 46 years later in 2011 this Catholic penchant for the Liberals in the ROC seems to have disappeared. No average member of a specific religious tradition was less likely to vote Liberal than Catholic respondents in a statistically significant way (95% level) in 2011 (see Figure 1).Footnote 9 Figure A.1 in the online supplementary material as well as Johnston (Reference Johnston, Kanji, Bilodeau and J2012) show that the distinct Catholic support for the Liberals in the ROC declined sharply during the 1970s and 1980s, and then dried up entirely by the mid-2000s.
This being said, religious affiliation does still play a role in vote choice in 2011 in the ROC. An indication of its Evangelical electoral base, other Protestants were more likely to vote for the Conservative Party of Canada (by an estimated 15%) than Catholics. By contrast, members of other religions than Catholicism and Protestantism were an estimated 17 per cent less likely to vote Conservative than Catholics and an estimated 11 per cent more likely to vote Liberal. Religious “nones” were an estimated 23 per cent less likely to vote Conservative, and 8 per cent more likely to vote Liberal as well as 9 per cent more likely to vote NDP compared with Catholics.
The story of the effects of religious affiliation on federal vote choice is somewhat different in the majority-Catholic province of Quebec. As the results in Figure 2 show, in 1965 none of the other religious traditions was (statistically) significantly more or less likely to vote for one party over another than Catholics were. More recently in 2011, only religious “nones” were an estimated 12 per cent less likely than Catholics to vote for the NDP in Quebec (opposite to the effect in the ROC), and 14 per cent more likely to vote for the Bloc Québécois. Consequently, it would seem that, once other socio-demographic variables are controlled for, religious tradition does not have the same level of impact in Quebec as it does in the ROC, both in 1965 and in 2011.
Level of religiosity
To summarize so far, it would appear that, although the effects are not the same as those found in 1965, there remained in 2011 a distinctiveness in the religiously unaffiliated vote, the vote of other Protestants as well as the vote of other religions than Catholicism and Protestantism in the ROC, as well as a more recent distinctiveness of the religious “nones” vote choice in Quebec. Yet, are these differences a reflection of the effect of level of religiosity over religious tradition on vote choice? Evangelical Protestants are known for their high levels of religious involvement both on a personal level and within their respective congregations (Bibby, Reference Bibby2011; Reimer, Reference Reimer2003), whereas religious “nones” are known for their extremely low or non-existent levels of religiosity in Canada (Wilkins-Laflamme, Reference Wilkins-Laflamme2015).
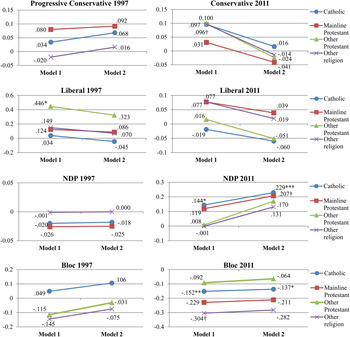
For both 1997 and 2011, Figures 3 to 5 contain the marginal effects of importance assigned to religion in life on vote choice among respondents in the ROC and Quebec who voted in these two federal elections. Models 1 in Figures 4 and 5 were run only with religious tradition (this time with religious non-affiliation as the reference category) and socio-demographic controls. Level of religiosity was then added to models 2 in order to observe its marginal impact on vote choice, as well as the change in marginal impact of religious traditions on vote choice once level of religiosity is controlled for.
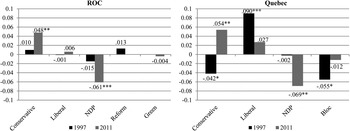
Marginal Effects of a One-Unit Increase in Level of Religiosity on Vote Choice (Models 2), ROC & Quebec, 1997 & 2011

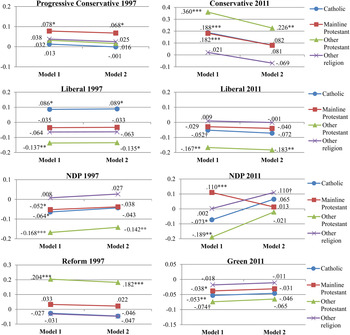
Marginal Effects of Religious Tradition (as Compared with No Religion) on Vote Choice, for Models without Level of Religiosity (Models 1) and with Level of Religiosity (Models 2), by Political Party, ROC, 1997 & 2011

Marginal Effects of Religious Tradition (as Compared with No Religion) on Vote Choice, for Models without Level of Religiosity (Models 1) and with Level of Religiosity (Models 2), by Political Party, Quebec, 1997 & 2011

In the 1997 federal election, there is no statistically significant marginal effect of level of religiosity on voting for any of the major federal parties in the ROC (Figure 3). When this variable is added to models 2, there is not a lot of change either in the existing significant marginal effects of religious traditions on vote choice (Figure 4): for example, other Protestants go from being an estimated 17 per cent less likely to vote NDP than religious “nones” to 14 per cent less likely, and from 20 per cent to 18 per cent more likely to vote for the Reform party. Catholics in turn remain at being an estimated 9 per cent more likely to vote Liberal than religious “nones,” even once level of religiosity is controlled for.
By contrast in 2011 in the ROC, those who thought that religion was very important in their lives were an estimated 14 per cent more likely to vote Conservative and 18 per cent less likely to vote NDP than those who thought that it was not at all important (Figure 3).Footnote 10 According to the results in Figure A.2 in the online supplementary material, these effects of level of religiosity on the Conservative and NDP vote became apparent in the early 2000s in the ROC. When level of religiosity is added to models 2 in 2011, initial marginal effects of Catholics and Protestants being more likely to vote Conservative and less likely to vote NDP than religious “nones” are drastically reduced in size (Figure 4). In most cases, these effects even lose their statistical significance, with the exception of other Protestants who still remain 23 per cent more likely to vote Conservative and 18 per cent less likely to vote Liberal than religious “nones” even once level of religiosity is controlled for.
In contrast to the ROC, in Quebec in 1997 the marginal effect of level of religiosity on vote choice is statistically significant in many cases (Figure 3): respondents who say that religion is very important in their lives were an estimated 13 per cent less likely to vote Progressive Conservative, 27 per cent more likely to vote Liberal and 17 per cent less likely to vote Bloc than those who think it is not at all important. The only significant marginal effect of a religious tradition on vote choice in Quebec in 1997— other Protestants being more likely to vote Liberal than religious “nones”— is found to be spurious once level of religiosity is added in models 2 (Figure 5). By contrast, in 2011 the level of religiosity effect is still significant, but more recently respondents who say that religion is very important in their lives were an estimated 16 per cent more likely to vote Conservative and 21 per cent less likely to vote NDP than those who think it is not at all important (Figure 3). The marginal effects of Catholics being more likely to vote NDP and less likely to vote Bloc than religious “nones” in 2011, shown initially in the previous section of results, remain significant even once level of religiosity is controlled for in models 2 of Figure 5.
Discussion
To summarize, differences in vote choice associated with an individual's specific religion do seem to have diminished between 1965 and 2011. This is especially the case for the classic divide between Liberal support from Catholics and Conservative support from mainline Protestants, providing evidence for our first hypothesis (H1) with regards to these two religious traditions in provinces other than Quebec. It does not imply, however, that the religious vote has disappeared from the Canadian political landscape. Some distinct voting patterns remained in 2011 with regard to an individual's religious group identity. Protestants from groups other than the four mainline denominations show on average greater support for the Conservative Party of Canada outside of Quebec, an effect that is missed when grouping all Protestants into one general category as previous studies have often done (Bélanger and Eagles, Reference Bélanger and Eagles2006; Blais, Reference Blais2005; Johnston, Reference Johnston, Kanji, Bilodeau and J2012; Kay and Perrella, Reference Kay, Perrella, Kanji, Bilodeau and Scotto2012). Additionally, individuals from other religions, usually non-Christian, show on average greater support for the Liberals and weaker support for the Conservatives than Catholics in recent elections. Finally, religious “nones” as a group are still more likely to vote Bloc in Quebec.
Yet, most striking of all are the growing differences in vote choice between those who think religion is very important in their lives (who tend to vote more Conservative), and those who do not (often voting more for the NDP). This more recent and more prominent right-left split according to level of religiosity can be found in both the ROC and Quebec, and in turn supports H2. It is also a characteristic that brings the Canadian political context closer to those of other Western democracies, including the US, where this religiosity cleavage has also been found to be important in recent years (Beard et al., Reference Beard, Ekelund, Ford, Gaskins and Tollison2013; Bruce, Reference Bruce2003; Hunter, Reference Hunter1991; Layman, Reference Layman2001; O'Neill, Reference O'Neill2001; Raymond, Reference Raymond2011; Van der Brug et al., Reference Van der Brug, Hobolt and de Vreese2009).
Existing literature argues that these growing differences in vote choice between the very religious and the not so religious are due especially to a growing importance of issue voting and a concomitant decline of old group-party loyalties in many Western democracies (Layman, Reference Layman2001; Raymond, Reference Raymond2011). The religious often hold more traditional values and specific worldviews (Ang and Petrocik, Reference Ang and Petrocik2012; O'Neill, Reference O'Neill2001; Putnam and Campbell, Reference Putnam and Campbell2010; Reimer, Reference Reimer2003) that they would perceive the Conservatives as also sharing in Canada, and thus vote accordingly despite potential past family and community loyalties to other parties. The same process would also be at play in more secular individuals’ greater support for the NDP or other socially left-leaning parties.
Measuring the importance of the issue-voting effect as compared with the group identity effect in the religious vote goes beyond the scope of the present study, but future research could use path analysis and structural equation models, such as was done by Raymond (Reference Raymond2011) for the US, Germany and Great Britain, to tease out these influences in the Canadian context. There are also other limitations to the present study and consequently other avenues open for future research. Due to sample sizes and variable restrictions, the analysis in this article used broad religious traditions in order to measure their association with voting behaviour. With more detailed data and larger samples, future studies could break down these broader categories to analyze each group's specific association with vote choice, both for non-Christian religions and for different types of religious “nones” (atheists, agnostics, the spiritual but not religious, and so forth).
In this study, we touched on differences in the measured associations found in Quebec as compared with the rest of Canada. Most notably, we found that in 2011 being religiously unaffiliated in Quebec was more strongly associated with voting Bloc, rather than voting NDP as was the case in the ROC. The NDP's success in Quebec in 2011 was instead evident in their support among the large majority of individuals in the province who declare themselves as Catholic but who, for the most part, have very little contact with the Church itself (Meunier and Wilkins-Laflamme, Reference Meunier and Wilkins-Laflamme2011). Future studies could explore this comparison in more detail, and also compare these trends between other provinces and geographic regions in Canada. For example, in Atlantic Canada where rates of Christian affiliations have remained relatively high (Bibby, Reference Bibby2011; Bowen, Reference Bowen2004), differences in vote choice between individuals of these affiliations may also have remained strong. By contrast, in British Columbia where religious “nones” made up nearly half (44%) of the population in 2011 (Statistics Canada NHS. 2011), the split in vote choice between the religious and the secular may be more prominent than elsewhere in the country.
Finally, although this study controlled for a number of socio-demographic effects when measuring the religious vote, including province of residence, it was beyond our present reach to account for riding and candidate characteristics. Future research could determine if the different aspects of the religious vote are amplified or mitigated in specific types of electoral ridings and according to candidate traits and strategies.
Yet despite these limitations, this paper still makes an important contribution to the study of voting behaviour in Canada. We have shown that even with changes in the religious landscape since the 1960s, including some processes of secularization and pluralization, the religious vote has not disappeared. Rather, its dynamics are shifting. The divide is now much more between those right-leaning individuals who have strong ties with religion and those left-leaning individuals who do not. These are two groups which often hold very different values, fundamental beliefs and worldviews, so it comes as no surprise that their members’ political attitudes and behaviour differ to a great extent. Although it may not be as visible in Canada as it is in the USA, assuming that religion no longer plays a role in Canadians’ voting behaviour does little to reflect the realities of the current political landscape. With a growing divide between the religious and the secular being found for voting patterns, this trend may also be present in other political and social behaviour and may be an issue with which political parties in the future decide to play on more openly.
Supplementary materials
To view supplementary material for this article, please visit http://dx.doi.org/10.1017/S0008423916000834.