Increased international capital mobility in the 1960s and 1970s created opportunities to diversify the geographical location of financial activity by separating the location of customers and services to maximise profits and minimise costs. The most dramatic example was the emergence of an offshore market in US dollar deposits and assets in London in the early 1960s that launched a new era of international finance. This example of financial innovation has been widely researched because of its lasting effects on the globalisation of international capital markets (Schenk Reference Schenk1998; Burn Reference Burn2006; Altamura Reference Altamura2017). Less historical attention has been paid to the subsequent rise of a range of offshore financial centres (OFCs) in the 1970s, which sought to attract financial activity from established regulated markets to island locations with relatively little financial infrastructure ex ante. This phenomenon is usually attributed to regulatory competition (lower tax rates, less transparency, weaker supervision, lower capital requirements) that prompted regulatory arbitrage by increasingly mobile international capital (Bryant Reference Bryant1987; Helleiner Reference Helleiner1994; Kapstein Reference Kapstein1994). This interpretation highlights the importance of state versus market incentives in the origination of offshore financial centres.Footnote 1 These centres were often deliberately designed rather than emerging from major trading and investing economies in the way of historic US and European financial centres.
This article addresses the emergence of an offshore market in US dollars in Singapore in the late 1960s. Since the nineteenth century, Singapore had hosted many local and international banks engaged in the commercial trade and finance for Southeast Asia, particularly the rubber and tin trade of the Malaysian peninsula, while also providing financial services for the wider Southeast Asian region. But it had a key rival in Hong Kong, which had a much larger group of banks and associated services linked to the China trade from the nineteenth century. In 1965 Hong Kong hosted 43 foreign banks while Singapore hosted 15. In 1968, Hong Kong deposit banks’ foreign assets ($900m) were more than four times those of Singapore ($200m) (Schenk Reference Schenk2001, pp. 125–30). The key historical question addressed in this article is why the offshore dollar market in Asia emerged first in Singapore and not in Hong Kong, which was the primary regional banking and financial centre at the time. Existing descriptions explain the market as an outcome of Singapore's interventionist and deliberate development planning as opposed to Hong Kong's laissez faire stance. But this characterisation neglects the contested nature of Hong Kong's position and the tensions between the interests of banks and states in the process. We also find new evidence that casts doubt on the premise that the market was originated by the Singapore government rather than by bankers. The regulatory competition between these two centres confirms the important role of state intervention rather than market forces as the market developed, but also that this intervention was uneven and sometimes confused. Finally, this case exposes how these early offshore centres created challenges for supervisors in established financial centres drawing on evidence from the Bank for International Settlements.
The historiography relies heavily on Prime Minister Lee Kuan Yew's recollections in his memoirs that stress the importance of Singapore's developmental state in launching the market. Thus, Bruner (Reference Bruner2016) and Wang (Reference Wang, Hu, Vanhullebusch and Harding2016) emphasise the importance of government advisers based on Lee's account. Wang (Reference Wang, Hu, Vanhullebusch and Harding2016) has noted the important role of the state in the case of Singapore, but offers few details and focuses mainly on creating the IFC as part of development policy. Palan (Reference Palan2010) takes a broader historical view and argues that the foundations in the British Empire and links to the City of London were crucial. He also repeats Jao's (Reference Jao1979) assertion that Hong Kong was the first choice for locating the market but that in a ‘perhaps surprising’ decision they refused to lower their taxes to welcome the funds while Singapore was ‘far more accommodating’, but these contrasting stances are not explained (Palan Reference Palan2010, pp. 171–2). On the role of the governments of the two territories, Woo (Reference Woo2016, ch. 3) identifies the Singapore state as more ‘activist’ than in Hong Kong, ‘planning and guiding the development of its financial sector’ through tax and other fiscal incentives as part of a broader economic development strategy. But these accounts rely on recollections of participants and official published documents and are not primarily focused on the detailed historical origins of the Singapore dollar market. Bhattacharya's (Reference Bhattacharya1977) more comprehensive study on the market's origins is based on interviews in 1976 and published before important regulatory changes in 1978 and 1986, but it does offer a more nuanced view of the early operations and confirms that contemporaries viewed Hong Kong as an alternative host.Footnote 2 Applying archival and oral history evidence first reveals that the location of the market was more contested and complicated and that, despite its laissez-faire reputation, the Hong Kong government also sought to guide the development of its financial sector (Schenk Reference Schenk2003 and Reference Schenk2017). Secondly, the evidence contradicts existing accounts of the Hong Kong government's stance and reveals it as more uncertain and inconsistent. It should be noted that research on Singapore is hampered by the paucity of accessible official archives, but evidence has been collected from international agencies such as the International Monetary Fund, the Reserve Bank of New York and the Bank for International Settlements as well as from oral history records and bank archives. This is the first archive-based study of the Asia dollar market to document how these emerging states sought to take advantage of the rapid internationalisation of global capital markets.
An important element in the rise of OFCs is their relatively low tax and regulatory burden. Regulatory competition exists when there are multiple agencies with overlapping competencies; the action of one agency may then have externalities for another agency that prompt a reaction (Parisi, Schulz and Klick Reference Parisi, Schulz and Klick2006). As we shall see, in this case the externalities can be positive as well as negative – i.e. regulatory competition is not a zero-sum game. The classic regulatory competition theory was developed in the context of the state supply of public goods and this determined that such competition can result either in enhanced regulation or a deterioration in benefits to consumers.Footnote 3 Competition between financial regulators is most often viewed as a ‘race to the bottom’, prompting claims that offshore centres are destabilising and undesirable, whether by facilitating money laundering (weak supervision and disclosure), undermining financial stability (lower regulatory capital, weak supervision) or reducing the tax pool for established centres (lower tax burden) (Financial Stability Forum (FSF) 2000).Footnote 4 Thus Rose and Spiegel (Reference Rose and Spiegel2007, p. 1311) confirmed empirically that ‘OFCs are created to facilitate bad behaviour’, although they may also improve competitiveness of financial services in neighbouring centres.
There is a more optimistic literature that notes the increase in economic activity possible in tax havens, particularly in small or micro-states, which proliferated in the 1980s (Bruner Reference Bruner2016). The OFCs are seen as a mode of development, exploiting higher taxes in large established centres although sometimes by co-opting the governments of these states to the needs of global finance. Palan (Reference Palan2002, p. 172), for example, describes tax havens as ‘prostituting their sovereign rights’ in the context of integrated capital markets in the last quarter of the twentieth century. For him the links to the London Eurodollar market, the basis of law, political stability and regulatory independence facilitated the development of tax havens in British colonial territories (Palan Reference Palan2010). Since Singapore and Hong Kong shared these characteristics, they offer a fresh insight into competition between centres with similar institutional heritage that offered similar regional and time zone advantages for banks active in the global Eurodollar market.
This article examines the dollar market in Asia from three dimensions. The first section reveals new evidence on the market's origins in Singapore. The second section examines the response by the Hong Kong government and banks and shows that this decision was contested throughout the 1970s and into the 1980s. Finally, during the 1970s a range of new offshore centres emerged and the third section shows how Singapore and Hong Kong reacted to efforts to increase transparency in these new capital markets. We shall see that official regulators and supervisors in established financial markets were preoccupied by these concerns by the early 1980s, when they began to try to achieve what Genschel and Plumper (Reference Genschel and Plumper1997, p. 627) have termed a ‘cooperative turnaround’ to enhance cross-border prudential regulation. Genschel and Plumper use the negotiation of standardised capital adequacy requirements among Bank for International Settlements member banks in the 1980s as an example of a successful ‘race to the top’, but they neglect the BIS's failed early efforts (described in this section) to bring ofshore centres into the fold.
I
The development of the offshore market was part of a wider reorientation of the Singapore economy from the mid 1960s that included attracting foreign multinational corporations and developing oil-refining capacity to diversify the economy. The territory was reeling from the abrupt political separation of Malaysia and Singapore in August 1965 that left Singapore estranged from its primary hinterland, although it remained closely linked to other Southeast Asian markets (Schenk Reference Schenk2013; Lau Reference Lau1998). In 1966 the end of the conflict between Indonesia and Malaysia opened up fresh opportunities in the region but at the same time, relations with Britain were strained by the decision in 1967 to remove the British military presence from Singapore, which threatened an important source of economic activity in the newly independent state (Pham Reference Pham2010). The devaluation of sterling in November 1967 further weakened the influence of the British government and Bank of England in Singapore. The loss of over 14 per cent of the dollar value of sterling assets and the lack of advance notice given to Commonwealth countries definitely strained relations. But the balance of power was shifted away from London in the summer of 1968 when the British government was forced by its G10 partners to negotiate bilateral agreements with Singapore, Hong Kong and other holders of sterling that guaranteed the dollar value of their sterling foreign exchange reserves (Schenk Reference Schenk2010). This was a low point in Singapore–London relations and London had few ways to influence Singapore's policy but many reasons to retain cordial relations. The 1960s was thus a period of change in the foundations of the sterling area monetary system of which Singapore was a part, as well as a turning point in Singapore's own political and economic fortunes.
As the existing accounts have established, individuals were clearly important for the inspiration that started the market in Singapore, but oral history suggests that the market probably started earlier and was driven by a banker rather than politicians or their advisers. According to Yap Siong Eu, then a regional consultant with Bank of America, the Asia dollar market in Singapore was begun on a small scale by Dutch banker J. D. (Dick) van Oenen as early as 1963. He began with ‘just a few million dollars, mainly from existing depositors of Bank of America units in Southeast Asia and I dare say most of the depositors were overseas Chinese’, recalled Eu.Footnote 5 Van Oenen joined the Bank of America in the early 1960s, having trained as a foreign exchange clerk in India and Ceylon/Sri Lanka. Joseph Greene, later manager at Bank of America, described him as ‘a de Gaulle figure’ due to his tall stature and dynamism. Footnote 6 He quickly established Bank of America's leadership in Singapore, successfully bidding for government deposits by offering an attractive interest rate. The Bank of America's close links to the government were reinforced once van Oenen made a significant windfall on the 1967 sterling devaluation by running a sterling overdraft in London both on the bank's own account and on behalf of the government. As recalled by Greene, the ‘Singapore government and ourselves made a killing in one day. This was the initial rapport with government.’Footnote 7 As well as proving the Bank of America's credentials, the devaluation of sterling by 14.3 per cent in November 1967 encouraged the region's bankers and traders to switch to dollars instead of sterling as their preferred foreign currency. According to his own account, van Oenen approached Financial Secretary Goh Keng Swee to allow Bank of America to collect dollar deposits from Southeast Asia (for example from wealthy individuals and firms in Jakarta and Taiwan) into Singapore to fund local and regional lending.Footnote 8
Most accounts of the origins of the market put more emphasis on the Dutch economist Albert Winsemius, chief economic advisor to the Singapore government, who guided Singapore's development planning from 1961 to 1983. In his memoirs, Prime Minister Lee Kuan Yew (Reference Lee2000, p. 89) recalled the idea for developing Singapore as an international financial centre coming from Winsemius, who sought out van Oenen for advice.Footnote 9 In later interviews, Winsemius described how van Oenen ‘took a globe and showed me a gap in the financial markets of the world’ to show how Singapore could provide 24-hour banking between the closure of San Francisco and the opening of London and Zurich and thereby establish itself as a key international financial centre (United Nations 2015, pp. 24–5). Whether originating with van Oenen or Winsemius, the motivations for the market were to channel regional savings into local investment and to diversify the Singapore economy by enhancing its international banking sector.
From 1 October 1968 the Singapore government allowed banks to apply to open special departments called ‘Asian Currency Units’ (ACUs) to accept non-resident currency deposits (initially up to $50 million). This became known as the Asia dollar market.Footnote 10 The goal was to isolate the offshore market from the domestic market, thereby attracting regional funds inward rather than channelling domestic savings outward. In an interview with The Banker in 1970, Hon Sui Sen (Goh's successor as Financial Secretary) explained the government's support of the Asia dollar market as partly ideological and partly to promote regional development:
I believe that money which suffers from ill treatment should be allowed a safe refuge just as persecuted religious minorities deserve a sanctuary. Hitherto, refuge has been provided in countries such as Switzerland and to this extent the capital is lost for economic development in the region. When it remains in Singapore, it will be available when suitable investment opportunities arise.Footnote 11
It is clear from this evidence that the Singapore authorities planned a distinctive offshore market to integrate with the global Eurodollar market and to channel regional savings into regional (or even local) investment by allowing Singapore residents to access the market. They thus expected positive spillover effects to domestic development from attracting international banks to the IFC.
Once established, further reforms supported its growth. The market became one of the main focuses of the new Monetary Authority of Singapore (MAS) that was established in 1971, and gradually lifted the barriers for resident individuals and companies to take part.Footnote 12 From 1972, the MAS removed the 20 per cent reserve requirement on liabilities, along with stamp duty on certificates of deposit, and reduced the income tax on interest receipts from offshore loans from 40 to 10 per cent. Deposits from wealthy individuals were encouraged by the low minimum deposit of US$5000. The authorities were very ambitious for the market, encouraging the development of bond issues and term loans by issuing bonds in 1972 through the Singapore Development Bank and the government.Footnote 13
Further reforms followed to attract foreign banks. From April 1973, the MAS created a new category of licensed ‘offshore banks’ that could lend funds attracted from overseas to non-residents or to local industry when explicitly approved by the MAS. In 1965 Hong Kong had introduced a moratorium on new bank licences in the wake of a banking crisis that seemed to suggest that the colony had too many banks (Schenk Reference Schenk2003). This led to a pent-up demand for opportunities for international banks in Asia that Singapore was able to meet. Seven banks were awarded special offshore licenses in Singapore: Barclays Bank International, Bankers’ Trust, Continental Illinois, First National Bank in Dallas, Marine Midland Bank, Nat West and Toronto Dominion. There was clearly a demand to take part in this opportunity, and not all applicants were successful. One example is Crédit Lyonnais. Crédit Lyonnais had a joint representative office in Singapore with Banco di Roma and Commerzbank and in March 1973 they submitted a request to the MAS to be considered for a licence either on their own or on behalf of a subsidiary of the three banks.Footnote 14 Commerzbank subsequently approached the MAS separately, thereby ‘creating a bad impression at the Monetary Authority’ that there was a lack of coordination among the partners and permission was not granted.Footnote 15 Crédit Lyonnais continued to seek a licence, but soon discovered there were significant costs to taking part in this form of regulatory arbitrage.Footnote 16 Given the demand for licences, the MAS was in a strong position as gatekeeper and sought a significant local presence from these ‘offshore banks’.
Despite the reduction of tax and regulatory support, the path for banks that did enter the market was not always smooth. In September 1973 Henri Picq of Crédit Lyonnais’ Singapore office interviewed bankers from four of the first cohort of offshore banks to get an idea of the opportunities and constraints. He found unanimous optimism about the prospects for their new offshore business, but pessimism about the prospects for lending in Singapore dollars, and most did not expect to cover their costs in the short term.Footnote 17 Payne, the Director of Barclay's Bank International in Singapore, for example, remarked that the start of their offshore operations exceeded their hopes due to the bank's international reputation, the quality of their exchange dealer and the embeddedness of Barclays Bank in Hong Kong and Australia, which made it easy to attract funds. Most of the banks viewed their ACUs at this point as placing them advantageously for the future growth of demand for funds in Asia. The MAS allocated each bank a ceiling of up to S$20 million (USD8 million) for local loans (with a minimum S$1 million for each individual loan and a minimum term of two years), but even more restricting was the shortage of interbank funds on appropriate terms and maturities. Claude Gizard at Crédit Lyonnais’ head office in Paris thought this ceiling was ‘paralysing’, but Crédit Lyonnais still renewed its efforts to gain a licence for the three partners on 2 October 1973.Footnote 18 This time they were again unsuccessful because the MAS considered that there was no pre-established subsidiary of the three banks to take up the licence as a single institution, despite sharing a joint representative office.Footnote 19 What is interesting in this archival evidence is the emphasis bankers placed on local lending opportunities and the power of the MAS to refuse entry.
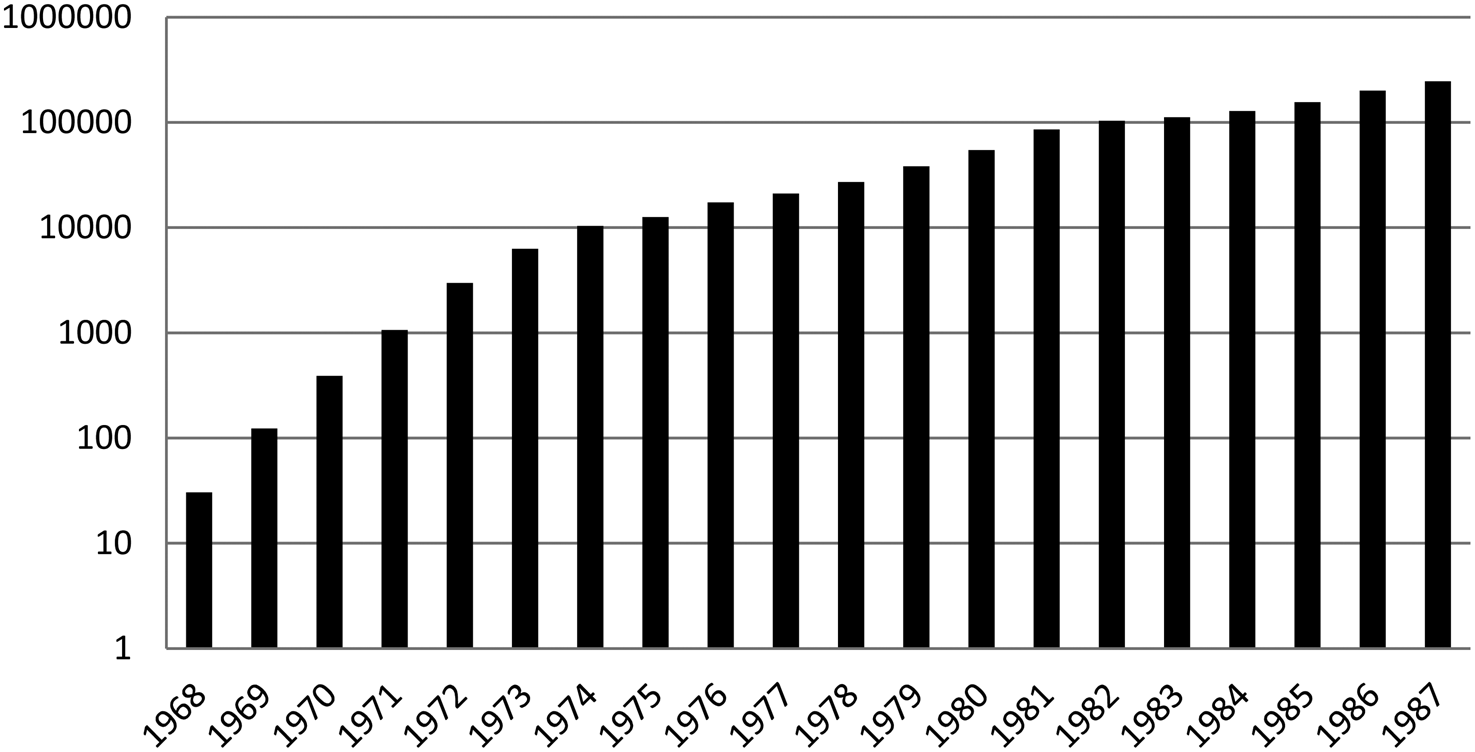
The market grew quickly. Figure 1 (log scale) shows the exponential growth of deposits in the early years, beginning to level off at the time of the international banking scandals of mid 1974, when the growth of the Eurodollar market also stumbled (Schenk Reference Schenk2014). By March 1978 there were 79 ACUs operated by local commercial banks, 54 by foreign commercial banks, 18 by merchant banks and one by a foreign-owned investment company.Footnote 20 In June 1978 all exchange controls were eliminated and the market started another phase of accelerated growth. Still, by 1983 the Asia dollar market was only 5.1 per cent of the global Eurodollar market, and never exceeded 7 per cent in the 1980s.Footnote 21
Total assets of Asian Currency Units in Singapore (US$ million)

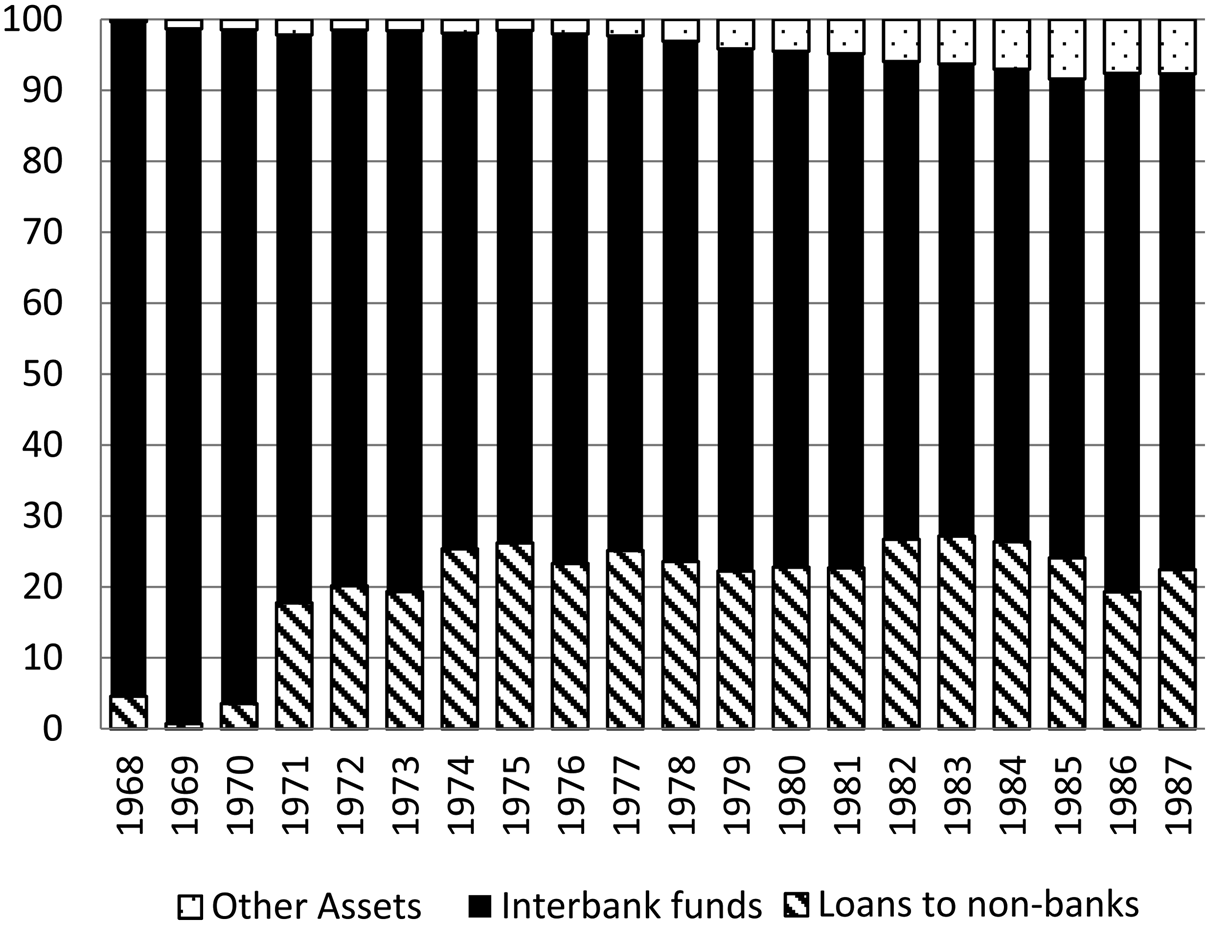
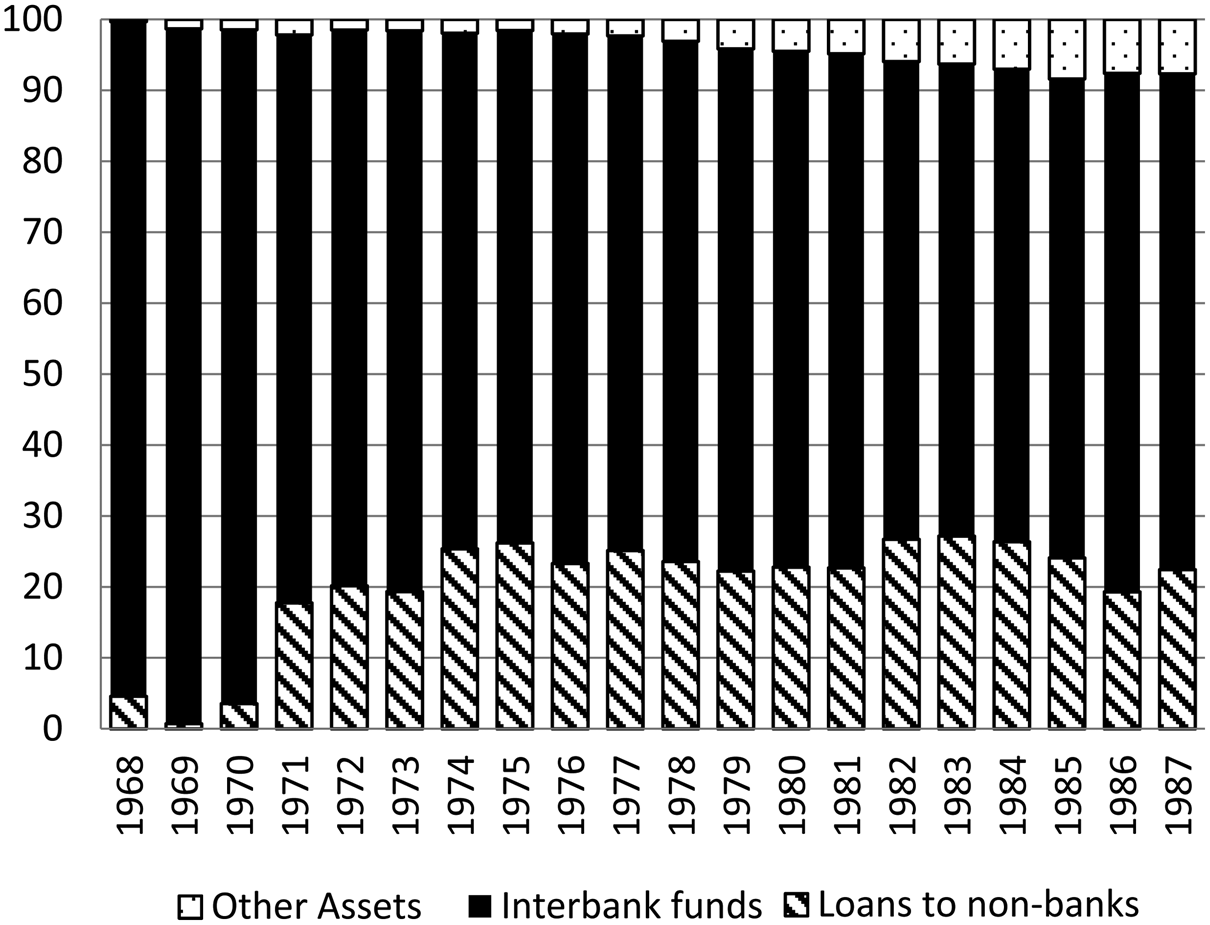
The source and flow of funds shifted over time. While initially established to attract dollars from Asia, which were then channelled to Euromarkets in Europe, from the early 1970s the flow reversed and the source of deposits shifted to Europe and the Middle East and assets were increasingly local. Initial deposits were mainly from residents of sterling area countries and the funds were then channelled by ACUs into the Eurodollar market. By 1972 about 85 per cent of funds with ACUS were used by bank and non-bank customers in Asia and Australia, compared with 43 per cent in early 1970. In early 1971 lending rates in the ADM fell relative to local rates in East Asia and the market became a more attractive source of funds for regional borrowers (Emery Reference Emery1975, p. 18). But the share of interbank assets remained about 70 per cent of total through the 1980s, as shown in Figure 2.
Singapore Asian Currency Units balance sheet assets (percentage)
In common with other offshore markets, greater global dollar liquidity from the accumulation of petrodollars in the Middle East after the first oil crisis in October 1973 was a potential boost to the Asia dollar market. Foreign Minister S. Rajaratnam toured the Middle East in the spring of 1974 to rebuild links with oil-producing states there and to assess the supply and price situation of crude oil. By this point oil refining accounted for about a quarter of Singapore's total manufacturing output. The IMF noted that Rajaratnam ‘also sounded the Arab States on possibilities of siphoning their fast-growing revenues into Singapore's burgeoning Asian dollar market (over US$6 billion in 1973) and into the local petrochemical industry’.Footnote 22 By the end of 1974 the market had reached $10.5 billion, but then began to slow from mid 1975 due to political uncertainties related to the US defeat in Vietnam, the global recession and the Herstatt bank failure in mid 1974. By the end of 1975 the market had reached US$12 billion, mainly because of the entry of newly licensed banks building their asset portfolios.Footnote 23 In mid 1975, the IMF reported that about half of liabilities and 80 per cent of claims in the market were related to Asian business and customers. The principal net borrowers were in Hong Kong, Japan and Southeast Asian countries and most of the flow of foreign funds was reported to come from the Eurocurrency market, with very little coming directly from the Middle East oil surplus countries.Footnote 24 By 1982, the IMF reported (based on discussions with bankers) that the main non-bank borrowers continued to be Singapore's neighbouring countries and that the major net suppliers of funds were the UK, USA and countries in the Middle East and Caribbean.Footnote 25 The ACUs thus served the original purpose of mobilising funds from global and regional markets for regional investment.
The market in loans and deposits soon spread to other products. At the end of 1976, US dollar-denominated certificates of deposit began to be issued in Singapore. They were considered a close substitute for US$ time deposits, although they were transferable through a secondary market.Footnote 26 The bond market began in 1971 but was slower to develop with only four issues by 1976. Changes to exchange control and taxation gave it a boost and a further nine bonds were issued in 1976 (US$266m), 13 in 1977 ($368m) and 12 in 1978 (US$454m).Footnote 27 But this remained a small market, described by John F. Salmon, general manager of Bankers Trust International (Asia), as ‘a non-starter’ in 1981.Footnote 28
In sum, the market grew quickly once established, and the opportunities to take part were taken up with alacrity by foreign banks, primarily from Europe and the USA. The Singapore government's strategy of creating an OFC through competitive regulation seemed to be a success in terms of the growth in nominal assets, although the effort to diversify into fixed-income products was less successful. The term Asia dollar market usually refers specifically to Singapore's ACUs, but its broader interpretation is the offshore market in US dollars in Asia, both deposits and later bonds. This broader interpretation better captures the links between Hong Kong and Singapore that quickly developed, as discussed below.
II
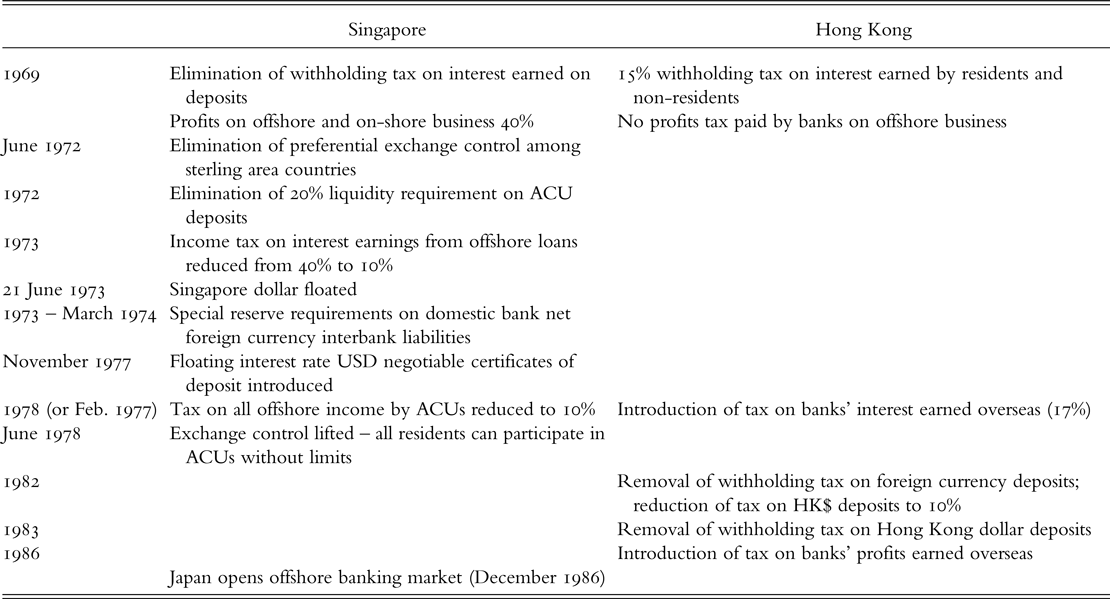
Although Hong Kong was the leading Asian banking centre in the 1960s and 1970s, the authorities there did not follow Singapore down the route of encouraging offshore banking. Interest earned by depositors in Hong Kong was taxable at 15 per cent no matter where the depositor was resident. Unlike in Singapore, banks’ profits arising from activity carried on outside Hong Kong were not subject to tax. The tax situation between Singapore and Hong Kong was thus symmetrical: Hong Kong taxed depositors (15 per cent) but not offshore bank profits; Singapore taxed bank profits (40 per cent until 1972, then 10 per cent) but not offshore depositors. The result was a flow of offshore deposits into Singapore and a rise in offshore banking business undertaken by Hong Kong banks. Table 1 sets out the main changes in Singapore and Hong Kong regulations relevant to offshore financial activity from 1969 to 1986 culminating in the opening of an offshore market in Tokyo.
Key tax and exchange control changes in Singapore and Hong Kong
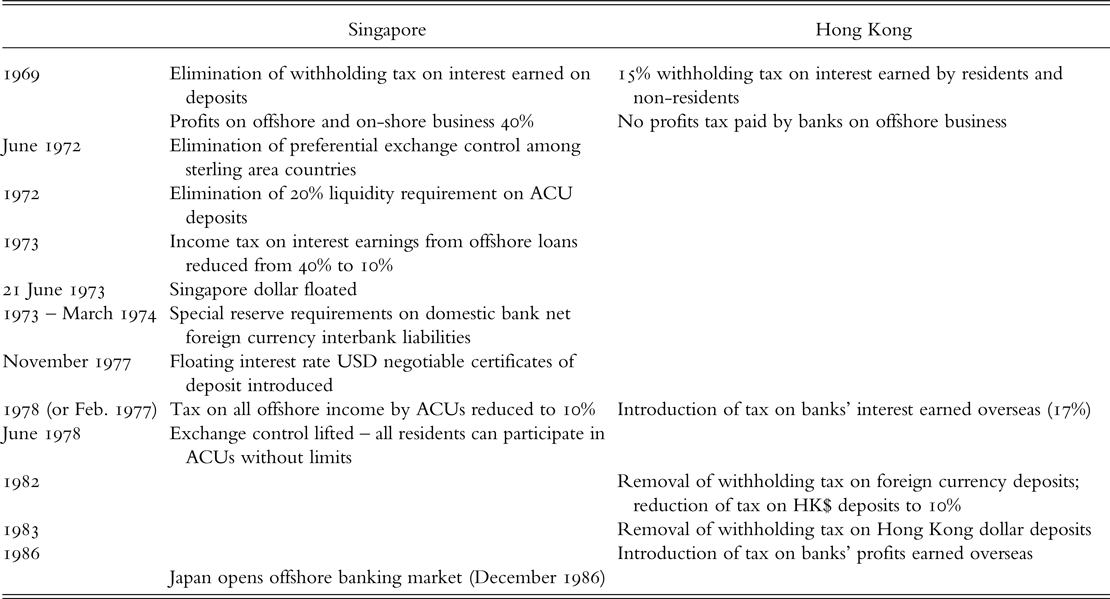
Based on interviews, Bhattacharya (Reference Bhattacharya1977, pp. 4–5) asserted that in 1968 ‘Hong Kong was the first choice’ among banking circles to host the market but that the Hong Kong government resisted cutting withholding tax on deposits and was concerned that an Asia dollar market would divert local resources to offshore business and might put upward pressure on the Hong Kong dollar.Footnote 29 The Financial Secretary, J. J. Cowperthwaite, explained his position in a somewhat frosty interview with The Banker magazine in July 1970.Footnote 30 He recalled that, unlike the case for Singapore, ‘in our discussions with interested Hongkong [sic] banks, it became very clear that they were not concerned to attract dollars to a pool in Hongkong but dollars from Hongkong to a non-resident pool’.Footnote 31 An offshore market would therefore merely drain liquidity from the domestic market. Cowperthwaite declared that Hong Kong had ‘no ambitions to be a tax haven nor to attract the kind of money that flows into tax havens. We are not fond of gimmicks.’Footnote 32 Tax on interest income was already low (at 15 per cent), and in any case ‘the use of a substantial proportion of the Asian dollar deposits in Singapore are in practice managed by the Hong Kong offices of the banks concerned’.Footnote 33 Depositors avoided paying tax on interest by locating their funds in Singapore, and banks avoided paying tax on profits from overseas lending by channelling these offshore funds through Hong Kong banks.
But the rivalry between Singapore and Hong Kong was more contested than this traditional account of cosy complementarity would suggest. The rapid growth of the Asia dollar market in Singapore soon led to calls from banks in Hong Kong to be more directly involved, and in his February 1973 budget speech Cowperthwaite's successor, Sir Philip Haddon-Cave, publicly offered to reassess the decision to put Hong Kong at a competitive disadvantage to Singapore and to investigate ways to ‘encourage an international currency market in Hong Kong’.Footnote 34 He suggested that this might follow the Singapore model and take the form of special departments of Hong Kong banks that would issue dollar Certificates of Deposit and engage in foreign currency borrowing for lending offshore in ways similar to Singapore. Importantly, however, he suggested that while there could be a new exemption of tax on interest earned on offshore loans, the banks’ profits from such trading would then be subject to local tax.
Strains between Hong Kong and Singapore soon increased the pressure for change. In June 1973, as liquidity in the Hong Kong market fell due to a drain of deposits and capital overseas, the Exchange Banks’ Association established a small subcommittee to explore the effects of the withholding tax on interest, offshore borrowings in Hong Kong, and the effect of short-term borrowing by non-bank financial companies and merchant banks.Footnote 35 To them, it seemed that there was a danger that the relative tax advantages in Singapore were attracting funds out of Hong Kong. A joint investigation by the government's banking commissioners and exchange controllers (Ockendon, Paterson and Giddy), however, recommended that the withholding tax should not be removed and the Financial Secretary's ‘offer’ was rescinded in Haddon-Cave's 1974 budget speech.
There were several factors that led to this outcome. First, the investigation identified fears that eliminating tax on all foreign currency deposits would generate a massive switch out of Hong Kong dollars and into US dollars in Hong Kong, with destabilising local monetary effects. Ockendon, Paterson and Giddy tested the possibility of following the Singapore model of special departments in banks that would be able to accept foreign currency deposits from non-residents where interest earned by depositors would not be taxed. Both the banks and the Inland Revenue believed that distinguishing between resident and non-resident deposits was too difficult without the introduction of new exchange controls. Unlike Singapore, in Hong Kong there was no ex ante distinction made in exchange control between resident and non-resident depositors, a principle that had been hard fought in the early post-war years to preserve Hong Kong's traditional entrepot role (Schenk Reference Schenk1994). Rather than introduce new controls, the proposals were abandoned since banks and other financial institutions were engaged in international currency markets in ways that already avoided the withholding tax, as suggested by Cowperthwaite in 1970. Thus, ironically, the free market for foreign exchange that operated in Hong Kong in contravention of the sterling area rules from the 1940s made it difficult to host an offshore dollar market. In Singapore, by contrast, the market was launched when their exchange control distinguished between residents and non-residents of the sterling area. Even when the sterling area controls were lifted in June 1972, the apparatus for distinguishing non-resident accounts persisted in Singapore.
Bringing the profits from the Asia dollar market onshore in Hong Kong and therefore liable to Hong Kong profits tax was deemed an unattractive price to pay for eliminating tax on interest earnings from overseas deposits. The 1973 report concluded ‘the establishment of an “official” international currencies market would not provide an extra facility but a simpler method of providing an existing facility’.Footnote 36 The Inland Revenue Ordinance specifically exempted banks from paying withholding tax on their own interest earnings – instead this income was taxed as part of profits.Footnote 37 But at the same time (unlike many jurisdictions) Hong Kong did not charge tax on profits and earnings arising from activity outside Hong Kong, so Hong Kong financial institutions could profit tax-free from operations conducted in Singapore. This ‘territorial source criterion’ was a zealously guarded facet of Hong Kong's tax system, and suggestions of changing the tax base were strongly resisted both by banks and by the Inland Revenue.Footnote 38
The Hong Kong banks’ preferred position between the Singapore and Hong Kong tax regimes did not last. Five years later, in 1978 the loophole was partially closed when some profits banks earned from offshore transactions became subject to Hong Kong tax. Littlewood (Reference Littlewood2010) describes how this outcome was the by-product of a more substantial review of the entire tax system in Hong Kong begun in mid 1976. The Review Committee confirmed the status quo that only profits originating in Hong Kong should be taxed, partly because business had threatened to ‘migrate to other centres’, but they also recommended that offshore earnings that were not generated by a corporate branch overseas should be taxed in Hong Kong (Littlewood Reference Littlewood2010, p. 196). The government rejected this proposal for most businesses but added a special exception for banks. Thus, from 1978 tax was charged on bank profits derived from business outside Hong Kong, unless it was attributable to an overseas branch. Banks were to be taxed on their market activities with other banks, rather than internal transfers within their branch networks. The tax system for banking was becoming more complex.
Many Hong Kong banks had branches in Singapore but this change still disrupted the symmetry of the tax burden between Singapore and Hong Kong and prompted the reconsideration of the withholding tax on interest earned on local foreign currency deposits. In 1979 the issue was taken up by the government's Advisory Committee on Diversification of the Hong Kong economy, which signals that it was part of the reconsideration of the direction of Hong Kong's economic prospects as manufacturing wages rose. It was thus part of government development policy in ways similar to Singapore a decade earlier. The banks and the Advisory Committee again reported concern about the possibility that Hong Kong savings were bleeding out of the local market to Singapore to take advantage of the lower taxes on non-resident deposits and that the withholding tax inhibited the inflow of capital to Hong Kong.Footnote 39 In 1980, the outgoing Financial Secretary, Sir Philip Haddon-Cave, began to reconsider lifting the taxation of foreign currency borrowing by banks, but he met with stiff resistance from Victor Ladd, the Commissioner for Inland Revenue. Ladd expressed his fear that tax revenue would be lost, particularly if the ‘tax-free’ offshore deposits could not be effectively isolated from the domestic market.Footnote 40 Ladd also noted that the growth of Hong Kong as an international financial centre ‘at least matches Singapore’ so he did not find a compelling reason to violate the territoriality criterion of the tax system.
Despite these setbacks, Hong Kong banks continued to seek relief from withholding tax and in 1981 the Committee of the Hong Kong Association of Banks established a working party to lobby the government. The Assistant General Manager of the Standard Chartered Bank in Hong Kong, William C. Brown, advised the new Financial Secretary, John Bremridge, that most international banks believed that the withholding tax on non-resident deposits did, in fact, inhibit the financial development of Hong Kong vis-à-vis Singapore.Footnote 41 He went on to warn Bremridge:
psychology is important to any market and if the international banking community believes that the difference in treatment in regard to foreign currency deposits, as between Hong Kong and Singapore, is preventing the former from developing to its full potential, then irrespective as to whether such belief is ill-founded or well-founded development will in fact be retarded by these banks’ strategies in the region.Footnote 42
But there is little evidence to suggest that the Singapore Asia dollar market undermined Hong Kong's reputation. In 1980 the Bank of Scotland, which had opened a branch office in July 1979, remarked that ‘Hong Kong is undoubtedly the Financial Centre in South East Asia and our decision to establish a presence there was the correct one.’Footnote 43 ‘Interest and fee income from eurocurrency [syndicated] lending is and will continue to be by far the largest source of revenue’ for the Hong Kong branch. In assessing where to base their first East Asian office, they noted that Singapore was complementary to Hong Kong, as a host for officially recording business for tax purposes outside Hong Kong; ‘Loans written in Singapore may be officially recorded on the books in Hong Kong by means of a “Memorandum A/C”. As the loans are not recorded in Singapore, and the business for tax purposes is outside Hong Kong, firms can avoid both Hong Kong and Singapore direct taxation.’Footnote 44 It didn't seem that even a relatively small bank like Bank of Scotland was subject to erroneous sentiment about the relative advantages of Singapore.
Despite the complementarity of the two centres, bankers continued to lobby to attract deposits to Hong Kong. The HSBC management argued that the tax regime was an obstacle to Hong Kong's development, even though Hong Kong banks were able to book substantial deposits off-shore. Thus, ‘Hong Kong would appear to be exceptional in that the taxation system acts to discourage people from keeping a substantial portion of their savings within the country.’Footnote 45 Addressing the Hong Kong Association of Banks annual dinner in August 1981, Financial Secretary Bremridge rehearsed the obstacles to changing the policy, including shrinking the tax base and a danger of residents switching from Hong Kong dollar deposits to foreign currency deposits, which ‘could lead to further pressure on the exchange value of the Hong Kong dollar; and in turn might eventually lead towards demonetisation of the local unit’.Footnote 46 Against these disadvantages the benefits in terms of repatriated deposits or enhancement of the financial centre in Hong Kong were ‘difficult to quantify’, but he concluded that ‘I promise you that I am genuinely open-minded with a predilection for freedom.’Footnote 47
Six months later, the banks’ lobbying eventually succeeded. In his budget speech for 1982 Bremridge removed tax on interest earned on foreign currency deposits, referring to ‘the clamourings of the interest tax abolitionist lobby’.Footnote 48 At the same time, he reduced the tax on interest earned on Hong Kong dollar deposits from 15 to 10 per cent to try to minimise customers switching out of local currency, but this left the taxation on Hong Kong dollar deposits higher than foreign currency deposits. By this time there was a surge in inflation, the Hong Kong dollar was struggling to retain its US dollar value and the Financial Secretary's inability to control the money supply had become a matter of public debate, so leaving this gap in the attractions of foreign versus domestic currency was a risky step (Latter Reference Latter2007; Greenwood Reference Greenwood2007). The announcement in February 1982 was viewed locally as a boost to Hong Kong's IFC but it didn't provoke too much worry in Singapore. In early June 1982, IMF staff visited Singapore and reported:
the Singapore authorities did not appear overly concerned with the recent decision of the Hong Kong Government to remove the withholding tax on interest income earned by non-residents on offshore deposit. While this action did remove one advantage of Singapore as a regional offshore foreign currency funding center, they doubted that there would be a significant movement of deposits to Hong Kong.Footnote 49
Within a few months, however, the situation had changed again. In September 1982 Prime Minister Thatcher visited Beijing and Hong Kong to discuss the handover of Hong Kong to Mainland China. The Hong Kong dollar fell sharply as the talks over Hong Kong's future were set to begin, from HKD6.00 to HKD7.00 per US dollar or 17 per cent in September 1982. During 1982, foreign currency deposits increased by HK$69 billion while Hong Kong dollar deposits declined, but Bremridge chose not to reduce the tax differential in his budget speech in February 1983, partly because this would reduce government revenue by an estimated HK$620 m.Footnote 50 In July 1983 Tony Latter, Hong Kong's Secretary for Monetary Affairs, was struggling with the mechanisms to exert monetary control in Hong Kong as inflation advanced and exchange rate stability deteriorated. In a paper for Bremridge entitled ‘A Personal View’ he noted that while the use of the Hong Kong dollar had declined over the short term, ‘much of its apparent loss of popularity would probably be reversed if interest tax were removed’.Footnote 51 The currency crisis culminated in the restoration of the currency board based on the US dollar in October 1983, and the removal of interest tax on Hong Kong dollar deposits. This finally removed the tax advantage in holding foreign currency deposits over holding Hong Kong dollar deposits.
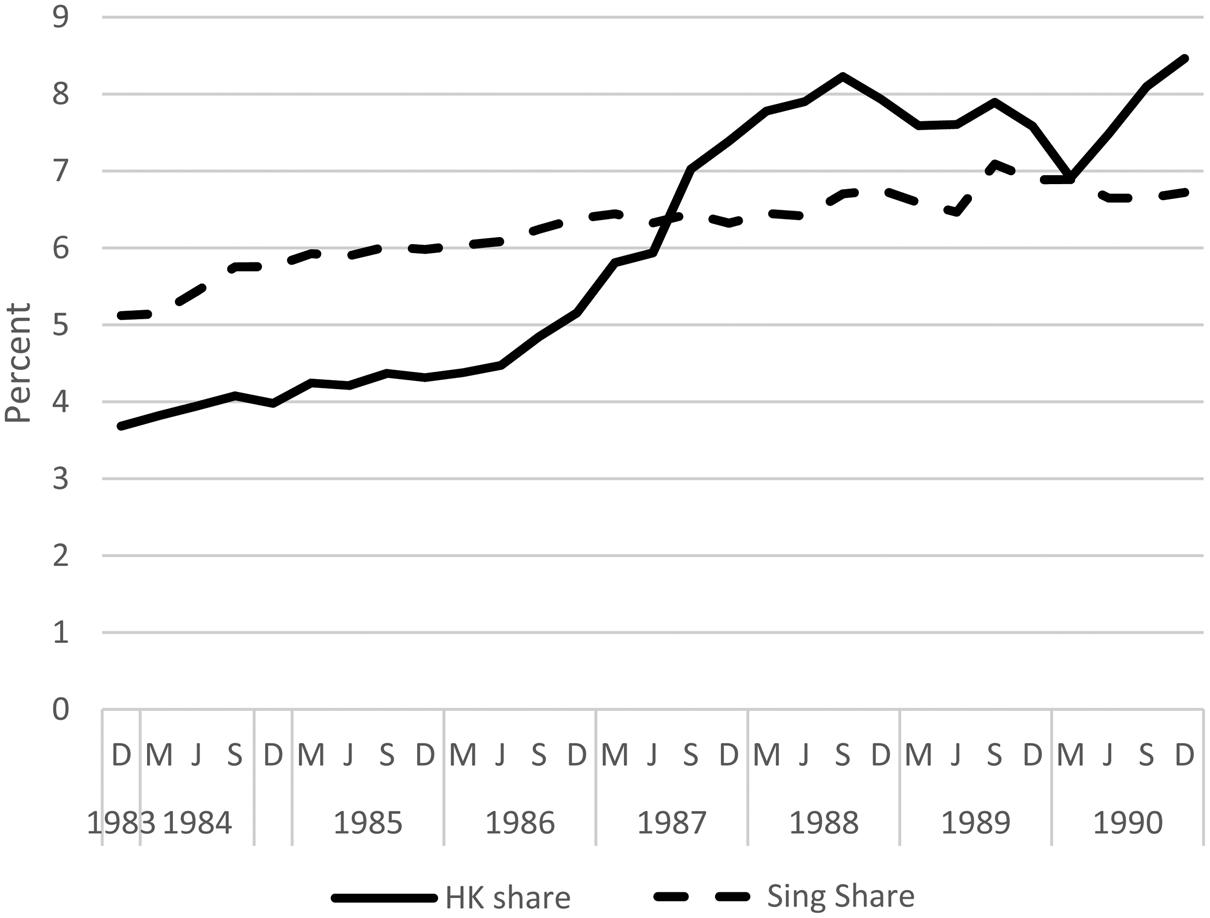
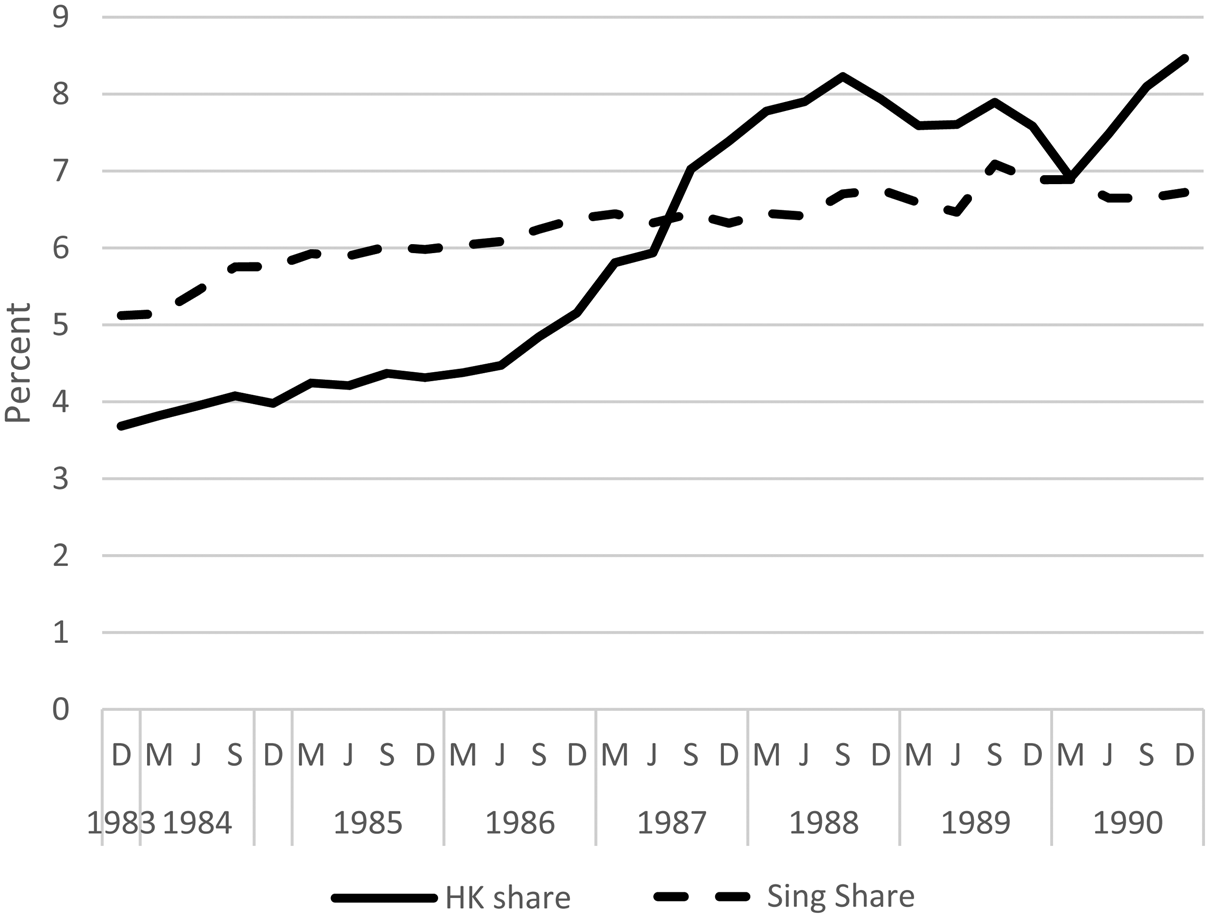
Despite these domestic political and financial disturbances, the reputation of Hong Kong's IFC was remarkably robust. At the beginning of November 1983 John H. Heires of the Federal Reserve Bank of New York met with Frederick E. Schwartz, Senior Vice President of Bankers Trust, who noted that ‘the Hong Kong situation has calmed down’ and the restoration of the currency peg to the dollar was ‘regarded positively’. Schwartz noted that ‘as a financial centre, Hong Kong remains more attractive than Singapore as it has better transportation and telecommunication with the rest of the world. Bankers Trust in the last two years studied both centres to see which would have the most advantages and it chose Hong Kong.’Footnote 52 Vice Presidents of the Chemical Bank were more supportive of the advantages that Singapore gleaned from hosting the Asia dollar market, particularly for commodities and futures trading although they had no evidence that funds had been flowing there during the autumn market disturbances.Footnote 53 The Bank of New York Vice President remarked that ‘to the extent there has been a decline in Hong Kong as a financial centre it was not overly visible but perhaps manifested itself in a subtle movement to Singapore’.Footnote 54 Figure 3 shows that foreign currency liabilities began to increase sharply in Hong Kong in the autumn of 1983 and soon exceeded those of Singapore.
Share of global cross-border foreign currency liabilities of banks reporting to the BIS
The development of a large dollar market between Singapore and Hong Kong that linked East and Southeast Asia with the Eurodollar market clearly enhanced the financial sectors of both territories. Singapore remained a primary funding centre in the region and became a leading global foreign exchange market. But the Singapore administration's efforts to develop an offshore dollar bond market and other products were less successful. This was the area where Hong Kong dominated as the underwriter for dollar bonds that fuelled the rapid East Asian economic development through the late 1980s and 1990s. The agglomeration of services and expertise in Hong Kong made it a more attractive centre for this side of the business. As Meyer (Reference Meyer2000) noted, even ‘with increasing uncertainty surrounding its return to China in 1997, challengers such as Tokyo and Singapore failed to de-throne Hong Kong as the dominant Asian venue for the decision-making about the exchange of capital’. The two centres remained complementary rather than competitors; indeed most major international banks had offices in both cities, but there were additional advantages for locating in Hong Kong. From the mid 1980s Hong Kong's IFC benefited from the opening of the mainland Chinese economy to foreign investment and trade while continuing to serve the rapidly growing economies of East Asia. Singapore remained the major financial centre for Southeast Asia. Moreover, we must remember that the offshore dollar market formed only one part of a wider range of financial services, including wealth management, commercial and corporate banking, equity trading. In the era of the East Asian export- and investment-led ‘economic miracle’ in the 1980s and 1990s there was plenty of scope for the two financial centres (World Bank 1993). The next section seeks to identify the specific integration in the dollar market across the two territories.
III
It is difficult to identify precisely the participation of Hong Kong in the Singapore market for the early years. The Banking Commissioner in Hong Kong did collect confidential data on the geographical distribution of assets and liabilities and sent this data monthly to the Secretary of State in London, but Singapore was not reported separately from ‘Rest of Sterling Area’ (although Japan, Thailand and Indonesia are recorded separately).Footnote 55 This suggests that the flow was not remarkable.
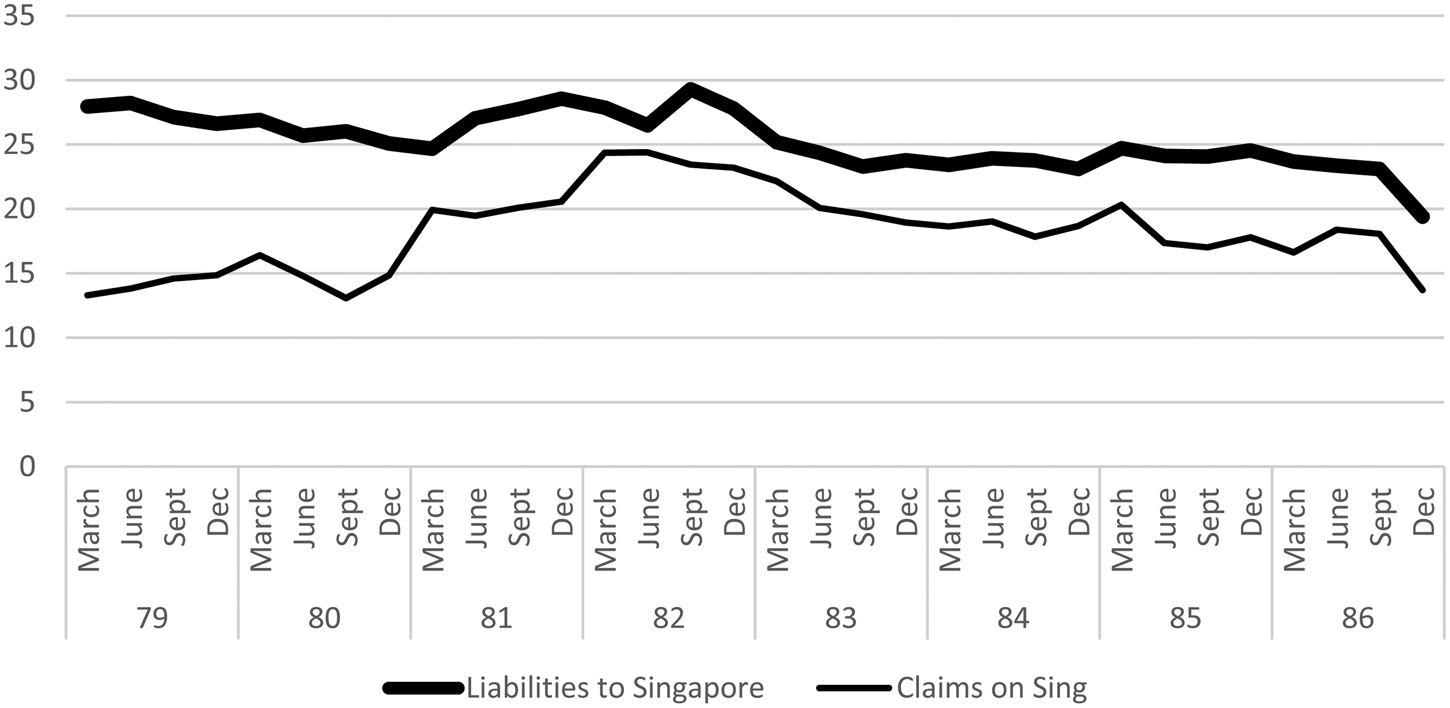
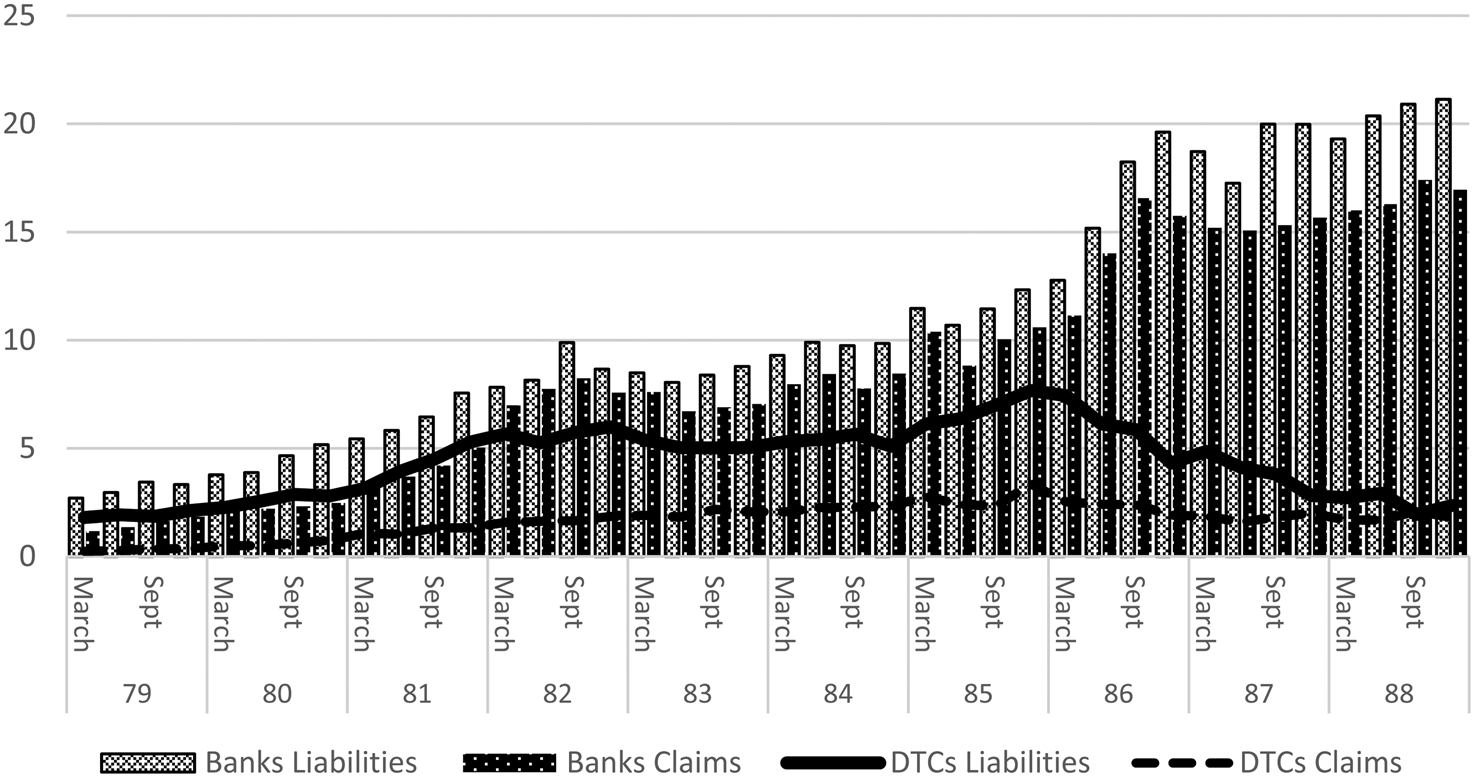
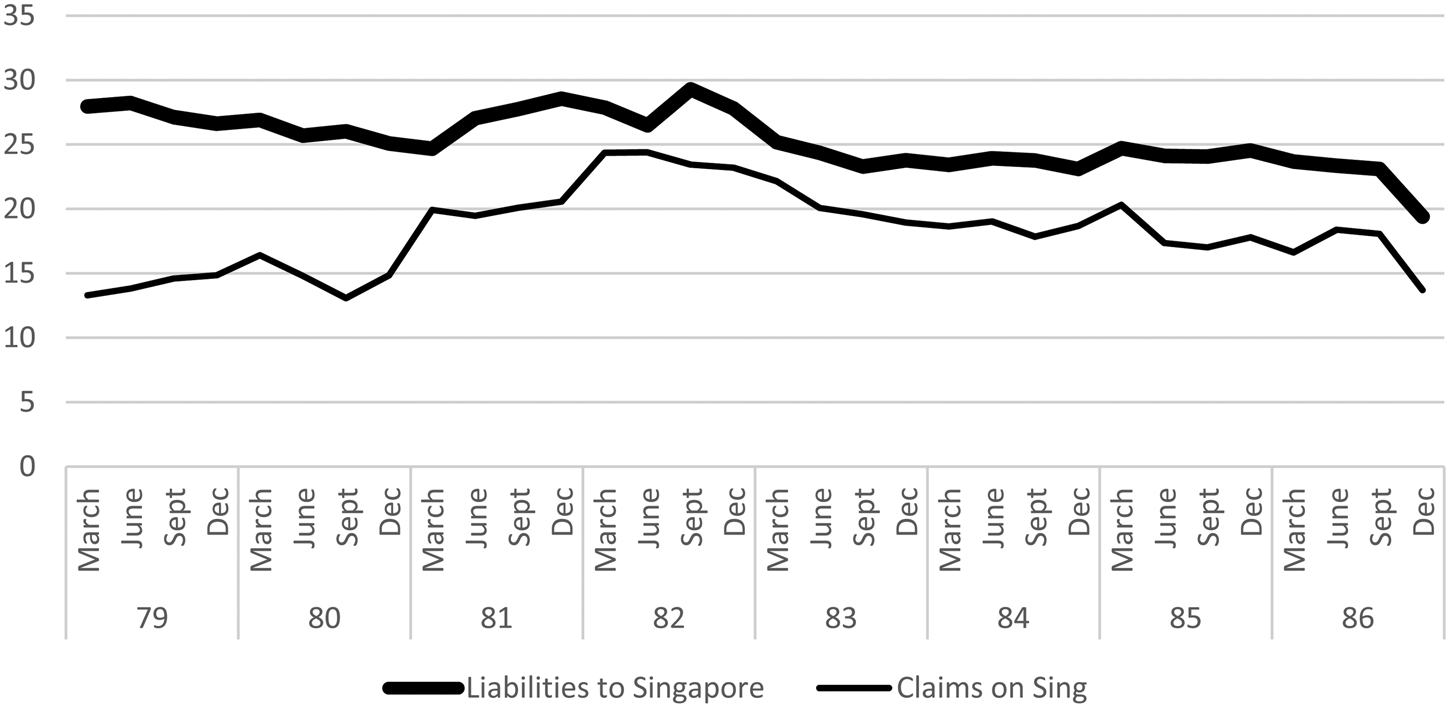
Figure 4 shows the quarterly data reported from March 1979 in the Hong Kong Monthly Digest of Statistics on foreign currency interbank balances between Hong Kong and Singapore. About one-quarter of Hong Kong banks’ foreign currency liabilities to banks overseas were to Singapore from 1979 to 1982, although this share fell to about one-fifth by the end of 1986. On the other hand, the share of claims on banks overseas increased from about 13 per cent in 1979, peaking in September 1982 at 30 per cent when the Hong Kong dollar crisis began. From 1982 to 1986 both series show a gradual decline suggesting that the intensity of interdependence receded and their geographic reach diversified. Figure 5 shows the value of cross-border foreign currency claims and liabilities. Again, the value of Hong Kong banks’ liabilities and claims on banks in Singapore peaked in September 1982 when the Hong Kong dollar currency crisis began. The 1983 measures appear to have reduced the integration of the two centres from the very high levels at the start of the decade.
Hong Kong banks’ foreign currency balances with banks in Singapore as a share of total foreign currency balances with banks overseas (banks and DTCs) (percentage)
Value of foreign currency balances between Hong Kong and Singapore banks and DTCs (US$ billion)
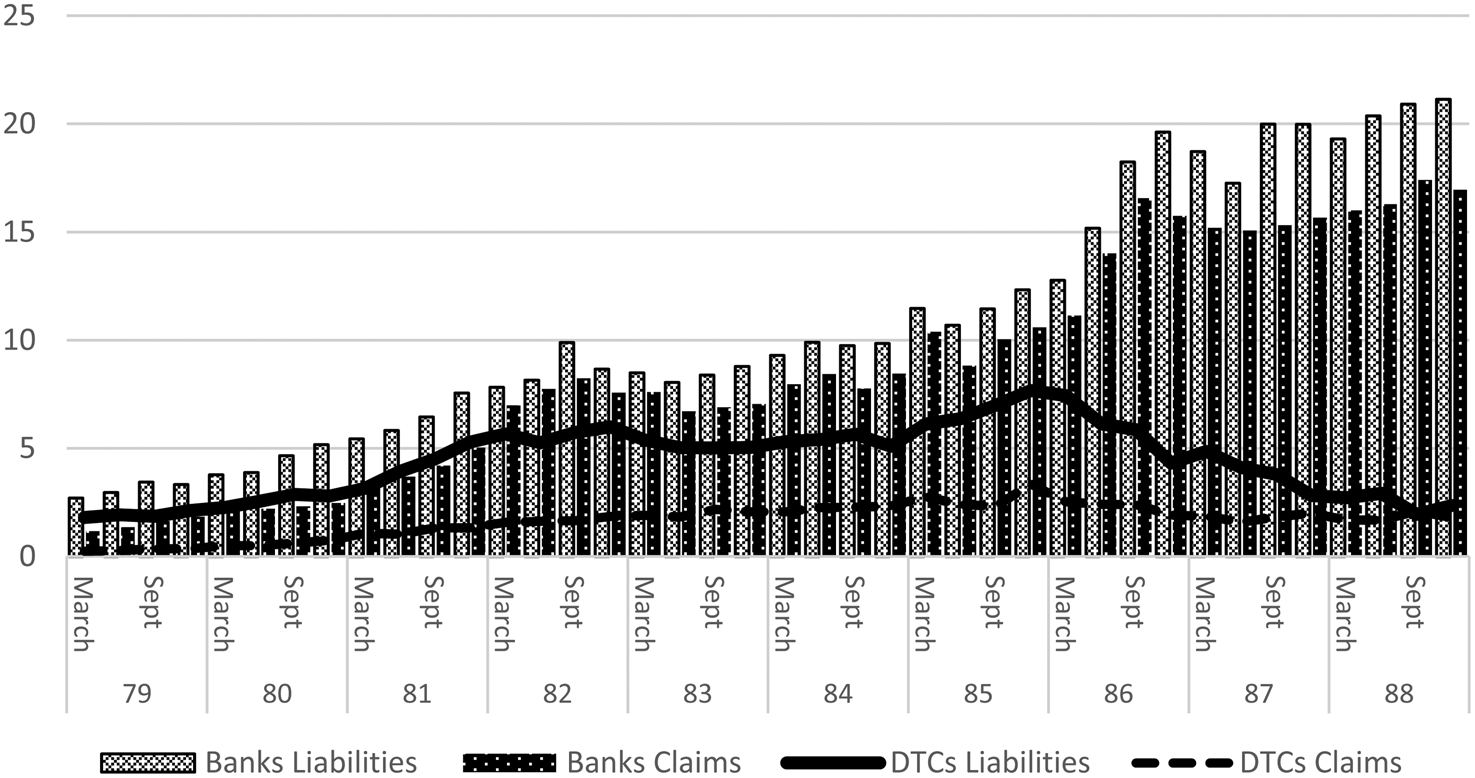
In the case of both banks and DTCs, the data show a net flow of funds from Singapore to Hong Kong (i.e. Singapore banks had net claims on Hong Kong financial firms) and indeed the net position of DTCs was about two to three times greater than that of banks, demonstrating that these more lightly regulated institutions were important players in the market (Schenk 2017). This rather contradicts the contemporary accounts of a drain of funds from Hong Kong to Singapore. While more research is needed, it is clear from these official data that financial institutions in Singapore and Hong Kong were closely linked through cross-border foreign currency balances but that this changed over time.
IV
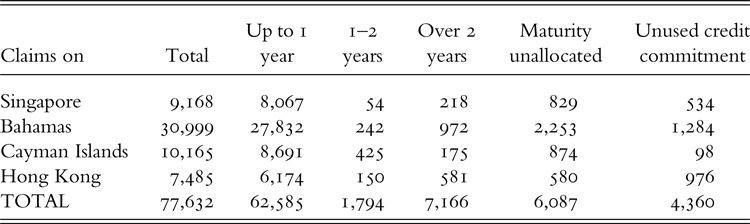
The rapid growth of offshore markets created challenges for the monitoring of international capital and banking markets and led to a sustained campaign within the Bank for International Settlements to increase transparency. The US and UK authorities were among the first to collect data from branches of their banks in offshore centres. Coverage by other countries, however, was more patchy. Table 2 shows that among G10 and other European banks, Singapore was a larger target for claims by the end of 1976 than Hong Kong, and that in common with other offshore centres, most funds were deposited on short term. At this point, Singapore was approaching the size of the Cayman Islands, but the Bahamas remained by far the largest offshore centre for the G10, particularly for US banks.
December 1976 external claims of G10+ Denmark, Ireland and Switzerland and of their affiliates in offshore centres ($ million)

Note: First series including non-US banks. Excluding Italian banks (est. $0.3 billion). Denmark and Ireland together less than $0.2 billion. Includes only a sample of banks: Netherlands 65%; France and Swiss banks 75%; USA 90%; Belgium, Canada, Luxembourg and Germany c. 95%; UK and Sweden c. 100%. French figures exclude banks’ working balances and interbank money-market operations.
Source: FRBNY Archives Fed Central 260.43.
However, relying on the reports of branches of G10 foreign banks alone did not capture the full data of these offshore centres. At the start of 1976 René Larre of the Bank for International Settlements wrote to the monetary authorities in Singapore, Panama, the Bahamas and Hong Kong to ask if they would be willing to report the foreign currency positions of their commercial banks.Footnote 56 He also offered to send out a representative from the BIS to consult and Michael Dealtry duly arrived in Hong Kong and Singapore in March 1976. He reported back to the Hong Kong banking commissioner, A. D. Ockendon:
I was also glad to learn that you feel there is a prudential case for collecting more information on the external operations of banks and other deposit-taking institutions in Hong Kong. As I think I mentioned to you the main point of our publishing every quarter a full country breakdown of the external positions of commercial banks in G10 countries is from the safety angle . . . I shall now wait to hear whether you are able to collect more information in this area and, if so, whether and how it might be incorporated into our reporting system.Footnote 57
He also found some support from the Bank of East Asia Deputy Chief Manager in Hong Kong, Michael Y. L. Kan. Dealtry wrote to Kan that ‘I was interested to note that in your opinion it would be useful if more information were available in that area. Perhaps you may be able to persuade others of that view.’Footnote 58 But he was more frank in his letter to J. B. Selwyn, Hong Kong Commissioner for Securities, thanking him for a
very agreeable evening at your club. What, if any, concrete results will come out of my visit to Hong Kong I've no idea. Perhaps not very much. But I had a whale of a time and shall not soon forget the impression of dynamism that I received. Singapore, while equally dynamic, I didn't like as much and shan't be too sorry if I don't go there again. If a chance to revisit Hong Kong comes up, however, I shall seize it eagerly – and shall hope to find you still there.Footnote 59
He played on the rivalry between Singapore and Hong Kong also in his correspondence with Mike Sandberg, Deputy Chairman of HSBC, noting ‘after visiting Singapore, where rather more statistical information is available in this area, I was left wondering which of the two centers in fact does the greater volume of foreign currency banking’.Footnote 60 In Singapore, Dealtry also met with a range of British and US bankers to learn about the Asia dollar market and to make the case for disclosing more banking statistics for the BIS series.Footnote 61 Michael Wong Pakshong, Managing Director of the Monetary Authority of Singapore, noted that he would be willing in principle to contribute, but he was concerned about the potential to use the data as a first step to controlling the market and also about the confidentiality of the data within the BIS. Dealtry reassured him:
so far as ‘control’ of the Eurocurrency market is concerned, no such idea lay behind our decision to visit Singapore and other financial centres outside the G10 area; that we are, to say the least, skeptical about the practical possibilities of countries being able to agree on, let alone carry out, any effective control scheme; and that we do not really see how any financial centre could be ‘controlled’ by others against its own will. Secondly, so far as concerns the sensitive character of some of the data you receive, any information that you pass on to us would of course only be used in strict accordance with your instructions. In that connection, I would add that the full country breakdowns of their banks’ external liabilities and assets that we receive from G10 monetary authorities are not circulated, either inside the BIS or among the contributing central banks, except on a consolidated basis.Footnote 62
But neither the Singapore nor the Hong Kong authorities wanted to disclose their banks’ positions. In November 1976 Wong finally responded to Larre that he preferred to wait until Hong Kong had provided their data before making Singapore's data available.Footnote 63 No offshore centre wanted to be the first to be reporting formally to the BIS. At one point it seemed the Cayman Islands would disclose their annual data, but when they heard that the Bahamas authorities were hesitating, they withdrew their offer.Footnote 64 In April 1977 Larre noted:
Mr. Wong Pakshong in Singapore is not ready to provide information until other Asian offshore centres, in particular Hong Kong, do so; and Mr. Donaldson in the Bahamas has indicated that his position is the same… thus the present situation is that we are unable to extend our reporting to cover any of the major offshore financial centres. We have, however, by no means given up hope of obtaining information from Hong Kong . . .Footnote 65
Much, therefore, hinged on Hong Kong's reaction, but they were slow to respond. Two years later, in 1979, Larre reported to Wong that the collection of data from Hong Kong had been delayed and that no data would be collected on Hong Kong banks’ liabilities to non-resident non-banks, since there was no recognised test of residency in Hong Kong to identify these positions. On this basis Larre asked again if Singapore would participate, noting that ‘you ask whether other offshore centres have agreed to provide us with statistics’ but these other centres had only agreed to contribute their data if Hong Kong and Singapore did.Footnote 66
As part of their charm offensive, in 1980 the Basel Committee on Banking Regulations and Supervisory Practices, which sought to exchange information and best practice among G-10 banking supervisors, convened a meeting of supervisors in offshore centres. The meeting was held over two days at the end of October 1980 to try to engage these centres in the sharing of data, and supervisory cooperation.Footnote 67 Beyond introducing supervisors of offshore centres to each other, there was very little tangible progress from this meeting.
In 1986 the IMF also tried to convince the Singapore authorities to disclose more banking data. The MAS participated in the Fund's international banking statistics project, providing quarterly consolidated positions of ACUs vis-à-vis most individual countries, but excluding seven countries in Asia. The data were also not broken down into bank/non-bank positions, which needed to be estimated by the IMF on the basis of partner data.Footnote 68
This initial evidence about official attitudes to ofshore markets reveals the tension between deregulated markets, financial globalisation and transparency during the first half of the 1980s when regulators struggled with prudential supervision in a rapidly evolving international financial market.
V
As noted in existing accounts, the Asia dollar market was launched in Singapore rather than Hong Kong because of the unwillingness of Hong Kong to adapt its tax legislation in 1967–8, but that was not the end of the story. Three conclusions emerge from this early history of the dollar market in Asia. First, the motivation for creating the Asia dollar market in Singapore was twofold: to promote an international financial centre as part of the diversification of the Singapore economy (along with a range of other initiatives), and secondly to channel regional savings into regional development projects (including in Singapore). The way the regulations evolved meant that it was not strictly offshore since it was hoped that part of the funds could be used locally; local residents were gradually allowed greater access to both the deposit and loan markets. Capturing opportunities for lending due to regional and local development was also of prime importance to the banks that entered the market in its early years. Furthermore, new evidence shows the initiative to create the opportunity for tax-free foreign currency deposits in Singapore most likely came from a leading banker, rather than a government adviser as previous accounts have suggested.
Secondly, the initial decision to reject an offshore dollar market in Hong Kong did not resolve the issue. Rivalry between Hong Kong and Singapore shows some characteristics of regulatory competition, but in fact for most of the first decade, Hong Kong banks were able to exploit Singapore's tax concessions, so the markets were more complementary than competitive. But this complementarity was contested. Once the tax-free status of profits on their business with overseas banks was removed, bankers lobbied the government to reduce taxes on all foreign currency deposits, arguing that Hong Kong's tax system on foreign currency deposits undermined its reputation as an IFC. They also expressed concern about funds being diverted from Hong Kong to Singapore, although official banking data show that the net flow was in the other direction. The Financial Secretary eventually changed his mind partly in response to this lobbying, but also as part of a more general uncertainty about monetary control that culminated in the restoration of the Hong Kong dollar currency board in 1983. The Hong Kong government response was inconsistent and at times confused. Evidence from international banks suggests they still preferred Hong Kong to Singapore because of the agglomeration of other services there. The currency instability of 1982–3 was a more important blow to Hong Kong's reputation, although the restoration of the currency board link to the US dollar in October 1983 resolved this issue quickly. Nevertheless, over the longer term, Singapore came to exceed Hong Kong as an international banking centre in terms of volume of foreign liabilities, but not in terms of number of bank headquarters and offices or the other financial services that contributed to the region's rapid economic growth (von Peter Reference von Peter2007).
Thirdly, the Singapore and the Hong Kong authorities both considered their IFCs an important element of development planning for their territories. While the Singapore government is usually portrayed as having a more deliberate and comprehensive strategy, the archival record has shown that the Hong Kong government also deliberated and intervened in its IFC as part of an economic development strategy. Despite the fact that Singapore was an independent state and Hong Kong was a British colony, both states were able to resist efforts from Europe and the US to increase transparency in their offshore markets and conform to reporting standards developed through the Bank for International Settlements. More work remains to be done on the integration of the market into global money and capital markets and comparing Singapore to other offshore centres.