Introduction
Geriatric depression (GD) is a serious public health issue with prevalence reaching up to 25% in some studies, with significant physical and cognitive comorbidity. Also, GD has lower response and remission rates and higher relapse rates than depression in younger adults (Forlani et al., Reference Forlani2014; Lenze et al., Reference Lenze2008; Meeks et al., Reference Meeks, Vahia, Lavretsky, Kulkarni and Jeste2011; Mitchell and Subramaniam, Reference Mitchell and Subramaniam2005; Whiteford et al., Reference Whiteford2013). In order to improve clinical outcomes and move towards individualized treatment strategies, research efforts have focused on the search for potential biomarkers to predict antidepressant response through pharmacogenomics, proteomics, metabolomics, neuroimaging and neurophysiology approaches (Gadad et al., Reference Gadad2018). However, currently there are no clinically validated biomarkers to guide the treatment algorithm for GD.
Over the last two decades, extensive research has revealed an important role of the gut microbiota in human health (2012; Cani and Knauf, Reference Cani and Knauf2016; Lowry et al., Reference Lowry2016). The gut microbiota is the collection of bacteria, archaea and eukarya colonizing the gastrointestinal (GI) tract which has co-evolved with the host to form a mutually beneficial relationship (Sender et al., Reference Sender, Fuchs and Milo2016). The GI tract itself covers a surface area of 250–400 m2, connecting the host with a vast array of environmental influences and antigens in the human body whereby microbiota plays a range of beneficial roles including maintaining the gut barrier integrity, harvesting energy, protection against pathogens and regulation of host immunity to maintain homeostasis and prevent inflammation (Thursby and Juge, Reference Thursby and Juge2017; Vemuri et al., Reference Vemuri2018). However, these mechanisms can be disrupted when there are alterations in “healthy” gut microbiota, known as dysbiosis. Patterns of dysbiosis have been well characterized in obesity (Ley, Reference Ley2010; Ley et al., Reference Ley, Turnbaugh, Klein and Gordon2006) and related metabolic comorbidities (Karlsson et al., Reference Karlsson2013; Koeth et al., Reference Koeth2013; Tuohy et al., Reference Tuohy, Fava and Viola2014) as well as disorders of chronic low-grade inflammation such as inflammatory bowel disease (Petersen and Round, Reference Petersen and Round2014) and cancer (Wu et al., Reference Wu2013). Aging is associated with shifts in the gut microbiota partly due to senescence-related impairment in bowel and immune functions (Tiihonen et al., Reference Tiihonen, Ouwehand and Rautonen2010; Woodmansey, Reference Woodmansey2007). GD may be more recalcitrant to treatment than depression in younger adults due to the aging-associated dysbiosis.
Recent clinical studies reveal an emerging pattern of dysbiosis in association with major depressive disorder (MDD) (Cheung et al., Reference Cheung, Goldenthal, Uhlemann, Mann, Miller and Sublette2019; Jiang et al., Reference Jiang2015; Kelly et al., Reference Kelly2016; Zheng et al., Reference Zheng2016) suggesting a potential role for the gut microbiota in neuropsychiatric functioning (Sarkar et al., Reference Sarkar, Lehto, Harty, Dinan, Cryan and Burnet2016). Transplantation of fecal microbiota from depressed patients into microbiota-depleted animal model was shown to induce anxiety-like behaviors and anhedonia in recipient animals, suggesting a causative role of microbiota on mood (Kelly et al., Reference Kelly2016; Zheng et al., Reference Zheng2016). Antidepressants such as selective serotonin reuptake inhibitors (SSRIs) also possess antimicrobial properties that can partially reverse the dysbiosis and the associated increase in gut permeability observed in MDD, offering a possible mechanism of action of antidepressants involving the gut microbiota (Macedo et al., Reference Macedo2017). A functional neuroimaging study provided another evidence for the effect of microbiota on brain function whereby consumption of probiotics for 4 weeks resulted in modulation of brain activity in regions that control processing of emotion and sensation (Tillisch et al., Reference Tillisch2013). Despite the promising preclinical and translational results for the beneficial effects of probiotics on mood, human clinical trials of probiotics for depression have only yielded small effects and it had no effect on the population aged over 65 (Huang et al., Reference Huang, Wang and Hu2016). Most probiotic preparations are composed of different strains of Bifidobacterium and Lactobacillus which may not be sufficient for targeting dysbiosis associated with depression, especially in late-life. Further investigation is required to identify therapeutic targets within the gut microbiota to generate novel probiotic candidates for depression treatment.
Levomilnacipran (LVM) is a more recent FDA-approved antidepressant that affects noradrenergic and serotonergic neurotransmission. Serotonin is known to decrease with aging and is critically involved in mood disorders (Dell’Osso et al., Reference Dell’Osso, Carmassi, Mucci and Marazziti2016; Fakhoury, Reference Fakhoury2016; Gao et al., Reference Gao2018; McEntee and Crook, Reference McEntee and Crook1991) while norepinephrine is involved in preserving cognitive abilities in healthy aging (Mather and Harley, Reference Mather and Harley2016). Both systems are compromised in aging, particularly in GD (Gareri et al., Reference Gareri, De Fazio and De Sarro2002; Marshe et al., Reference Marshe2017; Patel et al., Reference Patel, Abdool, Rajji and Mulsant2017; Yun et al., Reference Yun, Park, Kim, Kim and Hong2015). LVM is considered a selective noradrenergic and serotonergic reuptake inhibitor (SNRI) and has 17–27 times higher norepinephrine reuptake selectivity compared to other SNRIs (i.e. venlafaxine and duloxetine) (Auclair et al., Reference Auclair2013).
Placebo-controlled trials in younger adults with MDD suggest that LVM is well tolerated and significantly improves symptom severity and functioning (Bruno et al., Reference Bruno, Morabito, Spina and Muscatello2016; Montgomery et al., Reference Montgomery, Gommoll, Chen and Greenberg2015; Montgomery et al., Reference Montgomery, Mansuy, Ruth, Bose, Li and Li2013; Montgomery et al., Reference Montgomery, Mansuy, Ruth, Li and Gommoll2014; Sambunaris et al., Reference Sambunaris, Bose, Gommoll, Chen, Greenberg and Sheehan2014a; Sambunaris et al., Reference Sambunaris, Gommoll, Chen and Greenberg2014b). In a 12-week double-blind placebo-controlled pilot randomized controlled trial (RCT) testing the efficacy and tolerability of LVM in patients with GD (NCT02466958), we previously found that LVM did not improve depressive symptoms in GD significantly more than placebo, however, it was associated with longitudinal changes in brain structure (Krause-Sorio et al., Reference Krause-Sorio2020). High placebo response magnitude (>30% mean change from baseline) has been observed in many antidepressant trials which partly explains the lower response rates in placebo-controlled RCTs compared with head-to-head trials (Khan et al., Reference Khan, Detke, Khan and Mallinckrodt2003; Salanti et al., Reference Salanti2018). Accordingly, placebo effects appear to account for most of the clinical response to LVM in this RCT. Given the strong evidence that brain–gut–microbiota interactions modulate mood disorders and the observation of dysbiosis in late-life, we hypothesized that the gut microbiota is a contributing factor for predicting response to antidepressant treatments, including the placebo effects, in GD. In this pilot exploratory study, as a secondary analysis of the parent RCT (NCT02466958), we examined the effect of baseline fecal microbiota on the treatment response to placebo or LVM in patients with GD. To the best of our knowledge, no study to date has examined the effect of baseline microbiome status as a biomarker for prediction of antidepressant response in either younger or older adults with depression.
Methods
Participants
Participants were recruited from geriatric ambulatory care settings (UCLA Geriatric Medicine-Psychiatry clinics) and from local advertisements. 208 participants were assessed for eligibility based on age of 60 years or older with a diagnosis of MDD and a Mini-Mental State Examination (MMSE) score of >24 (absence of mild cognitive impairment or dementia). Twenty-nine subjects were randomized to receive either LVM (N = 17) or placebo (N = 12) for 12 weeks, of which 17 (LVM 7 and placebo 10) provided stool samples at baseline and 12 (LVM 4 and placebo 8) completed the study and were included in the fecal microbiota analysis (see supplementary Figure S1). LVM was administered at a final dose of 120 mg per day with dosage adjustments according to tolerability when indicated. See Table 1 for participant baseline characteristics. The study design and recruitment have been previously described (Krause-Sorio et al., Reference Krause-Sorio2020). Depressive symptom severity at baseline and follow-up were assessed using the Hamilton Depression Rating Scale (HAMD-24). Remission was defined as having a HAMD score of 6 or lower at follow-up. Stool samples were collected at baseline and follow-up for fecal microbiome analysis. This study was approved by the UCLA Institutional Review Board. All participants signed an informed consent form prior to initiation of assessments. This trial was registered on clinicaltrials.gov (NCT02466958).
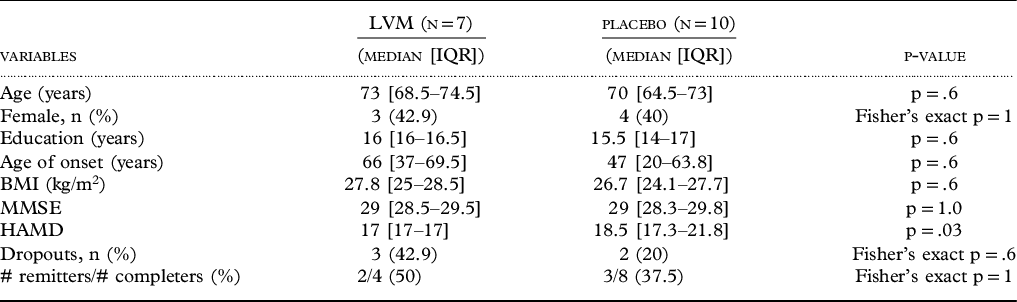
Baseline demographic and clinical characteristics of participants

Between-group differences were tested with exact Mann–Whitney test for continuous variables and Fisher’s exact test for categorical variables (median and inter-quartile range shown here). LVM = Levomilnacipran; IQR = Inter-Quartile Range; BMI = Body Mass Index; MMSE = Mini-Mental State Examination; HAMD = Hamilton Depression Rating Scale (24-item).
Sample collection and stool DNA 16S ribosomal RNA sequencing
Participants collected stool specimens at home, stored at home freezer and returned to the laboratory on cold packs for storage at −80°C. Genomic DNA was extracted from fecal samples using the Powersoil kit and bead beating as per the manufacturer’s instructions (QIAGEN, Germantown, MD, USA) (Tong et al., Reference Tong, Jacobs, McHardy and Braun2014). The fecal genomic DNA was used as template for polymerase chain reaction (PCR) amplification of the V4 hypervariable region of the 16S rRNA gene using barcoded primers (F515/R806) (Caporaso et al., Reference Caporaso2012). Paired-end sequencing (250 × 2) was then performed using the Illumina MiSeq sequencing platform (San Diego, CA, USA).
Data processing and statistical analysis of microbiome data
The amplicon sequence variants (ASVs) were chosen de novo using the DADA2 algorithm (Callahan et al., Reference Callahan, McMurdie, Rosen, Han, Johnson and Holmes2016) and taxonomic assignments were performed using the Silva database version 132 as a reference (Caporaso et al., Reference Caporaso2010). Sequence depth ranged from 32,851 to 113,025 sequences per sample with a total of 2,245 assigned ASVs. α-diversity (within-sample) was assessed in QIIME using Faith’s phylogenetic diversity (fraction of a phylogenetic tree represented in each sample), Chao1 (number of species in each sample), and the Shannon index (similarity of the number of each species in each sample) with the data rarefied to 32,851 sequences. Statistical significance was assessed using two sample t-test in R. β-diversity (between-sample) assessment was performed by compositional distance metric based on Robust Aitchison PCA via DEICODE in QIIME2 and visualized by principal coordinates analysis plots. ASV count data were filtered to remove ASVs present in less than three samples. Statistical significance of differences in β-diversity was assessed using Adonis, a nonparametric method of analysis of variance, implemented in the Vegan package in R (McArdle and Anderson, Reference McArdle and Anderson2001).
Differential abundance analysis
Differentially abundant genera between the remitter and non-remitter groups at baseline were analyzed based on the negative binomial distribution of the relative abundance dataset using DESeq2 in R (Love et al., Reference Love, Huber and Anders2014). Covariates included age, sex and treatment type (LVM or placebo). Genus level changes from baseline to post-treatment were analyzed using DESeq2 after adjusting for each subject. Genus count data were filtered to remove genera present in less than fifty percent of the sample size. Total of 81 genera from the baseline samples, 81 genera from the remitter samples and 104 genera from the non-remitter samples were tested. False discovery rate (FDR) correction method of Benjamini and Hochberg was used to adjust for multiple hypotheses testing and a significant association was defined at the FDR q-value <0.1 (Storey and Tibshirani, Reference Storey and Tibshirani2003).
In order to overcome potential bias inherent in comparing relative abundance information from compositional datasets, differentials (estimated log-fold change in relative abundance) detailing baseline microbial association with remission (controlling for age, sex and treatment type) were estimated through multinomial regression using Songbird v1.0.1 in QIIME2 (Morton et al., Reference Morton2019). Differentials of each genus associated with changes from baseline to post-treatment within the longitudinal dataset from either remitters or non-remitters were also obtained while controlling for each subject. Differentially ranked features (genera) were visualized in Qurro v0.4.0 (Fedarko et al., Reference Fedarko2020) and high- and low-ranked features were further examined via log-ratio analysis against reference frames within samples. Two-sample unpaired t-test for baseline analysis and paired t-test for longitudinal analysis were used for statistical analysis.
Random forest classifiers
Random forest classifier to predict remission to antidepressant treatment was created in R using the randomForest package with 1001 trees and mtry = 2 (Breiman, Reference Breiman2001). Genus count table from the baseline samples was filtered to remove genera present in less than six samples (50% of the sample size) and rarefied to 33,729 counts/sample and the resulting 81 genera were inputted into the algorithm to construct a classifier with 9 taxa as features to predict remission status at follow-up. Importance scores and area under the curve (AUC) measures were used to select the features of the classifier. The accuracy of random forest classifier was estimated using 5-fold cross-validation by splitting the 12 baseline samples into training sets (9 or 10 samples) and validation sets (2 or 3 samples).
Statistical analysis of demographic and clinical data
Treatment groups were compared on all demographic and clinical measures at baseline using exact Mann–Whitney tests for continuous variables and Fisher’s exact tests for categorical variables. Similarly, clinical remitters were compared to non-remitters regardless of the treatment assignment on the same demographic and clinical measures at baseline using the same tests. The significance threshold for all outcome measures was set at 0.05 (two-tailed).
Results
Subject baseline characteristics and clinical outcomes
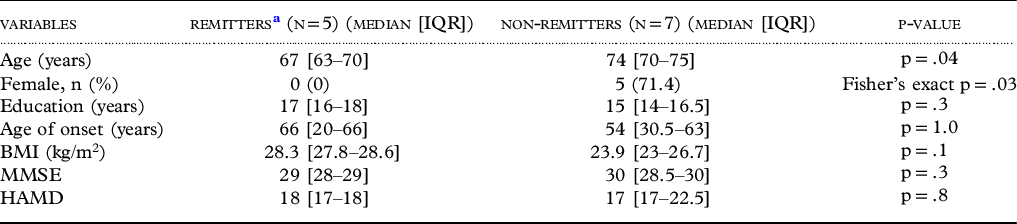
Of the 17 randomized participants, 12 completed the study and were included in the analysis (see supplementary Figure S1). The final samples consisted of four participants in the LVM and eight in the placebo group. We found no baseline differences between LVM and placebo groups in age, sex, education, age of onset, body mass index and MMSE scores (Table 1). The median HAMD score was 17 and 18.5 for LVM and placebo groups, respectively, which was a significant difference (p = .03; Table 1). Clinical remission (HAMD ≤ 6) at follow-up was achieved by 2/4 LVM participants (50%) and 3/8 (37.5%) participants in the placebo group (Fisher’s exact p = 1; Table 1). Due to the high dropout rate in the LVM group (43%) leaving only four completers, we combined the LVM and placebo groups to compare baseline characteristics between remitters and non-remitters independent of treatment. There were baseline differences between remitters and non-remitters in age and sex; remitters were significantly younger than non-remitters (p = .04) and were more likely to be male than female (Fisher’s exact p = .03). There were no significant baseline differences between remitters and non-remitters in education, age of onset, body mass index, MMSE or HAMD scores (Table 2).
Baseline demographic and clinical characteristics of remitters compared to non-remitters

Between-group differences were tested with exact Mann-Whitney test for continuous variables and Fisher’s exact test for categorical variables. LVM = Levomilnacipran; IQR = Inter-Quartile Range; BMI = Body Mass Index; MMSE = Mini-Mental State Examination; HAMD = Hamilton Depression Rating Scale (24-item).
a Remitters were defined as participants who achieved HAMD ≤ 6 at the end of treatment regardless of the type of treatment received.
Baseline microbial community differences based on remission status
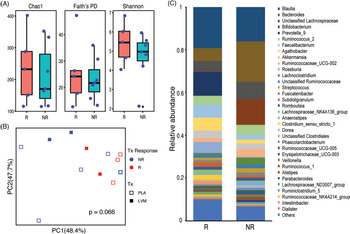
We investigated whether clinical remission status, irrespective of the group assignment (LVM vs. placebo) reflected baseline microbial community differences. There were no statistically significant differences in baseline α-diversity metrics including Chao1 index (p = .66), Faith’s PD (p = .66) and Shannon index (p = .33) between remitters and non-remitters (Figure 1 A). β-diversity testing based on Robust Aitchison PCA revealed a graphical divergence in fecal microbial communities at baseline between remitters and non-remitters but did not demonstrate statistical significance after adjusting for age, sex and treatment group (Adonis p = .066; Figure 1B).
Baseline fecal microbial composition is associated with clinical remission following treatment in GD. (A) Box plots with dots showing α-diversity metrics of species richness (Chao1; p = .66), phylogenetic diversity (Faith’s PD; p = .66), and evenness (Shannon; p = .33) for all baseline samples stratified by remission status. R: remitters, NR: non-remitters. (B) Principal coordinates analysis (PCoA) plot of microbial β-diversity metric based on Robust Aitchison PCA. Each symbol represents a sample from baseline with color and shape representing remission status and treatment type (placebo vs. LVM), respectively. The p-value for group difference between remitters and non-remitters was calculated using Adonis adjusting for age, sex and treatment group. (C) Stacked bar chart showing mean relative abundance of the individual genera (minimum abundance at 1%) within the remitter (R, N = 5) and non-remitter (NR, N = 7) groups.

Baseline taxa associated with remission
In order to define the compositional differences between remitters and non-remitters at baseline, taxonomic summaries at the genus level were computed in QIIME. Mean relative abundances of the highly abundant (>1% relative abundance) genera illustrated graphical differences in the microbial profiles between remitters and non-remitters at baseline (Figure 1C). Next, we sought to identify significantly differentially abundant taxa between remitters and non-remitters using DESeq2 multivariate analysis after adjusting for age, sex and treatment group. This revealed a single genus Faecalibacterium that was significantly enriched in remitters compared to non-remitters at baseline after correcting for FDR (q < 0.1) for multiple hypotheses testing (Figure 2A).
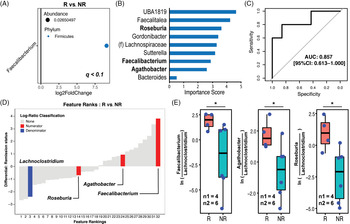
Baseline genera associated with remission at follow-up. (A) Log2 fold change is shown for Faecalibacterium as the only genus that is significantly (q < .1) enriched among remitters (R) compared to non-remitters (NR) after adjusting for age, sex and treatment group. (B) A random forest classifier was created with taxa from the baseline microbiota to predict remission at 3-month follow-up. The bar graph shows the 9 genera as features of the classifier and their contribution to the classifier accuracy presented as importance scores. Bolded y-axis labels: genera that are selected as the numerator features for the log-ratios in Panel E. (C) The receiver operating characteristic (ROC) curve of this classifier based on 5-fold cross-validation is shown. (D) ‘Rank plot’ showing differentials (estimated log-fold change) for individual genera (features) at baseline. Differentials were computed based on association with remission status by multinomial regression after adjusting for age, sex and treatment type. The x-axis numerically orders the ranks of each genus in the analysis. Lachnoclostridium is highlighted (blue) as the denominator (“reference frame”) and Roseburia, Agathobacter and Faecalibacterium are highlighted (red) as numerators for the log-ratio analysis in panel E. (E) “Sample plots” in boxplot mode showing selected log-ratios of samples in remitters (R) and non-remitters (NR) at baseline. The p-value for group difference was calculated using two-sample Welch’s t-test. n1: R sample size, n2: NR sample size.

We then used random forest analysis to construct a classifier for prediction of remission based on the baseline microbiota dataset which included 81 genera present in at least 50% of the samples. The final classifier included nine features with an AUC of the receiver operating characteristic curve of 0.857 [95% CI: 0.613 – 1.000] (Figure 2B and 2C). The relative contribution of the taxa to the classifier was expressed as an importance score, which measures the loss in accuracy of the classifier when that feature is permutated randomly.
In an attempt to circumvent the relative abundance-based computation biases, we utilized a rank-based differential analysis and a reference frame. Ranking the relative differentials of each genus allowed for identification of the taxa that changed the most relative to each other in remitters compared to non-remitters (Figure 2D). Consistent with the DESeq2 finding, Faecalibacterium was the highest ranked feature suggesting higher prevalence relative to other taxa in remitters. We explored the low-ranking features of the rank plot to select an ideal reference frame. Of the bottom 20% of the ranked features surveyed, Lachnoclostridium was the only denominator paired with Faecalibacterium (numerator) to demonstrate significant difference in log-ratios between remitter and non-remitter samples, and thus selected as a reference frame for subsequent log-ratio analyses (Figure 2D). The nine features of the random forest classifier for predicting remission were further examined as numerator features for log-ratio computations with Lachnoclostridium as the denominator feature. Notably, log-ratios of Faecalibaterium:Lachnoclostridium (Welch’s t-test p = .049; Cohen’s d = 1.45), Agathobacter:Lachnoclostridium (Welch’s t-test p = .025; Cohen’s d = 1.68) and Roseburia:Lachnoclostridium (Welch’s t-test p = .017; Cohen’s d = 1.86) were significantly higher in remitters compared to non-remitters in baseline samples (Figure 2 E). Other notable differences were lower log-ratios of UBA1819:Lachnoclostridium (Welch’s t-test p = .2; Cohen’s d = −.856) and Faecalitalea:Lachnoclostridium (Welch’s t-test p = .133; Cohen’s d = −2.47) and higher log-ratios of Sutteralla:Lachnoclostridium (Welch’s t-test p = .129; Cohen’s d = 3.05) in remitter samples compared to non-remitter samples, though statistical significance was not reached due to high rates of sample exclusions for having zero in the numerator and/or denominator of the log-ratio (Supplementary Figure S2).
Alterations in the microbiota post-treatment based on remission status
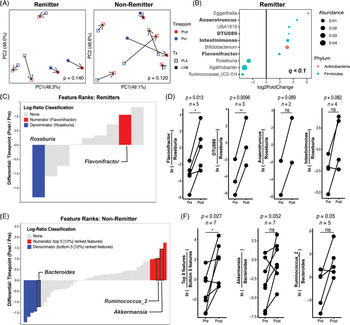
We then investigated whether clinical remission was associated with changes in the microbiota. There was no change in α-diversity metrics (data not shown). β-diversity analysis revealed no clear pattern in microbiota changes from baseline to post-intervention in remitters (p = .14) or in non-remitters (p = .12) (Figure 3 A). However, at the individual genus level, we observed several differentially abundant taxa from baseline to post-treatment in remitters using DESeq2 but no differentially abundant genera were identified in association with intervention among non-remitters using FDR correction threshold of q < 0.1 (Figure 3B).
Shift in microbial abundances from baseline to post-treatment. (A) Baseline to post-treatment microbial community shifts visualized by PCoA plots of microbial β-diversity metric based on Robust Aitchison PCA in remitters and non-remitters. P-value for group difference based on timepoint was calculated by Adonis adjusting for subject. Each symbol represents a sample with color corresponding to the timepoint and shape representing the treatment group. (B) Log2 fold changes are shown for genera with significant (q < .1) changes from baseline to post-treatment among remitters. DESeq2 models were adjusted for subject with positive Log2FC values indicating enrichment after treatment. Dot size is proportional to the relative abundance of the genus and color corresponds to the phylum. Bolded: genera that are selected as the numerator features for the log-ratios in Panel D. (C) “Rank plot” showing differentials for individual genera in the remitter subgroup computed based on association with timepoint, using baseline samples (Pre) as a reference category in the multinomial regression after adjusting for each subject. Roseburia is highlighted (blue) as the denominator feature (“reference frame”) and Flavonifractor is highlighted (red) as the numerator feature for the log-ratio analysis. (D) “Sample plots” showing selected log-ratios of samples by timepoint (Pre vs. Post) among remitters. The numerator features were selected from Panel B (bolded) and Roseburia was selected as the denominator feature. Each line corresponds to a different subject. The p-value for group differences were calculated using paired t-test. (E) “Rank plot” showing differentials for each feature in the non-remitter subgroup (analogous to the rank plot in panel C). Top 5 features (red) and bottom 5 features (blue) are highlighted as the numerator and the denominator, respectively. Individual features used for the log-ratio analysis in panel F were outlined (black) and labeled. (F) “Sample plots” showing the selected log-ratios of samples by timepoint (Pre vs Post) among non-remitters. Each line corresponds to a different subject. The p-value for group differences were calculated using paired t-test.

Differential ranking analysis of the longitudinal dataset in the remitter group revealed Roseburia as the lowest ranked taxa and Flavonifractor as a high-ranked taxa in association with timepoint, consistent with the DESeq2 findings that Flavonifractor was significantly increased while Roseburia was significantly decreased from baseline to post-treatment (Figure 3B and C). Individually testing the log-ratios of the genera identified by DESeq2 as the numerator features against Roseburia as the denominator feature demonstrated significant increases in Flavonifractor:Roseburia (paired t-test p = .013; Cohen’s d = 1.90) and DTU089:Roseburia (paired t-test p = .01; Cohen’s d = 5.84) from baseline samples to post-treatment samples in the remitter group. Other notable taxa changes included increase in Anaerotruncus:Roseburia (paired t-test p = .089; Cohen’s d = 5.02) and Intestinimonas:Roseburia (paired t-test p = .082; Cohen’s d = 1.29) from baseline to post-treatment with large effect sizes without reaching statistical significance (Figure 3D). In the non-remitter group, while no differentially abundant genera between baseline and post-treatment samples were identified by DESeq2, differential ranking analysis provided new insights into potentially differential genera. Initial survey of the top ranked features (∼12%) relative to the bottom ranked features (∼12%) in non-remitter samples revealed a significant increase in the log-ratios from baseline to post-treatment (Figure 3E and 3F, paired t-test p = .027; Cohen’s d = 1.1). Further interrogation of each individual feature from the top 5 and bottom 5 ranked features demonstrated non-significant increases in Akkermansia: Bacteroides (paired t-test p = .052; Cohen’s d = .915) and Ruminococcus_2:Bacteroides (paired t-test p = .05; Cohen’s d = 1.24) log-ratios from baseline to post-treatment samples in non-remitters.
Discussion
In this pilot RCT of LVM in GD, we assayed the 16S-rRNA based profile of fecal microbiota at baseline and correlated it with the treatment outcome after 12-week treatment with LVM or placebo. We found significant associations between the fecal microbial features of GD patients and clinical outcome of antidepressant treatment. This study adds to the growing literature demonstrating a role of microbiota-gut-brain interaction in depression. However, to our knowledge, this is the first study to directly investigate the gut microbiota status as a predictor of treatment outcomes in a cohort of patients with depression. We split the group into remitters and non-remitters at follow-up with remission defined as HAMD score of 6 or less. As there was no significant difference between LVM and placebo groups in the remission rate (50% vs. 37.5%, p = 1) and because we did not see a significant difference between LVM and placebo in the improvement of depressive symptoms in the parent pilot RCT (NCT02466958), we combined the LVM and placebo groups to increase the sample size and subsequently controlled for the treatment type. Therefore, the findings of this study are not specific to levomilnacipran effect but rather apply to generalized antidepressant effects of both placebo and active pharmacological agent that are typically found in drug trials.
At the microbial community level assessed by the baseline α-diversity and β-diversity measures, we did not see any differences in microbial community composition between remitters and non-remitters. At an individual taxa level, Faecalibacterium was significantly increased in remitters compared to non-remitters at baseline after controlling for the effects of age, sex and treatment type (LVM vs. placebo). Age was controlled for because remitters were significantly younger than non-remitters (p = .04) and age variable was the biggest contributor (R2 = 0.245) to the β-diversity differences at baseline compared to other variables (i.e. remission status (R2 = 0.177), treatment type (R2 = 0.096) and sex (R2 = 0.079) in the Adonis model). Sex was chosen because of a significant sex difference between remitters (0% female) and non-remitters (71.4% female). There is no consensus on sex-related efficacy differences in antidepressants treatment, but several studies demonstrated better efficacy in males than females for the tricyclic antidepressant (TCA) imipramine which affects both noradrenergic and serotonergic neurotransmission similar to LVM (Sramek et al., Reference Sramek, Murphy and Cutler2016). Faecalibacterium was also part of the features of a random forest classifier that predicted clinical outcome of remission with high accuracy. To further examine the other features of the random forest classifier, differential ranking and reference frame-based log-ratio analysis were utilized as a differential abundance testing methodology. The strength of this approach is not relying on the relative abundance information which can be quantitatively misleading in a compositional dataset when the absolute microbial load in each sample is unknown (Gloor et al., Reference Gloor, Macklaim, Pawlowsky-Glahn and Egozcue2017; Morton et al., Reference Morton2019). Faecalibacterium was again highlighted, along with Agathobacter and Roseburia, to be enriched in remitters relative to a reference frame, Lachnoclostridium. Lower abundance of Faecalibacterium has been associated with MDD in several case–control studies (Cheung et al., Reference Cheung, Goldenthal, Uhlemann, Mann, Miller and Sublette2019; Jiang et al., Reference Jiang2015; Kelly et al., Reference Kelly2016; Zheng et al., Reference Zheng2016). Additionally, in a cross-sectional study of a large population cohort, Faecalibacterium was associated with higher quality of life indicators (Valles-Colomer et al., Reference Valles-Colomer2019). Case–control microbiome studies do not establish causal link between the changes in bacterial taxa and the disease of interest. Our study provides a unique perspective on the gut microbiota changes as a potential risk factor for maintenance of depression through the prospective cohort study design.
The association between enrichment of Faecalibacterium in the gut microbiota and positive treatment response in GD is not surprising given the robust literature demonstrating various beneficial roles of Faecalibacerium in human health (Miquel et al., Reference Miquel2013). Faecalibacterium prausnitzii, the main member of the genus Faecalibacteirum, is one of the most abundant bacterial species found in the gut and the most important butyrate-producing bacteria in the human colon. F. prausnitzii has been shown to demonstrate anti-inflammatory effects both in vitro and in vivo using colitis model in mice (Sokol et al., Reference Sokol2008) and even promotes insulin sensitivity in individuals with metabolic syndrome (Vrieze et al., Reference Vrieze2012) which may be mediated by the production of short-chain fatty acids (SCFAs) such as butyrate. Adequate butyrate production levels are essential for gut integrity by improving the organization of tight junctions and stimulating the secretion of mucin to help prevent leaky gut (Guilloteau et al., Reference Guilloteau, Martin, Eeckhaut, Ducatelle, Zabielski and Van Immerseel2010) and also cause suppression of inflammation (Furusawa et al., Reference Furusawa2013). Decreased levels of F. prausnitzii is characteristic of dysbiosis associated with inflammatory bowel disease (Machiels et al., Reference Machiels2014; Sokol et al., Reference Sokol2008), colorectal cancer (Lopez-Siles et al., Reference Lopez-Siles2016), irritable bowel syndrome (Rajilic-Stojanovic et al., Reference Rajilic-Stojanovic2011), nonalcoholic fatty liver disease (Iino et al., Reference Iino2019), type 2 diabetes (Furet et al., Reference Furet2010) and, as described earlier, major depressive disorder (MDD) (Cheung et al., Reference Cheung, Goldenthal, Uhlemann, Mann, Miller and Sublette2019). Furthermore, there is a preclinical study demonstrating a direct anti-depressant and anti-anxiolytic effect of F. prausnitzii in rats and concurrent findings of increased SCFAs in the gut, increased anti-inflammatory cytokines such as interleukin-10 in the plasma, and prevention of corticosterone and proinflammatory signaling in response to chronic unpredictable mild stress (Hao et al., Reference Hao, Wang, Guo and Liu2019). As such, there is a growing body of literature demonstrating the potential therapeutic role of F. prausnitzii as a next-generation probiotic (Sokol et al., Reference Sokol2008). Our study highlights the possibility of translational potential of F. prausnitzii as an adjunct therapy in GD.
We also investigated if the clinical remission from GD was associated with longitudinal changes in the fecal microbiome. Comparing the microbiota composition between baseline and follow-up samples revealed no significant community level α or β diversity changes in association with remission status. However, at the genus level, several taxa demonstrated significant longitudinal changes in abundance within the remitter subgroup by DESeq2. Of these taxa, relative increases in Flavonifractor, DTU089, Anaerotruncus, and Intestinimonas were notable with Roseburia as a reference frame with the first two genera demonstrating statistically significant changes. These taxa do not appear to have a direct antidepressant effect on the host as they were not identified from any of the case–control studies comparing MDD patients and healthy controls (Cheung et al., Reference Cheung, Goldenthal, Uhlemann, Mann, Miller and Sublette2019; Jiang et al., Reference Jiang2015; Kelly et al., Reference Kelly2016; Zheng et al., Reference Zheng2016). These changes may represent, in part, secondary changes in the gut microbiota as a consequence of the resolution of depression which has a profound impact on the gut health through improved dietary intake, increased physical activities, sleep restoration, and abrogated HPA axis-mediated stress response. No significant genus level changes were found in the non-remitter subgroup by DESeq2 or reference frame-based log-ratio analyses of several candidate genera of high and/or low ranked differentials in association with longitudinal changes within the same subject.
It remains unclear how the gut microbiome and depression in aging are related. Over the life span, microbiota abundance and ratios change. The current theory is that a slow decline in immune system functioning (called “immunosenescence”) leads to increasing chronic inflammation (termed “inflammaging”), which then causes alterations in the gut microbiome (i.e. a decrease in diversity), over time (for comprehensive reviews, see (Vaiserman et al., Reference Vaiserman, Koliada and Marotta2017)). The human gut microbiota stays relatively stable after the first few early years of life, then starts to undergo substantial changes after 60–65 years; studies have shown reductions in certain beneficial microbes and increases in health-hindering microbes have been observed with aging (Rinninella et al., Reference Rinninella2019; Vaiserman et al., Reference Vaiserman, Koliada and Marotta2017; Vemuri et al., Reference Vemuri2018). Recently, it has been suggested that the gut microbiome represents not only a biomarker of aging, but even an aging clock based on taxonomic profiling and deep learning algorithms (Galkin et al., Reference Galkin2020). Microbes with the greatest effects on age prediction identified by the authors included Bacteroides spp., Bifidobacterium spp., Akkermansia muciniphia, Escherichia coli as well as pathogenic Campylobacter jejuni. The importance of understanding these aging-related changes in the gut microbiota lies in capturing the metabolic capacity in digesting and processing dietary nutrients, which strongly relies on the composition of gut microbiota (Hopkins et al., Reference Hopkins, Sharp and Macfarlane2002).
The limitations of our study include the small sample size, the high drop-out rates in the LVM group and the subsequent lack of treatment-related clinical results. The parent clinical trial involved strict screening criteria to ascertain patient safety for magnetic resonance imaging, which limited the sample size significantly (Krause-Sorio et al., Reference Krause-Sorio2020). Larger studies investigating the microbiota as a response predictor of antidepressant treatment in GD are needed in order to confirm our findings and potentially identify additional candidate microbial taxa that contribute to treatment outcomes in GD by increasing the power. Additionally, comparing the microbiota composition between GD patients and healthy older adults will provide more insight into the role of dysbiosis in this difficult-to-treat population.
This study, to our knowledge, is the first study to examine the fecal microbiome status as a biomarker for depression treatment outcomes in any age group. Results from this exploratory study make important contributions to the field by offering the following key prospects and future innovation possibilities: 1) the prospect of precision medicine strategies that incorporate the microbiome to predict who will respond to antidepressant treatment or which antidepressant will be effective for an individual patient; 2) support for particular microbial taxa as mediators of depression and as potential adjunct therapy for depression, a.k.a. “psychobiotics”, based on prospective longitudinal data. In future antidepressant trials, fecal microbiome may need to be included as routine baseline characteristics as a mediator of treatment outcomes.
Conflict of interest
The authors have no conflicts of interest to disclose.
Description of authors’ roles
S.M.L. conducted microbiome data analysis and wrote the manuscript. T.S.D. and J.P.J. contributed to data analysis and provided critical review of the manuscript. V.L. conducted sample processing and sequence data preparation. P.S. contributed to statistical analysis. B.K.S. and M.M.M. contributed to data collection and contributed to writing the manuscript. T.D. assisted with writing. Y.A. contributed to carrying out the parent RCT. H.L. designed and was responsible for the study.
Acknowledgements
This research was funded by the Forest research Institute LVM-IT-02/Allergan Fetzima Study IIT-10018; NCT02466958. S.M.L. was supported by the UCLA training grant T32 DA024635. J.P.J. was supported by VA Career Development Award IK2CX001717.
Supplementary material
To view supplementary material for this article, please visit https://doi.org/10.1017/S1041610221000120